Article

Analysis of the Winter AOD Trends over Iran from 2000 to 2020 and Associated Meteorological Effects

1
Key Laboratory of Land Surface Pattern and Simulation, Institute of Geographic Sciences and Natural Resources Research, Chinese Academy of Sciences, Beijing 100045, China
2
Climate and Atmosphere Research Center, The Cyprus Institute, Nicosia 2121, Cyprus
3
Institute for Environmental Research and Sustainable Development, National Observatory of Athens, Palaia Penteli, 15236 Athens, Greece
*
Author to whom correspondence should be addressed.
Remote Sens. 2023, 15(4), 905; https://doi.org/10.3390/rs15040905
Submission received: 12 December 2022 / Revised: 25 January 2023 / Accepted: 3 February 2023 / Published: 6 February 2023

Abstract

:
High aerosol levels pose severe air pollution and climate change challenges in Iran. Although regional aerosol optical depth (AOD) trends have been analyzed during the dusty season over Iran, the specific factors that are driving the spatio-temporal variations in winter AOD and the influence of meteorological dynamics on winter AOD trends remain unclear. This study analyzes the long-term AOD trends over Iran in winter during the period 2000–2020 using the updated Modern-Era Retrospective Analysis for Research and Applications version 2 (MERRA-2) and the Moderate Resolution Imaging Spectroradiometer (MODIS) datasets. Our results showed that the winter AOD exhibited a significant upward trend during the period 2000–2010 followed by a significant decrease during the period 2010–2018. We found that the winter AOD trends are important over this arid region due to multiple meteorological mechanisms which also affect the following spring/summer dusty period. Ground-based observations from Aerosol Robotic Network data (AERONET) in the Middle East region display trends comparable to those of both MERRA-2 and MODIS and indicated that aeolian dust and the meteorological dynamics associated with it play a central role in winter AOD changes. Furthermore, this study indicated that a significant downward trend in winter sea level pressure (SLP) during the early period (2000–2010) induced hot and dry winds which originated in the desert regions in Iraq and Arabia and blew toward Iran, reducing relative humidity (RH) and raising the temperature and thus promoting soil drying and dust AOD accumulation. In contrast, a significant increase in winter SLP during the late period (2010–2018) induced cold and wet winds from northwestern regions which increased RH and lowered the temperature, thus reducing dust AOD. This suggests that the changes in AOD over Iran are highly influenced by seasonal meteorological variabilities. These results also highlight the importance of examining wintertime climatic variations and their effects on the dust aerosol changes over the Middle East.

1. Introduction

Iran is characterized by an arid and semi-arid climate and is considered a hot-spot region in terms of climate change and global warming [1,2,3]. The country is highly affected by local and regional dust storms throughout the year [4,5,6,7], and several studies in the past have shown that desert-dust aerosols are pervasive throughout the country [8,9,10,11]. Aerosols are important components influencing the regional and global earth–atmosphere system through the direct and indirect effects of absorbing and scattering solar radiation and affecting cloud micro-physical processes, respectively [12]. Aerosol optical depth (AOD) is an important parameter for the quantification and long-term trend analysis of aerosols from regional to global scales [13,14,15,16]. It is a basic property of aerosols related to their atmospheric columnar amount and is highly related to the impact of aerosols on climate change [17,18,19,20,21].
Various satellites and reanalysis datasets such as the Moderate Resolution Imaging Spectroradiometer (MODIS) and the Modern-Era Retrospective Analysis for Research and Applications version 2 (MERRA-2) datasets provide continuous aerosol data globally. By studying such data, researchers aim to understand atmospheric processes and examine long-term spatio-temporal evolution and aerosol trends [22,23]. Over the Middle East region, numerous validation studies have reported good agreement between ground-based observation data (AERONET) and MERRA-2 and/or MODIS AODs [11,21,24,25].
AOD products have been widely used to evaluate the long-term trends of annual and seasonal AODs at different temporal and spatial scales [11,26,27,28,29,30,31]. Previous studies have noted an upward AOD trend over Iran and the Eastern Mediterranean–Middle East (EMME) region using AOD datasets from MERRA-2 and MODIS for the period between 2000 and 2010 [18,21]. Similarly, Klingmüller et al. [32] also noted a positive AOD trend from MODIS observations over the Arabian Peninsula during the period 2001–2012. In contrast, downward AOD trends over the Middle East region were reported during the past decade (after 2010–2012) due to weakening in dust activity after the high peak during the period 2008–2012 [18,21].
Apart from the effects of aerosols on the regional and global climate, climate perturbations, in turn, affect the loading, distribution and composition of aerosols through changes in various meteorological variables such as air temperature, humidity, precipitation, and wind that highly affect dust emission, accumulation, and transport [33,34,35,36]. In addition, natural emissions and urban/industrial emissions driven by meteorological conditions play a major role in regional AOD variations [24,37]. Meteorological factors such as soil moisture and wind speed are primarily responsible for changing dust activity over natural mineral sources, such as the Iraqi plains, northern Arabian Peninsula, and the Sistan Basin, that highly affect the AOD variations in Iran [32,38]. Changes in soil moisture and strong Shamal wind events play a significant role in modulating dust activity over the Middle East [39,40]. Shaheen et al. [17] showed that the changes in AOD trends over the EMME region were mostly a result of variations in dust climatology, which are maximized during spring and summer. While various studies have investigated the variability of regional AOD over Iran during the dusty season (spring and summer), our understanding of winter AOD trends remains rather unclear since researches have focused more on periods with high dust-aerosol loadings. The main reasons behind the reversal of the winter AOD trend over the past decade were unclear and needed to be understood and quantified, and the roles of meteorological parameters as influencing factors on winter AOD trends have not yet been analyzed.
Therefore, this study intends to understand the main reasons behind these trends in AOD over Iran, focusing on the winter period, which has the lowest AODs and dust activity, but which also has intense changes in atmospheric dynamics and regional meteorology which may affect the dust AOD distribution significantly. Considering the importance of anthropogenic winter aerosols and natural emissions driven by meteorological conditions on shifts in local AOD trends, the study examines the meteorological dynamics that contribute the most to the reversal of the winter AOD variability trend over Iran and the Middle East, i.e., from an increasing trend during the 2000s to a decreasing trend during the 2010s. The current paper is organized as follows. Section 2 describes the dataset used. Observed aerosol trends are analyzed and discussed in Section 3 as well as the links between AOD changes and meteorological variables, including sea level pressure, surface wind speed, surface air temperature, precipitation, surface relative humidity, and soil moisture. Our conclusions are summarized in Section 4.

2. Dataset and Methods
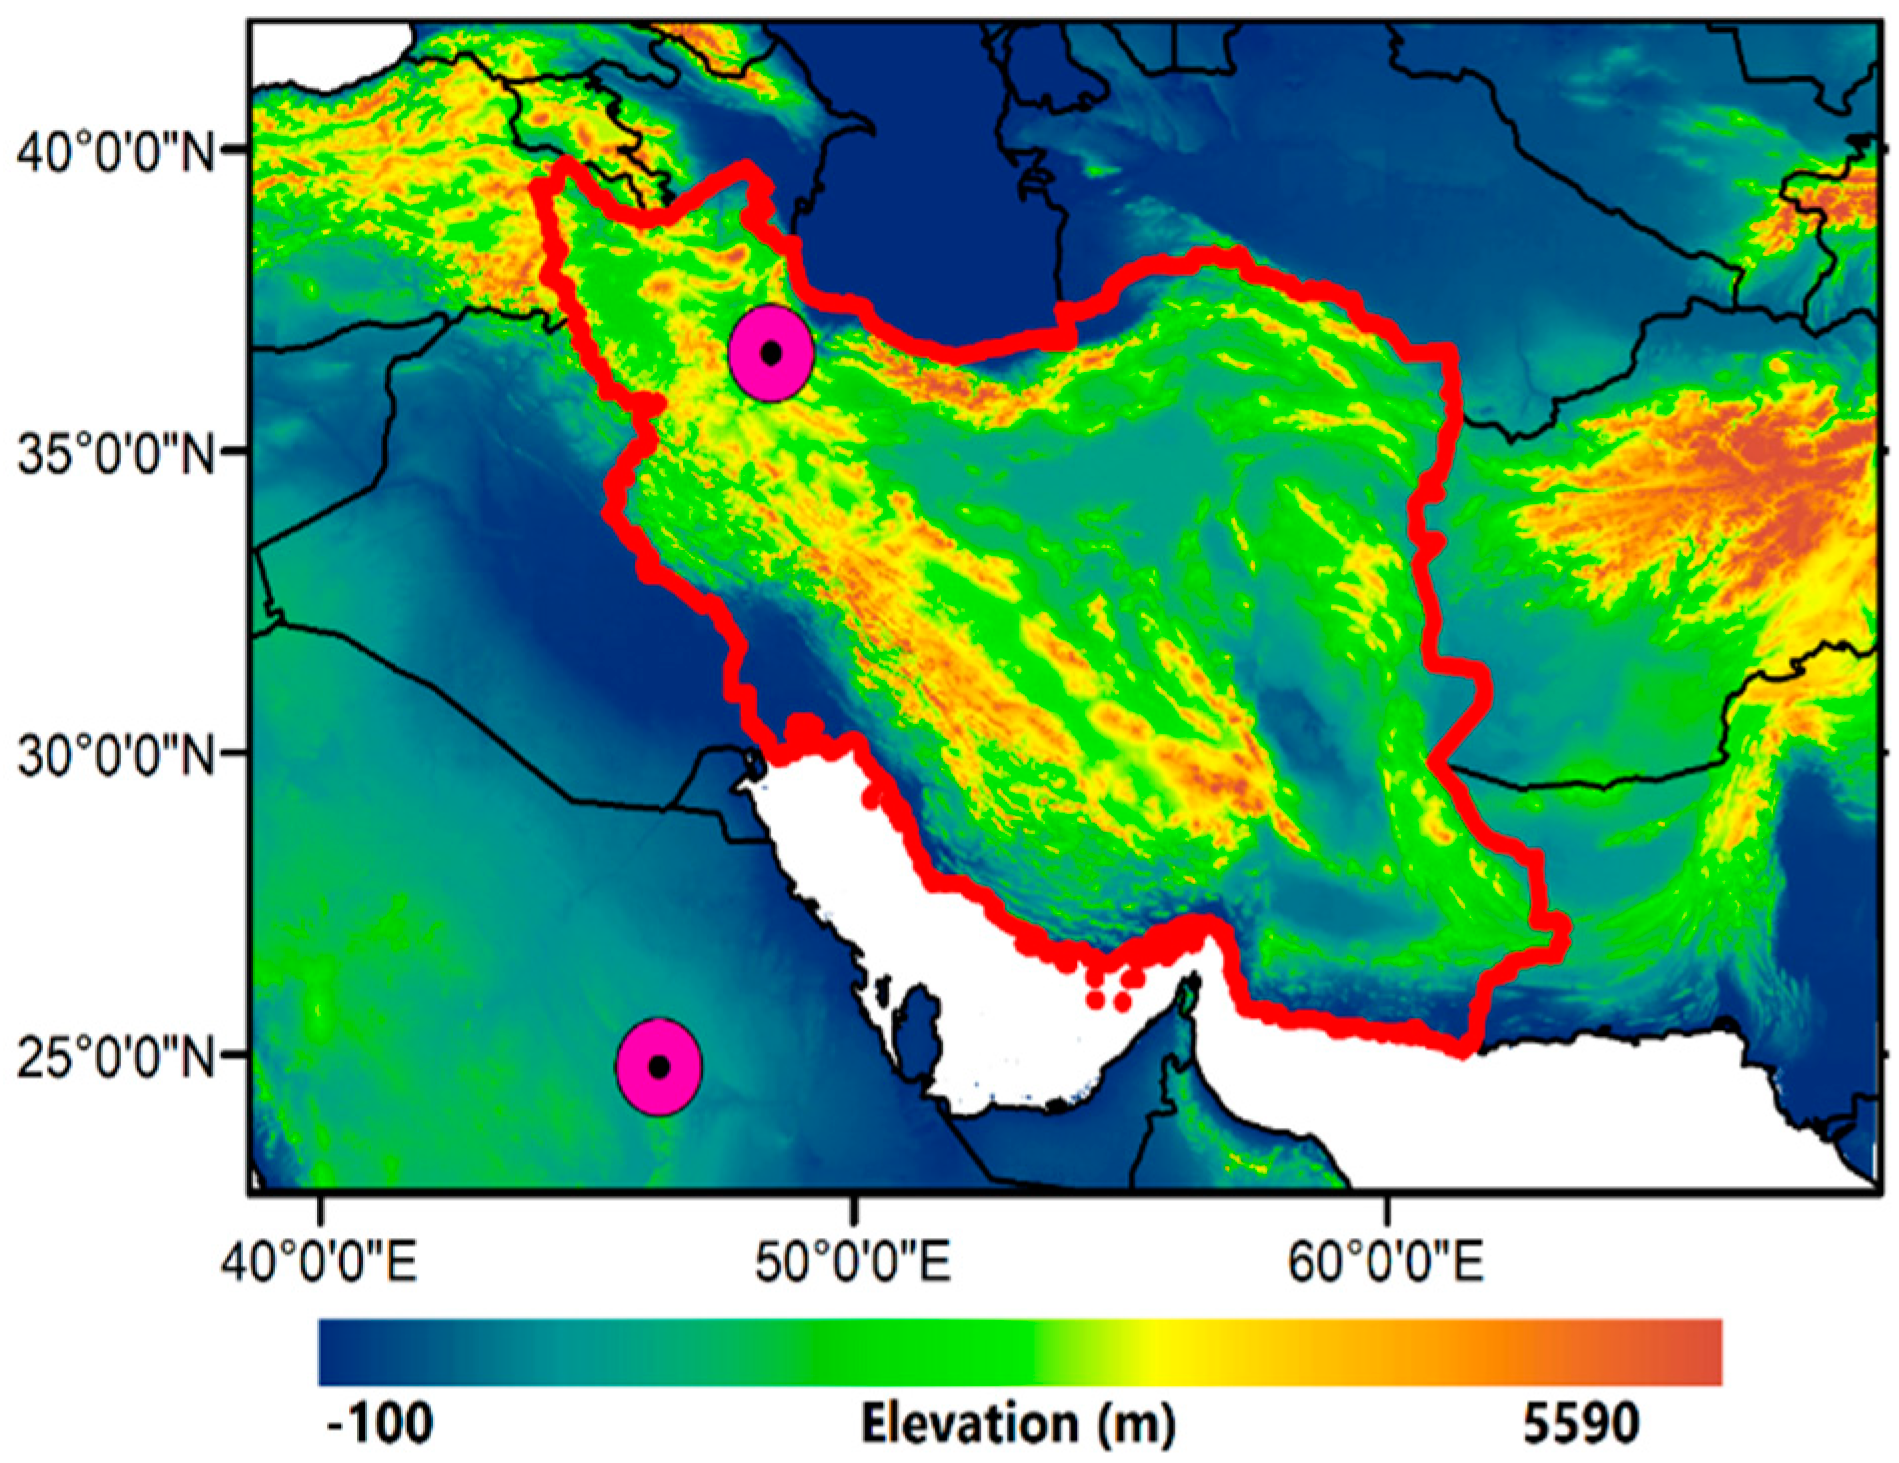
2.1. Study Area

Iran lies in Southwest Asia between latitudes 25°N and 40°N and longitudes 44°E and 61°E (Figure 1), and it can be divided into areas with different types of climate which are influenced by the country’s location between the arid/semi-arid and the humid subtropical climate zones of the Arabian deserts and the Eastern Mediterranean–Caspian Sea region, respectively. In recent years, the frequency and intensity of dust events have increased significantly in Iran, especially in the western part, which has a hot desert climate [41,42], while the eastern and southeastern parts faced a large increase in dust activity due to a prolonged drought during the period 2000–2003 [43,44,45].

2.2. Aerosol Data

By utilizing the Goddard Earth Observing System version 5 (GEOS-5) [46], NASA’s Global Modeling Assimilation Office gives the most recent versions of reanalysis datasets for the atmosphere via MERRA-2 [47]. MERRA-2 is the first satellite reanalysis dataset comprised of data concerning land surface processes, ocean movements, and atmospheric composition. Numerous meteorological and aerosol products are provided by MERRA-2 [21]. By using distinct observation sources, the aerosol product integrates variations of AOD datasets into the GOCART (Goddard Chemistry, Aerosol, Radiation, and Transport) model [48]. AOD data from different aerosol types, which include sea salt, organic and black carbon, dust, and sulfates, are also provided via MERRA-2 reanalysis [49]. Moreover, MERRA-2 assimilates a series of AOD observations, retrieved from the Advanced Very High-Resolution Radiometer (AVHRR), MODIS (onboard both the Terra and Aqua satellites), and Multi-angle Imaging Spectroradiometer (MISR), in addition to ground-based AERONET observations [50,51,52,53]. The reanalysis biases and errors may be changed during the studied period when new sensors come in or drop out. Since this paper is a trend analysis, one implicit assumption here is that the reanalysis data are equally reliable at all points in time when in fact it is not known how the reliability of the reanalysis changes over time. More details about MERRA-2 data assimilation, uncertainties, and applications can be read elsewhere [46,47], including our previous studies [18,21,28]. A previous study used MERRA-2 aerosol data to analyze long-term AOD and dust trends over Iran and the Middle East due to satisfactory agreement between MERRA-2, MODIS, and AERONET AODs [18]. For the analysis of the winter AOD trends over Iran, monthly mean AOD550, Ångström exponent (AE470–870), and dust concentration data from the MERRA-2 reanalysis are used in the present study (Table 1).
The MODIS sensor on NASA’s TERRA satellite, which has a swath width of 2330 km, observes the earth on near-daily basis, providing atmospheric and cloud parameters since 2000 at varying wavelength ranges consisting of 36 spectral bands from near-UV to infrared [54]. In this study, the level 3 monthly AOD aerosol product (MOD08) [51] at 550 nm and at a spatial resolution of 1° × 1° (C06.1) was used (Table 1). It covers the whole Iranian territory and the surrounding regions. The AOD550 data series refers to the combined Dark Target and Deep Blue (DTDB) product. The average root mean square error (RMSE) of the monthly mean AOD values derived from the level 3 Terra-MODIS observations has been estimated to be about 0.075, while the error in the MODIS AODs related to AERONET is ±0.05 ± 0.15 × AOD(AERONET) [51,55].
In addition, CIMEL sun-photometers were used to obtain ground-based aerosol observations at two AERONET sites over the Middle East with long time series. CIMEL is capable of observing solar irradiances at different wavelengths, with a time step of 15 min, a full field-of-view (FOV) of 100 km, and an AOD retrieval error of ±0.01 to 0.02 [50]. AERONET also records the Ångström exponent (AE440–870), fine mode fraction (FMF500), and AOD products via direct-beam and almucantar solar irradiance measurements [50]. In this study, monthly mean (level 2 and version 3) AOD550, fine mode fraction (FMF500), and AE440–870 data from two AERONET sites in the Middle East (Solar Village, Saudi Arabia and IABAS, Iran) were used in order to examine the long-term trends in aerosol loading and the relative contribution of fine and coarse particles (Table 1, Figure 1).

2.3. Meteorological Data

By joining observations into global fields utilizing a modern 4-Dvar assimilation scheme, the European Center for Medium-Range Weather Forecasts (ECMWF) provides up to date meteorological reanalysis data. In contrast to earlier reanalysis versions, ERA5 is the latest version with numerous improvements based on the integrated forecasting system (IFS) Cy41r2 [56,57]. ERA5 provides meteorological data for a wide number of atmospheric and land surface parameters at a spatial resolution of 30 km and 137 levels spanning from the surface to 0.01 hPa, and with a time step of one hour. In the current work, several monthly meteorological data (soil moisture (SM), total precipitation (TP), relative humidity (RH), surface temperature (TM), sea level pressure (SLP), and wind speed (WS)) from the ERA5 global reanalysis were used to assess their influence on long-term winter AOD trends over Iran during the period 2000–2018 (Table 1). In addition to the aerosol assimilation in MERRA-2 retrievals, the meteorological assimilation also changes over time, which may result in changes in the quality of modeled dust emission and aerosol aging and transport during the studied period.

2.4. Analysis of the Winter Aerosol and Meteorological Trends

This study provides a comprehensive investigation of the winter AOD trends over Iran during the past two decades. The whole period was divided in two sub-periods (2000–2010 and 2010–2020) characterized by contrasting trends. Since only the winter season is used in the trend analysis, the anomalies of the monthly AODs were computed as deseasonalized monthly anomalies, which were defined as the difference between the monthly AOD550 and the overall monthly average AOD550. The least-squares linear regression method was used for the computation of the long-term trends [21,58]. Due to gaps in satellite retrievals from MODIS, at least 18 daily AOD data were required in each month to calculate the monthly mean before the deseasonalization and AOD regression analysis. To analyze the long-term trend of the meteorological parameters during winter, the same method as for the AOD trend was used. The statistical significance of the AOD and the meteorological trends were tested using a Student’s t-test at a 95% confidence level. Trend analysis was performed on the spatial-averaged AOD and meteorological data, while pixel by pixel correlations were also performed in order to examine the effect of each meteorological parameter on AOD variations and trends. Using Pearson’s correlation coefficient (R), the strength of the relationship between AOD and meteorological parameters was computed to better understand the effects of winter meteorological changes on AOD [24,59]. We should point out that the MERRA-2 and MODIS datasets showed rather stable trends during the period 2018–2020. Therefore, to better compare and explain the results of the trend analysis, two shorter periods of 2000–2010 and 2010–2018 were considered and examined separately.

3. Results and Discussion
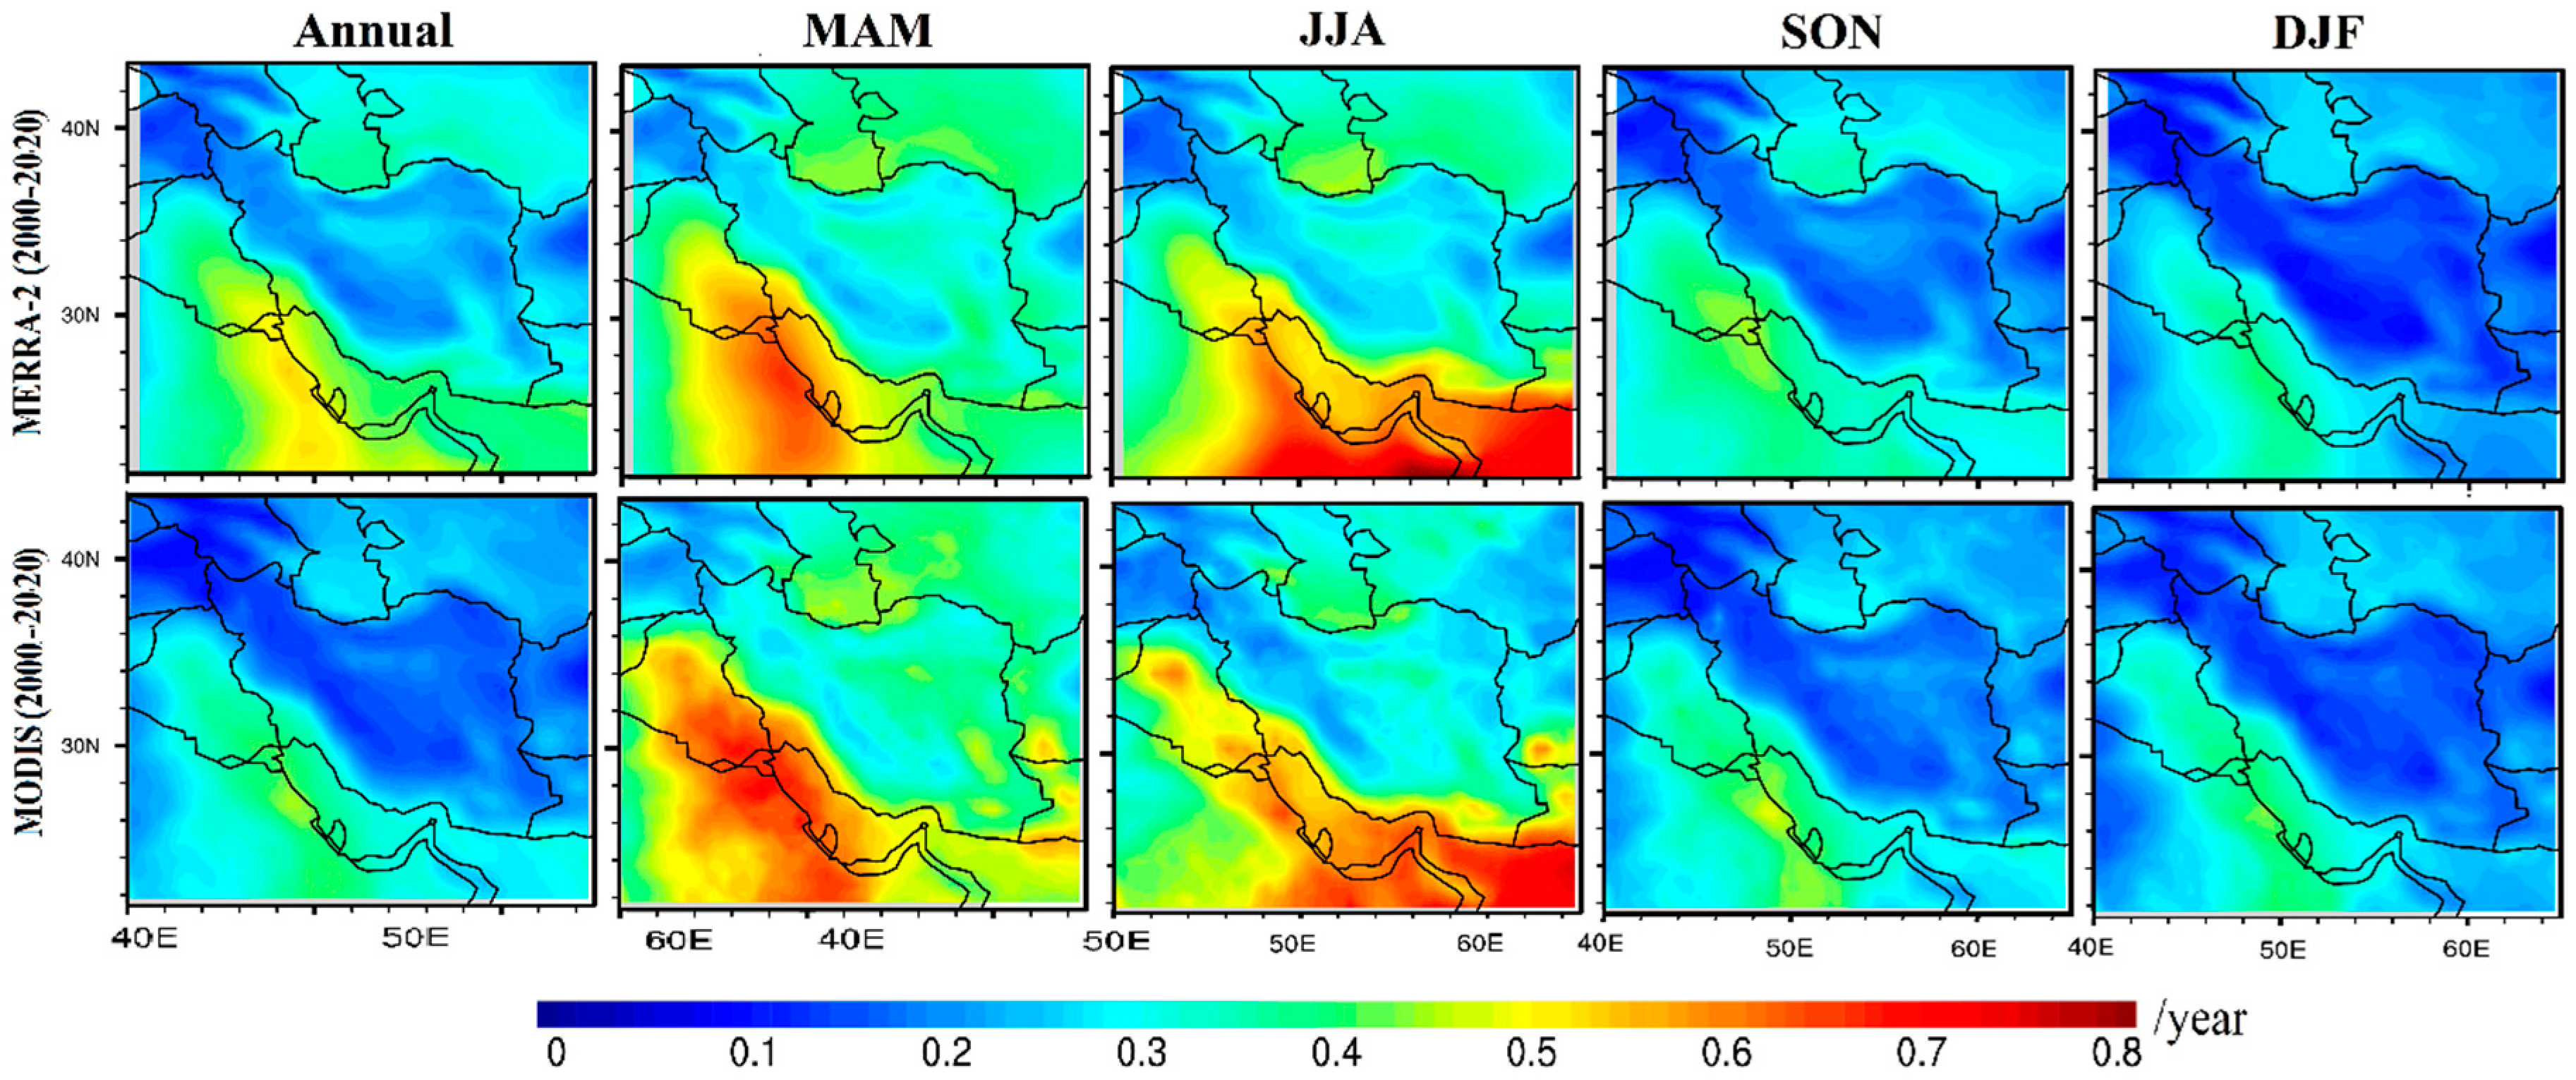
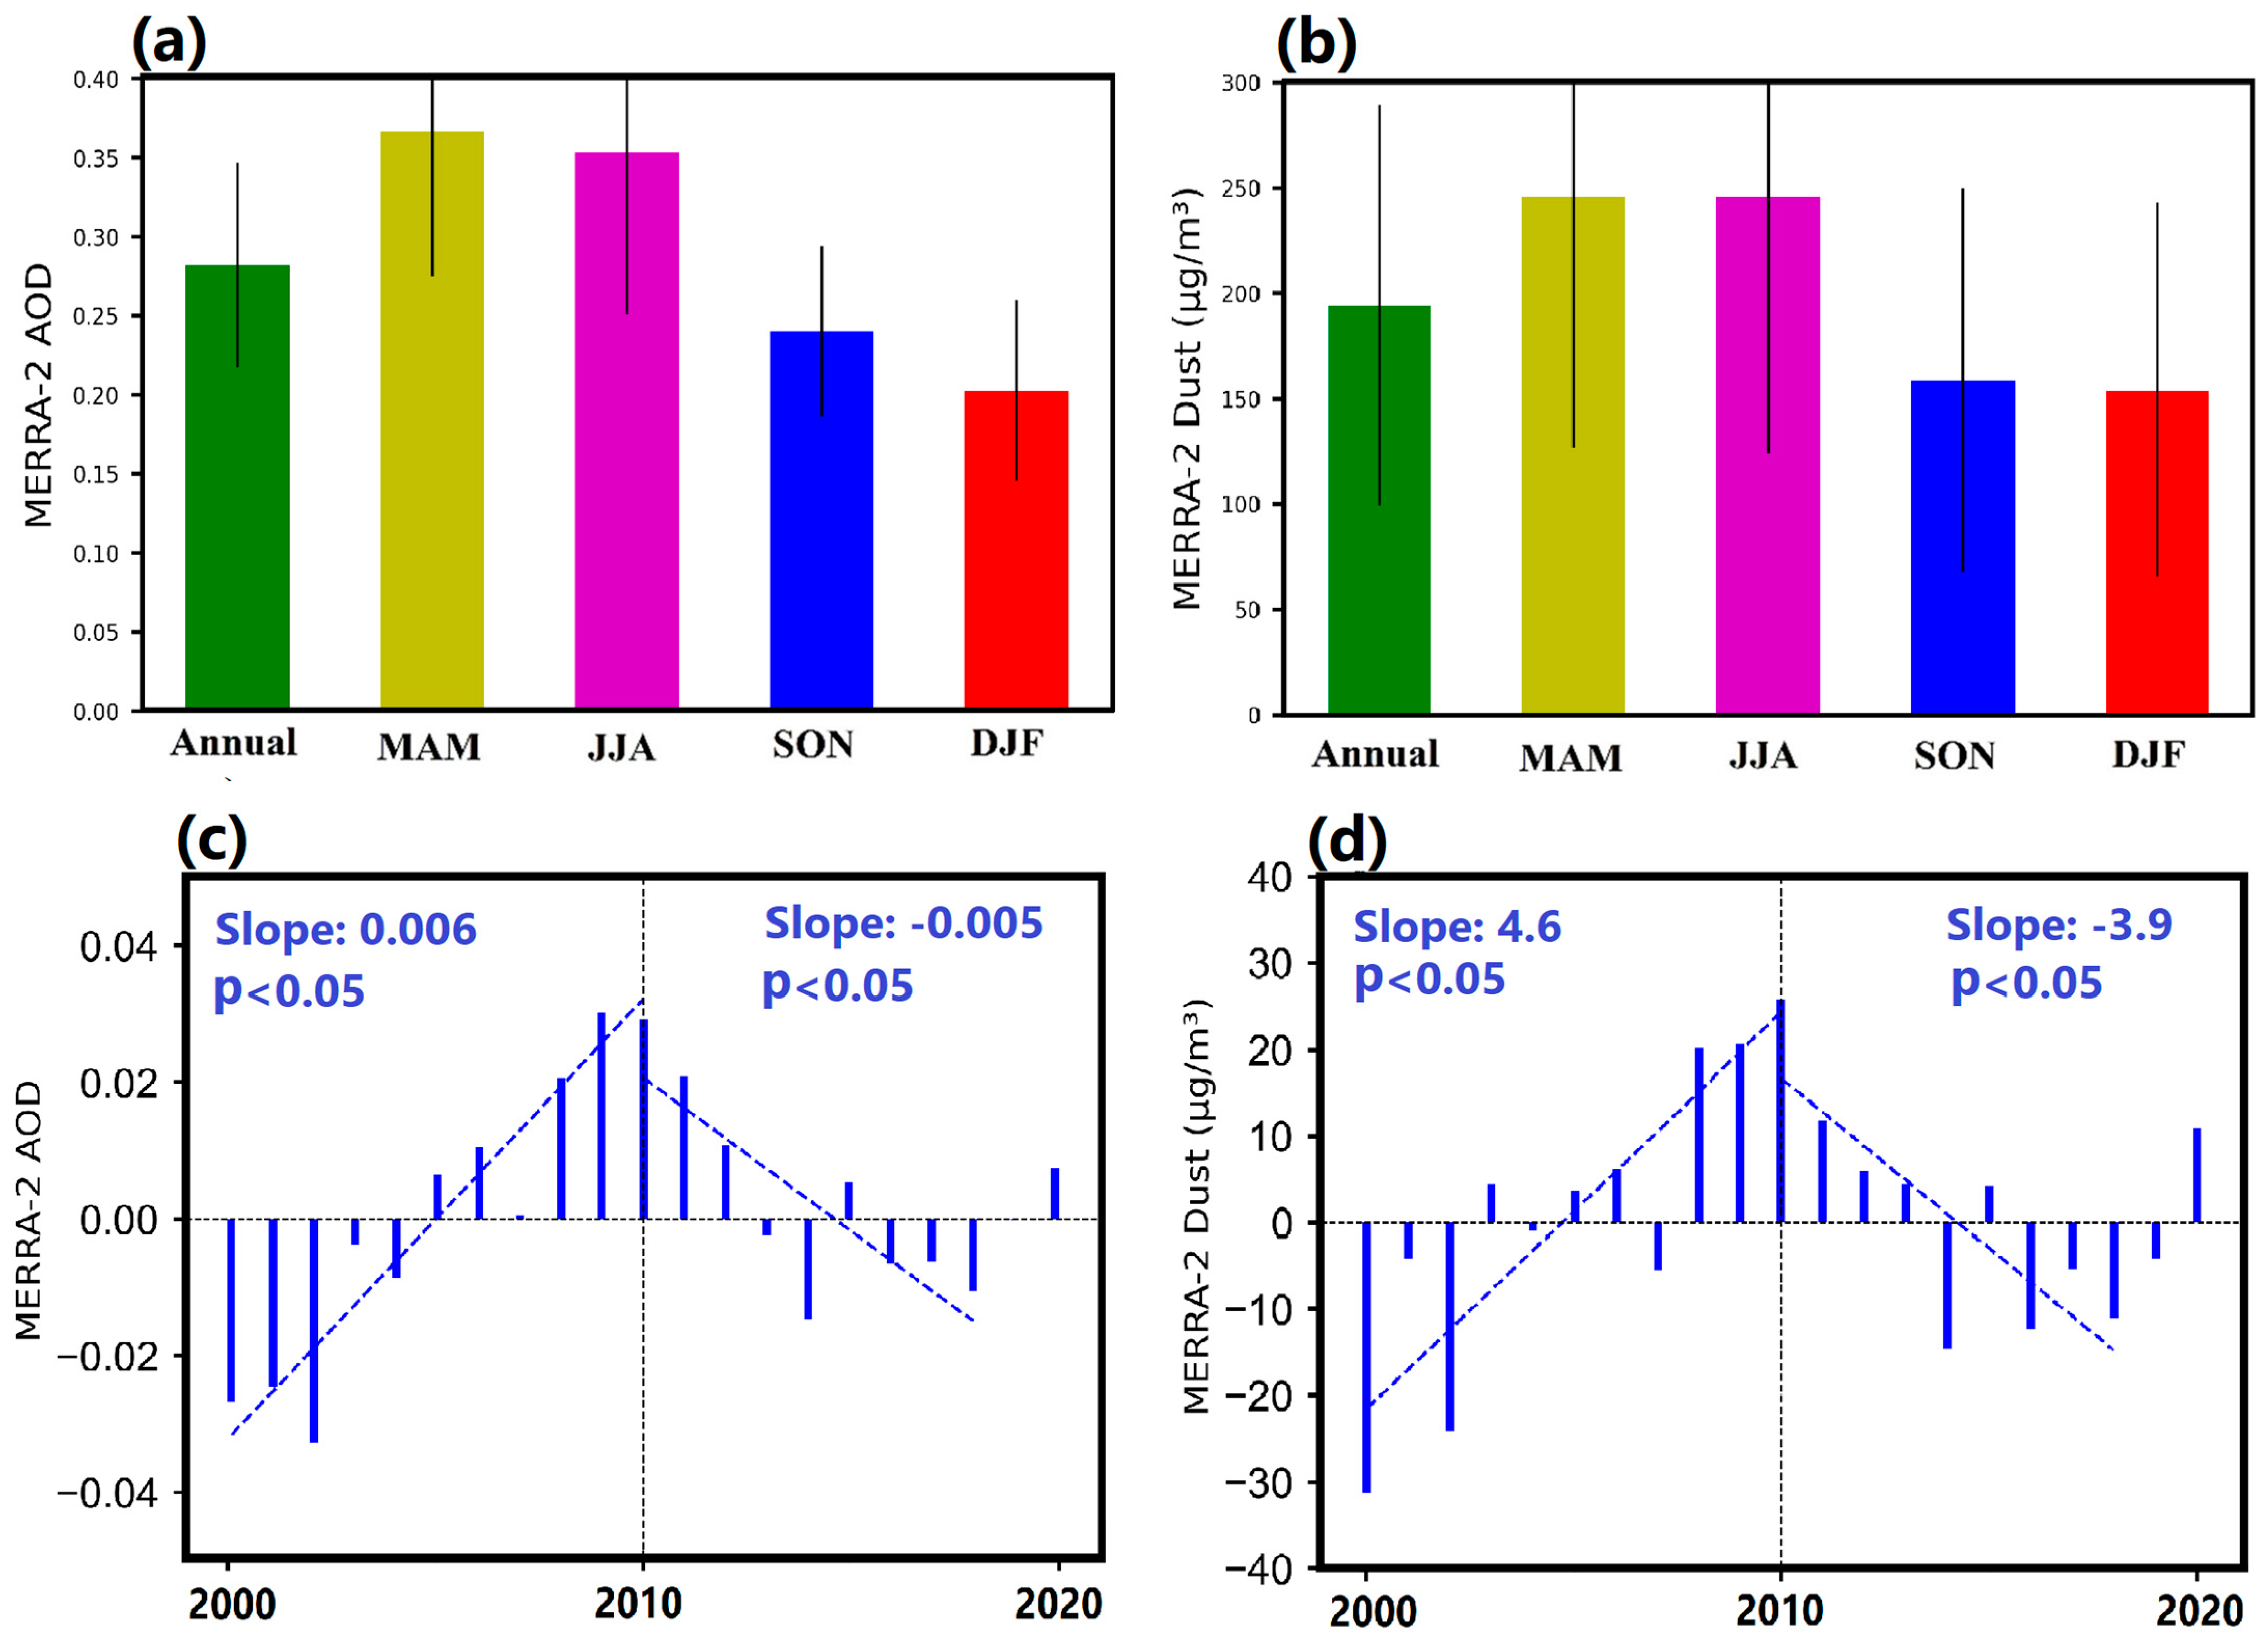
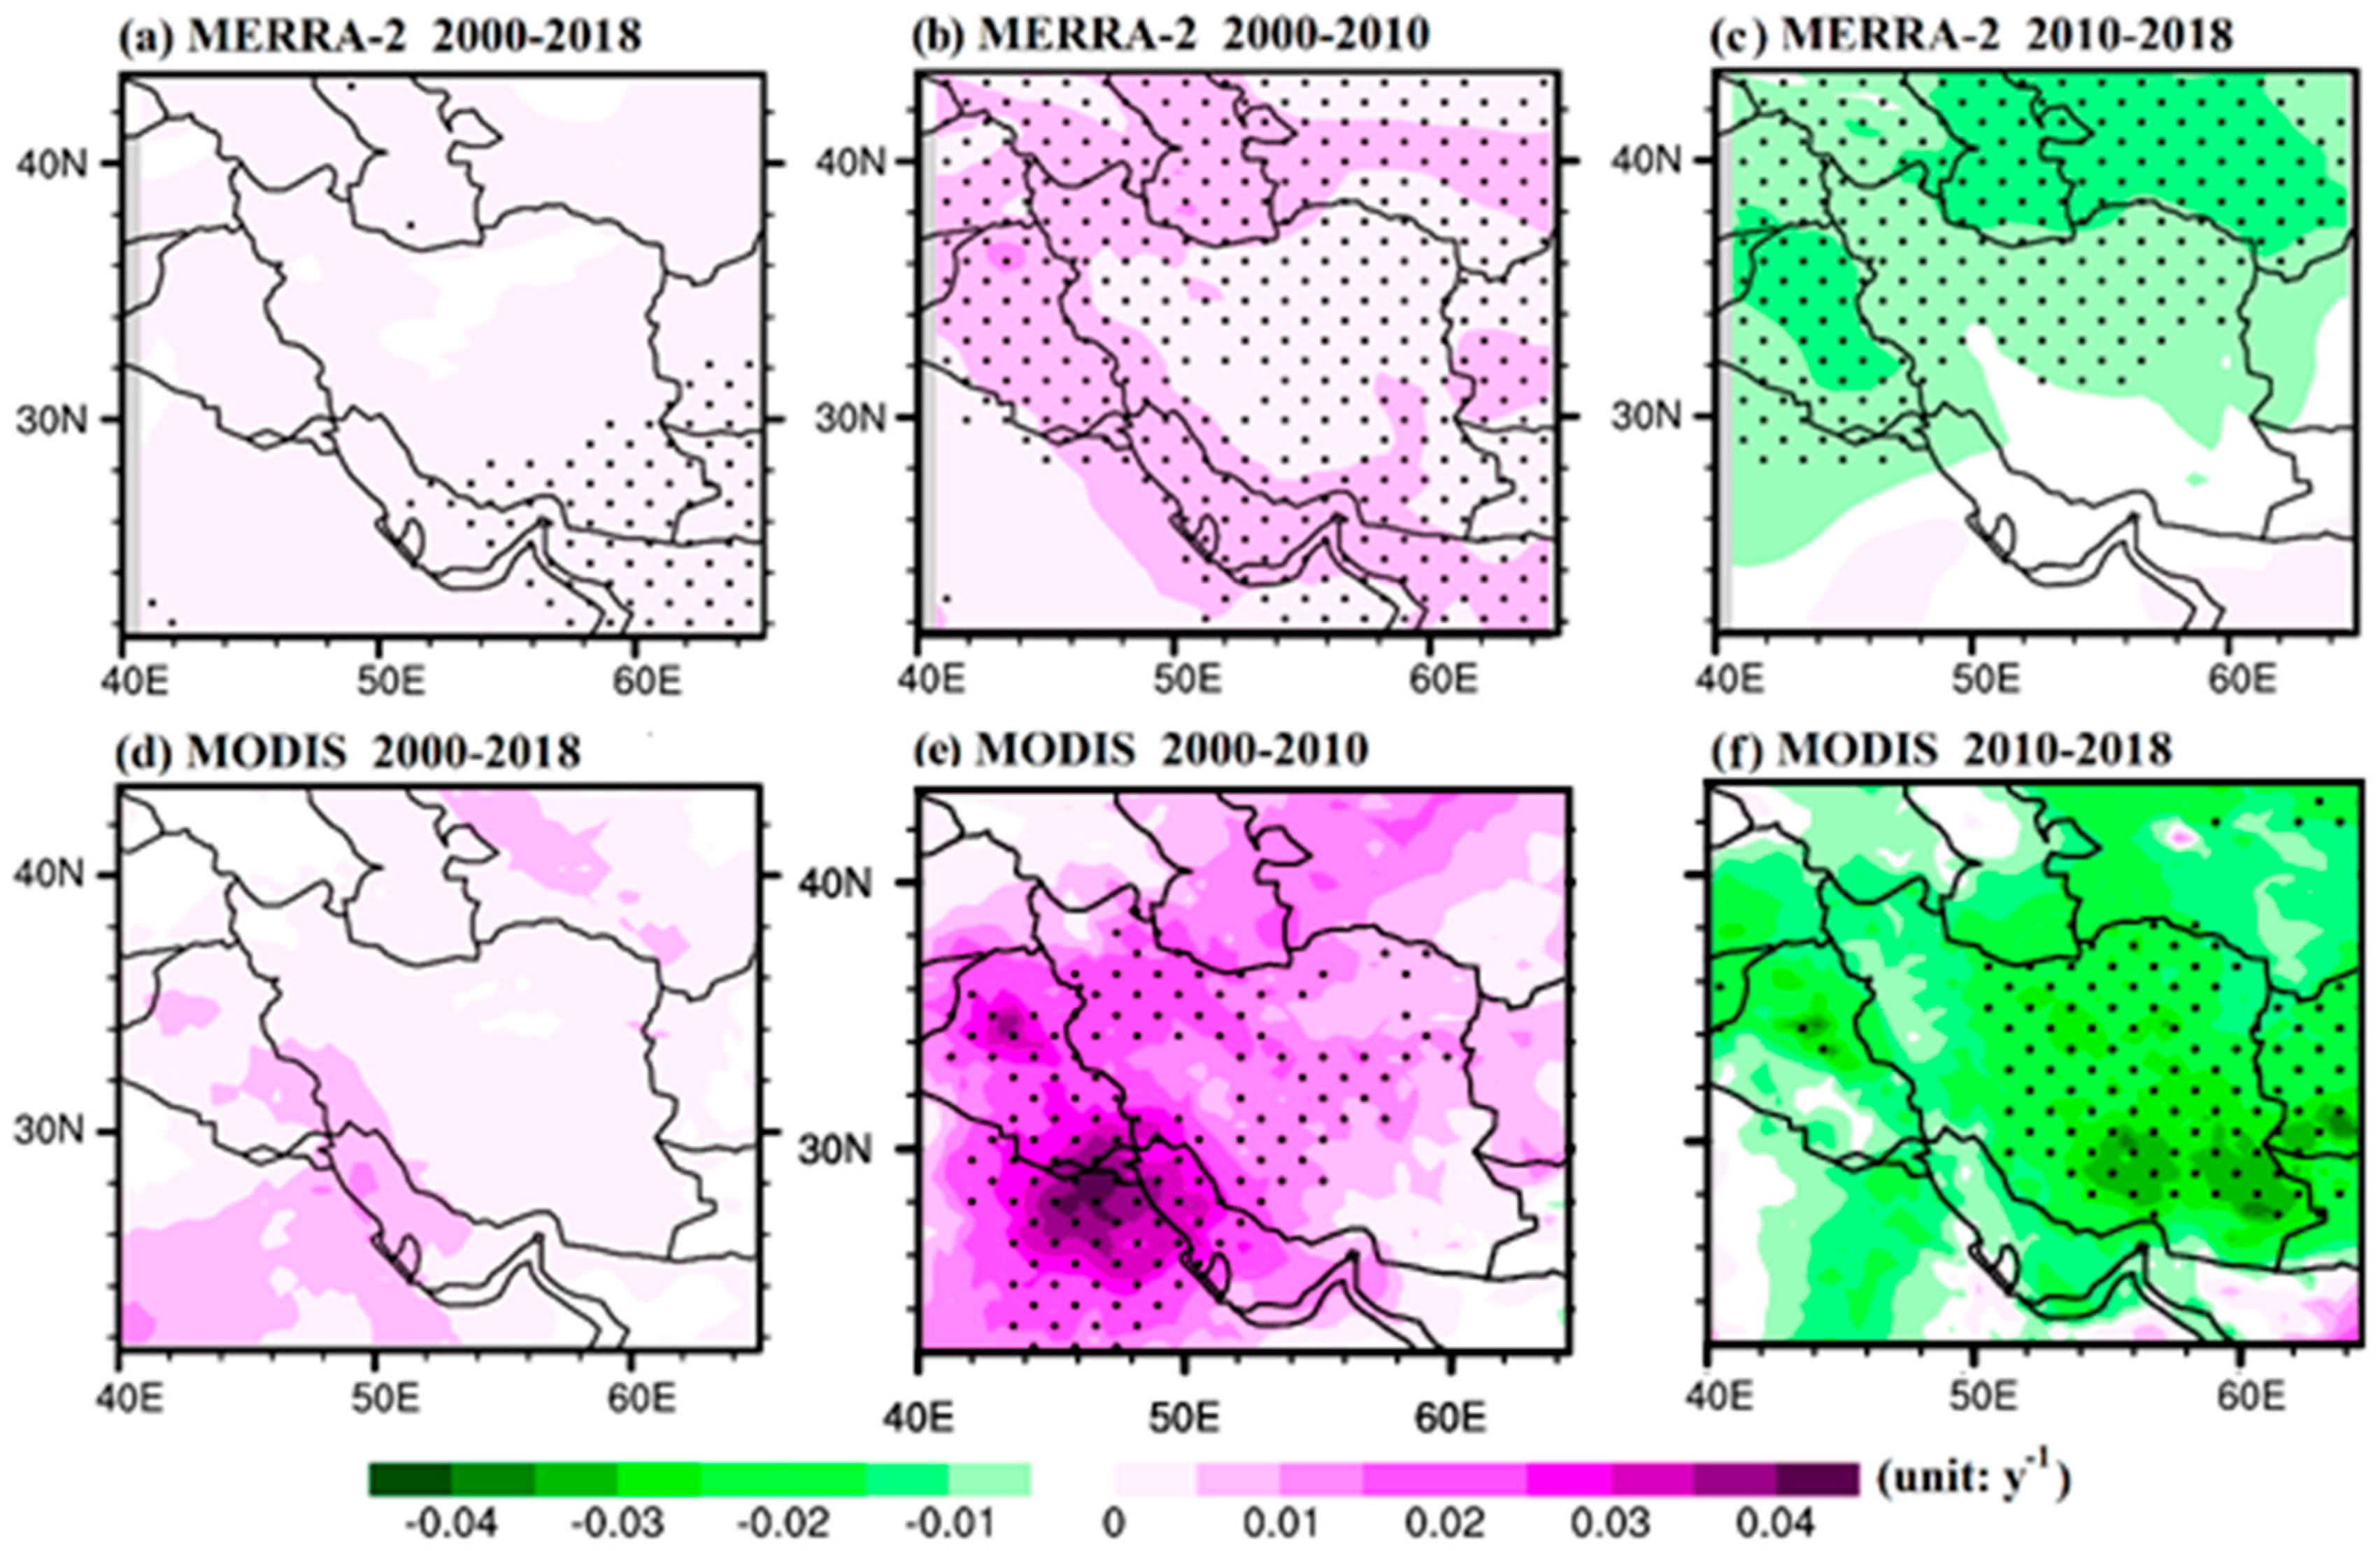
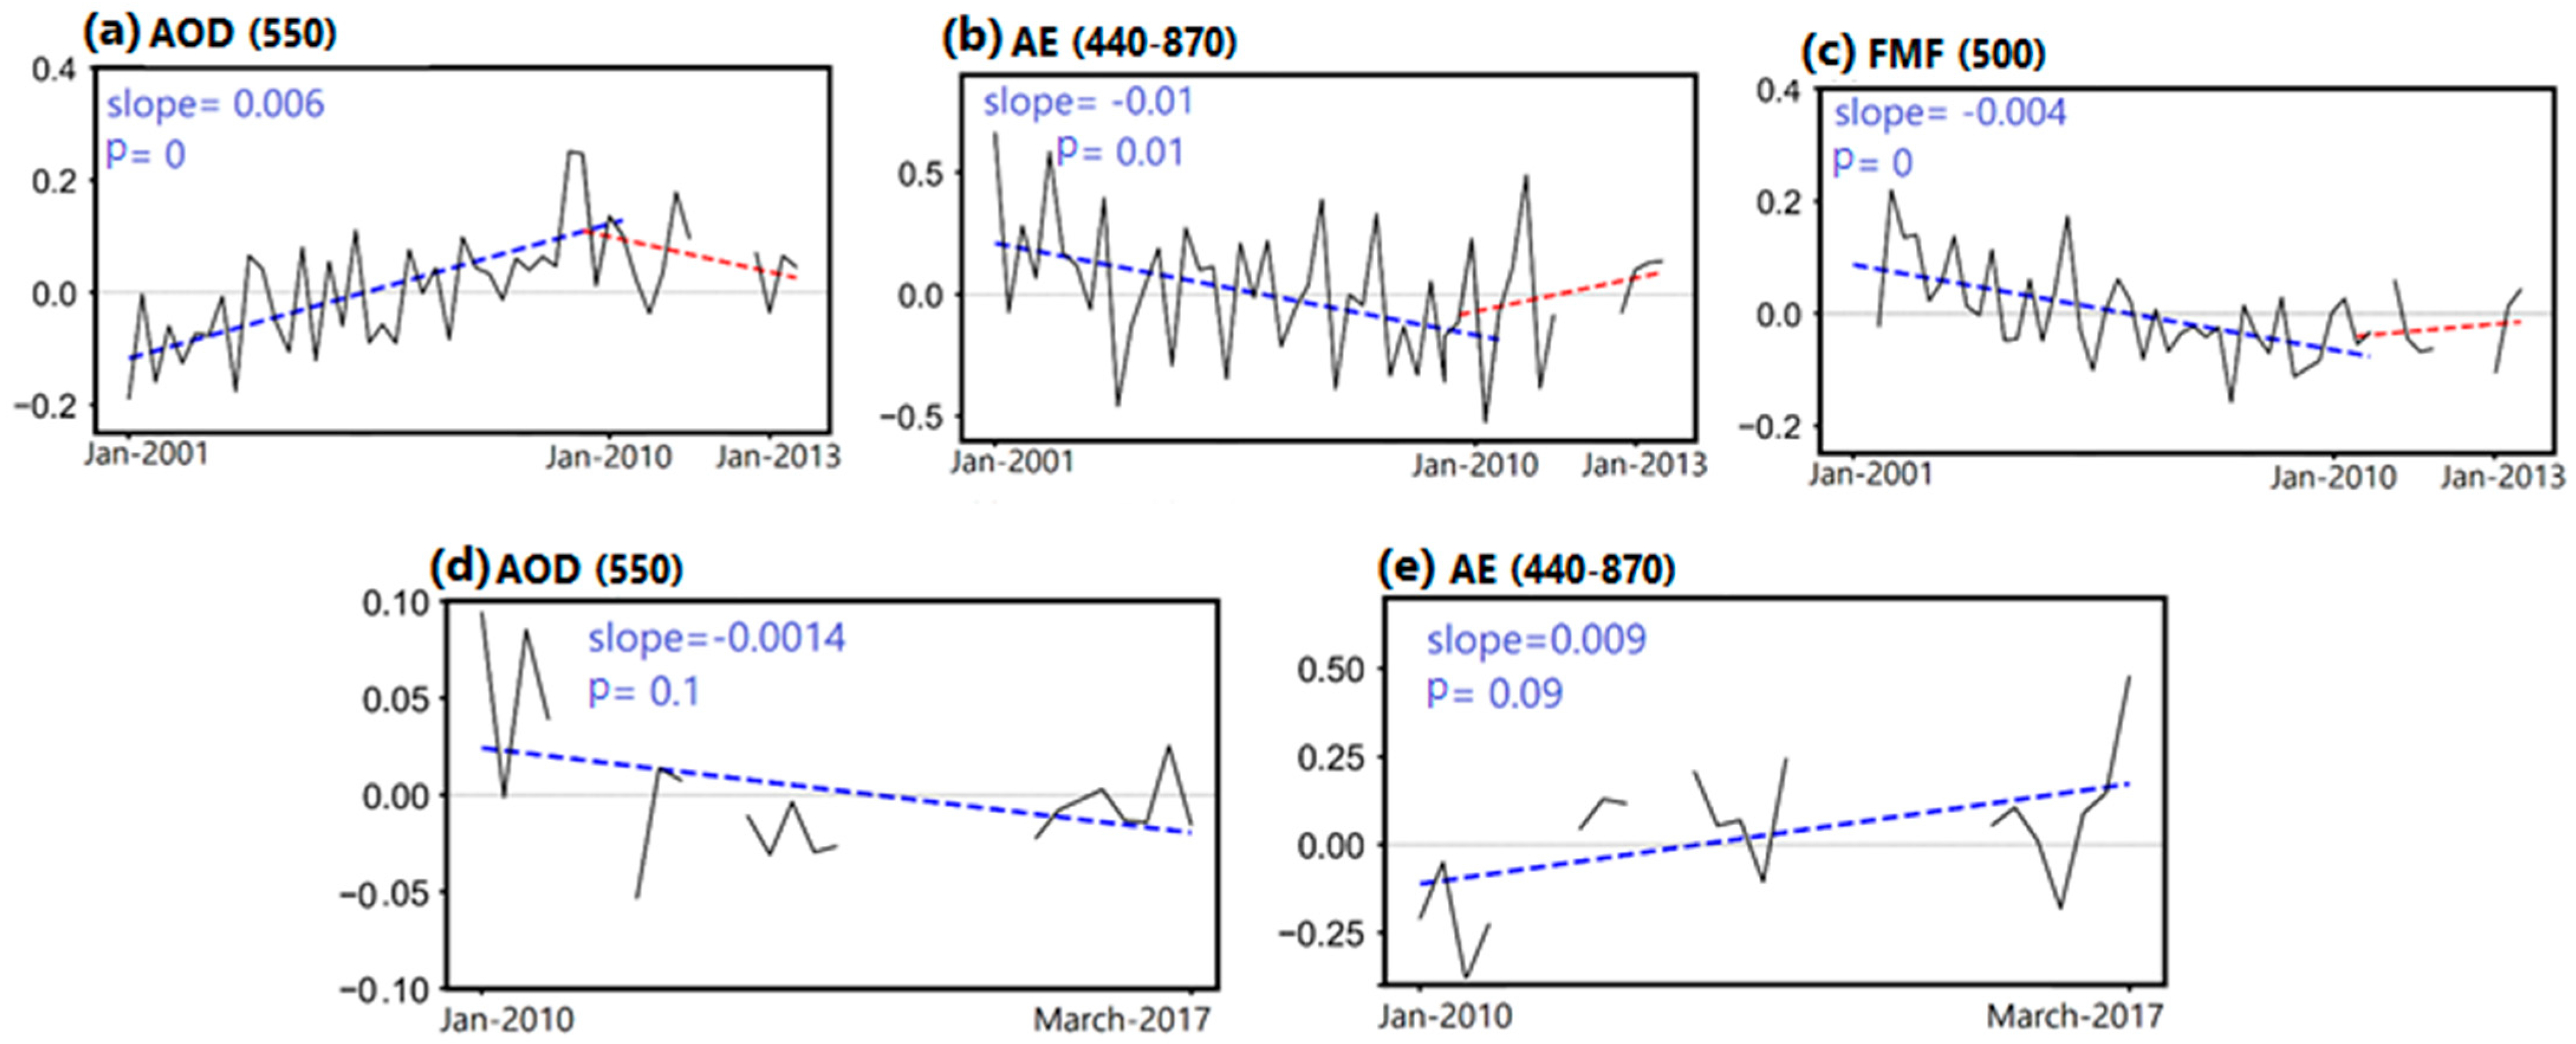
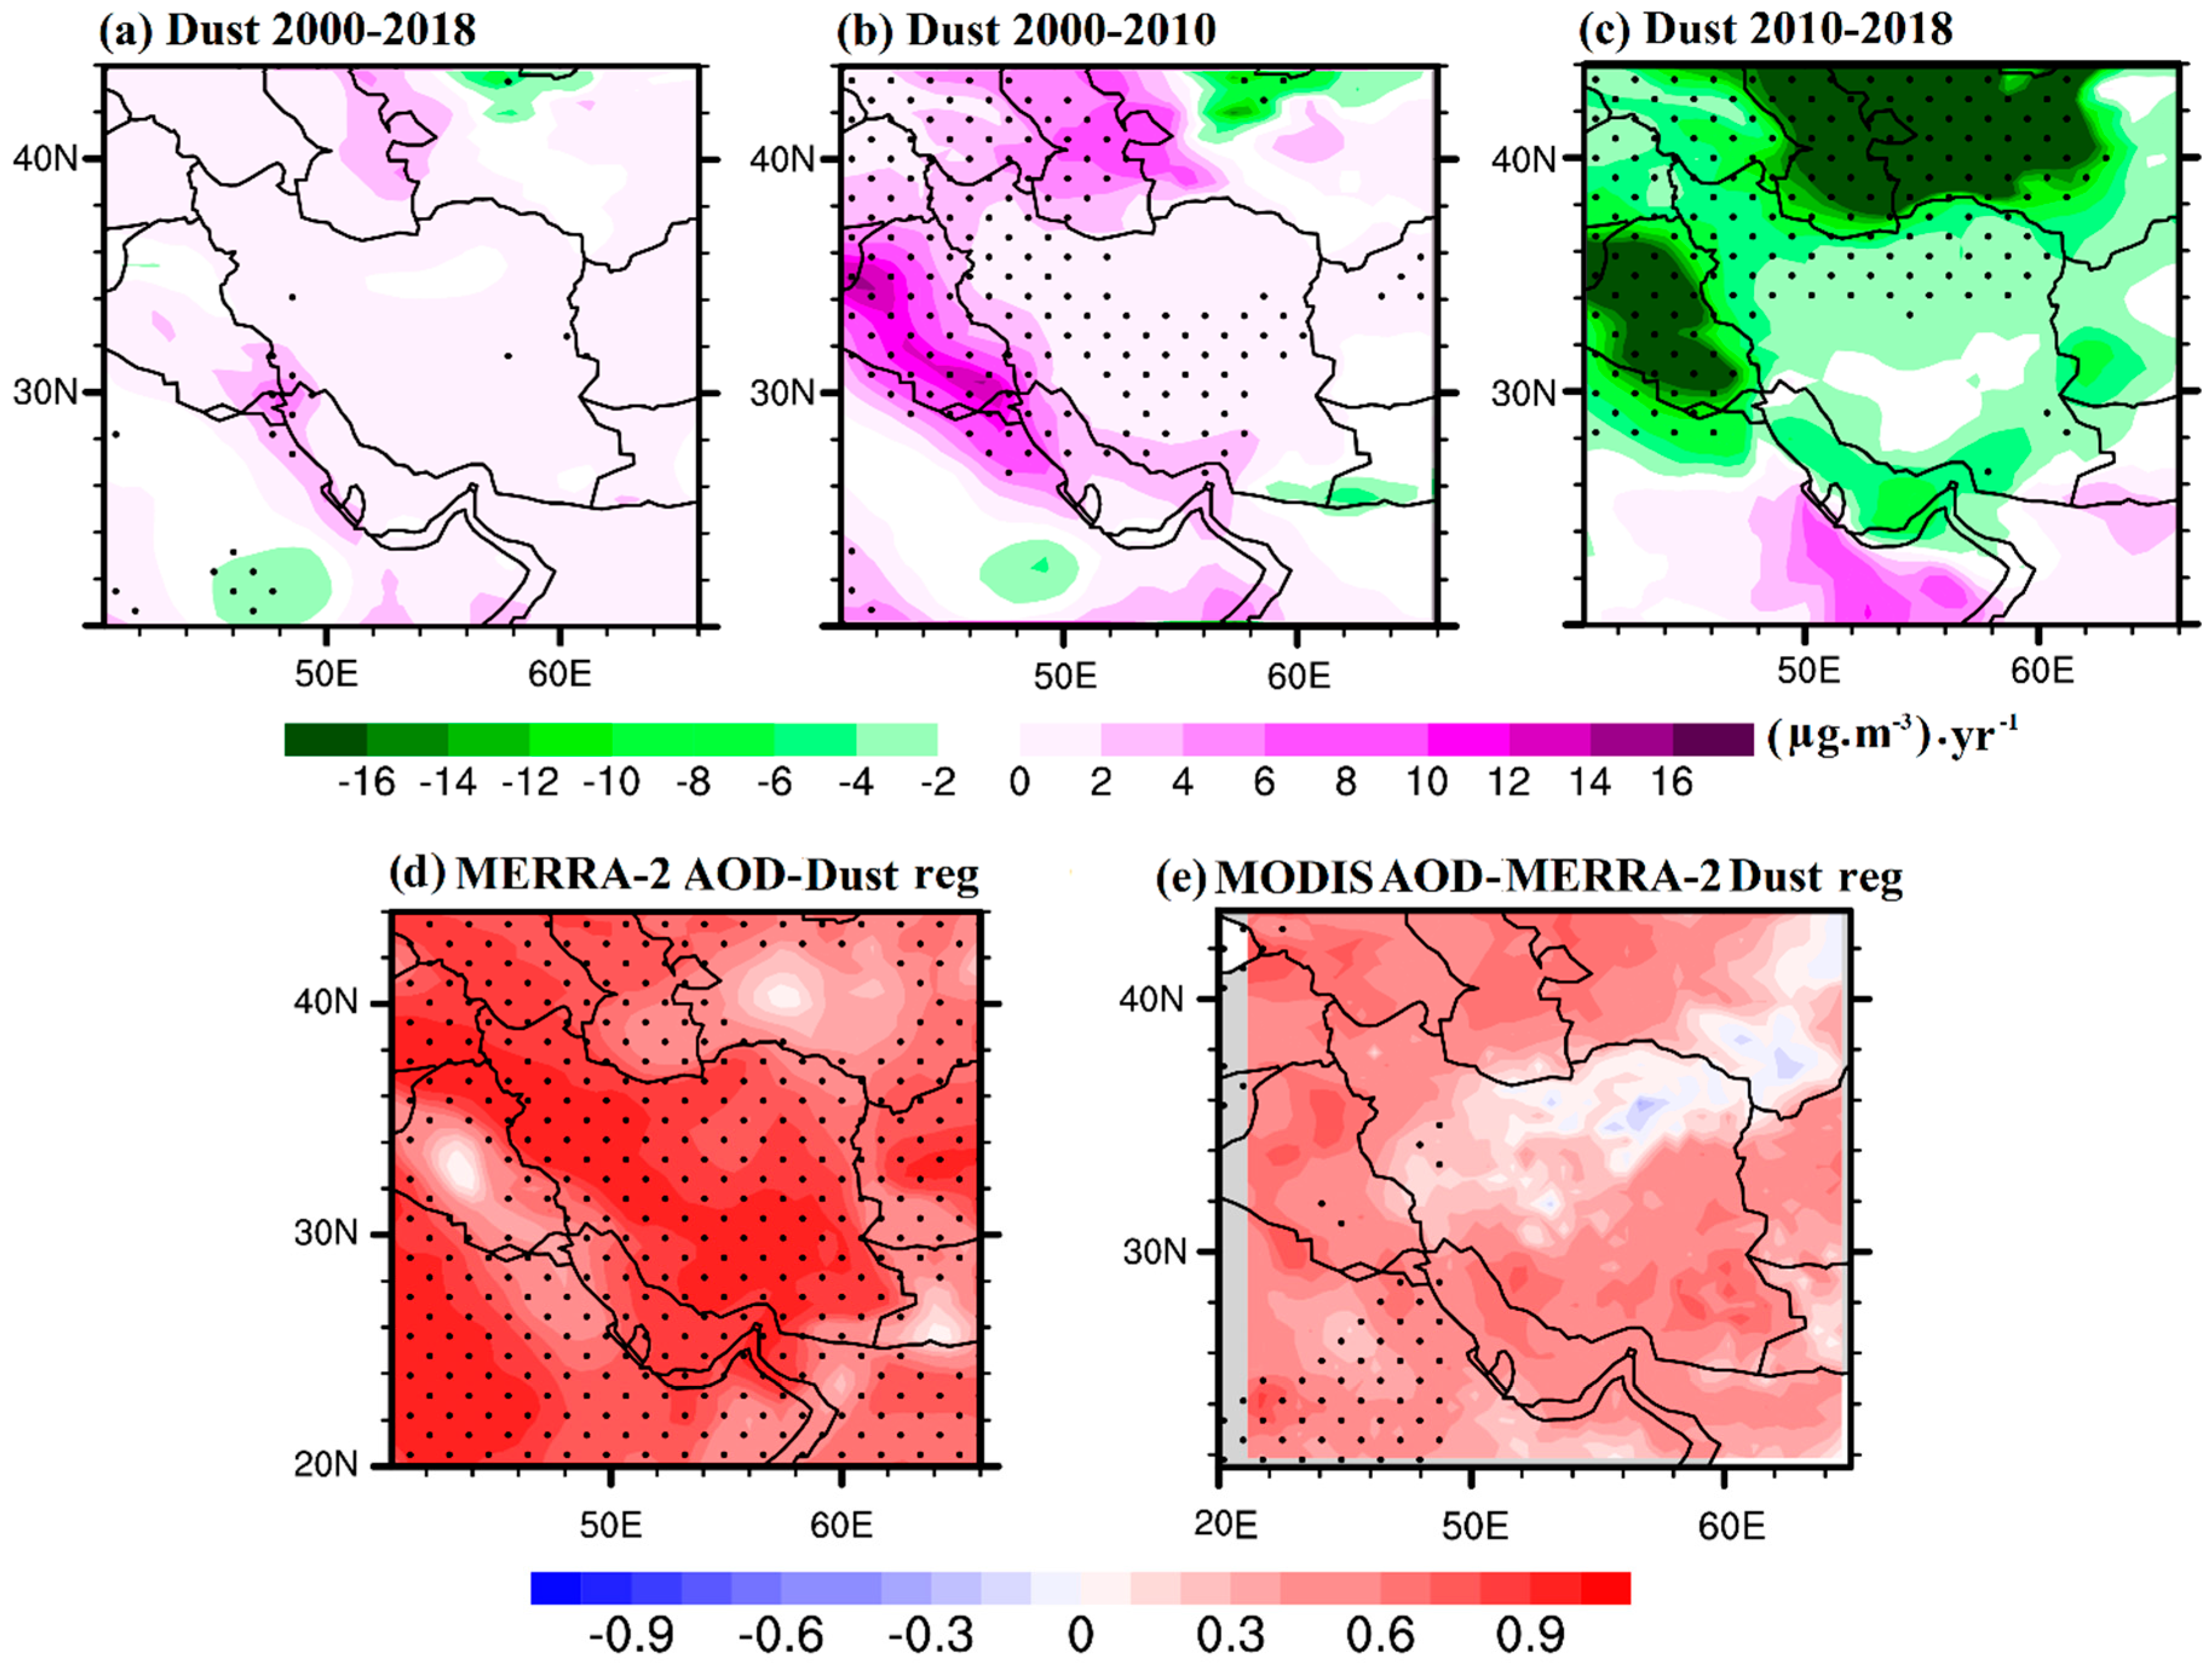
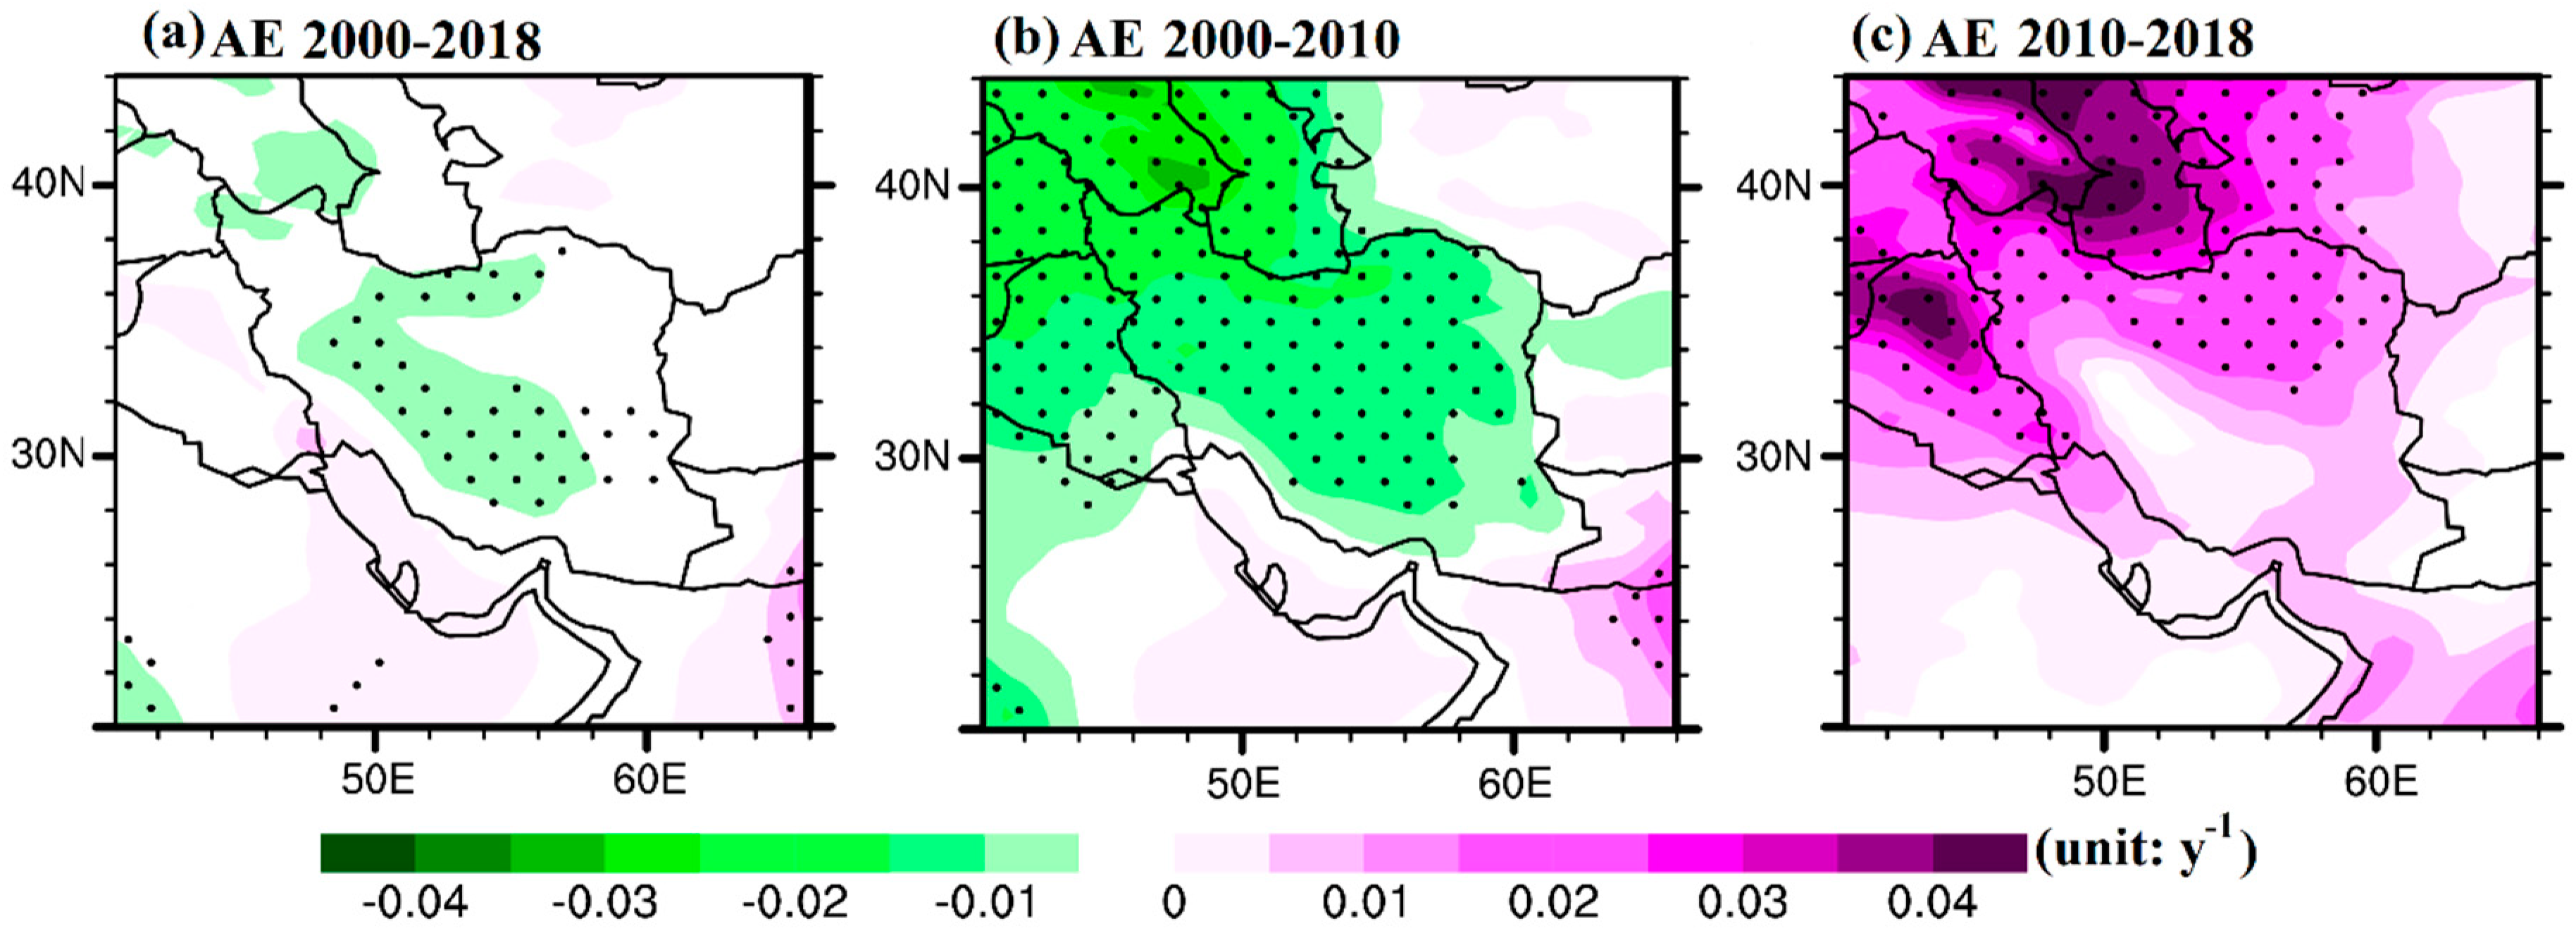
3.1. Aerosol Trends

Data from the MERRA-2 and ERA5 reanalyses were bilinearly interpolated to a MODIS grid (1° × 1°) for direct comparison of the aerosol trends and for carrying out a consistent regression analysis between AOD and meteorological parameters [60,61]. The widely implemented technique of least-square linear regression for time series analysis [27,61,62] was used in the present study to obtain the long-term trends in the MERRA-2 and MODIS AODs (monthly time series data) for December, January, and February (the winter season, DJF) over Iran.
First, the spatial distributions of annual and seasonal mean AODs derived from the MERRA-2 and MODIS data were calculated for the whole study period (2000–2020), although this research has been widely performed for the Middle East region (Figure 2). Therefore, in brief, the results of the comparison show that both AOD datasets are closely consistent over the Middle East and Iran. The differences between the two datasets can be attributed to the different algorithms and assimilation schemes, gaps in datasets, and cloud contamination in the MODIS observations [24]. In addition, the remarkable seasonal differences in AOD distributions can be associated mainly with the atmospheric circulation patterns and the intensity of dust activity from the major dust sources in the hot and cold seasons [24,63,64]. Therefore, the highest and lowest MERRA-2 and MODIS AODs were observed in JJA and DJF, respectively, and are mainly driven by seasonal variations in dust emissions and transportation.
The highest AODs are detected along the major dust sources in the study domain, i.e., over the Iraqi plains and the eastern corridor of the Arabian Peninsula in spring and summer due to Shamal dust storms [7,27]. These dust storms also affect the southwestern part of Iran, and the highest AODs are detected over the same reason, highlighting the influence of dusty air masses from the Iraqi plains [21,27,28].
To explore the relationships between the MERRA-2 AOD and dust concentrations, their annual and seasonal variations, spatially averaged over Iran, were compared during the period 2000–2020 (Figure 3a,b). The seasonal plot clearly reveals that both the MERRA-2 AOD and dust concentrations reach their maximum in spring (MAM) and summer (JJA), while the lowest values are observed in winter, though these values are similar to those observed in autumn for the average surface dust concentrations (Figure 3b). However, even during winter, which is the season with the lowest AOD and dust activity over the Middle East, the climatology-mean AOD is about 0.2, while the average dust concentration is also high (150 μg m−3) (Figure 3). To better characterize the significant contribution of dust emissions to the temporal variability of the winter AOD, the time series of the spatial-averaged mean anomalies of the winter AOD and dust concentrations from the MERRA-2 observations were also analyzed (Figure 3c,d). The results indicated that AOD and dust concentrations seem to have experienced a similar remarkable shift in their levels, prompting the separation of the whole examined period into two distinct sub-periods. Throughout the decade 2000–2010, the MERRA-2 AOD and dust concentrations showed significant upward trends; then, both of these exhibited significant downward trends from 2010 to 2018 (p < 0.05) followed by a normalization afterwards since the dust activity weakened and returned to climatologically normal levels for the Middle East after 2012. These opposite trends over Iran for the two different periods have been reported on an annual basis by Yousefi et al. [65]. This study, however, provides a comprehensive investigation of the factors triggering the upward and downward trends in AOD and dust activity over Iran during the winter seasons of the 2000s and 2010s. Therefore, in the following analysis, we examine separately the trends during the 2000–2010 and 2010–2018 periods, as well as the respective correlations with the influencing meteorological factors.
During the period 2000–2018, the MODIS and MERRA-2 DJF AODs showed an insignificant positive trend over the vast area of the country, with a general consistency between MERRA-2 and MODIS results (Figure 4a,d). In addition, significant positive winter AOD trends from the MERRA-2 and MODIS datasets, extended over a wide area in the Middle East and Iran, are observed during the period 2000–2010 (Figure 4b,e). These increasing trends are statistically significant over most of the study domain, but especially at the southern Mesopotamian plains, southwestern Iran, Kuwait, and northeastern Saudi Arabia, indicating a significant increase in dust AODs which was attributed in previous studies to a shift to higher dust emissions during the dusty seasons after 2008 [66]. The current results indicate that this increase in dust AOD is limited during the dusty periods (spring and summer) but is significant during winter.
Conversely, during the years 2010–2018, both the MERRA-2 and MODIS AOD data displayed significant negative trends over most of the country, as well as over parts of Iraq and central Asia (Figure 4c,f). The two databases present some differences regarding the spatial distribution and the magnitude of the AOD trends, as well as their significance, which, however, are summed up in the overall negative AOD tendency over the Middle East during 2010–2018.
Figure 5 shows the monthly anomalies in AOD550, AE440–870, and FMF500 during DJF at the two AERONET sites which have the most complete databases in Iran and the surrounding dust sources. The results of the AOD trends from the Solar Village and IABAS sites confirmed the reliability of the MERRA-2 and MODIS AOD variations and trends in both the early (till 2010) and late periods (till 2018). Although the mean winter AOD level has been relatively stable during the past two decades, the results indicate a remarkable change (trend shift) in the winter AOD data around 2010, which can be linked to changes in dust loading over the two AERONET stations. At the Solar Village site, the AOD exhibited an increasing trend of 0.006/year from 2000 to 2010 and a decrease afterwards, while at IABAS, NW Iran, the AOD trend remained negative with a slope of −0.0014/year from 2010 to 2017 (the period during which data are available from this AERONET site). The respective trends in AE and FMF values confirm the above-mentioned shift in dust activity and are discussed below, along with the spatial distribution of the MERRA-2 AE trends over Iran and the surrounding areas. An important finding from the trend analysis at the AERONET sites is that the AOD, AE, and FMF values each follow similar trends, indicating a similar general tendency in aerosols over the Middle East region.
Figure 6 shows the winter-mean spatial distribution of the trends in dust concentrations, as obtained from the MERRA-2 retrievals over Iran and the surrounding areas during the period 2000–2018, as well as during the first and second examined sub-periods. The spatial distribution of the winter MERRA-2 dust concentration exhibited a significant positive trend similar to that of the winter MERRA-2 AOD, especially over the western part of the studied area (Figure 6b), and a remarkable negative trend afterwards, especially over Iraq and Central Asia (Figure 6c). In addition, the spatial correlations of the MERRA-2 dust concentrations against the MERRA-2 and MODIS AODs were performed, and the results are shown in Figure 6d,e. The positive correlation coefficients (mostly between 0.4 and 0.9) over a vast area of the study domain confirm the major role of dust in winter AOD variations and trends, although the dust activity over Iran and the whole Middle East is minimal during wintertime (Figure 2 and Figure 3) and the effects of urban/anthropogenic aerosols are higher than in the other seasons [9,10,11,19].
Trends in AE values are also characteristic of changes in the relative importance of the coarse-mode dust aerosols to total AOD. Therefore, an increasing tendency in AE values indicates an increase in anthropogenic fine-mode aerosols and/or a decrease in dust presence, whereas decreasing trends in AE values suggest a considerable increase in the presence of coarse dust particles [14]. The AERONET data showed decreasing (slope: −0.01 at Solar Village) and increasing (slope: 0.009 at IABAS) trends in winter AE during the first and second periods, respectively, confirming the initial increase and subsequent decrease in the presence of coarse-mode dust aerosols. The longer AE data series at the Solar Village AERONET site clearly indicated the shift in AE values, with a pronounced decrease till 2010 and a slight increase afterwards (Figure 5). Moreover, the Solar Village site experienced the same negative and positive trends in winter FMF data, these being inversely related to AOD variability, thus indicating an increase and then a decrease in dust (coarse-mode aerosol) presence (Figure 5c). Klingmüller et al. [32] highlighted these results at the Solar Village site by examining the long-term trends in dust activity and factors influencing it in the Middle East. In the current analysis, the lower AE values and the decreasing tendency over nearly the whole Iranian territory during 2000–2010 clearly demonstrate the central role of dust in AOD changes and its considerable increase during the winter seasons of the 2000s (Figure 7b), followed by the large increase in AE values over northern Iran, Iraq, and Central Asia from 2010 to 2018 (Figure 7c). Furthermore, the AE winter trends from both the MERRA-2 (Figure 7) and AERONET data (Figure 5b,e) were highly anti-correlated (inversely correlated) with those of the AOD (Figure 4). To further detect and evaluate the main reasons behind the significant change in winter the AOD trend around 2010, as well as the main role of dust emissions, the variability in the main meteorological parameters are investigated in the next section.

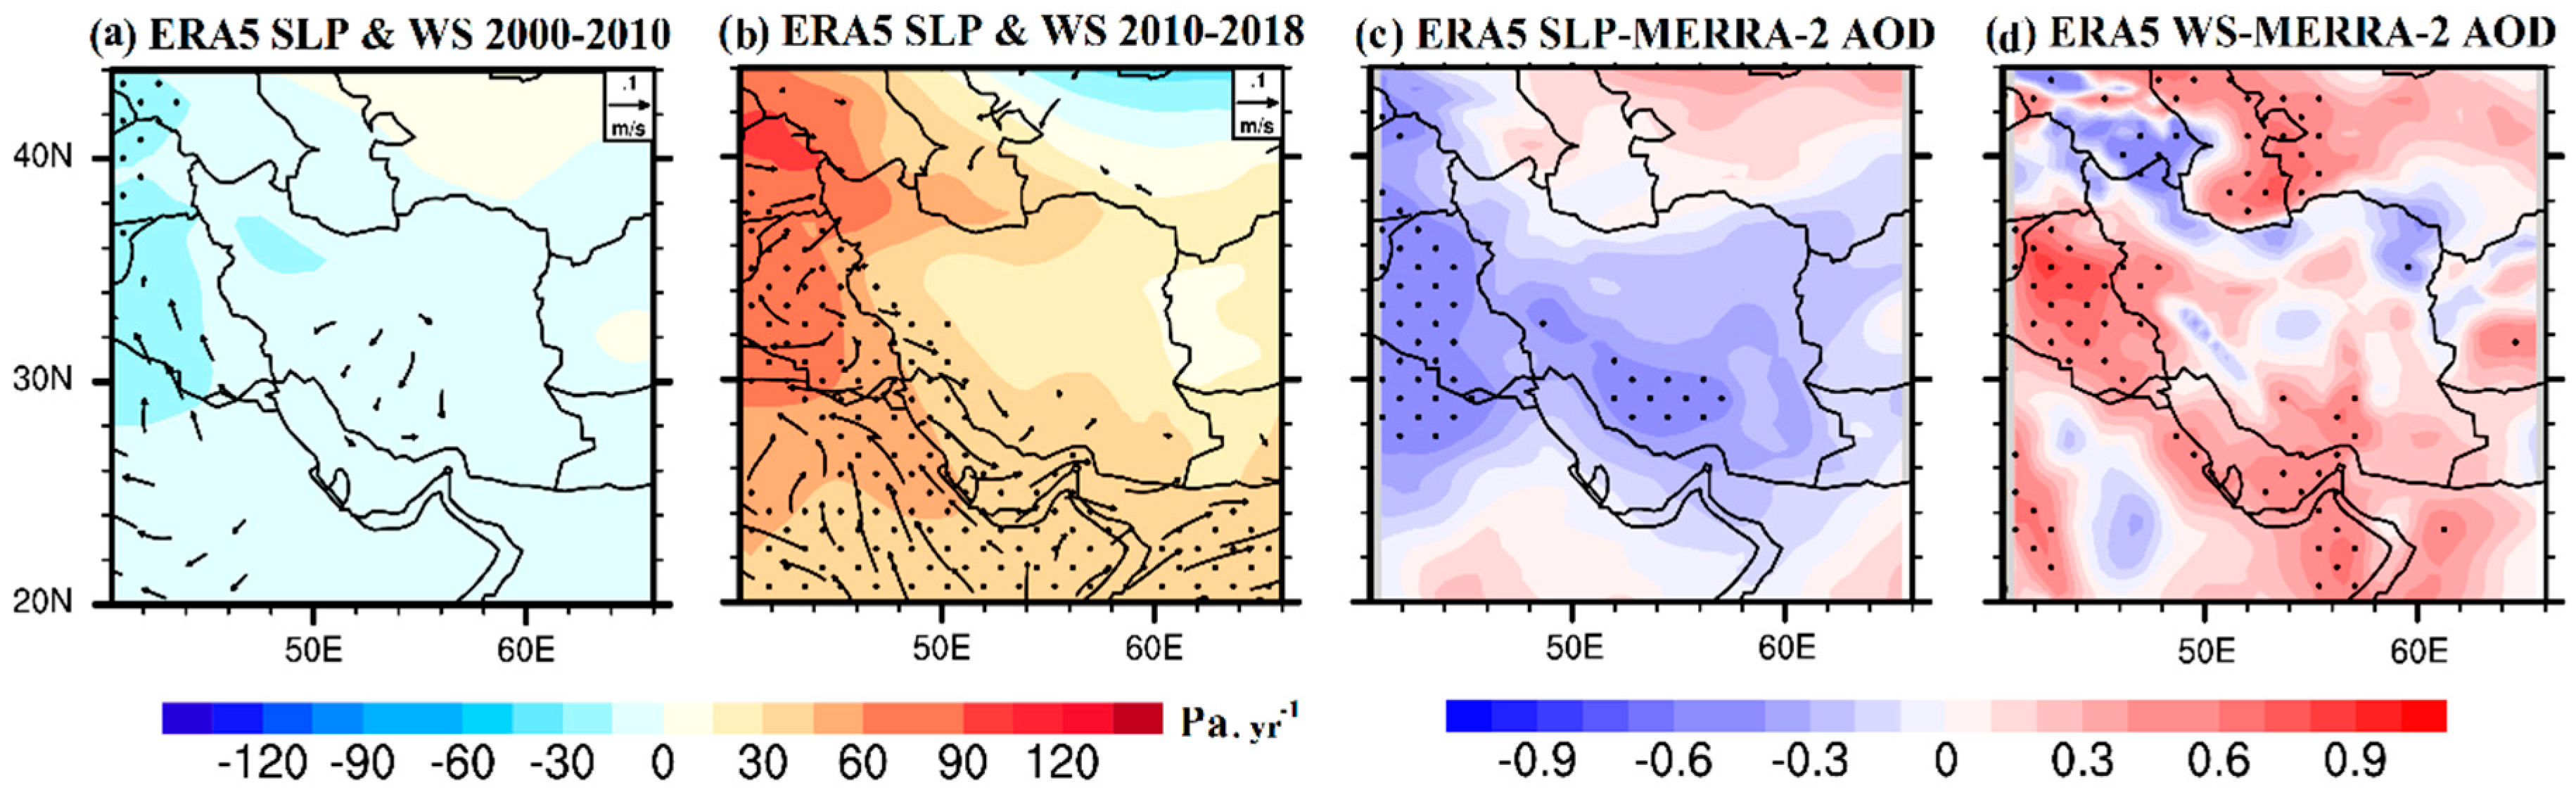
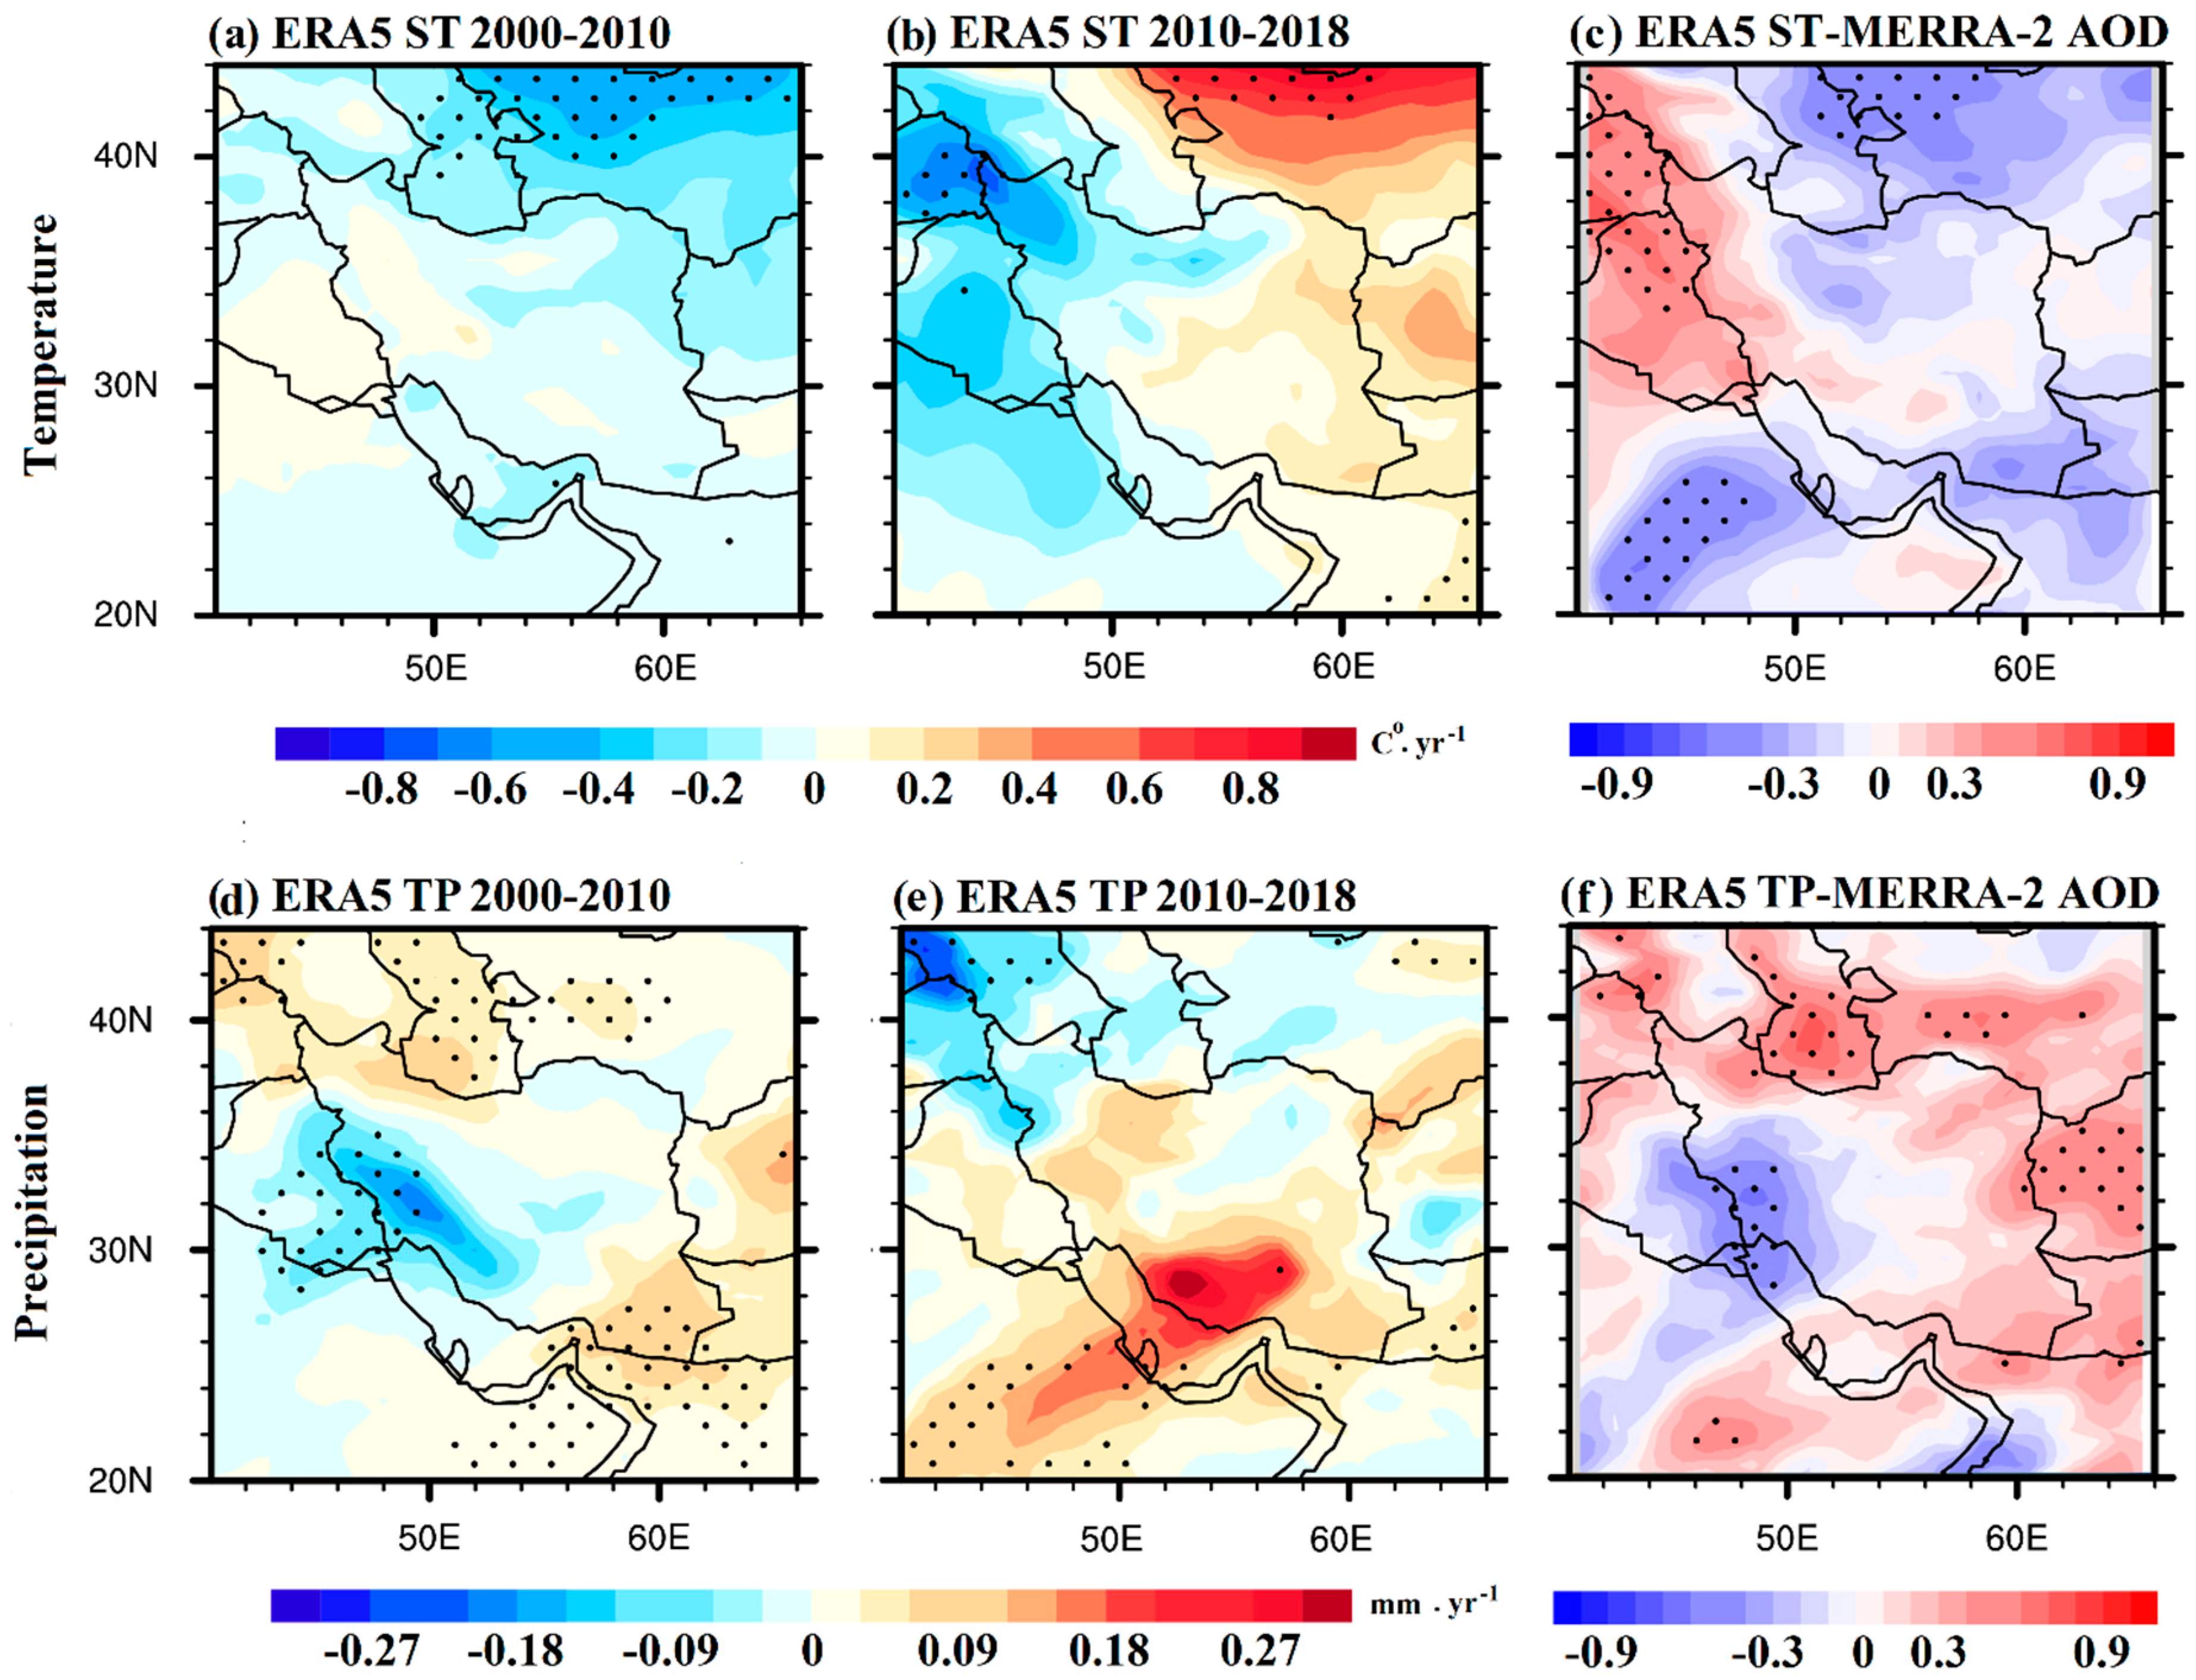
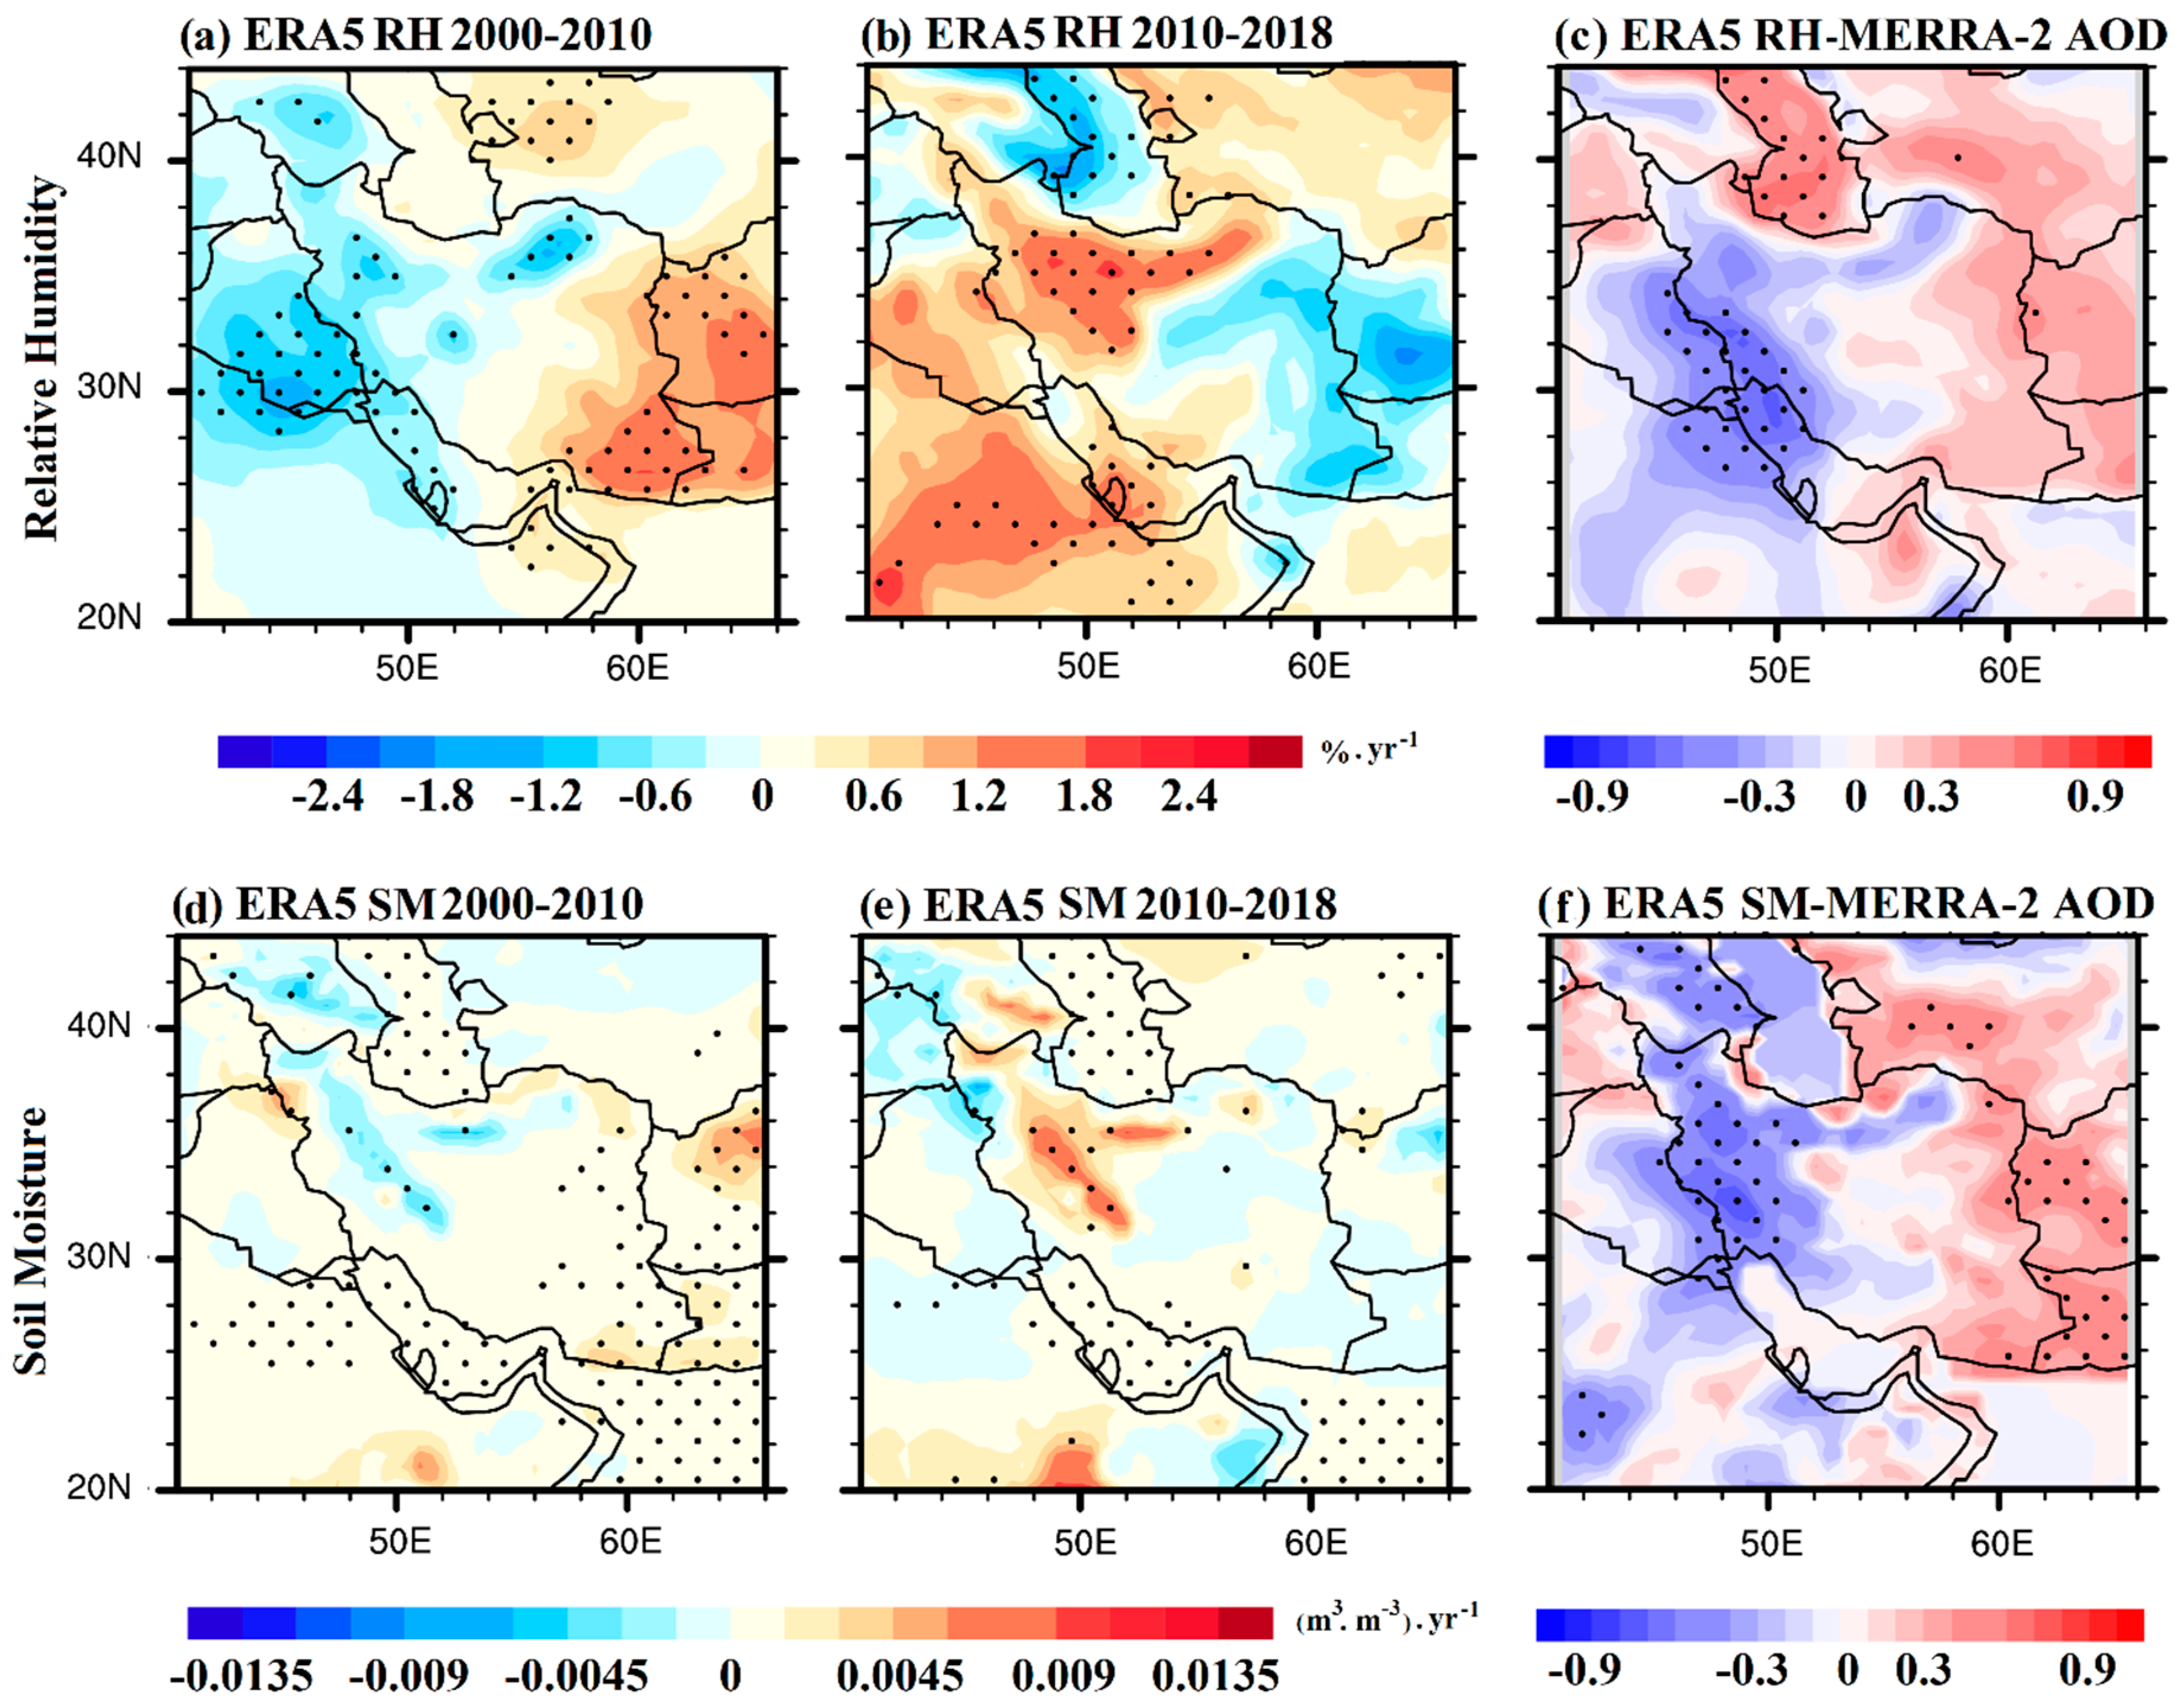
3.2. The Wintertime AOD–Meteorology Interaction

Several meteorological factors that are directly or indirectly related to aerosol variations have been investigated in previous studies, as they control the AOD changes and dust lifecycle [65,67,68]. In this study, the linear trends of several meteorological parameters (SM, RH, ST, TP, WS, and SLP), derived from ERA5 in winter, and the associated correlation analysis with the MERRA-2 winter AODs over Iran and the surrounding areas are examined in order to assess the influence of local/regional meteorology on the winter AOD variations and trends during the 2000–2010 and 2010–2018 periods.
Negative winter SLP trends were observed during 2000–2010 (Figure 8a), and these were accompanied by an increase in AOD and dust concentrations over Iran. During this period, the anomalous southern winds, blowing from the major desert-dust sources in the Arabian Peninsula, facilitated the transport of dry and dusty air masses to the Middle East region and Iran, thus providing a positive feedback for the enhancement in dust activity during the 2010s, which, however, was also influenced by several other meteorological and soil factors, especially during the drought shift after 2007 in the Mesopotamian plains [66,69]. In contrast, positive winter sea level pressure trends, spatially averaged over the western part of Iran and over Iraq, were observed during the second period (Figure 8b). During this time frame, changes in synoptic weather patterns occurred over large spatial scales that carried wetter air masses from the western to the Middle East region and decreased dust emission and transport. Moreover, an inverse correlation between the MERRA-2 AOD and SLP during the winter season was observed over major parts of Iran and Iraq during the period 2000–2010, which was statistically significant over the Mesopotamian plains and in southern Iran (Figure 8c). A previous study found that SLP was mainly responsible for aerosol changes over the Middle East region [24]. Therefore, lower SLP values are generally associated with higher AODs, and, consequently, dust emissions over the Middle East, the Arabian Peninsula, and Iran. This highlights the role of cyclogenesis in dust outbreaks even during the winter period [70]. During wintertime, several dust events over the Middle East that affected Iran are highly associated with cyclonic and frontal systems (frontal dust storms) and/or convective activity in the presence of the Kurdish cut-off low over northern Iraq [7,71,72,73].
The winter wind speed is significantly correlated with the AOD over Iraq and some parts of western and southern Iran, while a significant wind speed–AOD correlation is also observed in Central Asia (Figure 8d). This positive correlation clearly explains the important role of wind in the desert areas of the Middle East for facilitating dust emissions, even during wintertime when the least dust activity occurs [74,75,76,77,78]. Therefore, the current analysis clearly indicates that wind speed variations play an important role in winter AOD changes and dust activity over Iran and the surrounding regions (Figure 8d).
The AOD over the EMME region is generally favored by a suitable atmospheric environment of high temperatures and dry desert air conditions, especially in the dusty spring/summer period [79,80,81]. In this respect, the decadal trends in ST over the Iranian territory and the surrounding regions are analyzed during the two study periods (Figure 9). The results do not show a prominent and statistically significant trend in ST, presenting an overall declining tendency during the 2000s which is statistically significant only over Central Asia. During the second period, 2010–2018, the temperature exhibits a decreasing trend over the western part of Iran, Iraq, and southeastern Turkey (Figure 9b), while in eastern Iran the trend becomes positive and statistically significant over Central Asia. Surface temperature does not seem to highly affect the AOD variations in winter, and the correlations between temperature and AOD are contradictory, with positive values over Iraq and western Iran and negative values over central/eastern Iran, central Arabia, and Central Asia (Figure 9c). However, the positive correlation between AOD and surface temperature over the Iraqi plains in winter indicates that hotter weather conditions facilitate higher dust emissions and AOD accumulation over the desert environment, although this was not the case over the Central Iranian Plateau.
Precipitation impacts the dust loading through various mechanisms, with rain scavenging the most efficient way to directly remove aerosols from the atmosphere [76]. This is generally confirmed by the current analysis as well, since TP experienced downward and upward trends, opposite to those of AOD, during the first and second periods, respectively (Figure 9d,e). The statistically significant negative trend in precipitation over the dusty region in Iraq and southwestern Iran during the first period (Figure 9d) seems to highly affect the increase in dust loading and, in turn, AOD, as it creates favorable conditions for dust outbreaks [66,82]. In contrast, after 2012, a general increase in precipitation was observed, especially over southern Iran and the Arabian Peninsula (Figure 9e), which terminated the extreme drought and restored the dust activity to more or less climatologically normal levels. This explains the general decreasing AOD and dust trend over Iran and the Middle East after 2012 [27,69,81].
Figure 9f also shows that TP was significantly inversely correlated with AOD over the dust-source region of southern Iraq and southwestern Iran, while in other regions such as eastern Iran, Afghanistan, and Central Asia, precipitation exhibits a positive correlation with AOD, which may be attributed to the very low precipitation levels over these regions and the occasional presence of dust storms under favorable weather conditions (frontal systems) during winter.
To further analyze the possible reasons for the AOD variations and trends, Figure 10 demonstrates the decadal RH and soil moisture trends during the first and second periods, as well as the spatial distributions of the correlations between AOD and RH and between AOD and soil moisture during the whole study period (2000–2018). Over the Iraqi plains and the western part of Iran, a significant negative RH trend was observed during the period 2000–2010 and a significant positive RH trend was observed during the period 2010–2018, while reversed trends existed over eastern Iran. Since Iran is mostly affected by dust coming from Iraq and Saudi Arabia [83,84], the negative RH trend during the period 2000–2010 indicate less humidity and more favorable conditions for dust emissions and accumulation, thus resulting in an AOD increase. The increase in RH in western/northern Iran during the period 2010–2018, also indicates conditions unfavorable for dust emissions, while the decrease in RH in eastern Iran during the same period was not statistically significant (Figure 10b). As was expected, RH was significantly inversely correlated with AOD over the dusty regions of Iraq and southwestern Iran (Figure 10c), indicating that increased RH is a negative feedback for dust AOD over the dust-source regions [82].
Trends in soil moisture during both periods are rather weak and statistically significant only over the Zagros and Alborz Mountains (Figure 10d,e). Soil moisture trends generally follow those of RH over these regions, and the spatial distribution of the correlation between soil moisture and AOD (Figure 10f) was similar to that of RH. This correlation presents statistically significant negative values over the western part of Iran and the arid regions of Iraq and the central Arabian Peninsula, which indicate that soil moisture also affects dust emissions and AOD variability during winter, as regions and periods with higher RH were associated with lower AODs. The positive correlations between soil moisture and AOD over parts of western Pakistan, Afghanistan, and Central Asia show that the winter AODs and dust emissions in these regions are mostly influenced by other meteorological parameters and different mechanisms, since an increase in soil moisture is a negative feedback for dust emissions [76,85].
Overall, the current analysis has shown that the multi-decadal changes in several meteorological factors are more or less responsible for the winter AOD trends over Iran and the surrounding regions, as the changes in local/regional meteorology are consistent and can explain the dust variability during the 2000–2010 and 2010–2018 periods. Therefore, remarkable changes in meteorological parameters may highly affect dust activity over the Middle East even during wintertime, the season with the lowest dust emissions, and may also affect dust loading during the following spring season [81].

4. Conclusions

By using the updated long-term AOD data from the MODIS observations and the MERRA-2 reanalysis, we observed significant upward and downward winter AOD trends over Iran during the periods 2000–2010 and 2010–2018, respectively. These results were consistent with the AOD trends obtained from two AERONET sites in the Middle East (Solar Village, Saudi Arabia and IABAS, Iran) and with the Ångström exponent and the fine-mode fraction trends, which both showed an increase in coarse-mode aerosols (dust) during the first period and a decrease afterwards. The winter MERRA-2 dust concentrations were also highly related with the winter AOD trends during the 2000–2010 and 2010–2018 periods, indicating that dust is the major contributor to winter AOD variability over Iran. Although dust activity is reduced during wintertime, its strong association with AOD variations motivated us to examine the effect of various meteorological parameters that affect dust emissions and accumulation. Therefore, trend and correlation analyses of ERA5 meteorological parameters were attempted to determine the main possible reasons behind the winter AOD variations and trends.
The analyses revealed significant trends in SLP, TP, RH, and SM, as well as spatial correlations with AOD over the dust-source regions of Iraq, north-central Saudi Arabia, and southwestern Iran that mostly affect the dust aerosol loading over the Iranian territory. The atmospheric circulation patterns and dust transport were mainly controlled by wind speed and direction and were positively correlated with AOD. Increased cyclonicity over the Middle East during the period 2000–2010 was associated with increased winter AODs and dust emissions, which were also facilitated by the decreasing trends in precipitation and RH and the increasing trend in temperature over the major dust sources in Iraq and southwestern Iran. In contrast, during the period 2010–2018, the declining trend in AOD was associated with increases in SLP, rainfall, and RH, while AOD and soil moisture were highly inversely correlated over Iraq and the western part of Iran, indicating negative feedback for dust emissions in winter after the 2010–2012 period, an observation consistent with previous works in the literature.
Overall, the analysis clearly revealed that during wintertime, regional changes in meteorological parameters contributed significantly to aerosol spatio-temporal variations and trends and to the transportation of dust particles from the main dust sources in neighboring areas to the Iran deserts. Further modeling work to identify the exact contributions of the climate variables to the frequency of aerosol events over the Middle East in winter is recommended.

Author Contributions

Methodology, F.W., Q.G. and D.G.K.; investigation, R.Y.; writing—original draft preparation, R.Y.; writing—review and editing, F.W.; data curation, A.S., Q.G. and D.G.K.; visualization, A.S. All authors have read and agreed to the published version of the manuscript.

Funding

This research received no external funding.

Data Availability Statement

The data sets supporting the reported results: MODIS and MERRA-2 via Giovanni (https://giovanni.sci.gsfc.nasa.gov/giovanni/, accessed on 2 September 2022); ERA-5 (https://www.ecmwf.int/en/forecasts/datasets/reanalysis-datasets/era5, accessed on 20 August 2022); AERONET (https://aeronet.gsfc.nasa.gov, accessed on 10 August 2022); ECMWF (https://ecmwf.int/, accessed on 10 August 2022); and GMAO (https://disc.gsfc.nasa.gov, accessed on 2 September 2022).

Acknowledgments

We are grateful to the Earth Observing System Data and Information System (EOSDIS, NASA https://ladsweb.nascom.nasa.gov/), AERONET (https://aeronet.gsfc.nasa.gov), ECMWF (https://ecmwf.int/), and GMAO (https://disc.gsfc.nasa.gov) for providing easy data access to the scientific community. This study was supported by the Strategic Leading Science and Technology Program of the Chinese Academy of Sciences (XDA20020202).

Conflicts of Interest

The authors declare no conflict of interest.

References

  1. Baghbanan, P.; Ghavidel, Y.; Farajzadeh, M. Spatial analysis of spring dust storms hazard in Iran. Theor. Appl. Climatol. 2020, 139, 1447–1457. [Google Scholar] [CrossRef]
  2. Jahani, B.; Dinpashoh, Y.; Wild, M. Dimming in Iran since the 2000s and the potential underlying causes. Int. J. Climatol. 2018, 38, 1543–1559. [Google Scholar] [CrossRef]
  3. Zittis, G.; Almazroui, M.; Alpert, P.; Ciais, P.; Cramer, W.; Dahdal, Y.; Fnais, M.; Francis, D.; Hadjinicolaou, P.; Howari, F.; et al. Climate Change and Weather Extremes in the Eastern Mediterranean and Middle East. Rev. Geophys. 2022, 60, e2021RG000762. [Google Scholar] [CrossRef]
  4. Ahmady-Birgani, H.; Engelbrecht, J.P.; Bazgir, M. How different source regions across the Middle East change aerosol and dust particle characteristics. Desert 2019, 24, 61–73. [Google Scholar]
  5. Broomandi, P.; Karaca, F.; Guney, M.; Fathian, A.; Geng, X.; Kim, J.R. Destinations frequently impacted by dust storms originating from southwest Iran. Atmos. Res. 2021, 248, 105264. [Google Scholar] [CrossRef]
  6. Sabetghadam, S.; Khoshsima, M.; Pierleoni, A. Aerosol climatology and determination of different types over the semi-arid urban area of Tehran, Iran: Application of multi-platform remote sensing satellite data. Atmos. Pollut. Res. 2020, 11, 1625–1636. [Google Scholar] [CrossRef]
  7. Hamzeh, N.H.; Karami, S.; Kaskaoutis, D.G.; Tegen, I.; Moradi, M.; Opp, C. Atmospheric dynamics and numerical simulations of six frontal dust storms in the Middle East region. Atmosphere (Basel) 2021, 12, 125. [Google Scholar] [CrossRef]
  8. Hamill, P.; Giordano, M.; Ward, C.; Giles, D.; Holben, B. An AERONET-based aerosol classification using the Mahalanobis distance. Atmos. Environ. 2016, 140, 213–233. [Google Scholar] [CrossRef]
  9. Logothetis, S.-A.; Salamalikis, V.; Kazantzidis, A. Aerosol classification in Europe, Middle East, North Africa and arabian Peninsula based on AERONET version 3. Atmos. Res. 2020, 239, 104893. [Google Scholar] [CrossRef]
  10. Xu, X.; Xie, L.; Yang, X.; Wu, H.; Cai, L.; Qi, P. Aerosol optical properties at seven AERONET sites over Middle East and Eastern Mediterranean Sea. Atmos. Environ. 2020, 243, 117884. [Google Scholar] [CrossRef]
  11. Sabetghadam, S.; Alizadeh, O.; Khoshsima, M.; Pierleoni, A. Aerosol properties, trends and classification of key types over the Middle East from satellite-derived atmospheric optical data. Atmos. Environ. 2021, 246, 118100. [Google Scholar] [CrossRef]
  12. Chen, Y.-C.; Christensen, M.W.; Stephens, G.L.; Seinfeld, J.H. Satellite-based estimate of global aerosol–cloud radiative forcing by marine warm clouds. Nat. Geosci. 2014, 7, 643–646. [Google Scholar] [CrossRef]
  13. Yoon, J.; Burrows, J.; Vountas, M.; Hoyningen-Huene, W.; Chang, D.; Richter, A.; Hilboll, A. Changes in atmospheric aerosol loading retrieved from space based measurements during the past decade. Atmos. Chem. Phys. Discuss. 2013, 13, 26001–26041. [Google Scholar] [CrossRef]
  14. Floutsi, A.A.; Korras-Carraca, M.B.; Matsoukas, C.; Hatzianastassiou, N.; Biskos, G. Climatology and trends of aerosol optical depth over the Mediterranean basin during the last 12 years (2002–2014) based on Collection 006 MODIS-Aqua data. Sci. Total Environ. 2016, 551, 292–303. [Google Scholar] [CrossRef]
  15. Arkian, F.; Nicholson, S.E. Long-term variations of aerosol optical depth and aerosol radiative forcing over Iran based on satellite and AERONET data. Environ. Monit. Assess 2018, 190, 1–15. [Google Scholar] [CrossRef]
  16. Mehta, M.; Khushboo, R. Recent Decadal Aerosol Trends over Oceanic Regions Surrounding Indian Landmass. Aerosol Sci. Eng. 2022, 6, 448–455. [Google Scholar] [CrossRef]
  17. Shaheen, A.; Wu, R.; Yousefi, R. Dust Aerosol trends over the Eastern Mediterranean region during 2003–2019. In Proceedings of the EGU General Assembly Conference Abstracts; EGU: Munich, Germany, 2021; p. EGU21-582. [Google Scholar]
  18. Shaheen, A.; Wu, R.; Aldabash, M. Long-term AOD trend assessment over the Eastern Mediterranean region: A comparative study including a new merged aerosol product. Atmos. Environ. 2020, 238, 117736. [Google Scholar] [CrossRef]
  19. Ali, M.A.; Nichol, J.E.; Bilal, M.; Qiu, Z.; Mazhar, U.; Wahiduzzaman, M.; Almazroui, M.; Islam, M.N. Classification of aerosols over Saudi Arabia from 2004–2016. Atmos. Environ. 2020, 241, 117785. [Google Scholar] [CrossRef]
  20. Bilal, M.; Nazeer, M.; Nichol, J.; Qiu, Z.; Wang, L.; Bleiweiss, M.; Shen, X.; Campbell, J.; Lolli, S. Evaluation of Terra-MODIS C6 and C6.1 Aerosol Products against Beijing, XiangHe, and Xinglong AERONET Sites in China during 2004–2014. Remote Sens. 2019, 11, 486. [Google Scholar] [CrossRef]
  21. Yousefi, R.; Wang, F.; Ge, Q.; Shaheen, A. Long-term aerosol optical depth trend over Iran and identification of dominant aerosol types. Sci. Total Environ. 2020, 722, 137906. [Google Scholar] [CrossRef]
  22. Shaheen, A. A New MODIS C6.1 and MERRA-2 Merged Aerosol Products: Validation over The Eastern Mediterranean Region. In Proceedings of the EGU General Assembly 2020, Online, 4–8 May 2020; p. EGU2020-639. [Google Scholar] [CrossRef]
  23. Bilal, M.; Nazeer, M.; Qiu, Z.; Ding, X.; Wei, J. Global Validation of MODIS C6 and C6.1 Merged Aerosol Products over Diverse Vegetated Surfaces. Remote Sens. 2018, 10, 475. [Google Scholar] [CrossRef]
  24. Che, H.; Gui, K.; Xia, X.; Wang, Y.; Holben, B.N.; Goloub, P.; Cuevas-Agulló, E.; Wang, H.; Zheng, Y.; Zhao, H.; et al. Large contribution of meteorological factors to inter-decadal changes in regional aerosol optical depth. Atmos. Chem. Phys. 2019, 19, 10497–10523. [Google Scholar] [CrossRef]
  25. Aldabash, M.; Bektas Balcik, F.; Glantz, P. Validation of MODIS C6.1 and MERRA-2 AOD Using AERONET Observations: A Comparative Study over Turkey. Atmosphere (Basel) 2020, 11, 905. [Google Scholar] [CrossRef]
  26. Li, J.; Carlson, B.E.; Dubovik, O.; Lacis, A.A. Recent trends in aerosol optical properties derived from AERONET measurements. Atmos. Chem. Phys. 2014, 14, 12271–12289. [Google Scholar] [CrossRef]
  27. Yousefi, R.; Wang, F.; Ge, Q.; Lelieveld, J.; Shaheen, A. Aerosol Trends during the Dusty Season over Iran. Remote Sens. 2021, 13, 1045. [Google Scholar] [CrossRef]
  28. Shaheen, A.; Wu, R.; Lelieveld, J.; Yousefi, R.; Aldabash, M. Winter AOD trend changes over the Eastern Mediterranean and Middle East region. Int. J. Climatol. 2021, 41, 5516–5535. [Google Scholar] [CrossRef]
  29. Ali, M.A.; Bilal, M.; Wang, Y.; Qiu, Z.; Nichol, J.E.; de Leeuw, G.; Ke, S.; Mhawish, A.; Almazroui, M.; Mazhar, U.; et al. Evaluation and comparison of CMIP6 models and MERRA-2 reanalysis AOD against Satellite observations from 2000 to 2014 over China. Geosci. Front. 2022, 13, 101325. [Google Scholar] [CrossRef]
  30. Bilal, M.; Mhawish, A.; Nichol, J.E.; Qiu, Z.; Nazeer, M.; Ali, M.A.; de Leeuw, G.; Levy, R.C.; Wang, Y.; Chen, Y.; et al. Air pollution scenario over Pakistan: Characterization and ranking of extremely polluted cities using long-term concentrations of aerosols and trace gases. Remote Sens. Environ. 2021, 264, 112617. [Google Scholar] [CrossRef]
  31. Yousefi, R.; Wang, F.; Ge, Q.; Shaheen, A.; Luterbacher, J. Long-term AOD trend analysis and Classification of major aerosol types over Iran from 1980 to 2018. In Proceedings of the EGU General Assembly 2020, Online, 4–8 May 2020; p. EGU2020-1831. [Google Scholar] [CrossRef]
  32. Klingmüller, K.; Pozzer, A.; Metzger, S.; Stenchikov, G.L.; Lelieveld, J. Aerosol optical depth trend over the Middle East. Atmos. Chem. Phys. 2016, 16, 5063–5073. [Google Scholar] [CrossRef] [Green Version]
  33. Carslaw, K.S.; Boucher, O.; Spracklen, D.V.; Mann, G.W.; Rae, J.G.L.; Woodward, S.; Kulmala, M. A review of natural aerosol interactions and feedbacks within the Earth system. Atmos. Chem. Phys. 2010, 10, 1701–1737. [Google Scholar] [CrossRef]
  34. Von Schneidemesser, E.; Monks, P.S.; Allan, J.D.; Bruhwiler, L.; Forster, P.; Fowler, D.; Lauer, A.; Morgan, W.T.; Paasonen, P.; Righi, M. Chemistry and the linkages between air quality and climate change. Chem. Rev. 2015, 115, 3856–3897. [Google Scholar] [CrossRef]
  35. Tegen, I.; Schepanski, K. Climate feedback on aerosol emission and atmospheric concentrations. Curr. Clim. Chang. Rep. 2018, 4, 1–10. [Google Scholar] [CrossRef]
  36. Shaheen, A.; Kidwai, A.A.; Ain, N.U.; Aldabash, M.; Zeeshan, A. Estimating air particulate matter 10 using Landsat multi-temporal data and analyzing its annual temporal pattern over gaza strip, Palestine. J. Asian Sci. Res. 2017, 7, 22. [Google Scholar] [CrossRef]
  37. Gui, K.; Che, H.; Wang, Y.; Wang, H.; Zhang, L.; Zhao, H.; Zheng, Y.; Sun, T.; Zhang, X. Satellite-derived PM2.5 concentration trends over Eastern China from 1998 to 2016: Relationships to emissions and meteorological parameters. Environ. Pollut. 2019, 247, 1125–1133. [Google Scholar] [CrossRef] [PubMed]
  38. Kaskaoutis, D.G.; Houssos, E.E.; Rashki, A.; Francois, P.; Legrand, M.; Goto, D.; Bartzokas, A.; Kambezidis, H.D.; Takemura, T. The Caspian Sea–Hindu Kush Index (CasHKI): A regulatory factor for dust activity over southwest Asia. Glob. Planet. Chang. 2016, 137, 10–23. [Google Scholar] [CrossRef]
  39. Rashki, A.; Kaskaoutis, D.G.; Mofidi, A.; Minvielle, F.; Chiapello, I.; Legrand, M.; Dumka, U.C.; Francois, P. Effects of Monsoon, Shamal and Levar winds on dust accumulation over the Arabian Sea during summer—The July 2016 case. Aeolian Res. 2019, 36, 27–44. [Google Scholar] [CrossRef]
  40. Kaskaoutis, D.G.; Rashki, A.; Dumka, U.C.; Mofidi, A.; Kambezidis, H.D.; Psiloglou, B.E.; Karagiannis, D.; Petrinoli, K.; Gavriil, A. Atmospheric dynamics associated with exceptionally dusty conditions over the eastern Mediterranean and Greece in March 2018. Atmos. Res. 2019, 218, 269–284. [Google Scholar] [CrossRef]
  41. Ghasem, A.; Shamsipour, A.; Miri, M.; Safarrad, T. Synoptic and remote sensing analysis of dust events in southwestern Iran. Nat. Hazards 2012, 64, 1625–1638. [Google Scholar] [CrossRef]
  42. Gerivani, H.; Lashkaripour, G.R.; Ghafoori, M.; Jalali, N. The source of dust storm in Iran: A case study based on geological information and rainfall data. Carpathian J. Earth Environ. Sci. 2011, 6, 297–308. [Google Scholar]
  43. Rashki, A.; Kaskaoutis, D.G.; Eriksson, P.G.; de W Rautenbach, C.J.; Flamant, C.; Abdi Vishkaee, F. Spatio-temporal variability of dust aerosols over the Sistan region in Iran based on satellite observations. Nat. Hazards 2014, 71, 563–585. [Google Scholar] [CrossRef] [Green Version]
  44. Miri, A.; Maleki, S.; Middleton, N. An investigation into climatic and terrestrial drivers of dust storms in the Sistan region of Iran in the early twenty-first century. Sci. Total Environ. 2021, 757, 143952. [Google Scholar] [CrossRef] [PubMed]
  45. Kaskaoutis, D.G.; Rashki, A.; Houssos, E.E.; Mofidi, A.; Goto, D.; Bartzokas, A.; Francois, P.; Legrand, M. Meteorological aspects associated with dust storms in the Sistan region, southeastern Iran. Clim. Dyn. 2015, 45, 407–424. [Google Scholar] [CrossRef]
  46. Gelaro, R.; McCarty, W.; Suárez, M.J.; Todling, R.; Molod, A.; Takacs, L.; Randles, C.A.; Darmenov, A.; Bosilovich, M.G.; Reichle, R.; et al. The Modern-Era Retrospective Analysis for Research and Applications, Version 2 (MERRA-2). J. Clim. 2017, 30, 5419–5454. [Google Scholar] [CrossRef] [PubMed]
  47. Molod, A.; Takacs, L.; Suarez, M.; Bacmeister, J. Development of the GEOS-5 atmospheric general circulation model: Evolution from MERRA to MERRA2. Geosci. Model Dev. 2015, 8, 1339–1356. [Google Scholar] [CrossRef]
  48. Chin, M.; Ginoux, P.; Kinne, S.; Torres, O.; Holben, B.N.; Duncan, B.N.; Martin, R.V.; Logan, J.A.; Higurashi, A.; Nakajima, T. Tropospheric Aerosol Optical Thickness from the GOCART Model and Comparisons with Satellite and Sun Photometer Measurements. J. Atmos. Sci. 2002, 59, 461–483. [Google Scholar] [CrossRef]
  49. Kalita, G.; Kunchala, R.K.; Fadnavis, S.; Kaskaoutis, D.G. Long term variability of carbonaceous aerosols over Southeast Asia via reanalysis: Association with changes in vegetation cover and biomass burning. Atmos. Res. 2020, 245, 105064. [Google Scholar] [CrossRef]
  50. Holben, B.N.; Eck, T.F.; Slutsker, I.A.; Tanre, D.; Buis, J.P.; Setzer, A.; Vermote, E.; Reagan, J.A.; Kaufman, Y.J.; Nakajima, T. AERONET—A federated instrument network and data archive for aerosol characterization. Remote Sens. Environ. 1998, 66, 1–16. [Google Scholar] [CrossRef]
  51. Remer, L.A.; Kaufman, Y.J.; Tanré, D.; Mattoo, S.; Chu, D.A.; Martins, J.V.; Li, R.-R.; Ichoku, C.; Levy, R.C.; Kleidman, R.G. The MODIS aerosol algorithm, products, and validation. J. Atmos. Sci. 2005, 62, 947–973. [Google Scholar] [CrossRef]
  52. Heidinger, A.K.; Foster, M.J.; Walther, A.; Zhao, X.T. The pathfinder atmospheres–extended AVHRR climate dataset. Bull. Am. Meteorol. Soc. 2014, 95, 909–922. [Google Scholar] [CrossRef]
  53. Buchard, V.; Randles, C.A.; Da Silva, A.M.; Darmenov, A.; Colarco, P.R.; Govindaraju, R.; Ferrare, R.; Hair, J.; Beyersdorf, A.J.; Ziemba, L.D. The MERRA-2 aerosol reanalysis, 1980 onward. Part II: Evaluation and case studies. J. Clim. 2017, 30, 6851–6872. [Google Scholar] [CrossRef]
  54. King, M.D.; Menzel, W.P.; Kaufman, Y.J.; Tanre, D.; Gao, B.-C.; Platnick, S.; Ackerman, S.A.; Remer, L.A.; Pincus, R.; Hubanks, P.A. Cloud and aerosol properties, precipitable water, and profiles of temperature and water vapor from MODIS. IEEE Trans. Geosci. Remote Sens. 2003, 41, 442–458. [Google Scholar] [CrossRef]
  55. Wei, J.; Peng, Y.; Mahmood, R.; Sun, L.; Guo, J. Intercomparison in spatial distributions and temporal trends derived from multi-source satellite aerosol products. Atmos. Chem. Phys. 2019, 19, 7183–7207. [Google Scholar] [CrossRef]
  56. Urraca, R.; Huld, T.; Gracia-Amillo, A.; Martinez-de-Pison, F.J.; Kaspar, F.; Sanz-Garcia, A. Evaluation of global horizontal irradiance estimates from ERA5 and COSMO-REA6 reanalyses using ground and satellite-based data. Sol. Energy 2018, 164, 339–354. [Google Scholar] [CrossRef]
  57. Olauson, J. ERA5: The new champion of wind power modelling? Renew. Energy 2018, 126, 322–331. [Google Scholar] [CrossRef]
  58. Hammer, M.S.; Martin, R.V.; Li, C.; Torres, O.; Manning, M.; Boys, B.L. Insight into global trends in aerosol composition from 2005 to 2015 inferred from the OMI Ultraviolet Aerosol Index. Atmos. Chem. Phys. 2018, 18, 8097–8112. [Google Scholar] [CrossRef]
  59. Yousefi, R.; Shaheen, A.; Wang, F.; Ge, Q.; Wu, R.; Lelieveld, J.; Wang, J.; Su, X. Fine particulate matter (PM2.5) trends from land surface changes and air pollution policies in China during 1980–2020. J. Environ. Manag. 2023, 326, 116847. [Google Scholar] [CrossRef]
  60. Sun, E.; Xu, X.; Che, H.; Tang, Z.; Gui, K.; An, L.; Lu, C.; Shi, G. Variation in MERRA-2 aerosol optical depth and absorption aerosol optical depth over China from 1980 to 2017. J. Atmos. Sol.-Terr. Phys. 2019, 186, 8–19. [Google Scholar] [CrossRef]
  61. Gui, K.; Che, H.; Wang, Y.; Xia, X.; Holben, B.N.; Goloub, P.; Cuevas-Agulló, E.; Yao, W.; Zheng, Y.; Zhao, H.; et al. A global-scale analysis of the MISR Level-3 aerosol optical depth (AOD) product: Comparison with multi-platform AOD data sources. Atmos. Pollut. Res. 2021, 12, 101238. [Google Scholar] [CrossRef]
  62. Ali, M.A.; Bilal, M.; Wang, Y.; Qiu, Z.; Nichol, J.E.; Mhawish, A.; de Leeuw, G.; Zhang, Y.; Shahid, S.; Almazroui, M.; et al. Spatiotemporal changes in aerosols over Bangladesh using 18 years of MODIS and reanalysis data. J. Environ. Manag. 2022, 315, 115097. [Google Scholar] [CrossRef]
  63. Zhao, B.; Jiang, J.H.; Diner, D.J.; Su, H.; Gu, Y.; Liou, K.-N.; Jiang, Z.; Huang, L.; Takano, Y.; Fan, X. Intra-annual variations of regional aerosol optical depth, vertical distribution, and particle types from multiple satellite and ground-based observational datasets. Atmos. Chem. Phys. 2018, 18, 11247–11260. [Google Scholar] [CrossRef] [Green Version]
  64. Gandham, H.; Dasari, H.P.; Langodan, S.; Karumuri, R.K.; Hoteit, I. Major changes in extreme dust events dynamics over the Arabian Peninsula during 2003–2017 driven by atmospheric conditions. J. Geophys. Res. Atmos. 2020, 125, e2020JD032931. [Google Scholar] [CrossRef]
  65. Yousefi, R.; Wang, F.; Ge, Q.; Shaheen, A. Contribution of meteorological factors to AOD variability during the dusty season over Iran. In Proceedings of the EGU General Assembly Conference Abstracts; EGU: Munich, Germany, 2021; p. EGU21-1349. [Google Scholar]
  66. Notaro, M.; Yu, Y.; Kalashnikova, O. V Regime shift in Arabian dust activity, triggered by persistent Fertile Crescent drought. J. Geophys. Res. Atmos. 2015, 120, 10229–10249. [Google Scholar] [CrossRef]
  67. Schepanski, K.; Tegen, I.; Macke, A. Saharan dust transport and deposition towards the tropical northern Atlantic. Atmos. Chem. Phys. 2009, 9, 1173–1189. [Google Scholar] [CrossRef]
  68. Bryant, R.G. Recent advances in our understanding of dust source emission processes. Prog. Phys. Geogr. Earth Environ. 2013, 37, 397–421. [Google Scholar] [CrossRef]
  69. Hamzeh, N.H.; Kaskaoutis, D.G.; Rashki, A.; Mohammadpour, K. Long-Term Variability of Dust Events in Southwestern Iran and Its Relationship with the Drought. Atmosphere (Basel) 2021, 12, 1350. [Google Scholar] [CrossRef]
  70. Francis, D.; Chaboureau, J.-P.; Nelli, N.; Cuesta, J.; Alshamsi, N.; Temimi, M.; Pauluis, O.; Xue, L. Summertime dust storms over the Arabian Peninsula and impacts on radiation, circulation, cloud development and rain. Atmos. Res. 2021, 250, 105364. [Google Scholar] [CrossRef]
  71. Beegum, S.N.; Gherboudj, I.; Chaouch, N.; Temimi, M.; Ghedira, H. Simulation and analysis of synoptic scale dust storms over the Arabian Peninsula. Atmos. Res. 2018, 199, 62–81. [Google Scholar] [CrossRef]
  72. Karami, S.; Kaskaoutis, D.G.; Kashani, S.S.; Rahnama, M.; Rashki, A. Evaluation of nine operational models in forecasting different types of synoptic dust events in the Middle East. Geosciences 2021, 11, 458. [Google Scholar] [CrossRef]
  73. Mohammadpour, K.; Sciortino, M.; Kaskaoutis, D.G. Classification of weather clusters over the Middle East associated with high atmospheric dust-AODs in West Iran. Atmos. Res. 2021, 259, 105682. [Google Scholar] [CrossRef]
  74. Behrooz, R.D.; Esmaili-Sari, A.; Bahramifara, N. Effect Wind Speed and Dehydration Hamoun Wetland on Characterization of Ionic Composition of Tsp and Pmduring the 120 Day Winds of Sistan, Iran. Adv. Appl. Sci. Res. 2016, 7, 8–18. [Google Scholar]
  75. Parajuli, S.P.; Yang, Z.-L.; Lawrence, D.M. Diagnostic evaluation of the Community Earth System Model in simulating mineral dust emission with insight into large-scale dust storm mobilization in the Middle East and North Africa (MENA). Aeolian Res. 2016, 21, 21–35. [Google Scholar] [CrossRef]
  76. Parajuli, S.P.; Stenchikov, G.L.; Ukhov, A.; Kim, H. Dust Emission Modeling Using a New High-Resolution Dust Source Function in WRF-Chem with Implications for Air Quality. J. Geophys. Res. Atmos. 2019, 124, 10109–10133. [Google Scholar] [CrossRef]
  77. Ebrahimikhusfi, Z. Analysis of the effect of wind speed and soil moisture on horizontal visibility variations caused by dust event in arid regions (study region: Southeast of Iran). Desert Ecosyst. Eng. J. 2019, 8, 109–121. [Google Scholar]
  78. Fatemi, M.; Jebali, A. Path analysis of the effect of climatic elements on wind speed and desertification progress in Central Iran. Arab. J. Geosci. 2022, 15, 1–12. [Google Scholar] [CrossRef]
  79. Mashat, A.S.; Alamoudi, A.O.; Awad, A.M.; Assiri, M.E. Seasonal variability and synoptic characteristics of dust cases over southwestern Saudi Arabia. Int. J. Climatol. 2018, 38, 105–124. [Google Scholar] [CrossRef]
  80. Mashat, A.-W.S.; Awad, A.M.; Assiri, M.E.; Labban, A.H. Dynamic and synoptic study of spring dust storms over northern Saudi Arabia. Theor. Appl. Climatol. 2020, 140, 619–634. [Google Scholar] [CrossRef]
  81. Shaheen, A.; Wu, R.; Yousefi, R.; Wang, F.; Ge, Q.; Kaskaoutis, D.G.; Wang, J.; Alpert, P.; Munawar, I. Spatio-temporal changes of spring-summer dust AOD over the Eastern Mediterranean and the Middle East: Reversal of dust trends and associated meteorological effects. Atmos. Res. 2023, 281, 106509. [Google Scholar] [CrossRef]
  82. Yu, Y.; Notaro, M.; Liu, Z.; Wang, F.; Alkolibi, F.; Fadda, E.; Bakhrjy, F. Climatic controls on the interannual to decadal variability in Saudi Arabian dust activity: Toward the development of a seasonal dust prediction model. J. Geophys. Res. Atmos. 2015, 120, 1739–1758. [Google Scholar] [CrossRef]
  83. Boloorani, A.D.; Papi, R.; Soleimani, M.; Karami, L.; Amiri, F.; Samany, N.N. Water bodies changes in Tigris and Euphrates basin has impacted dust storms phenomena. Aeolian Res. 2021, 50, 100698. [Google Scholar] [CrossRef]
  84. Papi, R.; Attarchi, S.; Boloorani, A.D.; Samany, N.N. Knowledge discovery of Middle East dust sources using Apriori spatial data mining algorithm. Ecol. Inform. 2022, 72, 101867. [Google Scholar] [CrossRef]
  85. Gholami, H.; Kordestani, M.D.; Li, J.; Telfer, M.W.; Fathabadi, A. Diverse sources of aeolian sediment revealed in an arid landscape in southeastern Iran using a modified Bayesian un-mixing model. Aeolian Res. 2019, 41, 100547. [Google Scholar] [CrossRef]
Figure 1. Geographic location of Iran and the two AERONET stations (purple circles) used in this study.
Remotesensing 15 00905 g001
Figure 2. Spatial distributions of annual and seasonal mean AODs from MERRA-2 and MODIS during the period 2000–2020.
Remotesensing 15 00905 g002
Figure 3. Annual and seasonal variations in the MERRA-2 AOD (a) and MERRA-2 dust concentrations (b) over Iran during the period 2000–2020. The vertical bars represent one standard deviation of the mean. Time series of the MERRA-2 spatial-averaged AOD anomalies (c) and dust concentration anomalies (d) over Iran during the winter (DJF) season. Dashed lines represent the trends (p < 0.05) during the first (until 2010) and second (until 2018) periods.
Remotesensing 15 00905 g003
Figure 4. Spatial distributions of the winter (DJF) AOD550 trends from the MERRA-2 (ac) and MODIS (df) datasets during the selected periods. The black dots indicate the pixels with significant trends at a 95% confidence level (p < 0.05).
Remotesensing 15 00905 g004
Figure 5. Deseasonalized trends in AOD (a), AE (b), and FMF (c) during winter at the Solar Village AERONET site over the period 2001–2013. Similar trends for AOD (d) and AE (e) during winter at the IABAS AERONET site over the period 2010–2017.
Remotesensing 15 00905 g005
Figure 6. Spatial distributions of the winter (DJF) linear trends of the MERRA-2 dust concentration during the periods 2000–2018 (a), 2000–2010 (b), and 2010–2018 (c), as calculated from the anomalies (DJF) during the period 2000–2018 over Iran. AOD–dust spatial correlations from the MERRA-2 retrievals (d) and spatial correlations between the MODIS AOD and MERRA-2 dust (e). The black dots indicate that the trends or correlations are significant at a 95% confidence level (p < 0.05).
Remotesensing 15 00905 g006
Figure 7. Spatial distributions of the winter (DJF) linear trends of the MERRA-2 AE data calculated from the anomalies during the periods 2000–2018 (a), 2000–2010 (b), and 2010–2018 (c). The black dots indicate that the trend is significant at a 95% confidence level (p < 0.05).
Remotesensing 15 00905 g007
Figure 8. Spatial distributions of the winter (DJF) linear trends in the ERA5-derived sea level pressure and wind speed during the periods 2000–2010 (a) and 2010–2018 (b) and their correlations with the MERRA-2 AOD (c,d) from 2000 to 2018 over Iran. The black dots denote statistical significance of the trends and correlations at a 95% confidence level (p < 0.05). Only statistically significant wind trends (p < 0.05) are plotted in vectors.
Remotesensing 15 00905 g008
Figure 9. Spatial distributions of the winter (DJF) linear trends in the ERA5-derived surface temperature (ST) and total precipitation (TP) during the periods 2000–2010 (a,d) and 2010–2018 (b,e) and their respective correlations with the MERRA-2 AODs (c,f) calculated during the period 2000–2018. The black dots denote the statistical significance of the trends and correlations at a 95% confidence level (p < 0.05).
Remotesensing 15 00905 g009
Figure 10. Spatial distributions of the winter (DJF) linear trends in the ERA5-derived relative humidity (RH) and soil moisture (SM) during the periods 2000–2010 (a,d) and 2010–2018 (b,e) and their respective correlations with the MERRA-2 AODs (c,f) calculated during the period 2000–2018. The black dots denote the statistical significance of the trends and correlations at a 95% confidence level (p < 0.05).
Remotesensing 15 00905 g010
Table 1. Aerosol and meteorological data used in the present work.
Data TypeParametersDate Sources
Aerosol dataAerosol optical depth
Dust concentration
Angstrom exponent
MERRA-2
https://disc.gsfc.nasa.gov, accessed on 1 September 2020.
Aerosol optical depthMODIS
https://ladsweb.nascom.nasa.gov, accessed on 1 September 2020.
Aerosol optical depth
Fine mode fraction
Angstrom exponent
AERONET sites:
1. Solar Village (24.907°N, 46.397°E)
2. IABAS (36.705°N, 48.507°E)
https://aeronet.gsfc.nasa.gov, accessed on 1 October 2020.
Meteorological dataSea level pressure
Surface temperature
Surface wind speed
Surface relative humidity
Total surface precipitation
Soil moisture at surface
ERA5
https://ecmwf.int/, accessed on 1 October 2020.
Disclaimer/Publisher’s Note: The statements, opinions and data contained in all publications are solely those of the individual author(s) and contributor(s) and not of MDPI and/or the editor(s). MDPI and/or the editor(s) disclaim responsibility for any injury to people or property resulting from any ideas, methods, instructions or products referred to in the content.

