Article

On the Interplay between Desert Dust and Meteorology Based on WRF-Chem Simulations and Remote Sensing Observations in the Mediterranean Basin

1
National Research Council—Institute of Atmospheric Sciences and Climate (CNR-ISAC), 73100 Lecce, Italy
2
National Research Council—Institute of Atmospheric Sciences and Climate (CNR-ISAC), 88046 Lamezia Terme, Italy
3
National Research Council—Institute of Atmospheric Sciences and Climate (CNR-ISAC), 00133 Rome, Italy
4
Department of Information Engineering, Electronics and Telecommunications (DIET), Sapienza University of Rome, 00184 Rome, Italy
5
Department of Industrial Engineering and Mathematical Sciences, Università Politecnica delle Marche, 60131 Ancona, Italy
*
Author to whom correspondence should be addressed.
Remote Sens. 2023, 15(2), 435; https://doi.org/10.3390/rs15020435
Submission received: 16 November 2022 / Revised: 5 January 2023 / Accepted: 9 January 2023 / Published: 11 January 2023

Abstract

:
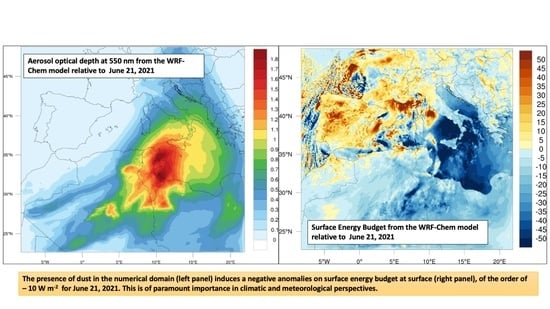
In this study, we investigate a series of Saharan dust outbreaks toward the Mediterranean basin that occurred in late June 2021. In particular, we analyze the effect of mineral dust aerosols on radiation and cloud properties (direct, semi-direct and indirect effects), and in turn, on meteorological parameters. This is achieved by running the Weather Research and Forecasting model coupled with Chemistry (WRF-Chem) over a domain covering North Africa and the Central Mediterranean Basin. The simulations were configured using a gradual coupling strategy between the GOCART aerosol model and the Goddard radiation and microphysics schemes available in the WRF-Chem package. A preliminary evaluation of the model performances was conducted in order to verify its capability to correctly reproduce the amount of mineral dust loaded into the atmosphere within the spatial domain considered. To this purpose, we used a suite of experimental data from ground- and space-based remote sensing measurements. This comparison highlighted a model over-estimation of aerosol optical properties to the order of 20%. The evaluation of the desert dust impact on the radiation budget, achieved by comparing the uncoupled and the fully coupled (aerosol–radiation–clouds) simulation, shows that mineral dust induces a net (shortwave–longwave) cooling effect to the order of −10 W m−2. If we consider the net dust radiative forcing, the presence of dust particles induces a small cooling effect at the top of the atmosphere (−1.2 W m−2) and a stronger cooling at the surface (−14.2 W m−2). At the same time, analysis of the perturbation on the surface energy budget yields a reduction of −7 W m−2 when considering the FULL-coupled simulation, a positive perturbation of +3 W m−2 when only considering microphysics coupling and −10.4 W m−2 when only considering radiation coupling. This last result indicates a sort of “superposition” of direct, indirect and semi-direct effects of dust on the radiation budget. This study shows that the presence of dust aerosols significantly influences radiative and cloud properties and specifically the surface energy budget. This suggests (i) that dust effects should be considered in climate models in order to increase the accuracy of climate predictions over the Mediterranean region and (ii) the necessity of performing fully coupled simulations including aerosols and their effects on meteorology at a regional scale.

Graphical Abstract

1. Introduction

Aerosols are one of the most important atmospheric forcing agents and largely contribute to the uncertainties in estimating global climate radiative forcing. They directly modify the radiation budget by absorbing and scattering short- and longwave radiation [1,2]. They also affect the properties and lifetime of clouds and therefore indirectly change the Earth-system balance. In fact, depending on their chemical composition and size, aerosol particles can act as cloud condensation nuclei (CCN) and ice nuclei (IN), deeply impacting the microphysical processes inside clouds. Consequently, aerosols can influence land surface processes, the global surface temperature, the climate, the hydrological cycle, and terrestrial ecosystems. Absorption of radiant energy by aerosols may lead to heating of the troposphere and the daytime cooling of the surface, which can change the relative humidity and atmospheric stability, further influencing cloud formation and precipitation. The balance between heating and cooling for a given aerosol type depends on the surface characteristics, and consequently, on the balance between the short- and longwave radiation that is scattered/absorbed by aerosols and clouds.
Among the aerosols of natural origin, mineral dust is one of the most important; in fact, it is the most abundant atmospheric aerosol component in terms of dry mass [3], the Sahara Desert being the largest source in Europe with an estimated emission range between 670 and 5650 Tg yr−1 [4,5]. The recent AEROCOM exercise [6] estimated a median total dust emission of 1640 Tg yr−1, highlighting, however, the great variability among models and thus relative uncertainty due to a large number of factors. This aspect should be considered when using bulk dust emission models. African dust from the Sahara Desert is lifted by strong near-surface winds and transported along four main trajectories patterns [7,8]. The largest fraction (60%) remains in Africa, being transported and deposited in the Sahelian countries along the well-known “meningitis belt” [9,10]. The remaining fraction is either transported westward across the Atlantic Ocean (about 25%, e.g., [11,12]), towards the Mediterranean Sea and Europe (about 10%) in episodic storms and/or following seasonal patterns [13,14,15,16,17] or transported eastward to the Middle East regions (about 5%).
In the last decade, the dust detection by remote sensing retrieval has registered an increase in spatial coverage, and satellite multiple detection channels have come to play important roles in dust source measurements. Dust scatters visible light and has a moderate absorption in the visible and near infrared region, it can also absorb longwave radiation from the ground and emit longwave radiation. Thus, these specific optical properties can be used in dust detection algorithms.
It is important to note that dust radiative effects become important under the high concentrations that may be recorded during specific events usually defined as “outbreaks”. Under these conditions a detailed description of dust in numerical weather prediction models is crucial [10,18]. This requires appropriate numerical simulations of the full dust cycle, from its emission at the surface, through the transport and processing in the atmosphere and interaction with clouds, to its removal by wet and dry deposition [19]. It consequently allows for a better understanding of dust intrusions and their effects on the radiation budget [20,21,22], cloud microphysics [23] and impacts at the ground, including those on air quality (e.g., [24,25]).
A consistent number of dust-related studies were produced using the Weather Research and Forecasting model coupled with Chemistry (WRF-Chem; [26]). This is an open-source package that is widely used to study atmospheric chemistry, air quality, and aerosols. The chemistry and aerosol packages are coupled online with the WRF-ARW core (Advanced Research WRF; [27]), allowing for the implementation of the couplings at different levels of sophistication. One of the most-used chemistry/aerosol packages in WRF-Chem is the Goddard Chemistry Aerosol Radiation and Transport (GOCART) module [28]. It simulates major tropospheric aerosol components, like sulfate, black and organic carbon, mineral dust, and sea-salt, and it includes algorithms for dust [8,29] and sea salt emissions [30,31,32], dry and wet deposition, and gravitational settling [19].
The direct and indirect aerosol effects have often been evaluated separately and independently, but it is important to assess their combined impact given the complex nature of their effects on radiation and convective clouds. To this purpose, an aerosol–microphysics–radiation coupling package, including Goddard microphysics [33,34] and radiation schemes [35], was implemented into the NASA Unified Weather Research and Forecasting model (NU-WRF; [36]) and made available for the whole WRF-community. The microphysics and radiation schemes have been coupled with the aerosol fields forecasted by GOCART in WRF-Chem to account for the aerosol direct (radiation) and indirect (cloud microphysics) effects. One of the first applications of this coupled system was made by Shi et al. [37], who investigated a mesoscale convective system (MCS) that passed through the Niamey area (Niger) in August 2006. That study showed that rainfall was reduced when aerosol indirect effects were included, regardless of the aerosol direct effect.
Some previous studies examined the impact of desert dust on mesoscale phenomena, but they had relatively short durations (to the order of 1 week or even less). Among them, we may cite Kumar et al. [38], which used an WRF-Chem model to study the influences of a typical pre-monsoon dust storm in northern India on aerosol optical properties and radiation budget; Gkikas et al. [39] utilized the NMMB-MONARCH model [10] to investigate the direct radiative effects of dust during intense Mediterranean desert dust outbreaks; Mamun et al. [40] used WRF-Chem to study the radiative and cloud microphysical effects of Saharan dust over the tropical East Atlantic Ocean.
The aim of this work is to study a series of pulsed outbreaks of dust plumes from the Sahara Desert toward the central Mediterranean which occurred in June 2021, focusing on their impact on radiation and cloud properties. This is evaluated using a gradual coupling strategy between the GOCART aerosol model and the Goddard radiation and microphysics schemes in the WRF-Chem model. The objective is to evaluate the overall dust radiative effects that take place through three processes of increasing complexity, namely direct, semi-direct and indirect. These processes modify the energy budget at the surface, in the atmosphere and at its top [39].
The manuscript has been organized in two parts: the first is dedicated to evaluating the reliability of the simulated dust concentration field within the domain of investigation, and the second part to the analysis of the impact of mineral dust on radiation by separately considering the three processes mentioned above.

2. Materials and Methods

2.1. Model Setup and Design

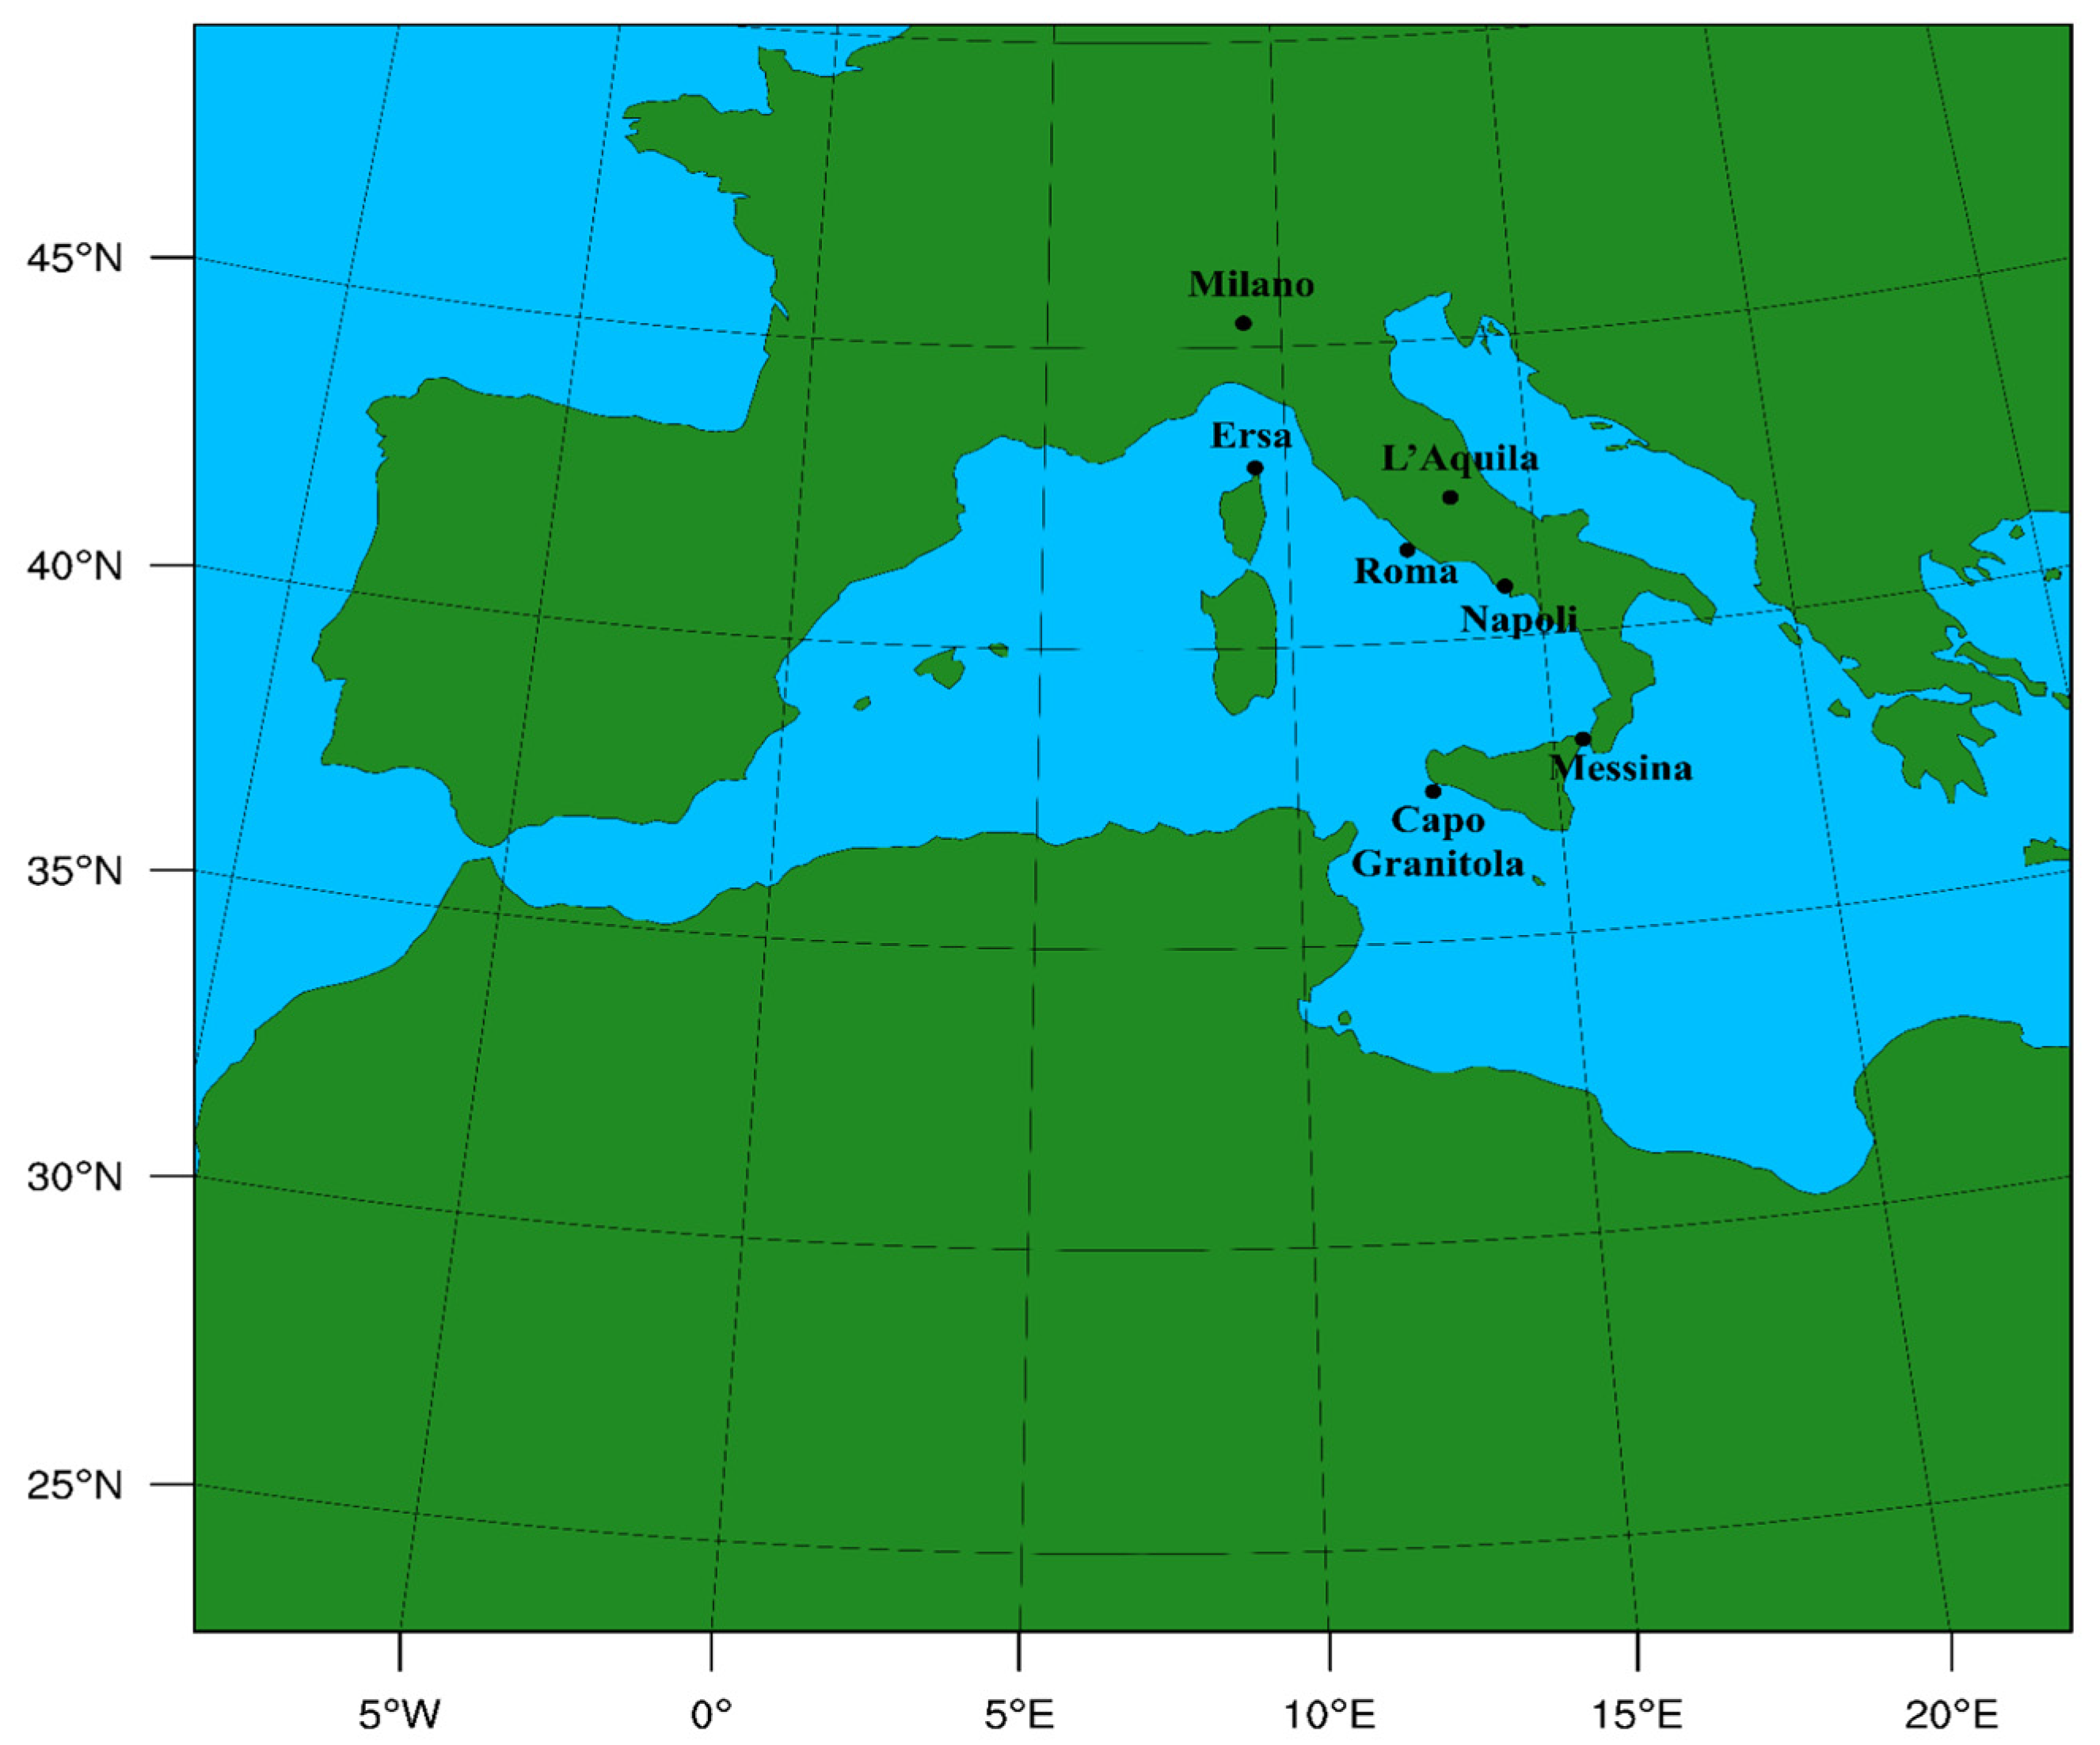
For this study, the WRF-Chem model version 4.3.1 was used. The target domain covered the northern Sahara Desert and the central Mediterranean (Figure 1) with 320 × 300 points and a horizontal grid spacing of 10 km. The simulation started on 17 June 2021 (00:00 UTC) and ended on 25 June 2021 (00:00 UTC); the initial and boundary conditions are provided by NCEP-FNL (Final) operational global analysis/forecast fields (0.25°) [41].
Based on the WRF setup recommended by Shi et al. [37], the following physics parameterizations are adopted (Table 1): Mellor–Yamada–Janjic Scheme (MYJ) parameterization [42] is used to describe the planetary boundary layer (bl_pbl_physics = 2), with the surface layer (sf_sfclay_physics = 2) Eta similarity scheme [42].
The Noah-MP land surface model (sf_surface_physics = 4) was chosen to represent the land surface processes [43]. Four-dimensional data assimilation (FDDA) schemes based on analysis nudging (grid_fdda = 1), as described by Stauffer and Seaman [44], were utilized to account for large-scale forcing on the Mediterranean basin as recently reported by Rizza et al. [45]. This last work has also demonstrated, through the use of statistical metrics, how 10 m wind speeds and 2 m temperatures are quite sensitive to the parameterization of the surface layer, the land surface model, and the grid nudging parameters.
The Goddard coupling strategy between the aerosol field forecast from the GOCART model (chem_opt = 300) and the radiation and microphysics is defined by two namelist variables, as reported in Table 2. Namely the variables “gsfcrad_gocart_coupling” and “gsfcgce_gocart_coupling” account, respectively, for the direct and semi-direct radiative aerosol effects and the indirect effects on cloud microphysics.
In the current coupling, the radiative schemes are parameterized using the Goddard radiation model [35] for both shortwave (ra_sw_physics = 5) and longwave (ra_lw_physics = 5) radiation. In this context, all 14 GOCART aerosol species (Table 3) are used to calculate specific optical properties like aerosol optical depth (AOD), single scattering albedo (SSA) and asymmetry factor (AF) in order to evaluate the dust-induced radiative forcing [35,46]. This is realized in WRF-Chem by a specialized routine (aero_opt.F) designed to convert aerosol mass into aerosol single-scattering optical properties. These radiation schemes also consider the scattering properties of snow, graupel, and rain. Concerning the microphysics parameterization, a new one-moment Goddard four-class ice (4ICE) has been developed [34] and implemented in the WRF package starting from version 3.4.1 (mp_physics = 7). This 4ICE scheme has prognostic variables for cloud ice, snow, graupel, and hail.
The aerosol setup considers the hybrid bulk/sectional GOCART model [47]. It consists of seven bulk aerosol species, namely organic carbon (OC1, OC2), black carbon (BC1, BC2), other GOCART primary species (PM2.5, PM10), sulfate (only secondary aerosol species), and three natural aerosol sectional species: mineral dust, sea spray, and volcanic ash (Table 3). In particular, the Air Force Weather Agency (AFWA) dust emission scheme (dust_opt = 3) implemented in WRF-Chem [29] considers five dust size bins with mean effective diameters of 1.1, 2.8, 4.8, 9.0, and 16.0 μm. Dust emissions are surface wind speed-dependent, and the other aerosol species are prescribed from emission inventories and elaborated with the PREP-CHEM-SRC emission preprocessor package [48]. A detailed description of the AFWA dust emission scheme is provided by Ukhov et al. [19], LeGrand et al. [29], and Rizza et al. [32]. It is important to point out that, in this parameterization, dust emission is controlled by the saltation of larger particles that are triggered by wind shear at the surface, leading to the emission of smaller particles by saltation bombardment.
Usually, the feedback of aerosols on cloud microphysics are included by considering spectra-bin [49] or two-moments microphysics [50], introducing additional prognostic variables, namely CCN (cloud condensation nuclei) and IN (ice nuclei). In the 4ICE scheme, both CCN and IN are conversely diagnostic parameters calculated from the WRF-Chem under the GOCART aerosol model (chem_opt = 300). Wet deposition is calculated using large-scale model precipitations but not handled by cloud microphysics (no wet scavenging). CCN are calculated at a given temperature and supersaturation from the 14 aerosols species based on the Koehler curve [51], while the concentration of IN comes from the Demott et al. [52] formulation.
As depicted in Table 2, the Goddard coupling strategy leads to four different configurations of the WRF-Chem model. In particular the ‘control’ (CTL) configuration represents the uncoupled run, in which aerosols, radiation, and microphysics are not linked. In the full coupling configuration (FULL) these quantities are fully coupled.
Two intermediate configurations (RAD and MP) allow for discriminating the impact of including aerosol-radiation and aerosol-microphysics feedbacks, respectively.
In the Goddard SW and LW radiation schemes, all 14 GOCART aerosol species are used to calculate the aerosol optical properties, namely the aerosol optical thickness, single-scattering albedo, and asymmetry factor. The aerosol species are grouped according to the scheme reported in Table 3; this allows for the estimation of dust-induced radiative heating [35,46]. This radiation module also considers the single-scattering properties of snow, graupel and rain [37]. The aerosol optical properties are calculated using a parameterization of Mie Theory [19] and considering the aerosol size distribution and refractive index. The AFWA emission routine is actually based on a fixed size distribution with the following weights of the five dust size bins: 0.1074, 0.1012, 0.2078, 0.4817, and 0.1019. The refractive index for dust is wavelength dependent for the LW component and constant for the SW component (1.533 + 0.003 i).

2.2. Ground and Space-Based Observations and Model-Based Datasets

2.2.1. Satellite

Various satellite-based datasets have been used in this work. The primary aerosol-related quantity derived by satellite is the aerosol optical depth (AOD), which measures the amount of radiation (generally in the visible spectral range) lost due to the presence of aerosols on a vertical path through the atmosphere. Additionally, a thermal emissive dust index (TEDI; [53]) may be calculated by considering the brightness temperature (BT) of infrared channels. The results showed that TEDI had high consistency with AOD and can be used as a good proxy for AOD at 0.55 μm for dust intensity monitoring [53,54,55].
In this work we use the AOD derived from the MODerate-resolution imaging spectroradiometer (MODIS; [56]) instrument onboard the NASA/Aqua spacecraft. It has 36 wavelength bands spanning from the visible to the infrared, high spatial resolution, and near-daily global coverage with an Equator overpass time at 13:30 LT.
The MODIS multi-angle implementation of atmospheric correction (MAIAC) is a recent algorithm elaborated in order to improve the spatial resolution and accuracy of cloud detection, aerosol retrievals and atmospheric correction [57,58]. It provides a collection of atmospheric and surface products in hierarchical data format for the NASA Earth Observing System (HDF4_EOS), including daily averaged atmospheric and aerosol properties (https://lpdaac.usgs.gov/tools/earthdata-search/, accessed on 3 June 2022).
The Clouds and the Earth’s Radiant Energy System (CERES) project provides satellite-based observations of Earth’s radiation budget (ERB) and clouds. We use level 3 products at SYN1deg resolution (regional grid, 1 × 1° latitude by longitude) of the hourly gridded observed TOA Fluxes [59].
The visible infrared imaging radiometer suite (VIIRS) is onboard the Suomi NPP (National Polar-orbiting Partnership) and the NOAA joint polar satellite system (JPSS) spacecrafts. VIIRS covers the spectrum between 0.412 and 12.01 μm with 22-spectral bands. The brightness temperature used here was downloaded from the NOAA-CLASS web portal at https://www.avl.class.noaa.gov/saa/products/welcome (accessed on 20 March 2022). The brightness temperature of the thermal infrared channels has been widely used in investigating dust storm [55,60] and volcanic ash modeling [61,62]. From the thermal emissive bands (TEB) of the VIIRS sensor onboard the JPSS-1 spacecraft, it is possible to determine the modified TEDI following the Madhavan et al. [55] algorithm as follows:
T E D I = C 0 + C 1 B T 20 + C 2 B T 29 + C 3 B T 31 + C 4 B T 32
where BT denotes the MODIS brightness temperature at 3.78 μm (BT20), 8.56 μm (BT29), 11.03 μm (BT31) and 12.04 μm (BT32); matching with the VIIRS thermal bands is reported in Table 4 [63].
The coefficients (C0–C4) in Equation (1) are obtained by fitting MODIS and VIIRS TEB as described by Madhavan et al. [55] and reported in Table 5.

2.2.2. Ground-Based Passive Remote Sensing by the Aeronet Network

AERONET (AErosol RObotic NETwork; [64]) is a federation of ground-based sun photometers currently led by the US NASA and the French CNRS (National Centre for Scientific Research). It includes more than 1000 sun photometers spread worldwide, whose data are elaborated following the same procedure for all stations [65].
The relevant data are available in quasi-real time through an open web portal (http://aeronet.gsfc.nasa.gov (accessed on 20 March 2022)) maintained by NASA. In this work data from five AERONET stations within the investigated domain are used (Table 6).

2.2.3. Ground Based Active Remote Sensing by the ALICEnet Network

ALICEnet (automated lidar-ceilometers network; https://www.alice-net.eu/ (accessed on 20 March 2022)) is the Italian network of automated lidar-ceilometer (ALC) systems operationally (24/7) monitoring aerosol profiles and clouds [66]. It contributes to the wider European E-PROFILE EUMETNET program (https://www.eumetnet.eu/activities/observations-programme/current-activities/e-profile/ (accessed on 20 March 2022)). The geographical distribution of the ALICEnet systems, from north to south across the country, allows for the investigation of aerosol and cloud properties over a wide range of atmospheric and environmental contexts. These include areas affected by major anthropogenic emissions, such as the Po valley [67,68,69,70,71], and large urban centers (e.g., [72,73]), as well as by advection episodes of biomass burning, volcanic ash and desert dust [74,75]. ALICEnet is a cooperative network coordinated by CNR-ISAC (https://www.isac.cnr.it/en (accessed on 20 March 2022)) with collaboration from several Italian regional environmental protection agencies (i.e., ARPAs), universities and research centers. A homogeneous instrumental set up (most of the current Alicenet systems are Lufft CHM15K ceilometers operating at 1.064 μm) and a centralized data processing, including data quality controls and the retrieval of aerosol optical and physical properties, provides four-dimensional, quantitative information on aerosol properties across the country. In this work, we employed ALC raw data collected from the four ALICEnet sites in Rome, Messina, Milan and Capo Granitola (Figure 1) in order to derive aerosol extinction at 1.064 μm. The data inversion procedure includes a signal pre-processing (overlap correction and Rayleigh calibration [66], followed by a corrected and calibrated signal processing based on the forward solution of the Klett inversion algorithm [76]. In this step, the required extinction-to-backscatter ratio (i.e., the lidar ratio, LR) is not fixed a-priori, but instead is kept variable and based on a specifically developed numerical model to link aerosol backscatter and extinction [66,77], so that no specific assumption on the aerosol type is necessary. In this work, in order to be compared to AERONET data and model outputs, ALC-based AOD at 0.55 μm is also derived from the AOD values retrieved at 1.064 μm (this being obtained integrating the aerosol extinction along the atmospheric profile). This is achieved based on the Angstrom exponents obtained by the co-located sun photometers, i.e., taking into account the site-specific observed spectral variability of the AOD.

2.2.4. Reanalysis

Global reanalysis fields are also taken into account in this work in order to carry out further comparisons of the simulated meteorology by WRF-Chem. In particular, we used the global climate monitoring ECMWF ReAnalysis dataset (ERA5; [78,79]) available hourly on regular (lat-lon) grid (0.25 × 0.25°) resolutions on 37 pressure levels or on a single level for the surface parameters. The fields considered here are U and V wind components at 10 m with temperatures at 500 and 900 hPa. The choice to use the ECMWF fields allows us to compare WRF-Chem outputs with a dataset not dependent on the simulations themselves (and on the adopted initial and boundary conditions).
Additionally, we use the reanalysis from the Modern-Era Retrospective analysis for Research and Applications, Version 2 (MERRA-2 project; [80]). The aerosol data assimilation system on MERRA-2 is based on an analysis-splitting technique utilized to assimilate AOD at 0.55 μm considering the following sources: (i) reflectances from the Advanced Very-High-Resolution Radiometer (AVHRR) sensor (1979–2002); (ii) reflectances from the MODIS on Terra (2000–present) and Aqua (2002–present); (iii) AOD retrievals from MISR (2000–2014); and (iv) AOD measurements from AERONET (1999–2014). MERRA-2 data collections map identically into similarly named files, as described by Rienecker et al. [81]. The field considered here is the period-averaged (17–24 June 2021) surface sensible heat flux.

2.2.5. Statistical Evaluation Tool

For the statistical evaluation of the data, we used specific built-in functions of the NCAR command language (NCL: http://dx.doi.org/10.5065/D6WD3XH5 (accessed on 20 March 2022)). In particular, in order to compare model outputs versus reanalysis on the whole (or a portion of the) numerical domain, we used the “wgt_arearmse” function, which allows for computing a weighted area root-mean-square difference between two variables using two-dimensional weights. Another function utilized in this work is the “wgt_areaave”, which calculates the area average of a quantity using weights. This NCL function is very useful in defining the average value of any variable over the numerical domain.

3. Results and Discussion

3.1. Dust Event Description by Satellite Observations

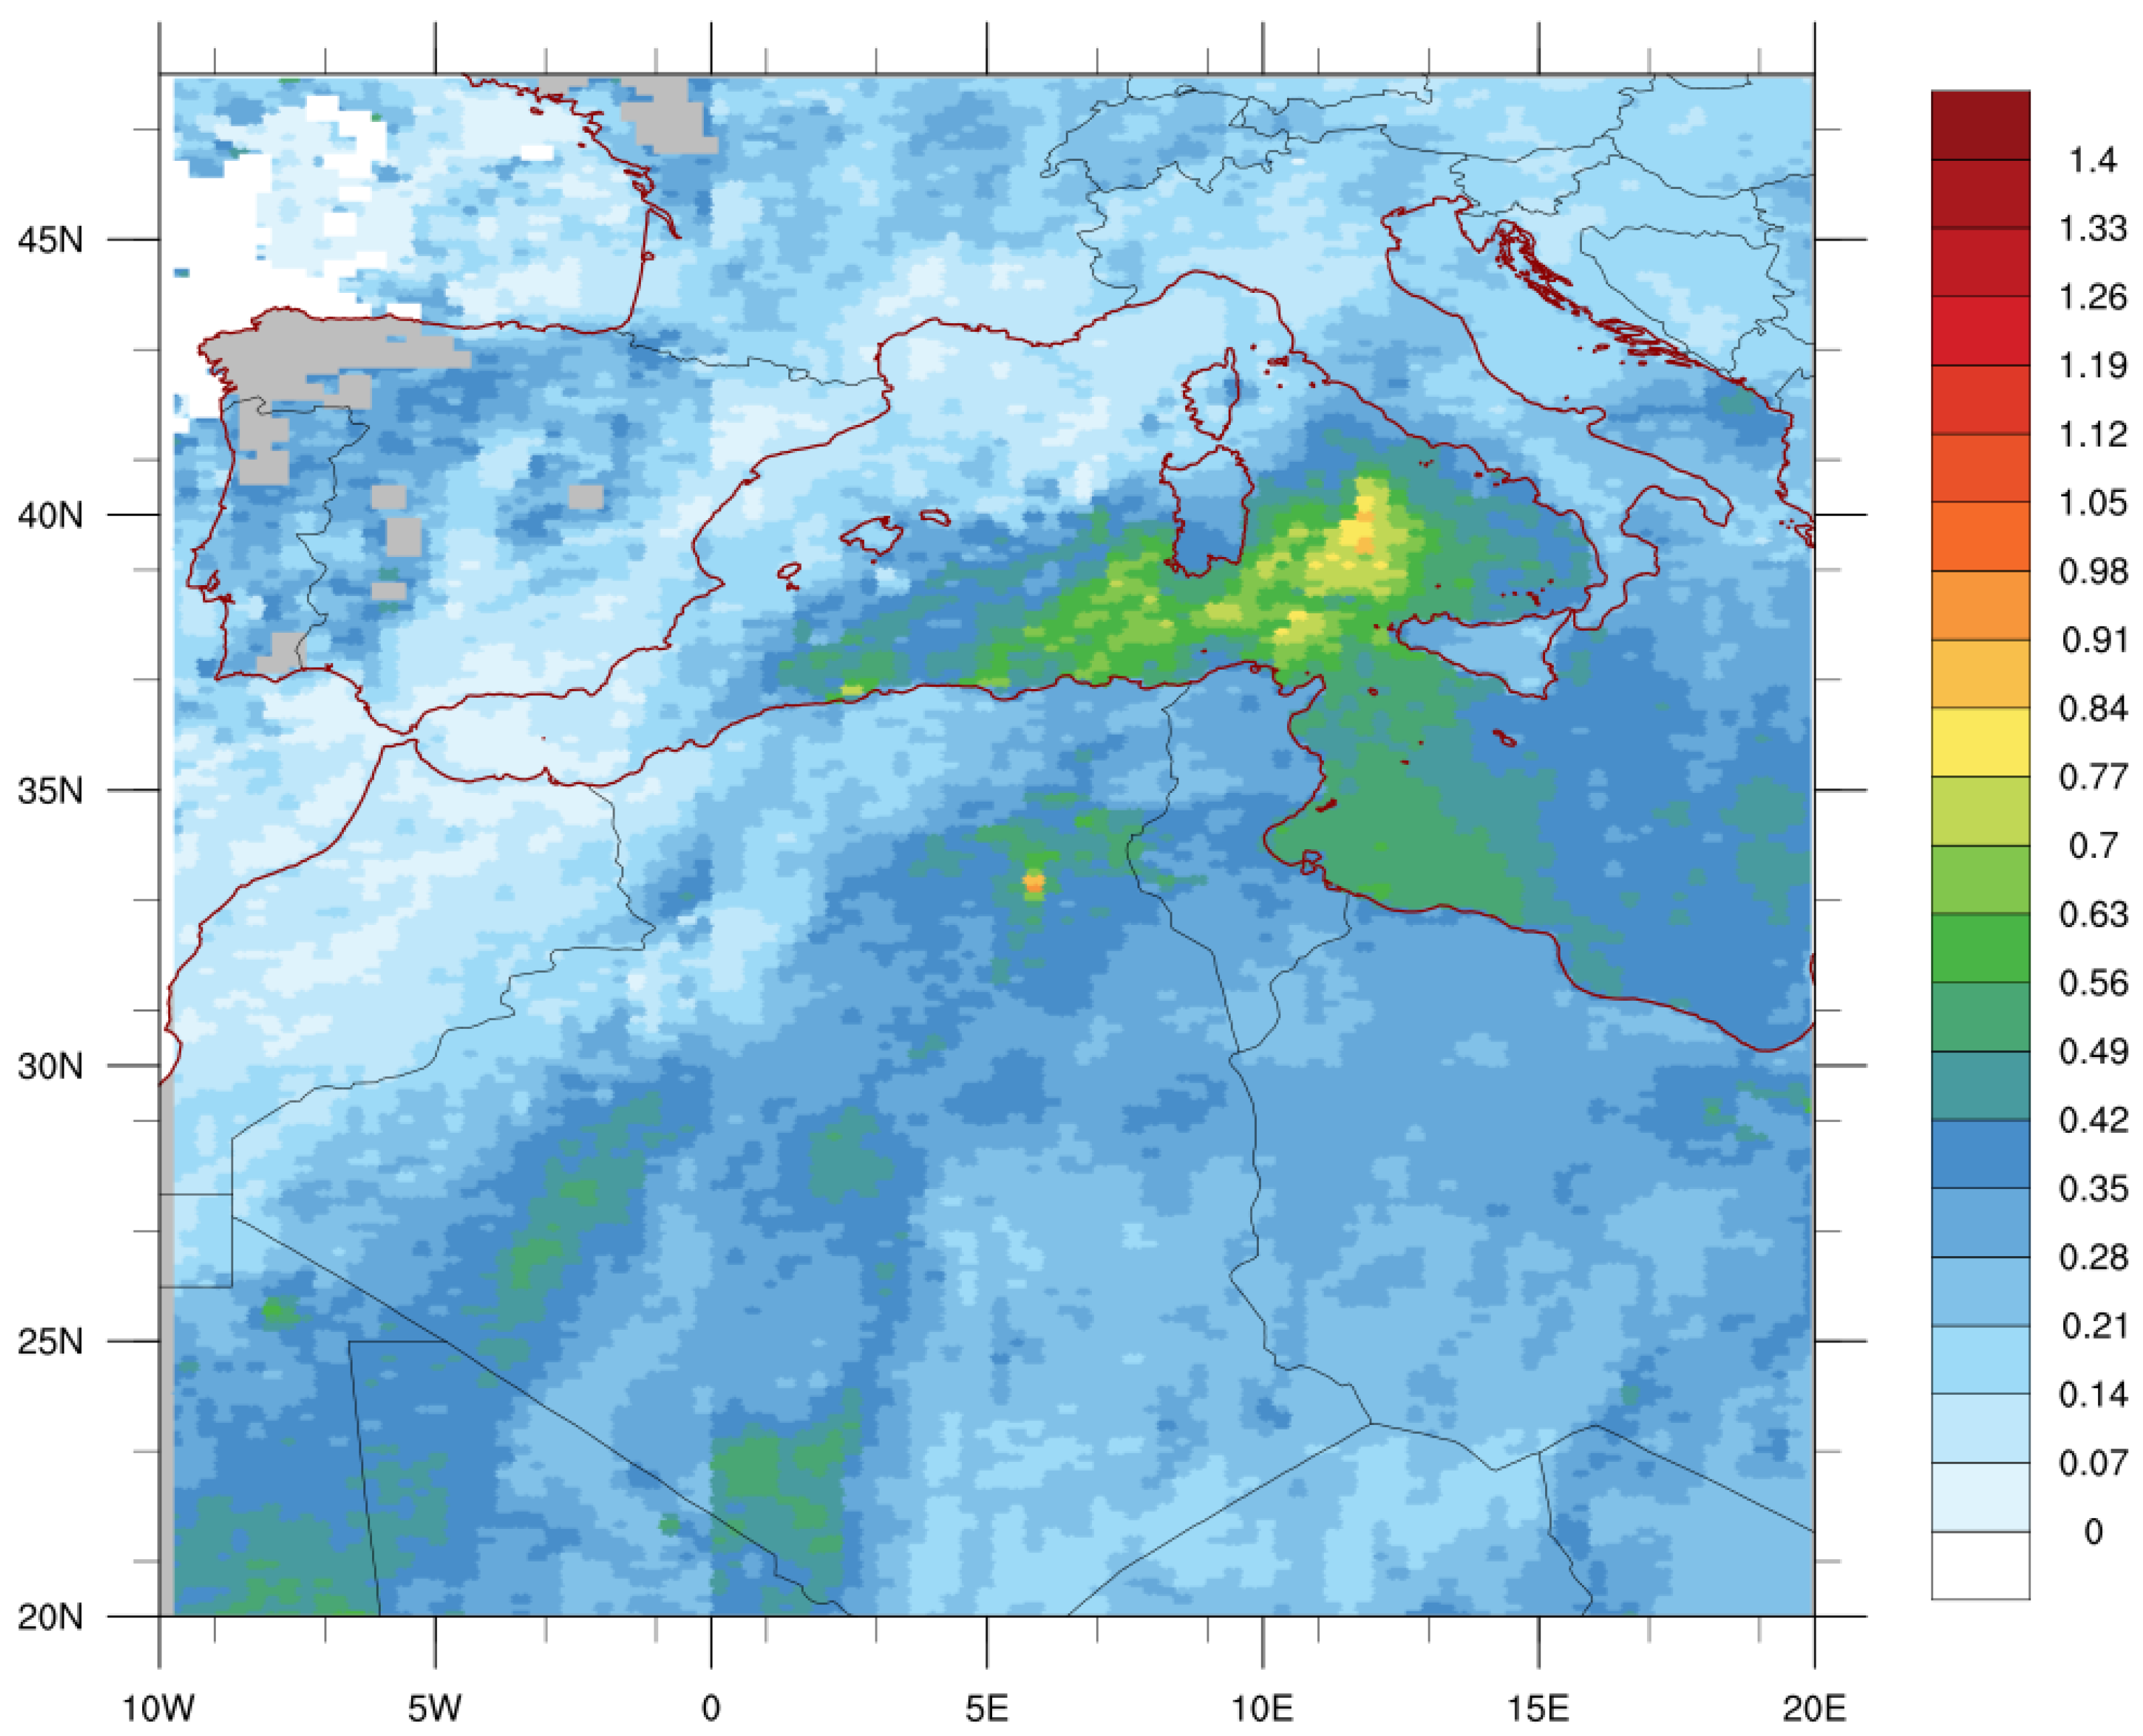
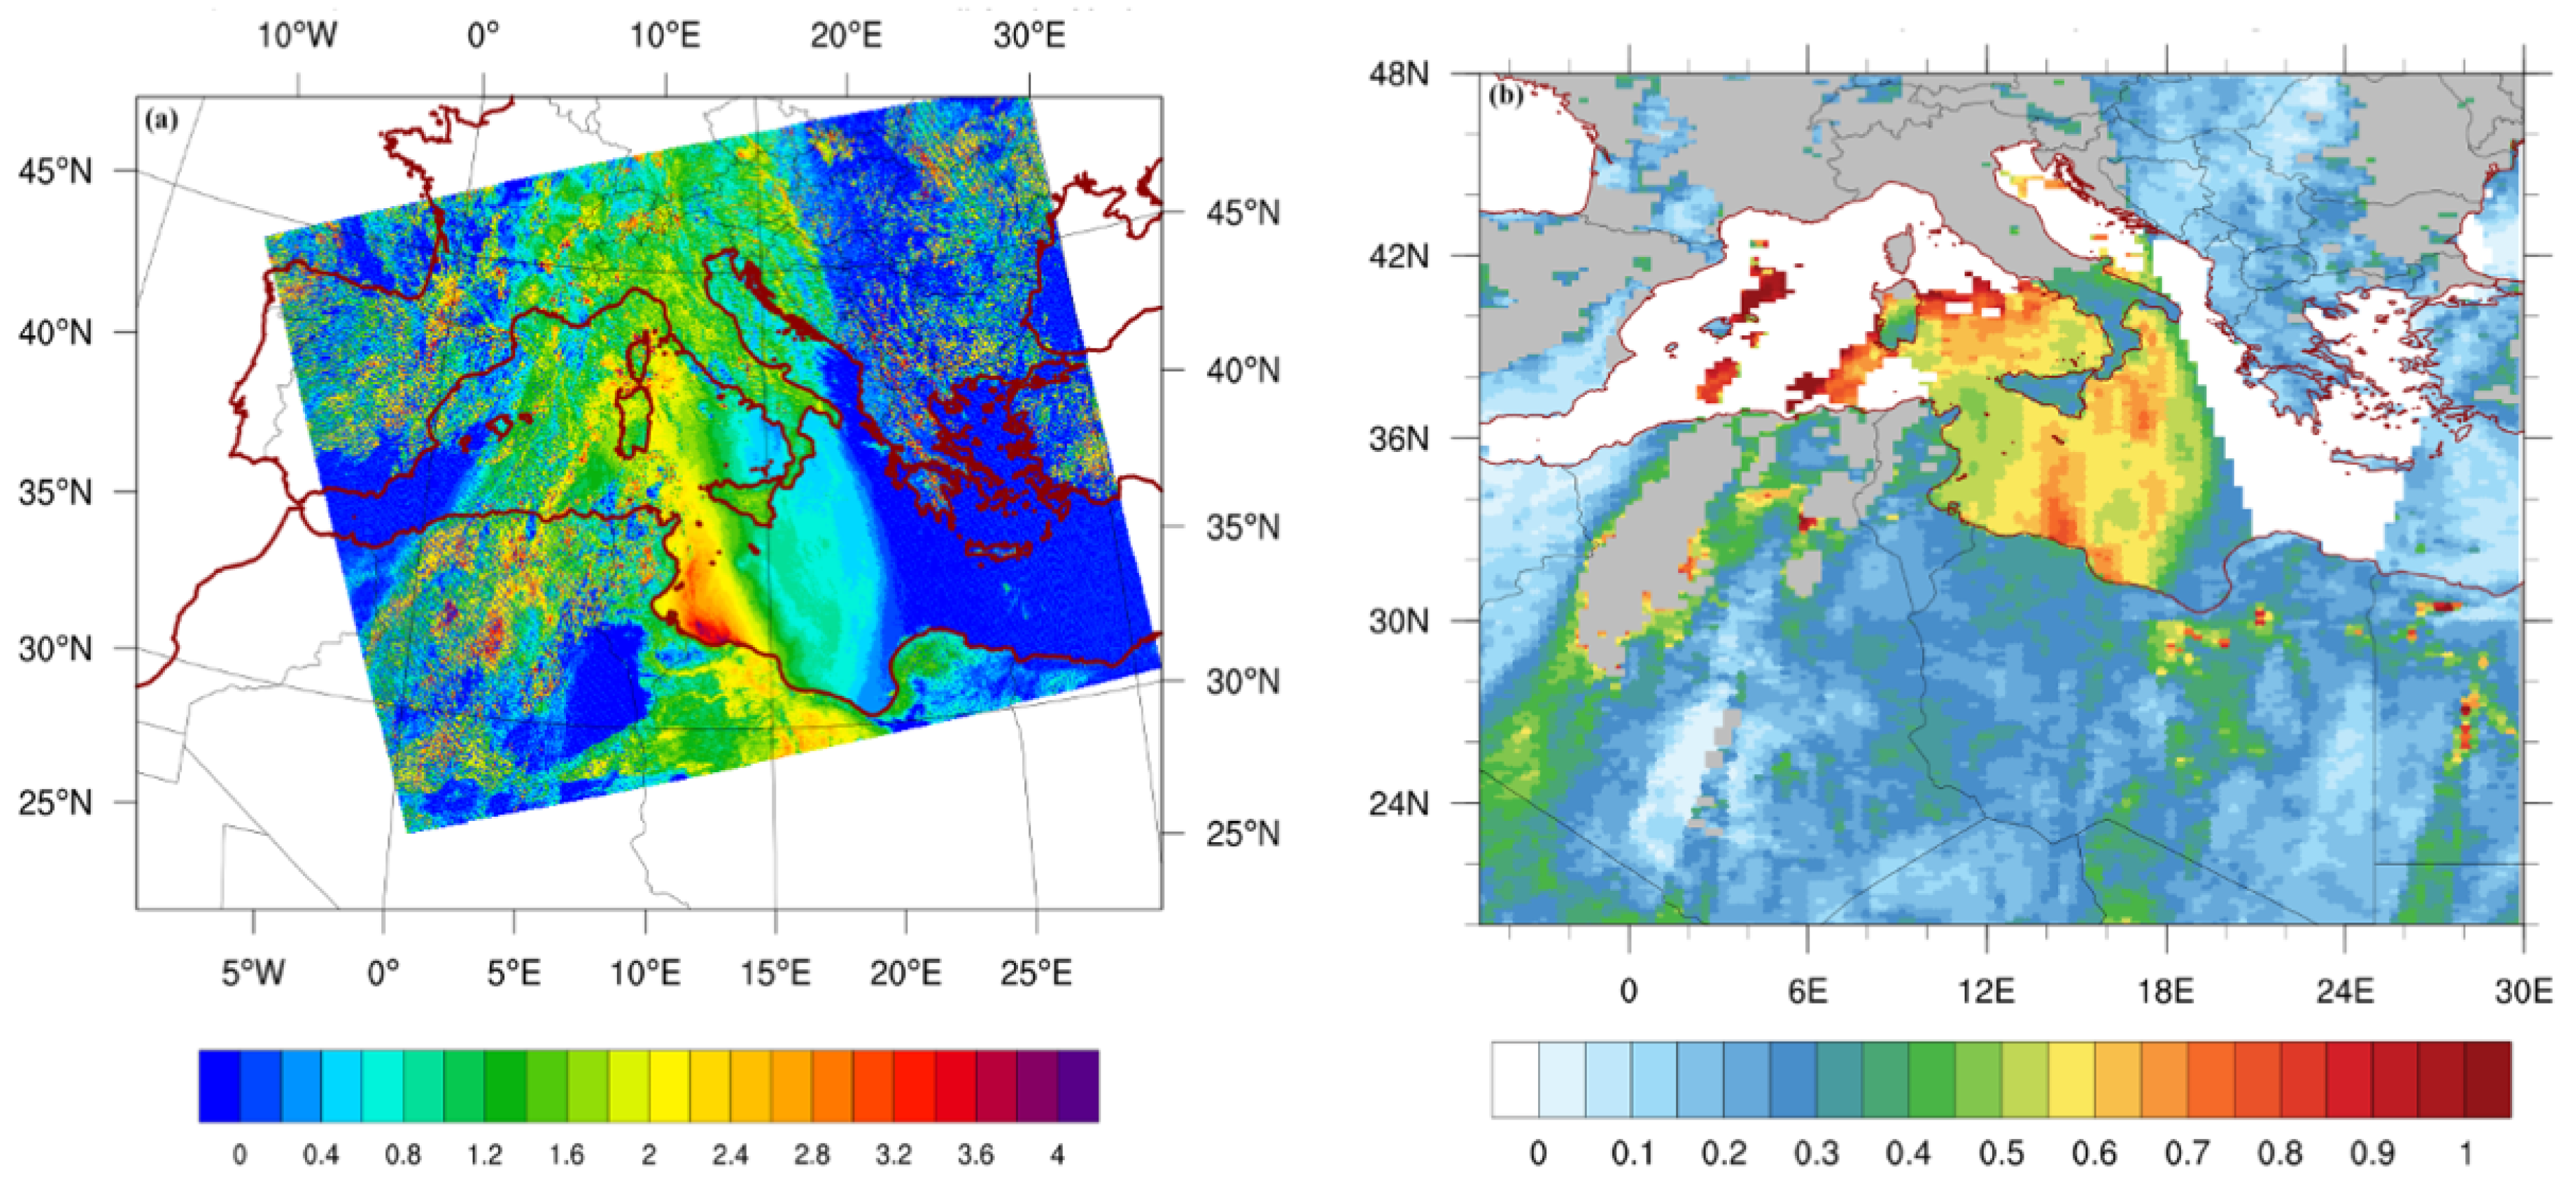
The synoptic analysis (see also next Section 3.2) corresponding to the desert dust transport event reveals the presence of two upper-level troughs over Europe, the first localized south of the UK and the second over the Black Sea region, with a consequent wide upper-level ridge dominating the synoptic circulation over North Africa and the southern Mediterranean. This omega-like structure favors the predominance of southwesterly currents from Africa to the central Mediterranean [82]) and the corresponding intrusion of dust plumes from the Sahara Desert. This is confirmed by the aerosol field in Figure 2, which shows the period averaged (17–24 June 2021) AOD at 0.55 μm from the MODIS/MAIAC algorithm at 1 km resolution [57].
Figure 2 clearly shows the presence of high aerosol loads in the central Mediterranean basin, with AOD values at 0.55 μm up to 1. This means that during the investigated period (17–24 June 2021), dust plumes were persistent over the central Mediterranean regions.
As shown later on, this is in fact the result of a sequence of dust intrusions in the addressed period. The most intense one occurred on 20 June in the middle of the day (see Section 3.3). The NOAA-20 (JPSS-1) spacecraft had a useful orbit over Italy on that date, with a granule time from 12:05 to 12:09 UTC. Figure 3a shows the TEDI [Equation (1)], elaborated using the brightness temperature of the M12, M14, M15 and M16 VIIRS channels (from the NOAA Comprehensive Large Array-data Stewardship System, CLASS—https://www.avl.class.noaa.gov/saa/products/welcome (accessed on 20 March 2022)). The intrusion can be seen through the TEDI ranging from 0.5 (cyan) to 3.6 (red). The area of higher TEDI values (>2) is clearly visible, extending from the northern coasts of Libya to the Sicily Channel up to the Tyrrenian coasts of Central Italy. This is confirmed by the averaged MAIAC/AOD spatial pattern (Figure 3b), which, being calculated in the visible spectrum (0.55 μm), is partly obscured by the cloud coverage.

3.2. Synoptic Analysis and WRF Mesoscale Assessments

Synoptic features during the event were studied throughout the NCEP-FNL (Final) operational global analysis/forecast fields (0.25°), the same adopted for the WRF-Chem initial and boundary conditions.
Large-scale analysis reveals a stationary synoptic configuration for the whole study period (from 17 to 24 June 2021); for the sake of conciseness, we show the synoptic maps only for the central (and most significant) days of the dust event.
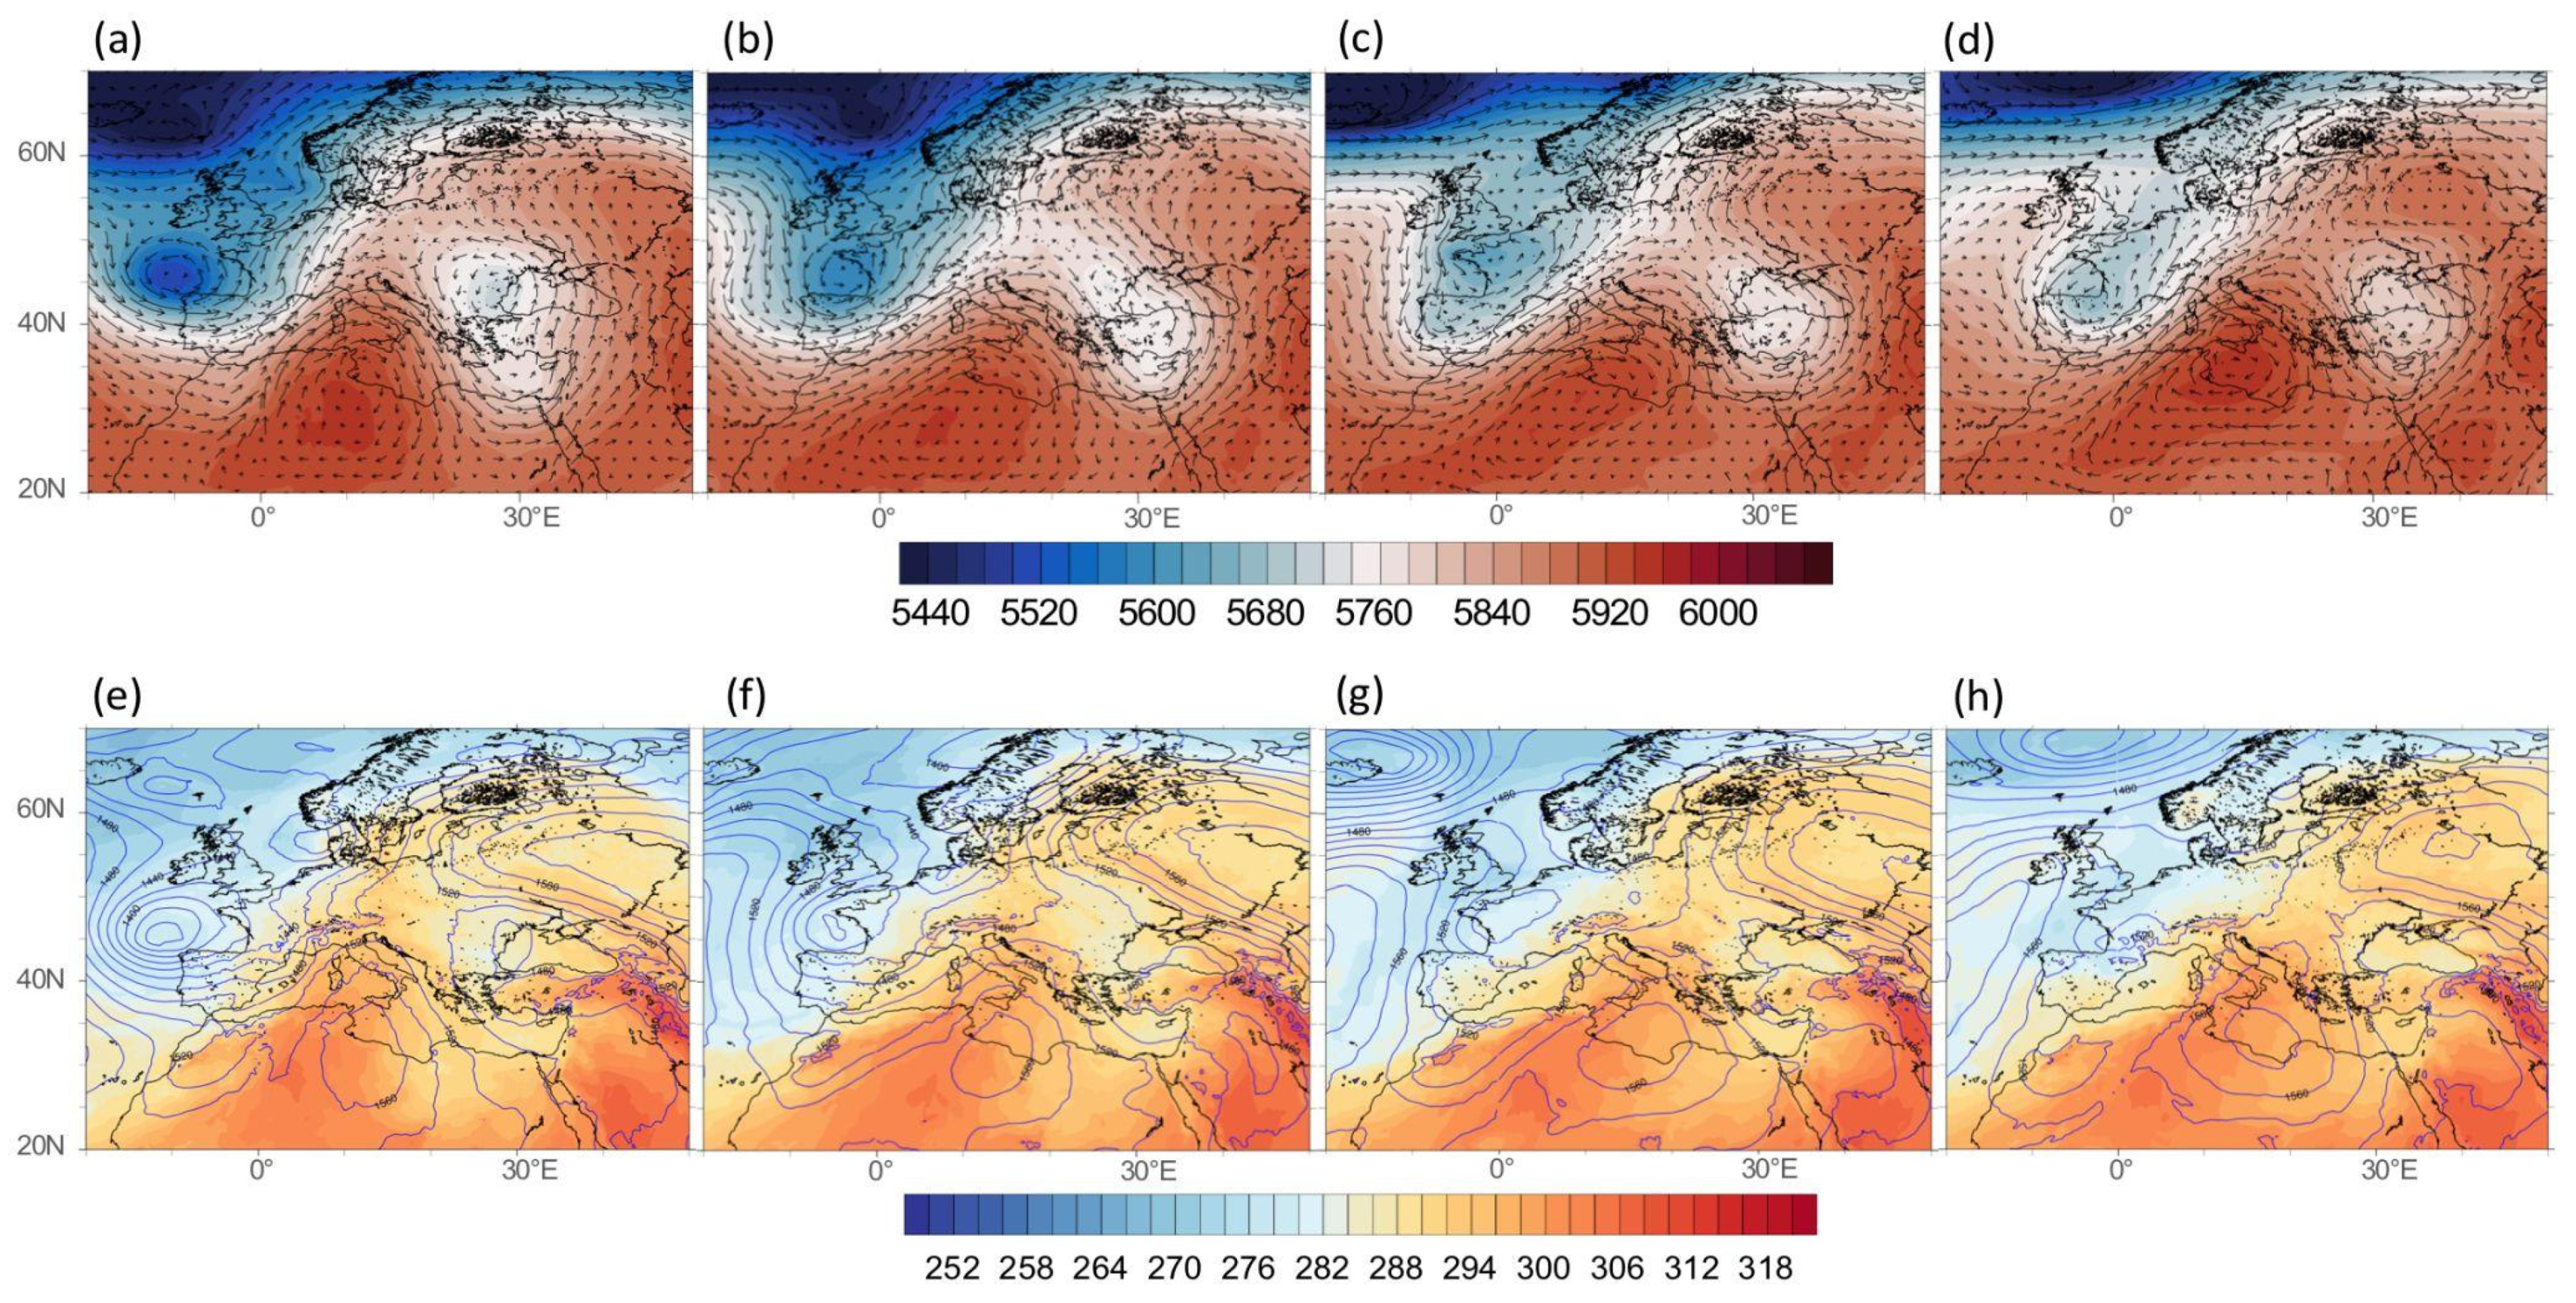
In Figure 4 upper panels show the geopotential height and the wind vectors at 500 hPa for 20 (Figure 4a), 21 (Figure 4b), 22 (Figure 4c) and 23 (Figure 4d) June at 12:00 UTC; while bottom panels (Figure 4e–h) show corresponding maps of temperature. The simulated fields refer in this case to the (uncoupled) CTL WRF-Chem temperature and geopotential height (contours) at 850 hPa.
As anticipated, two upper-level troughs are clearly visible south of the UK and over the Black Sea regions (Figure 4a–d), respectively; between these two patterns, a wide upper-level ridge dominates North Africa and the southern Mediterranean. This structure persists for the whole period addressed (17–24 June, not shown).
The described configuration is a typical blocking pattern (blocking high). The ‘omega’ structure stays in place for a relatively long period, allowing air masses from North Africa to reach large areas of Europe. The zonal upper-level flows while approaching the Mediterranean are deflected by the ridge, whose axis is inclined in the SW-NE direction, and persistently hit the Italian Peninsula, transporting hot air masses from Africa over the Mediterranean basin.
This situation is confirmed also at lower levels (Figure 4e–h; 850 hPa maps). The geopotential height contours identify two lows, almost in the same positions of the mid-tropospheric maps, and a wide high-pressure area over North Africa, responsible for the transport of warm air (see reddish colors in Figure 4, bottom panels) in central-southern Italy. From the maps depicted in Figure 4e–h, the progressive deepening/eastward shifting of the North African high on the southern Mediterranean basin, south of Sicily, it is also visible. In this position, the anticyclone is more effective in drawing the currents from the central-northern regions of the Sahara Desert toward central-southern Italy.
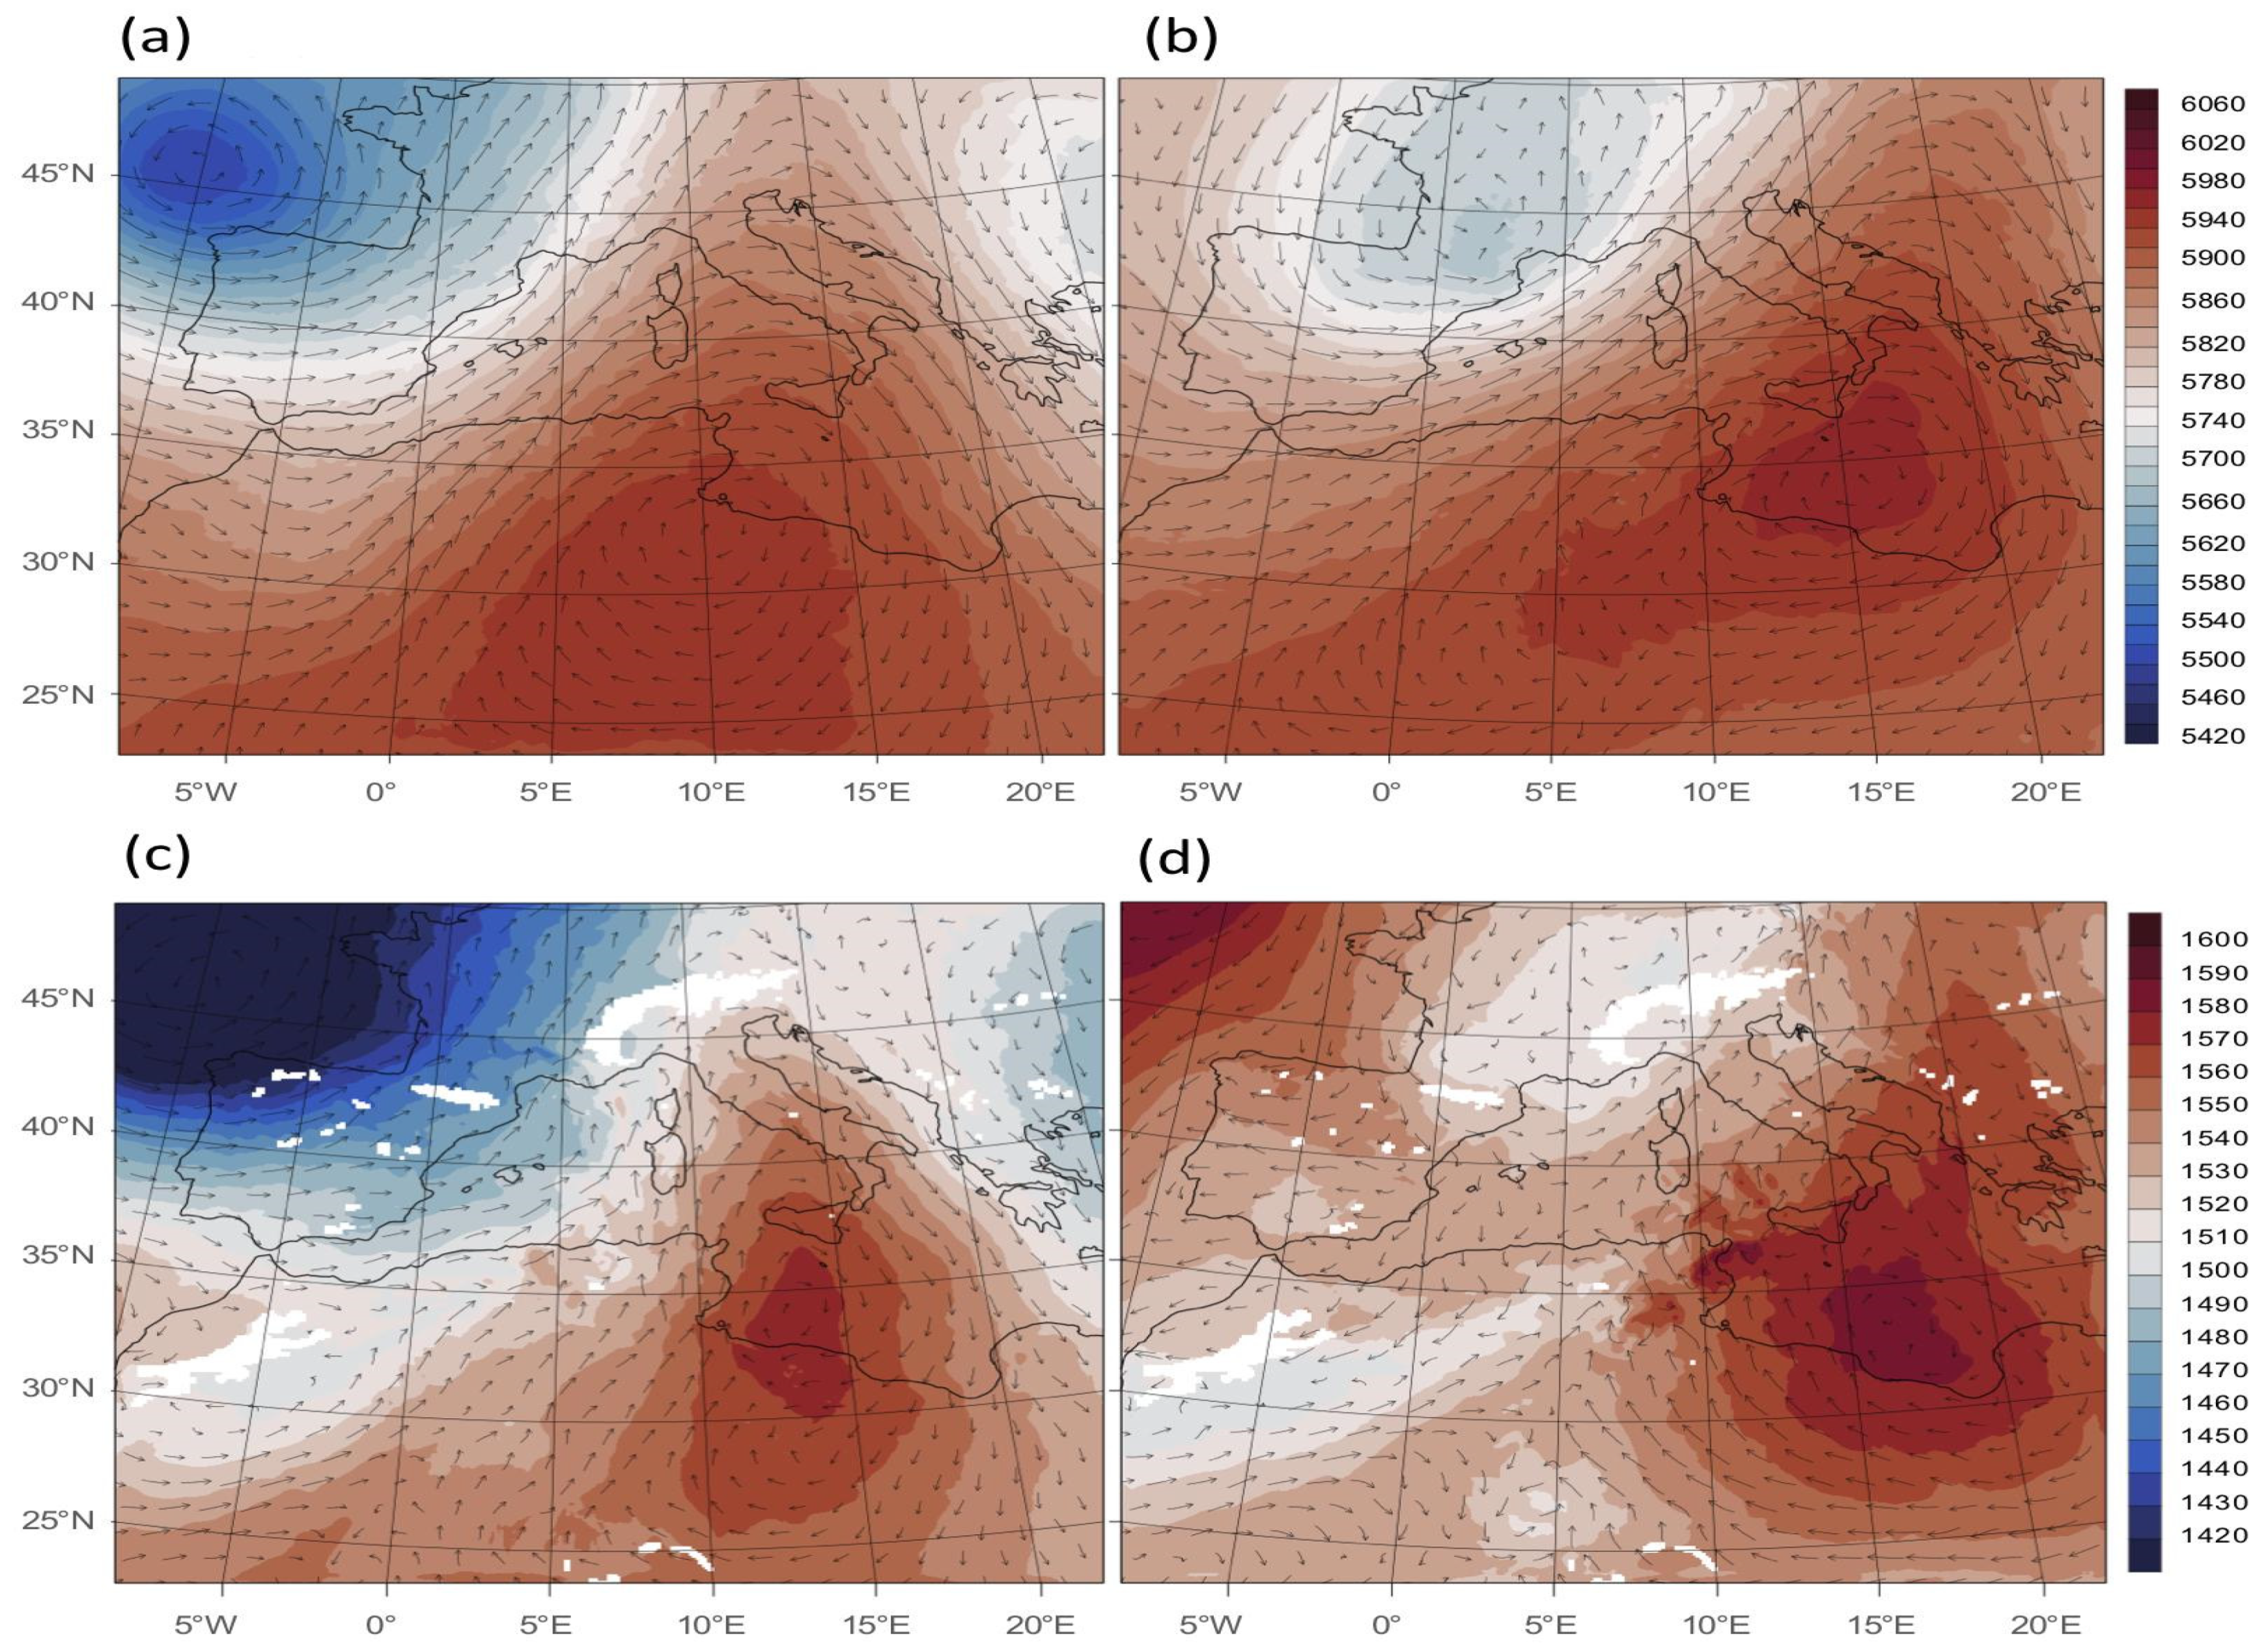
With the aim of better assessing the main meteorological features in the Mediterranean during the dust episode, we report in Figure 5a–d the geopotential height and the wind vectors at 500 hPa (upper panels) and 850 hPa (bottom panels), for 20 June at 12:00 UTC (left panels) and for 24 June at 00:00 UTC (right panels). The simulated fields refer, in this case, to the (uncoupled) CTL WRF-Chem run.
The maps focus on two time windows from the study period: one at the early stages of the dust intrusion, i.e., on 20 June at 12:00 UTC (Figure 5a,c), and one at the final stage, i.e., on 24 June at 00:00 UTC (Figure 5b,d). These respectively anticipate the most significant dust intrusion recorded in northern Italy and the maximum dust load recorded in the central and southern Italian regions (see Section 3.3) during the investigated episode.
The large-scale patterns at 500 hPa and 850 hPa described above both appear to be confirmed by the WRF simulations. As anticipated, WRF simulations show that the Mediterranean basin is dominated by a cut-off south of the UK and by an upper-level ridge over North Africa, extending over the southern Mediterranean; this dipole-like shape facilitates the transport of southwesterly winds to the Italian Peninsula.
From 20 to 24 June, the displacement and the slight modification of these patterns is visible, with the pressure low (slightly weakened) approaching France and the pressure high (slightly deepened) moving from North Africa towards the Ionian Sea. The trajectory of the southwestern currents, consequently, appears to be shifted towards the central-southern Italian regions. This is in agreement with the different timing with which the maximum dust concentrations were observed in the northern and central-southern regions of Italy (see Section 3.3).
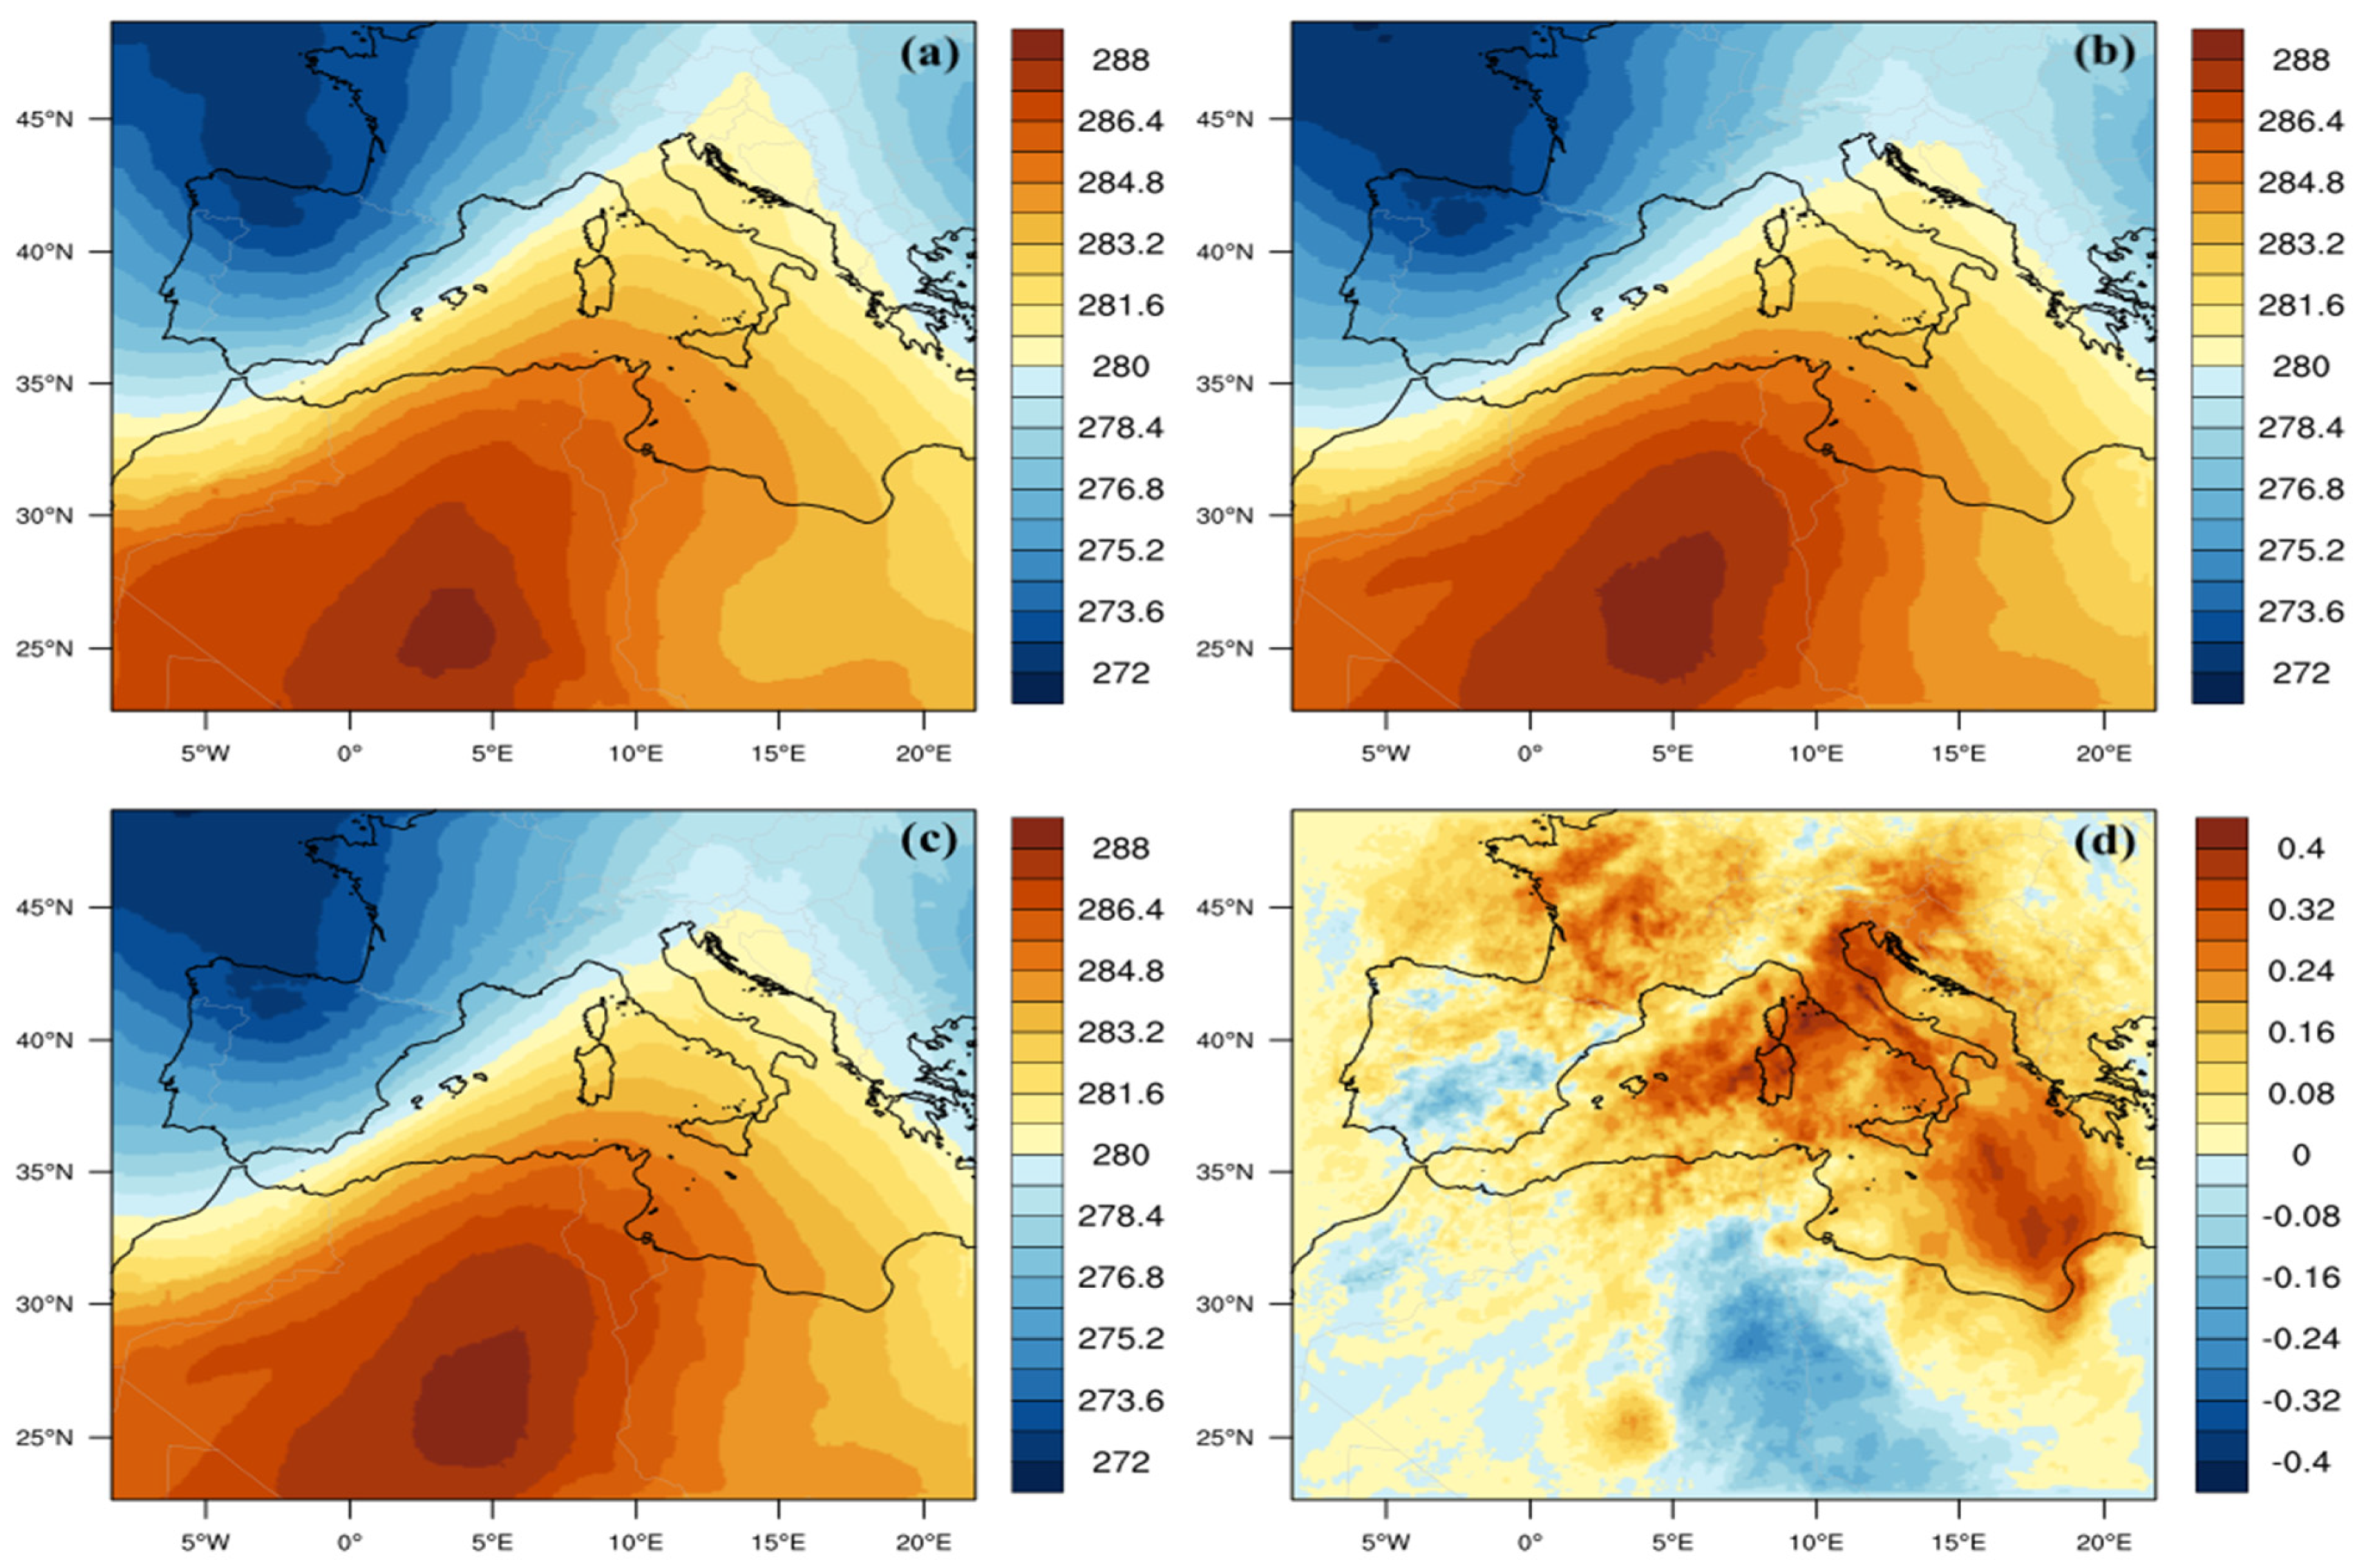
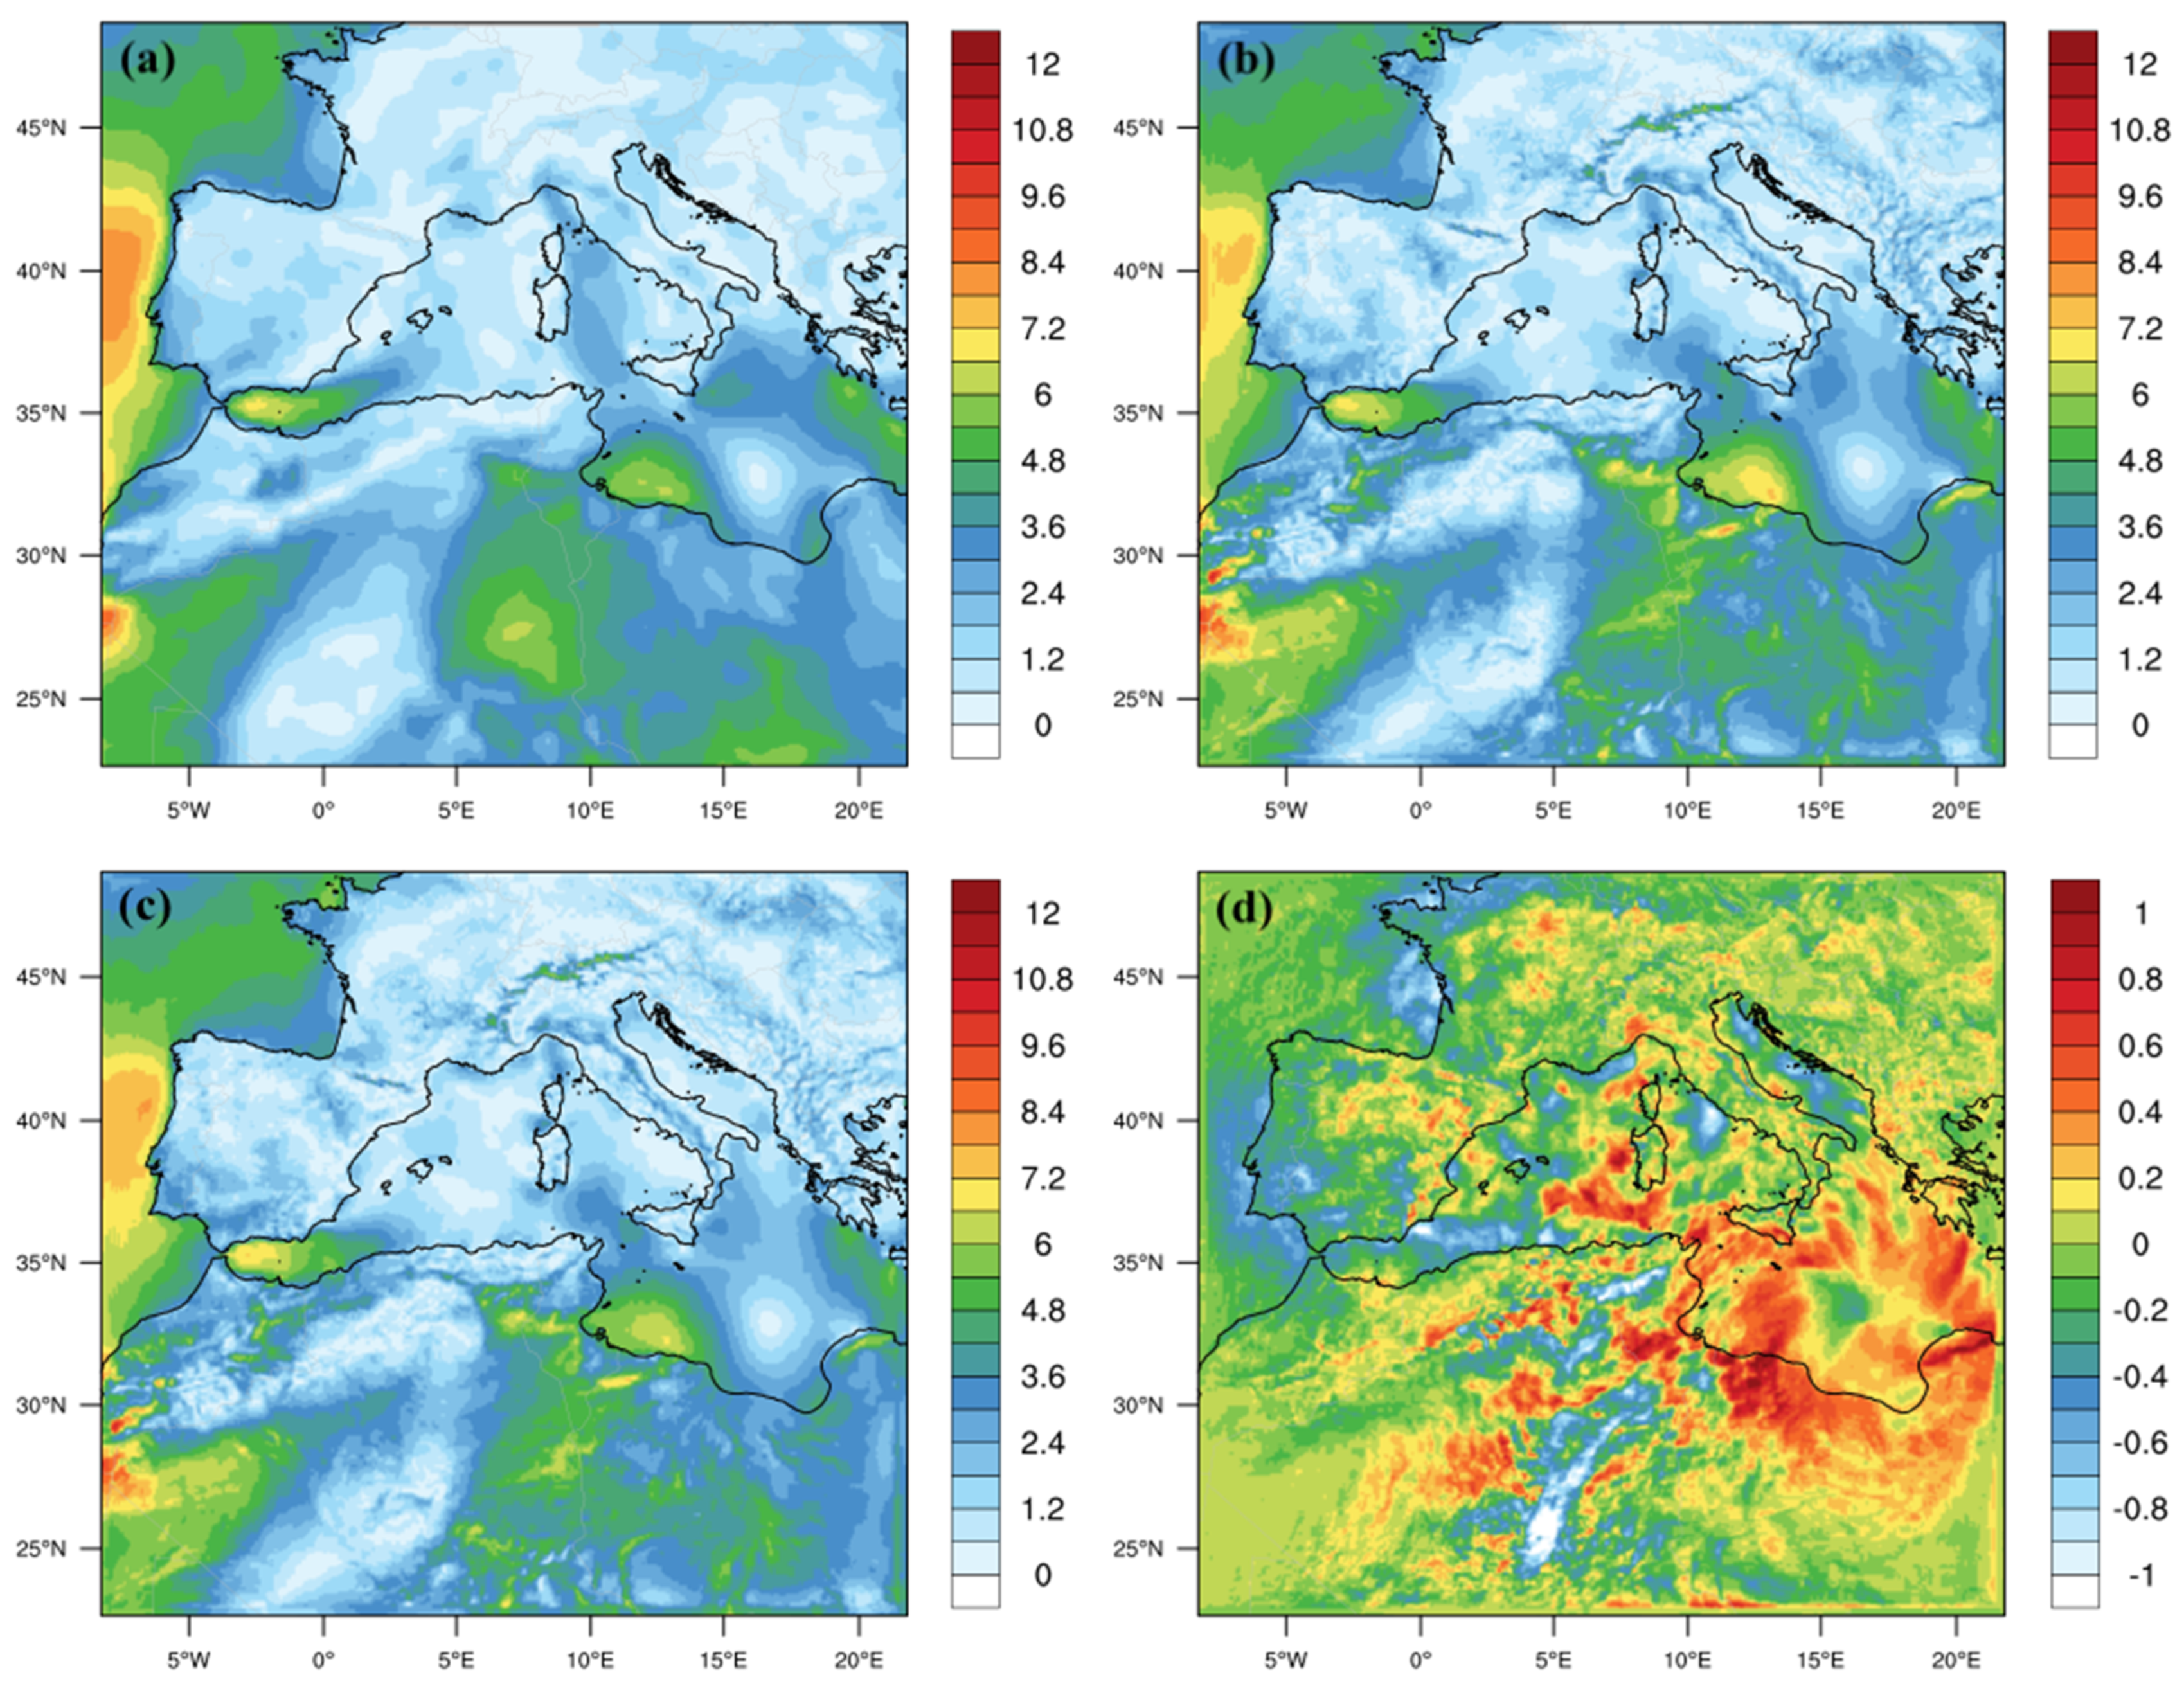
Figure 6 reports the comparison of the surface (10 m) wind speed ( w s 10 ) as derived by the CTL (Figure 6b) and FULL runs (Figure 6c) with the corresponding ERA5 reanalysis field (Figure 6a).
This allows us to evaluate the predictive capabilities of the model for the surface wind speed, with respect to a reference dataset (although at lower resolution; i.e., 0.25°) independent of the adopted initial conditions. In order to facilitate interpretation, the variables have been averaged for the whole duration of simulation (17–24 June), and the ERA5 wind speed is re-gridded on the WRF grid (Figure 1). We observe an excellent agreement between WRF and ERA5 in the reproduction of the surface wind speed, which is a key parameter for the emission of mineral dust particles from desert surfaces. In this context, we also show in Figure 6d the differences between the CTL and FULL average wind speeds calculated at 10 m, ws10 = u 10 2 + v 10 2 , showing the variation of the surface wind speed between the two configurations. In particular, the area average, in a subset (lat = 25:35; lon = 0:8°) of the numerical domain located in the Sahara Desert, shows some decrease of surface wind speed, namely 5.5 ms−1 for CTL and 5.4 ms−1 for FULL. Even this little difference may be important, as the emission of dust is a threshold process.

3.3. Aerosol Optical Properties Observations from Remote Sensing

Before starting the analysis of the possible roles of direct, semi-direct and indirect dust aerosol effects, it is important to evaluate how well the model reproduces the amount of dust in the investigated area.
This model-to-measurements comparison is usually conducted based on AOD data, which optically quantifies the aerosol (natural plus anthropogenic) load in the whole atmospheric column. For this purpose, we first compared the average AOD field at 0.55 μm from the high-resolution MODIS/MAIAC algorithm [57], already reported in Figure 2, with the relevant, simulated AOD from CTL (uncoupled) and FULL (fully coupled) WRF-Chem runs.
The vertically integrated aerosol extinction coefficient at 0.55 μm (EXT55, km−1) derived by WRF-Chem with the Maxwell–Garnett [83] mixing rule (aer_op_opt = 2) was used for this purpose:
A O D ( x , y ) = z 1 z t o p E X T 55 x , y , z d z
where z1 is the first vertical level, and ztop is set equal to 7 km.
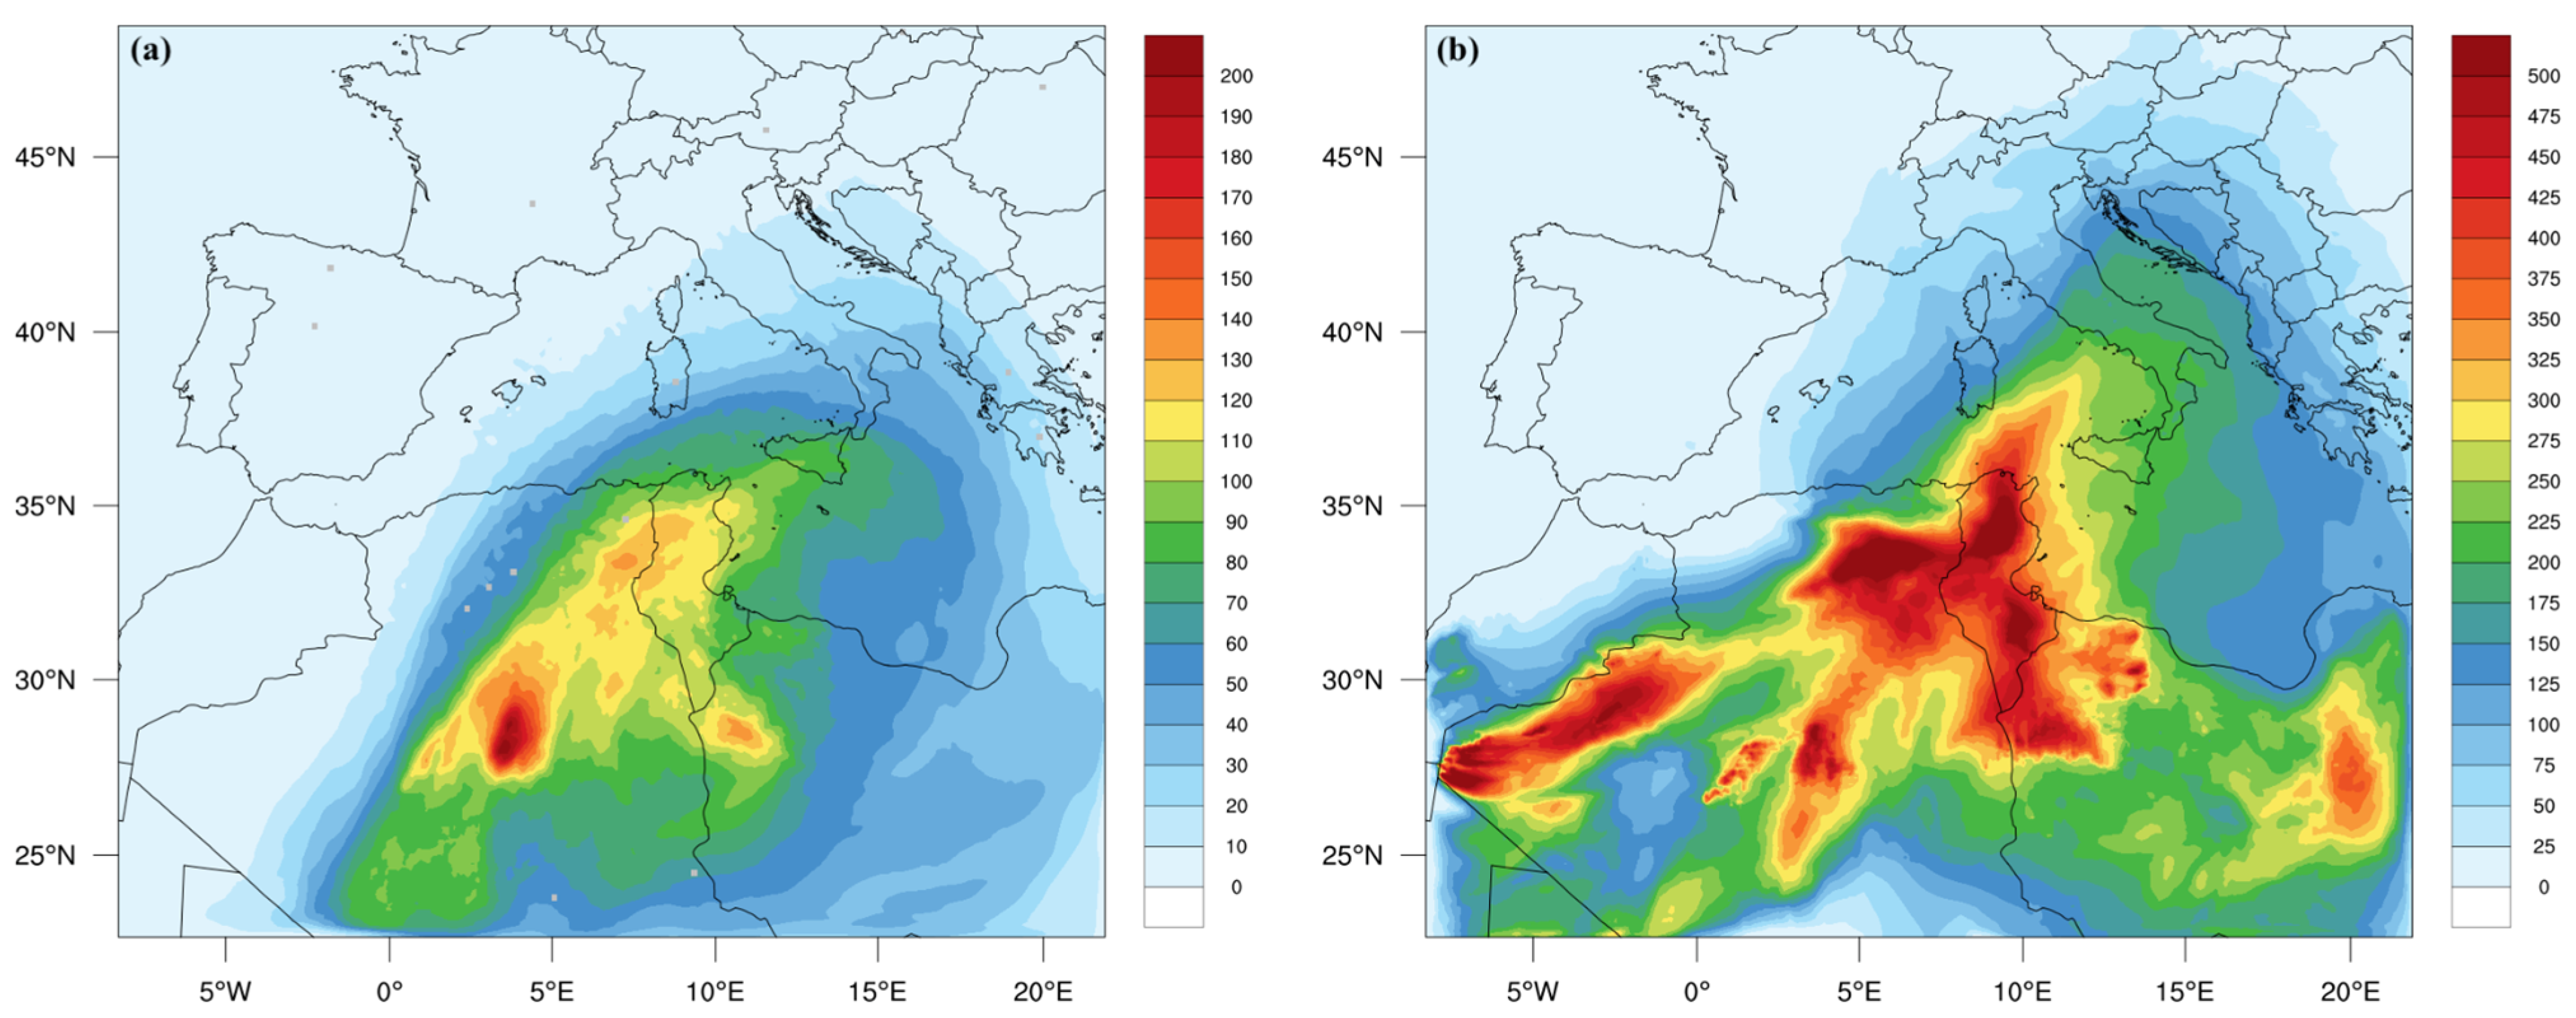
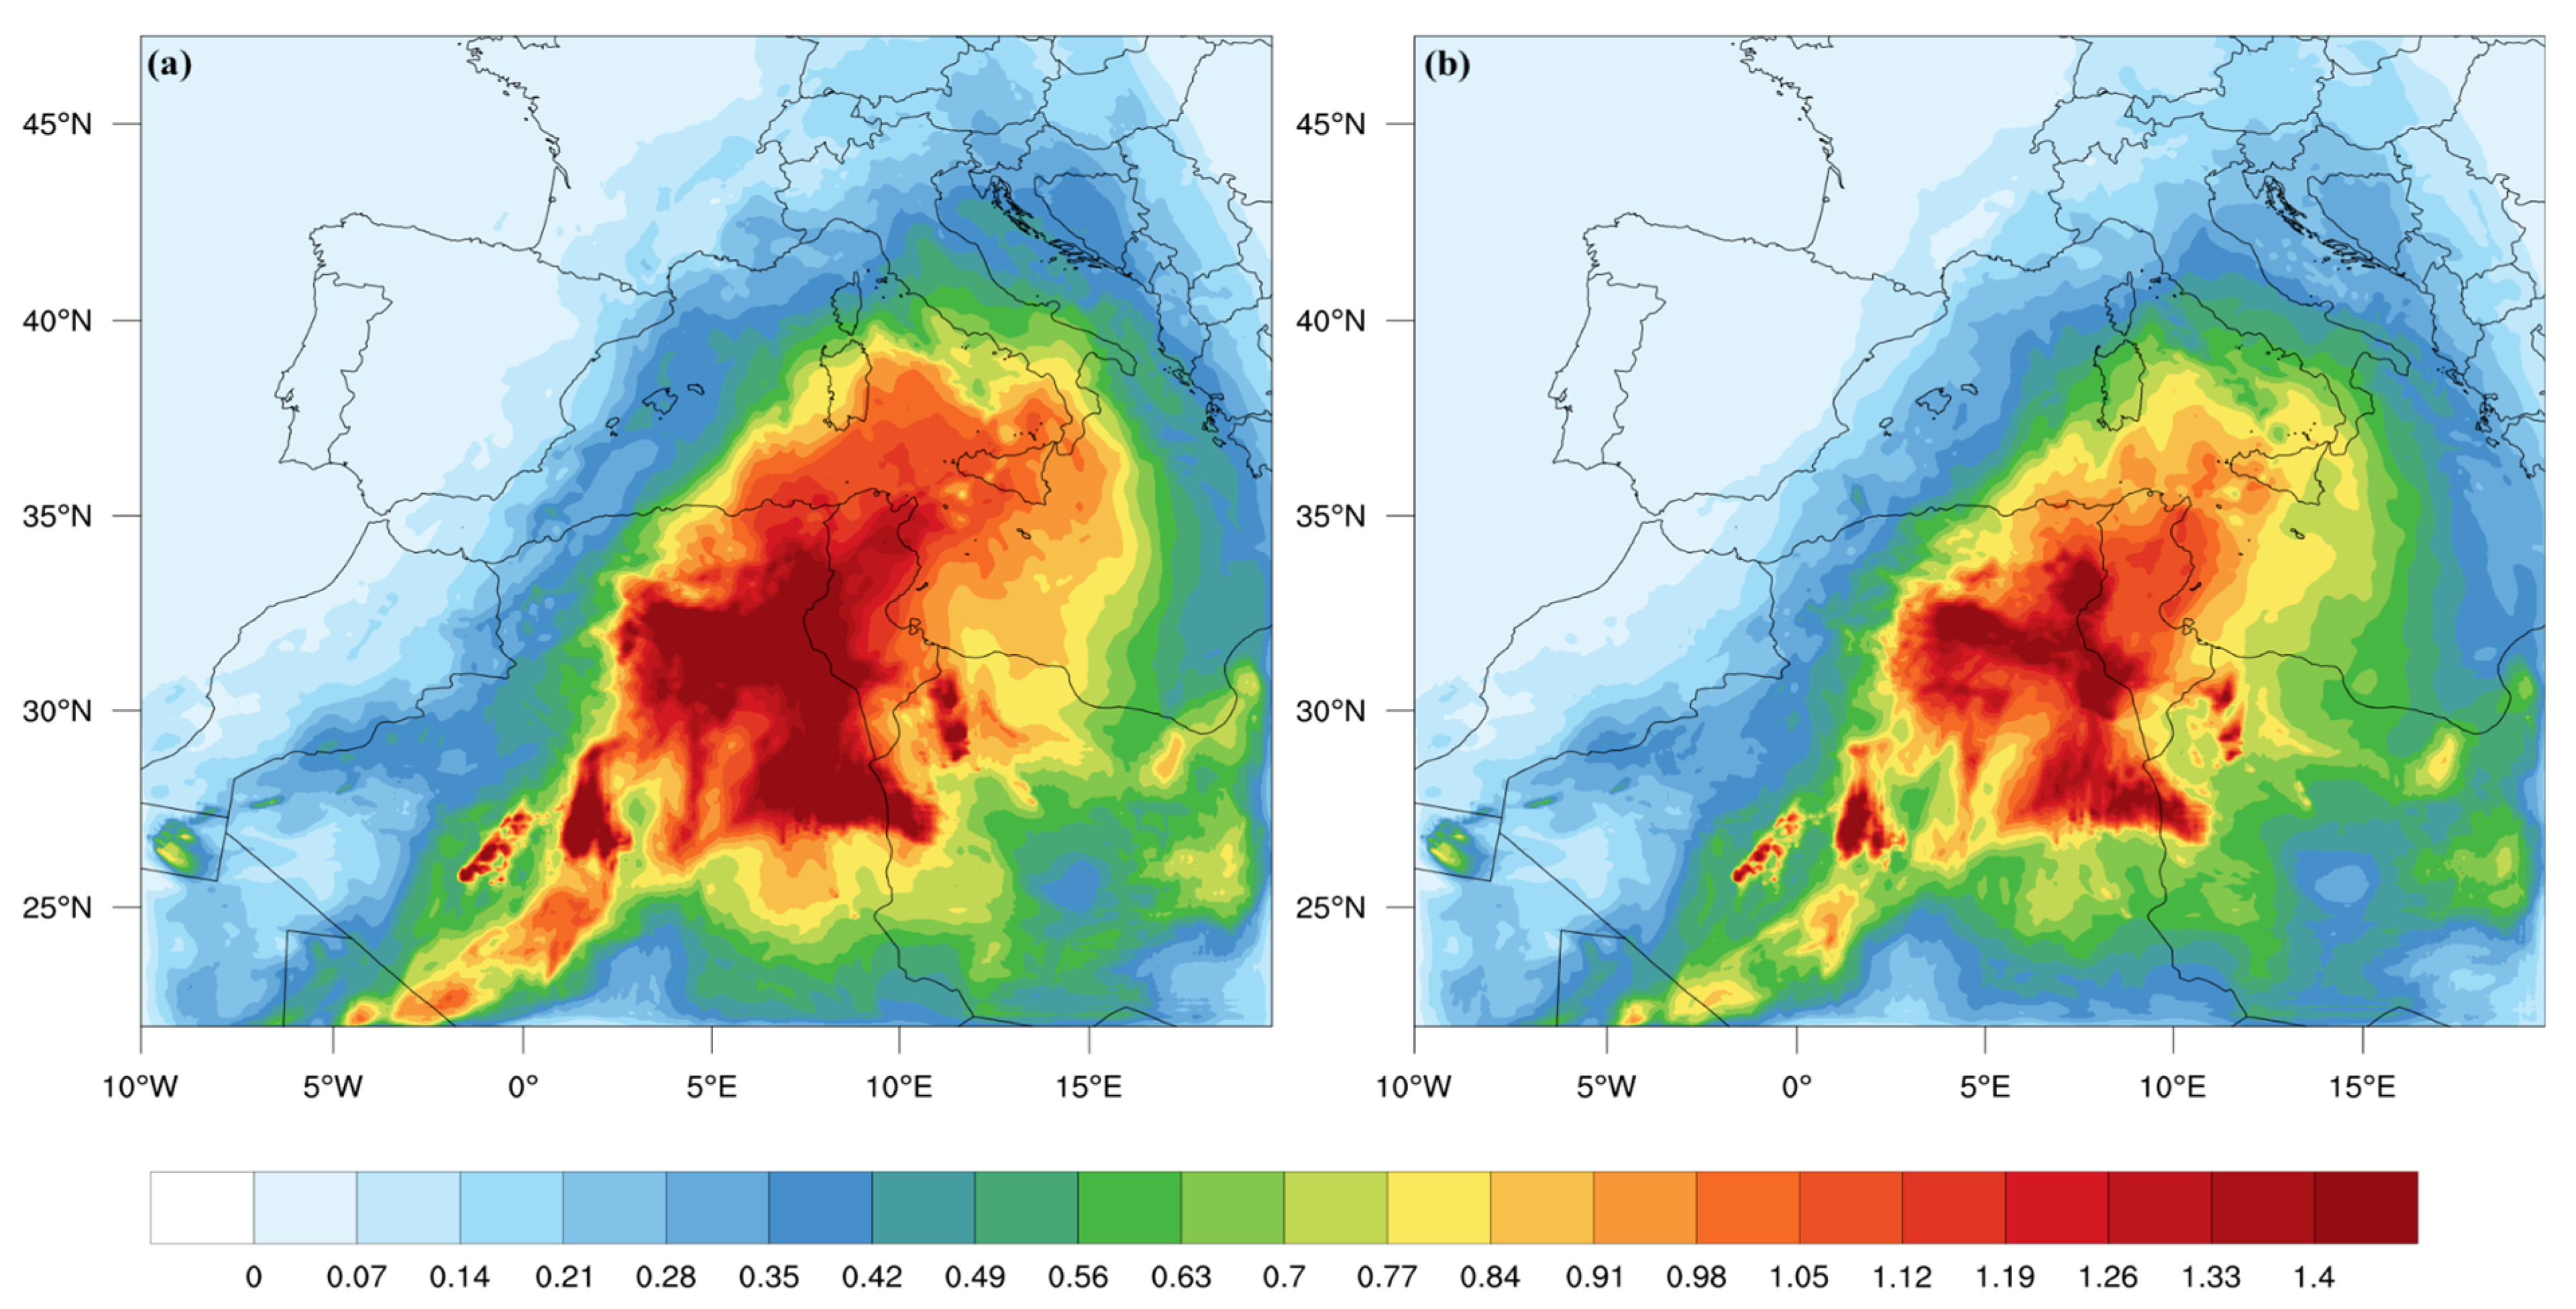
Figure 7 represents the period-averaged AOD (17–24 June) from the CTL (Figure 7a) and FULL (Figure 7b) runs.
This average was calculated by only considering the model data from the time windows corresponding to the daily MODIS-AQUA overpasses over the Mediterranean basin ( 13:00 UTC). It may first be cited here that the coupled simulation results in a general reduction of the AOD levels over the numerical domain, which may be caused by a variation of the threshold friction velocity over dust source regions.
When compared with the period averaged (17–24 June) AOD from the MODIS-MAIAC algorithm reported in Figure 2, it may be noticed: (i) a good spatial correlation, especially over water surfaces, and (ii) a general over-prediction in terms of intensity. This overprediction is particularly evident in the Saharan sector of the numerical domain. This is likely also related to the difficulty in retrieving AOD data from satellites over brighter surfaces. MAIAC generally improves accuracy compared to the Deep Blue (DB) algorithm [84] over bright surfaces [85], but, as revealed by the discontinuity between land and ocean surfaces, it is evidently still underestimated over the Sahara.
In order to complement the model comparisons with observed data, we used the AERONET measurements to analyze the ability of the model to reproduce the temporal evolution of the AOD fields over the central Mediterranean. We considered the AOD measurements at 0.55 μm, selecting the AERONET stations that meet the following criteria: (i) being localized in the portion of the Mediterranean basin that is enveloped by the dust plume and (ii) possessing a sufficient amount of level-2 data (cloud-screened and quality-assured) in the modeled period (17–24 June). This preliminary screening results in the retention of five stations, as reported in Table 3. Additionally, AOD derived from the vertically resolved ALC-derived extinction profiles from the ALICENET systems was also taken into account for four selected sites in the area (from north to south: Milan, Rome, Capo Granitola and Messina, see Figure 1). As was mentioned previously (Section 2.2.3), in this case AOD is first derived by integrating the ALC aerosol extinction [e.g., Equation (2) with ztop = 7 km] at the laser wavelength (1.064 μm) and is then converted to 0.55 μm using the information on the spectral variability of the AOD (i.e., the Angstrom Exponent) from the AERONET sun photometers.
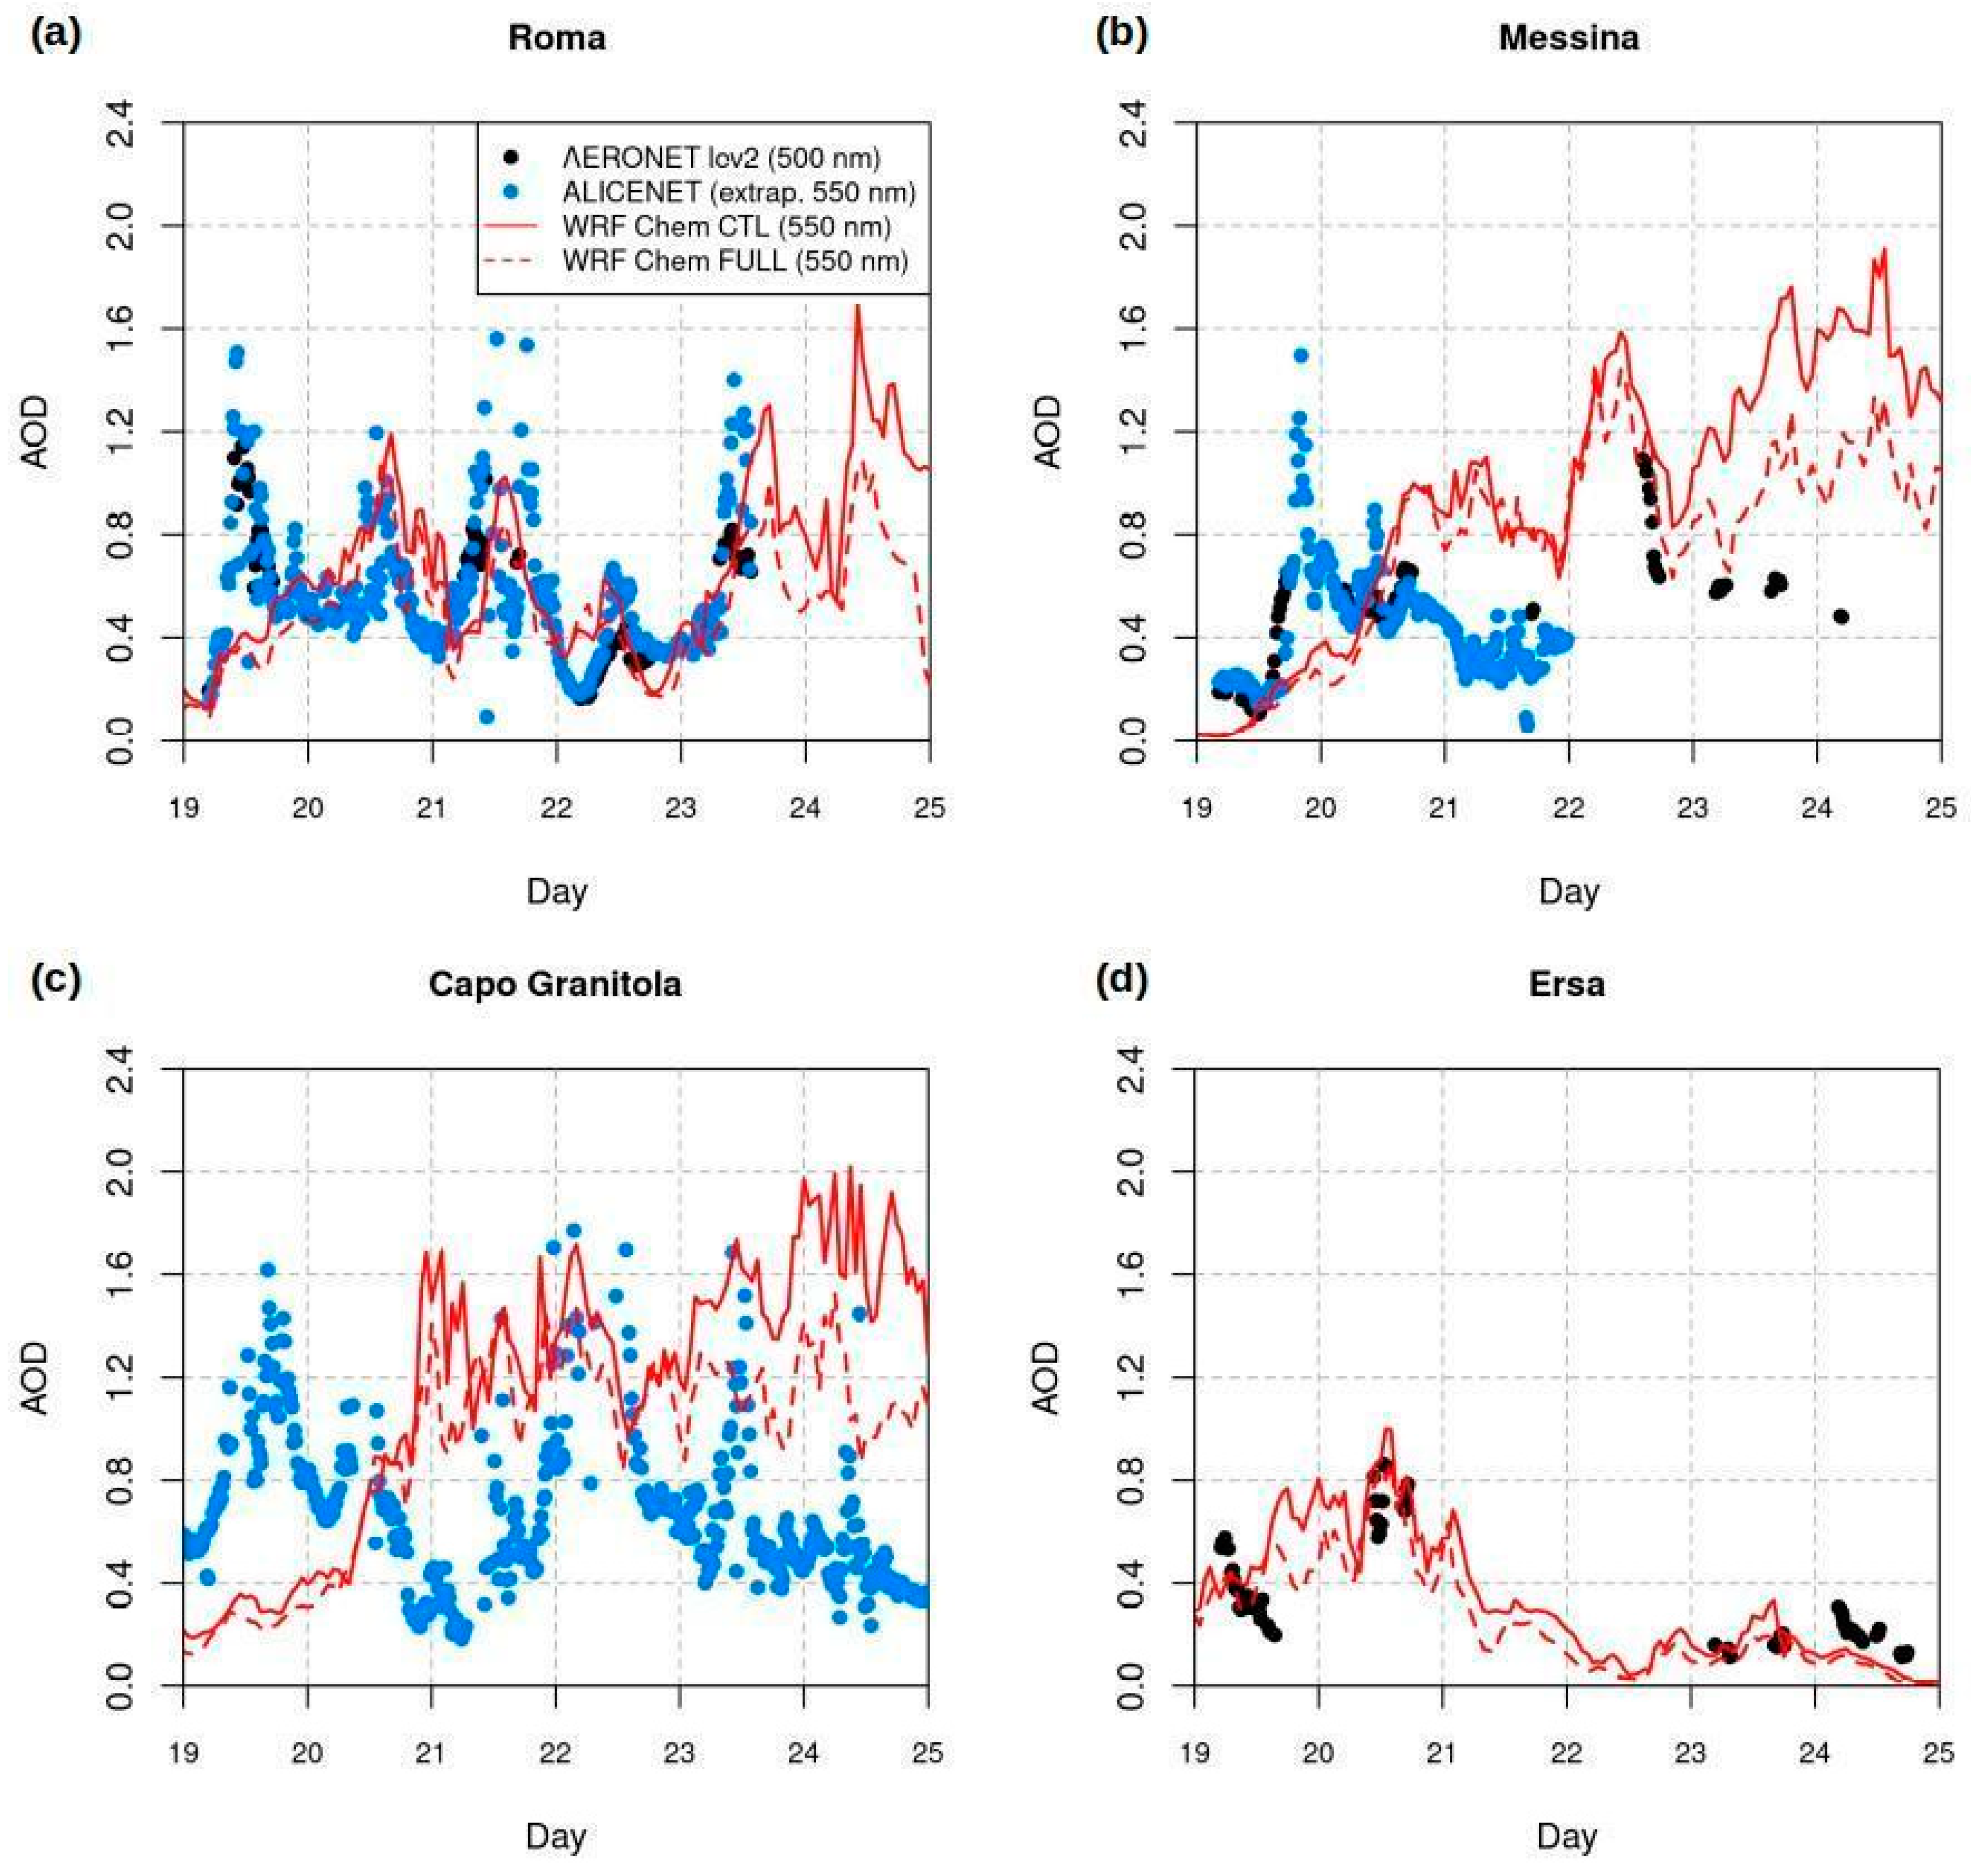
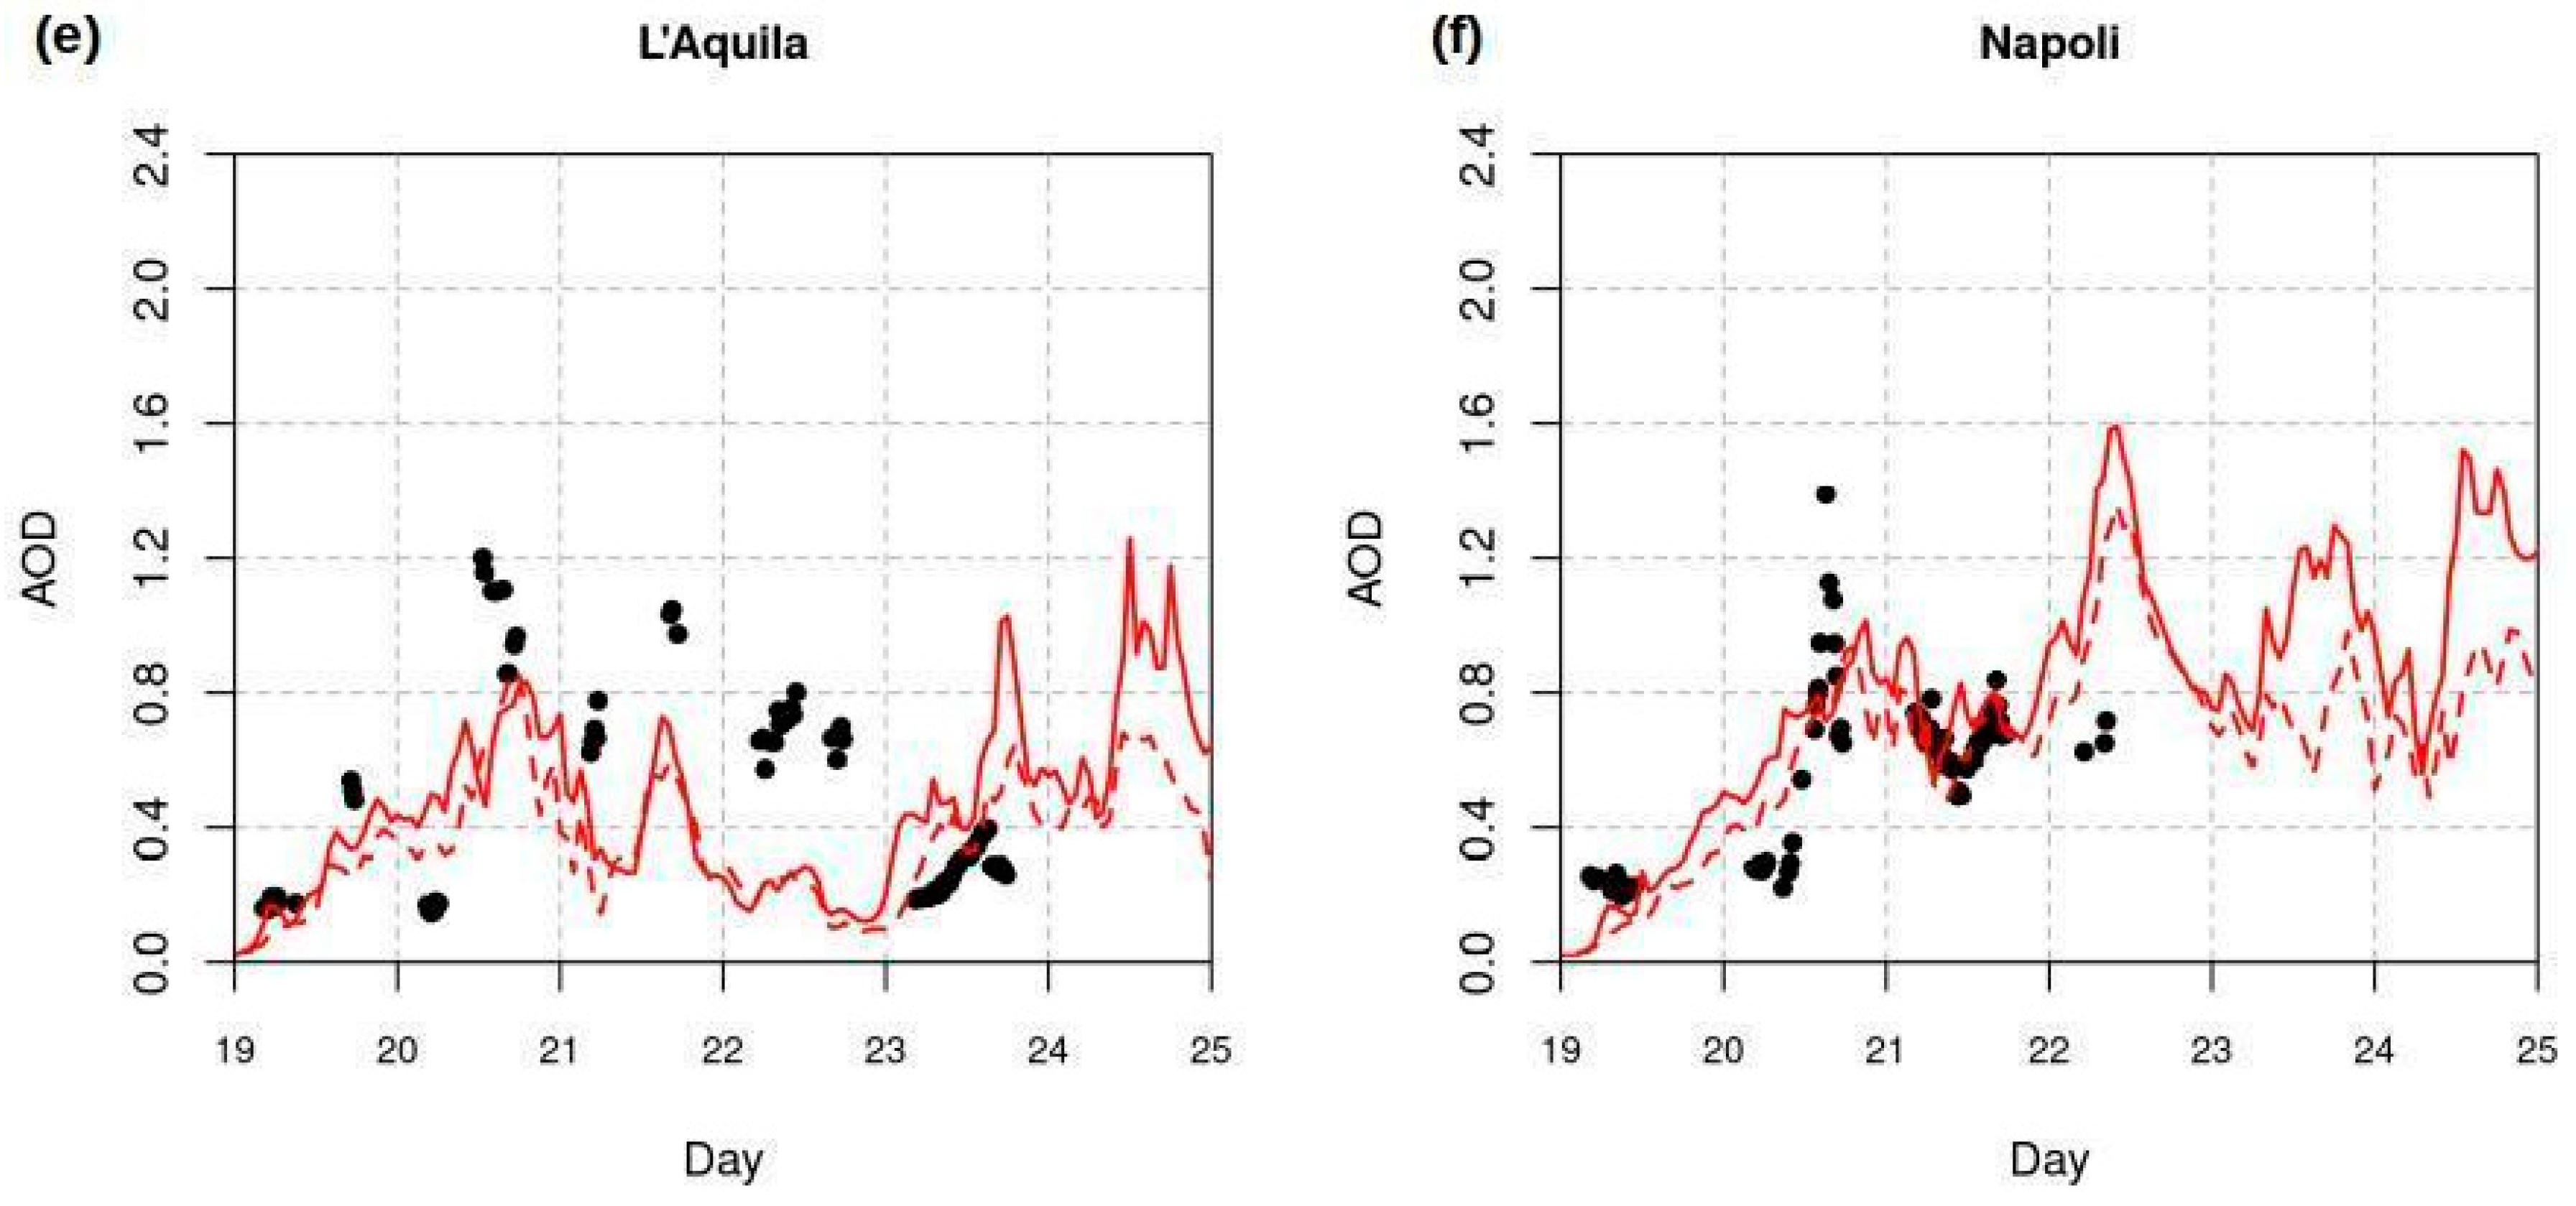
Figure 8 shows the time- and site-resolved comparison between the AOD simulated by the model (CTL and FULL configurations, red curves) and that measured by AERONET (black dots) and retrieved by ALICENET ALCs (blue dots), where available (see Table 3). AERONET data are only available in the daytime, while ALICENET ALCs operate 24 h; both AERONET and ALICENET data are cloud screened. This comprehensive picture shows that the model underpredicts the first dust pulse on 19 June recorded in the southern and central Mediterranean sites (Messina, Capo Granitola and Rome) by both AERONET and ALICENET. The AOD in the following days is better reproduced in all sites except for the Sicilian ones (Messina and Capo Granitola), which are the southernmost and thus closest to the dust sources. In fact, in these sites a clear model overestimation of the dust load (with increasing AOD values up to 2) is visible, particularly from 23 June, where, by contrast, the measured AOD is shown to decrease. The same seems true in Napoli (the third-southernmost site considered here, see Figure 1), although for this site there are no measurements for comparison after 22 June (cloudy conditions). Both model simulations and measurements in Figure 8 also highlight the pulsed nature of the dust transport, as typical in the Mediterranean (e.g., [74,75]), which is even more evident when looking at the vertical structure in the following.
Overall, with the exception of the southernmost sites at the end of the episode, the model reproduces the variability and range of values covered by ground-based remote sensing data with a temporal shift when reproducing some peaks and, in general, a reduction of AOD levels obtained for the FULL configuration in all stations.
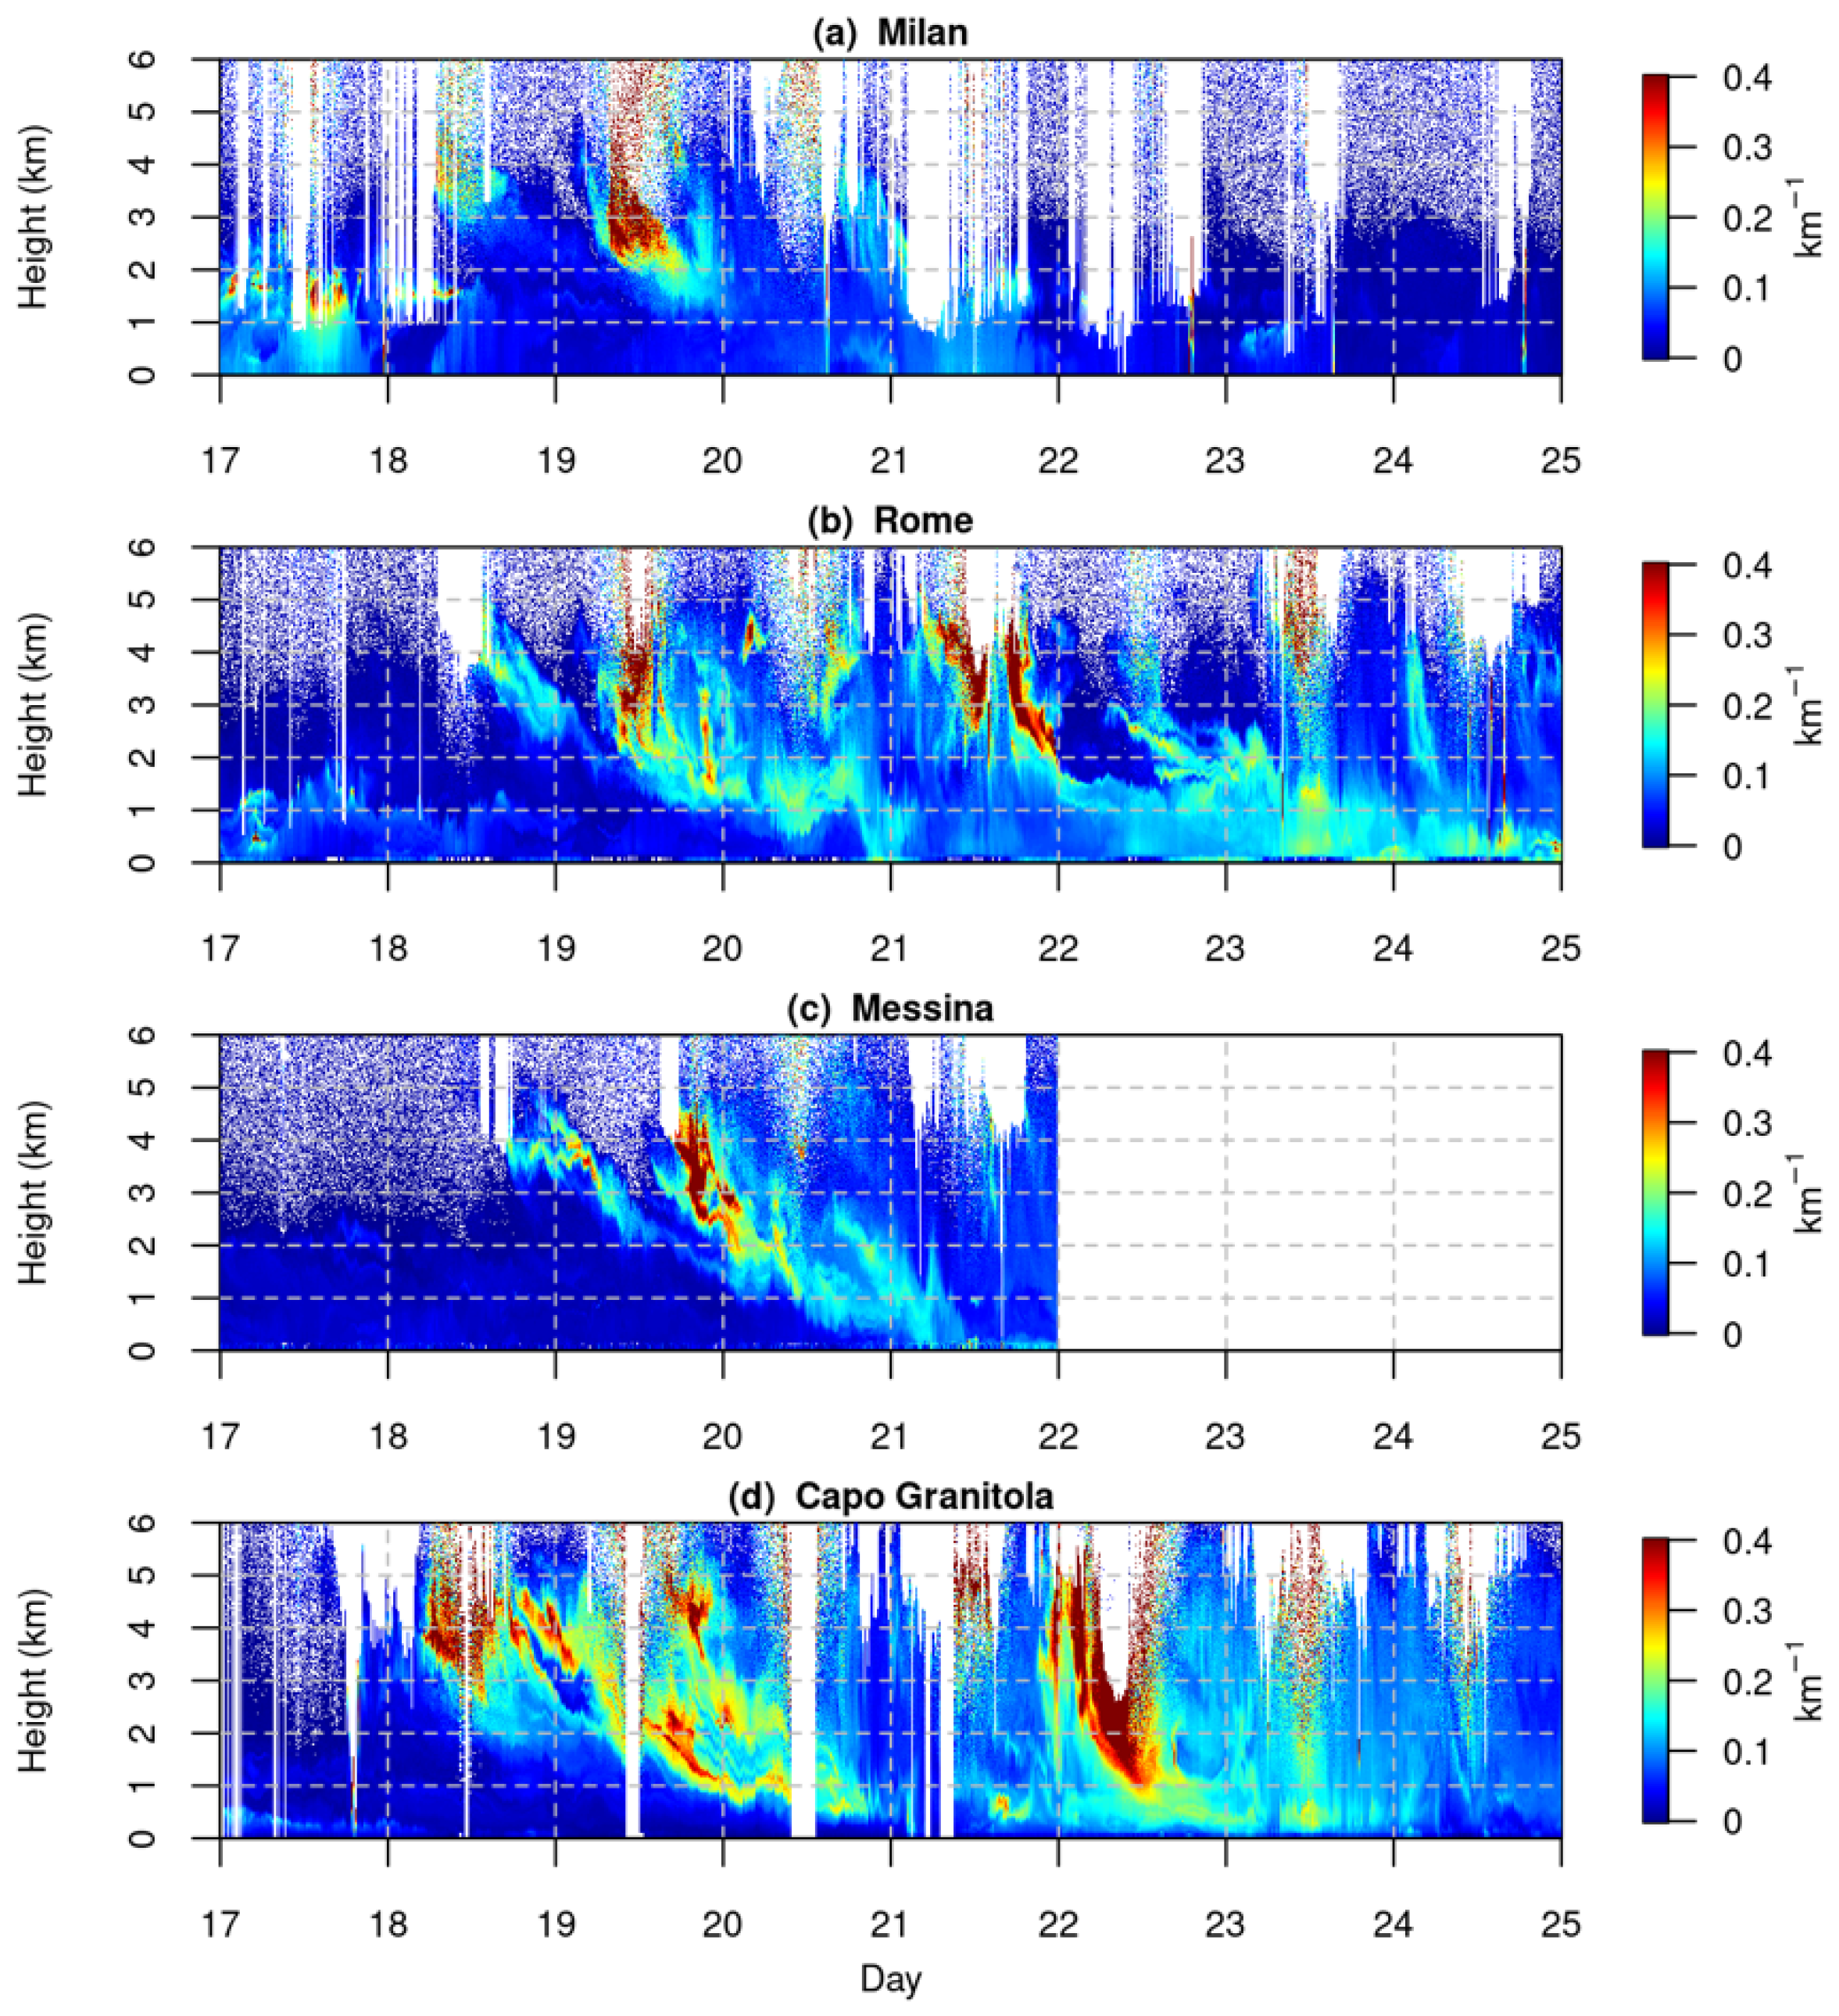
Further insights on the spatial/temporal distribution of the desert dust field can be obtained by considering the continuous (24/7) vertically-resolved data from the ALICENET measurements and the corresponding altitude versus time cross sections from the model simulations.
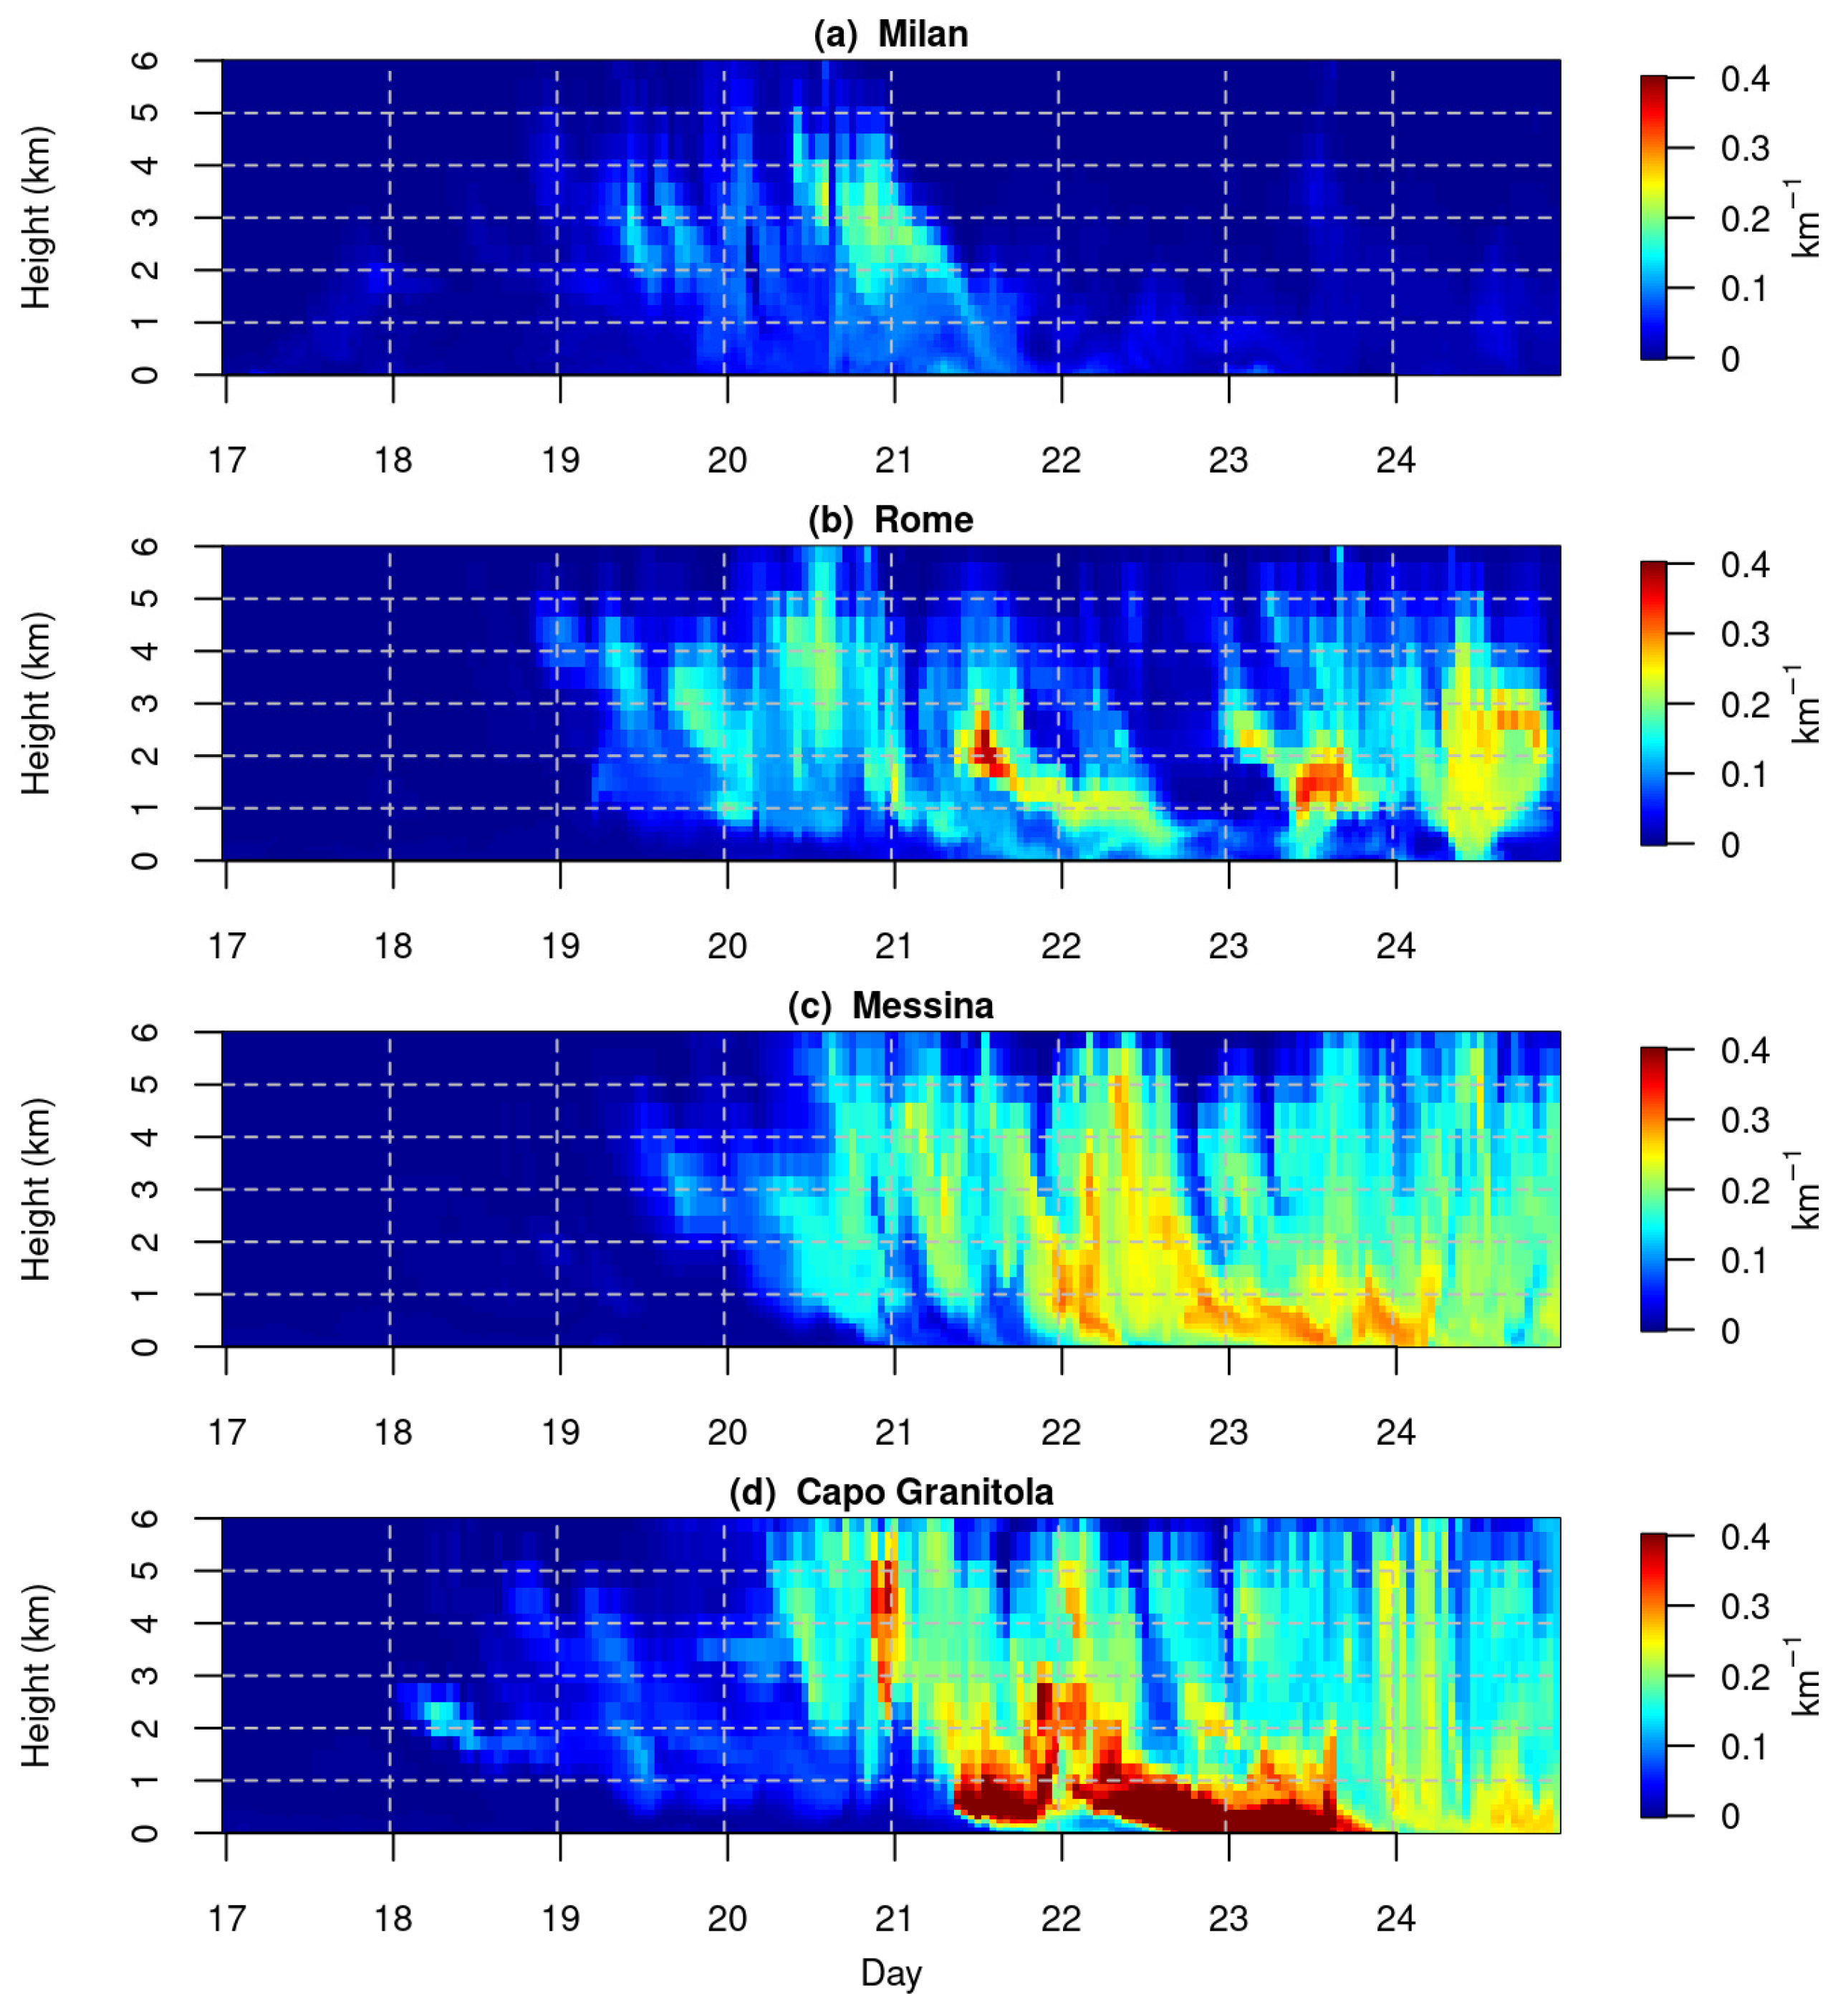
These are reported in Figure 9 and Figure 10, respectively, showing the altitude (0–6 km) versus time (17–24 June) aerosol extinction as derived from ALCs (at 1.064 μm, downscaled at 5 min temporal resolution) and model simulations (at 0.55 μm) over Milan, Rome, Messina, and Capo Granitola (see Figure 1). The ALC profiles show the first elevated desert dust plume reaching Italy on 18 June. The southernmost site of Capo Granitola was the first to detect it in the morning, followed by the others (Messina, Rome, and Milan in southern, central, and northern Italy, respectively).
Some temporal shifts can be observed between the western and eastern ALC sites (e.g., from Capo Granitola to Messina in Sicily), revealing a southwest to northeast movement of the air masses. The altitude range of this first plume was 3–5 km at all sites, and it rapidly descended to below 3 km during the day. As mentioned, the full dust event was made of different plumes superimposed one over the other. The second intense pulse was observed on July 19 and, similarly to the previous one, was first detected in the middle troposphere (4–5 km) and then observed to descend to the lowermost levels within the PBL in the following days, thus mixing with the first dust pulse as well as with local particles. A similar situation persisted all over the country (see similarities among sites in Figure 9) for two days, with further dust inputs arriving on 21 and 22 June, these latter more significantly affecting the lowermost layers (thus with potential implications on air quality), with the exception of the northernmost site of Milan.
It is important to point out that the reported ALC measurements allow for comparative analysis of the time–height evolution of the aerosol trace with model outputs, but these are not able to discriminate the aerosol type. In Rome, measurements from a second polarization-sensitive ALC (i.e., sensitive to non-spherical particles such as those typical of mineral dust, e.g., Gobbi et al. [75]), revealed that irregular (desert dust) particles prevailed over spherical ones during the period of 19–24 June, with mineral dust particles reaching the ground on 20, 21, and 23 June (not shown here).
The relevant aerosol extinctions (at 0.55 μm) simulated by the model under the FULL configuration for the period of 17–24 June 2021 are reported in Figure 10. As anticipated by the AOD time series in Figure 8, the model did not capture the full magnitude of the dust plume on 19 June, which was slightly underestimated. As confirmed by the ALC measurements (Figure 9), Milan was the least-impacted site. The simulated dust layer arrived over Milan with two superimposed pulses, the first on 19 June and the second, which was more intense, on the afternoon of 20 June, both localized between 2–4 km (red area). In Rome, the model output showed five superimposed dust pulses starting from 19 June, with the maximum intensity at ground level on 22, 23, and 24 June. The modeled Sahara dust layer was approximately 4 km in depth for the whole period of 19–24 June.
The modeled time versus height plots of Messina and Capo Granitola are similar and depict an intense intrusion starting on 18 June (at 2 km), then continuing for the whole simulated period, with maximum values reaching the ground on the afternoon of 22 June and on the morning of the following day.
It is evident from this plot that the increase in the model AOD at the end of the episode (24 June) in the Sicilian sites (Figure 8) was related to an overestimation of the dust emission model in the source regions located in the northern Sahara. The results presented in this section indicate that the model overestimates the experimental AOD values but is able to detect the time evolution of the dust impulses and the consequent changes in aerosol optical properties. This provides confidence for using the WRF-Chem model to evaluate the impact of this dust event on the radiation budget as described in the next paragraph.

3.4. Radiative Effects

Dust aerosols exert a direct effect either through the scattering and absorption of SW solar radiation [1] or through the absorption and re-emission of LW radiation, that leads to a warming or cooling of the atmospheric layers in the case of absorption or reflection, respectively. Via a semi-direct effect, particles with absorption capabilities can also modify atmospheric temperature and relative humidity profiles, thereby impacting the atmospheric stability and in turn acting upon cloud development and precipitation mechanisms [39]. Furthermore, due to the capability of dust aerosol to serve as CCN and IN, this process modifies the optical properties of clouds [86], establishing the indirect impact of mineral particles on radiation. This chain of complex processes constitutes the direct and indirect impacts of mineral particles on radiation and was renamed following a recent IPCC report [87] as “effective radiative forcing”. It further modifies the energy budget at the surface, in the atmospheric column and at the top of the atmosphere (TOA).
In this paragraph we will evaluate the feedback of mineral dust with the WRF-Chem radiation modules for both the longwave (ra_lw_physics = 5) and shortwave (ra_sw_physics = 5) components. When using the Goddard radiative model, the namelist variable “gsfcrad_gocart_coupling” (Table 2) explicitly enables the aerosol direct and semi-direct radiative effects at the surface and TOA. In order to activate the indirect effects of mineral particles on radiation, the namelist variable gsfcgce_gocart_coupling must be activated; this allows for the nucleation of dust particles in CCN-IN, further modifying the radiative properties of clouds. The associated WRF state variables for the Godard radiation scheme are reported in Table 7.
It is worth highlighting here that, although we might in general also expect an important interaction of low-level, pollution-related aerosols with radiation, especially in urban areas, we do not expect this to be the case for the episode under investigation. In fact, as shown by the lidar-ceilometer soundings in Figure 9, the aerosol loads in the lowermost levels were quite low during the addressed dust event, even in the urban areas of Milan and Rome (Figure 9a,b), and thus mineral dust is assumed to dominate the radiative effects in this context.
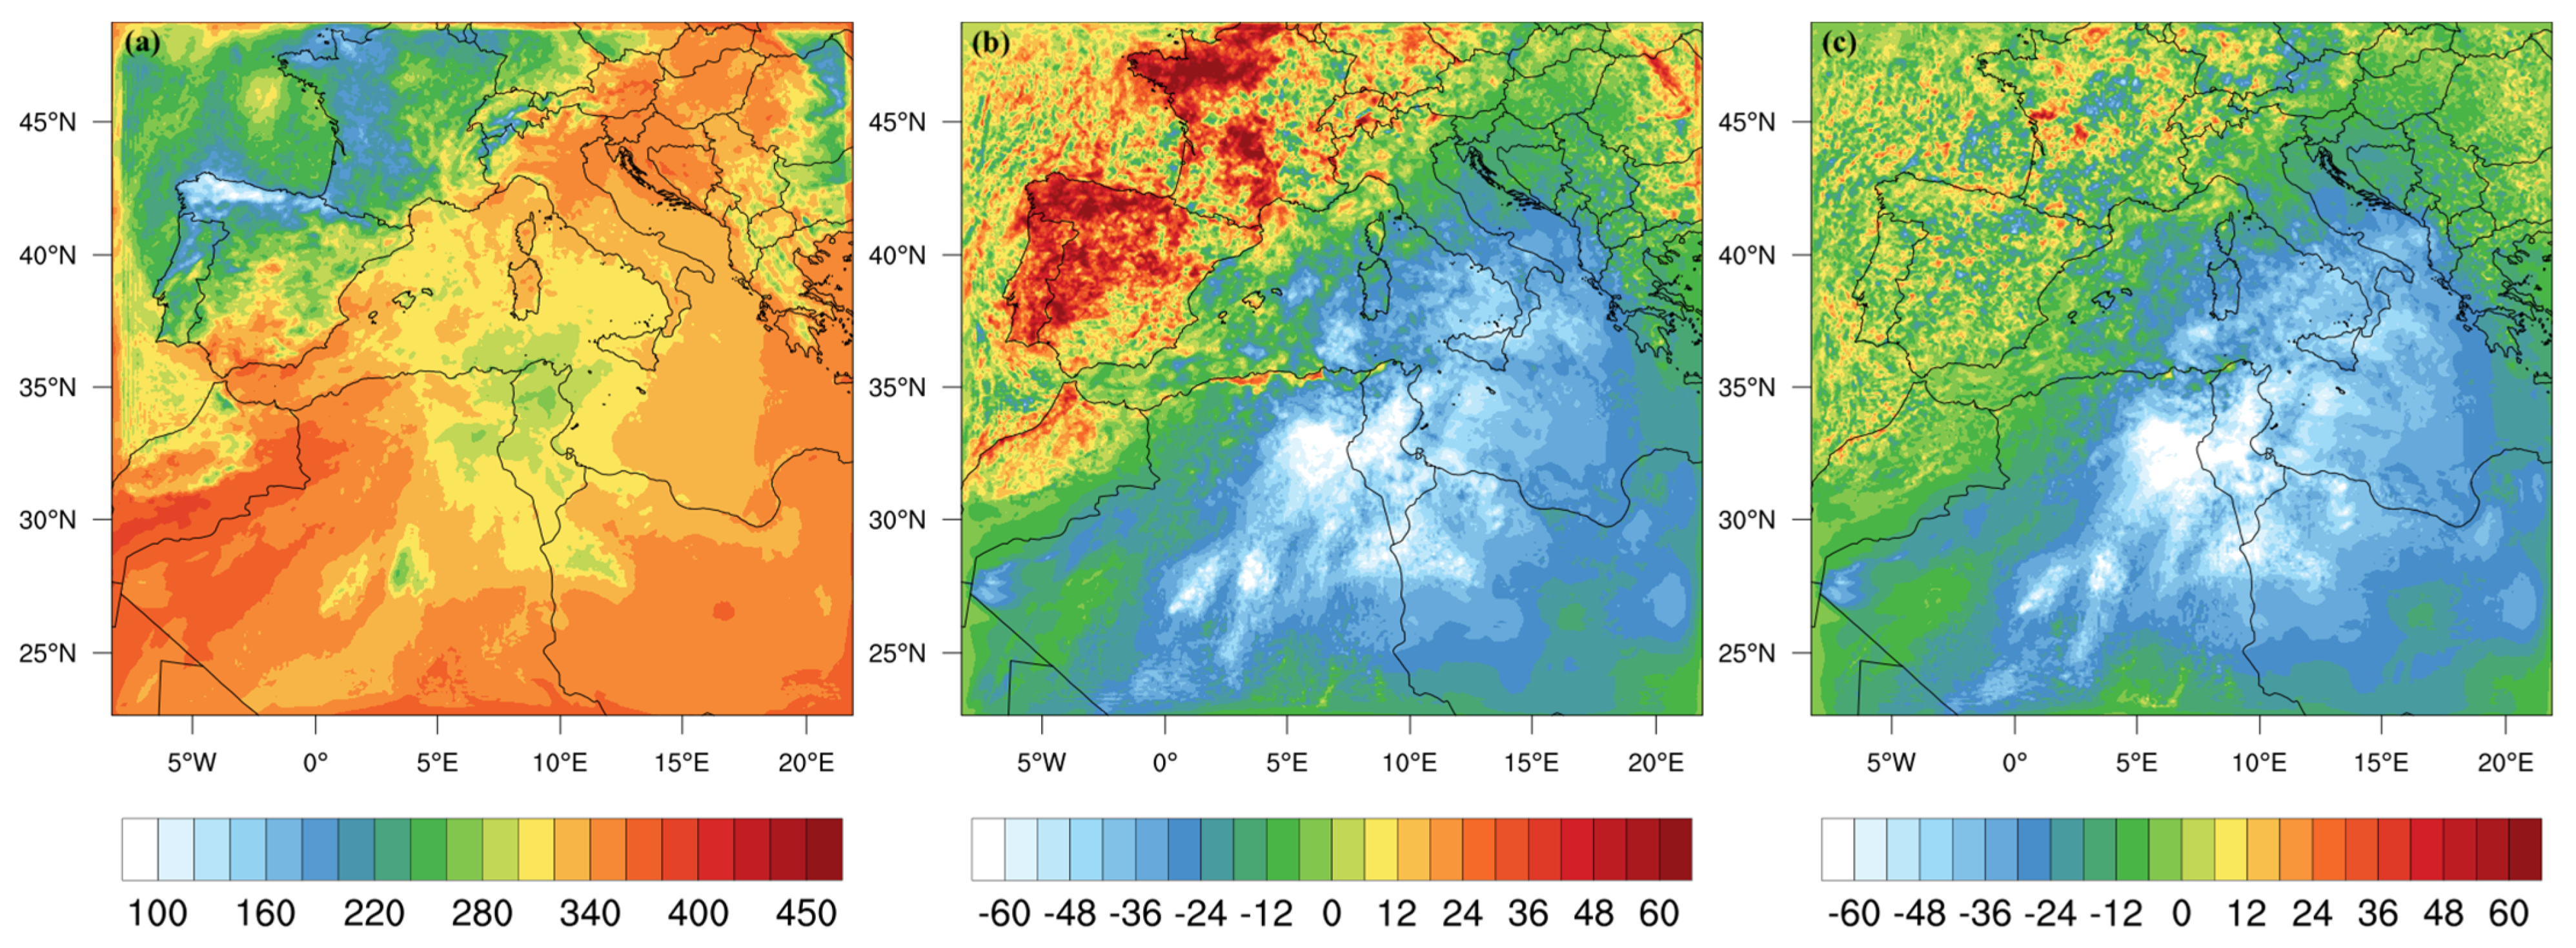
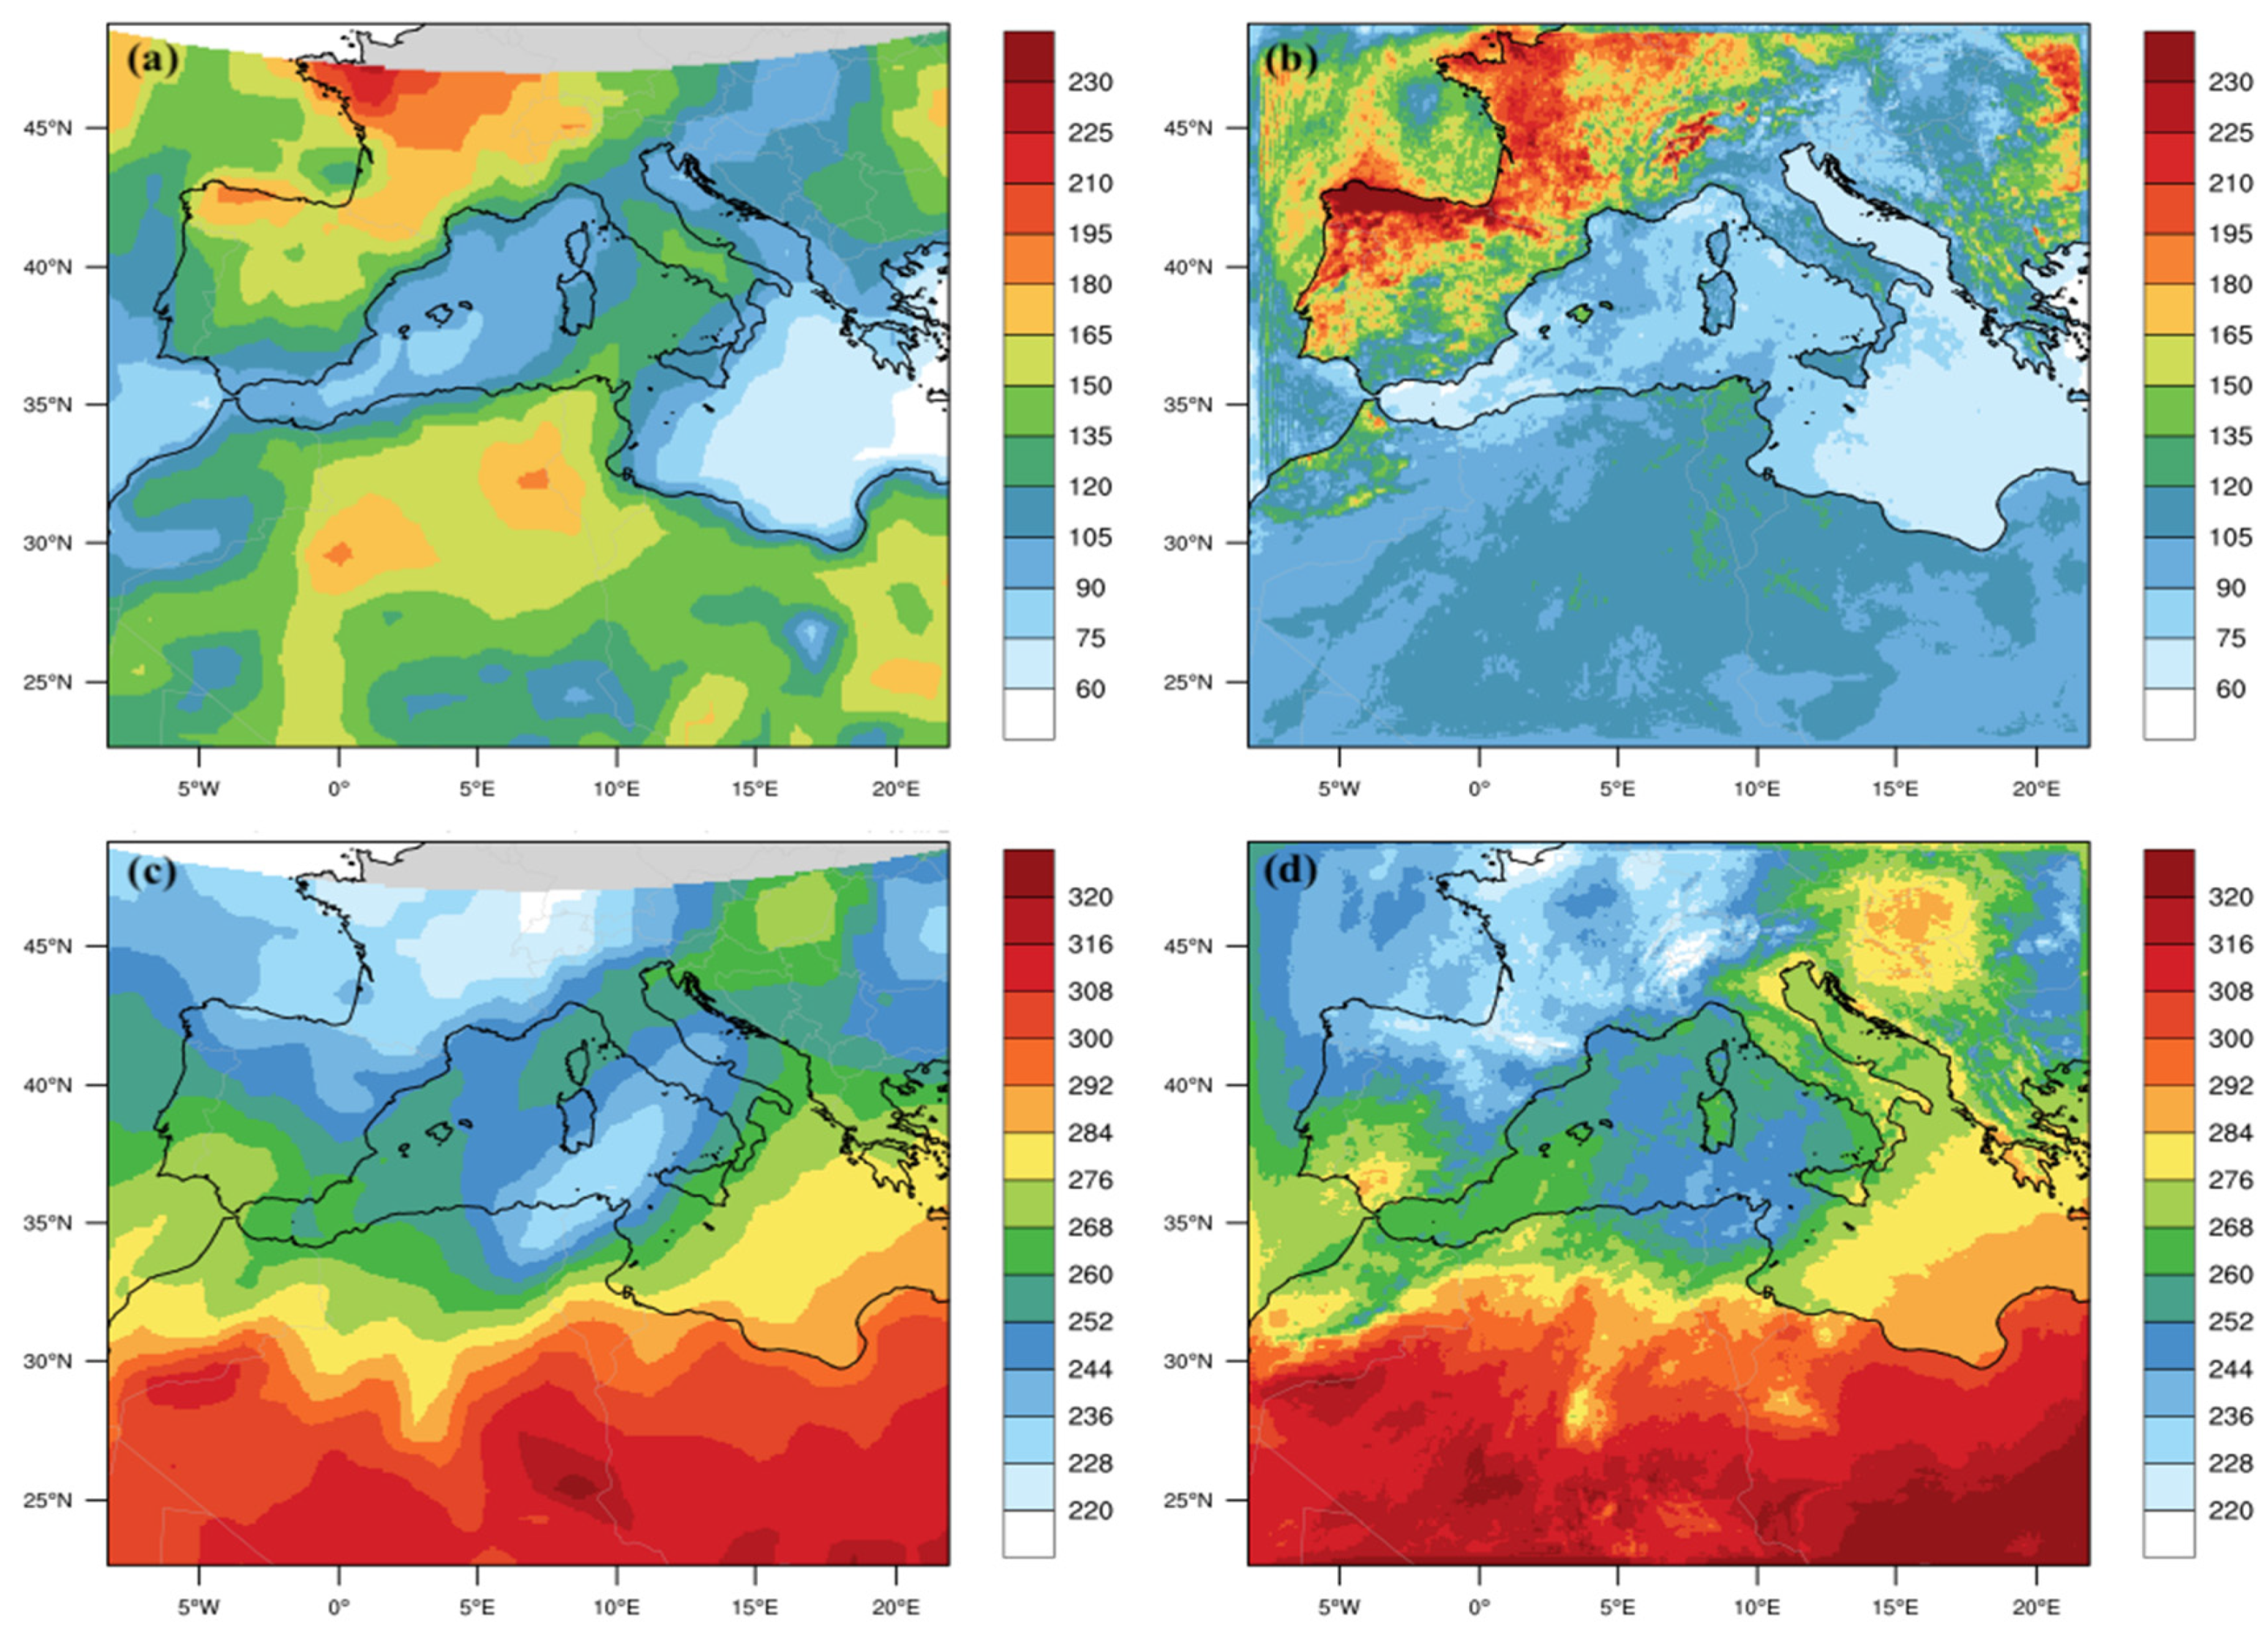
Before analyzing the radiative budget in detail, we compared the simulated radiative fluxes against the CERES products (https://ceres.larc.nasa.gov/data/ (accessed on 8 January 2023)). The results are summarized in Figure A1 of the Appendix A. Considering the quite different spatial resolutions between the CERES observations (~100 km) and the model data (=10 km), the results show a good spatial consistency between the two, especially for the LW upwelling component. In order to quantify the discrepancies between the model and observations, we summarize in Table 8 the full domain and whole period average of the upwelling SW and LW radiative fluxes. This provides an objective quantification of −11% and +2% for the SW and LW components at TOA.
In order to analyze the aerosol–radiation feedback, we first separately analyzed the shortwave and longwave downwelling components of the radiation at the surface, then analyzed the net radiation in terms of dust radiative forcing (DRF) at both the surface and TOA and finally, we analyzed the net energy budget at the surface. This analysis provides an overall description of the dust-induced effects on radiation and on the associated meteorological processes.
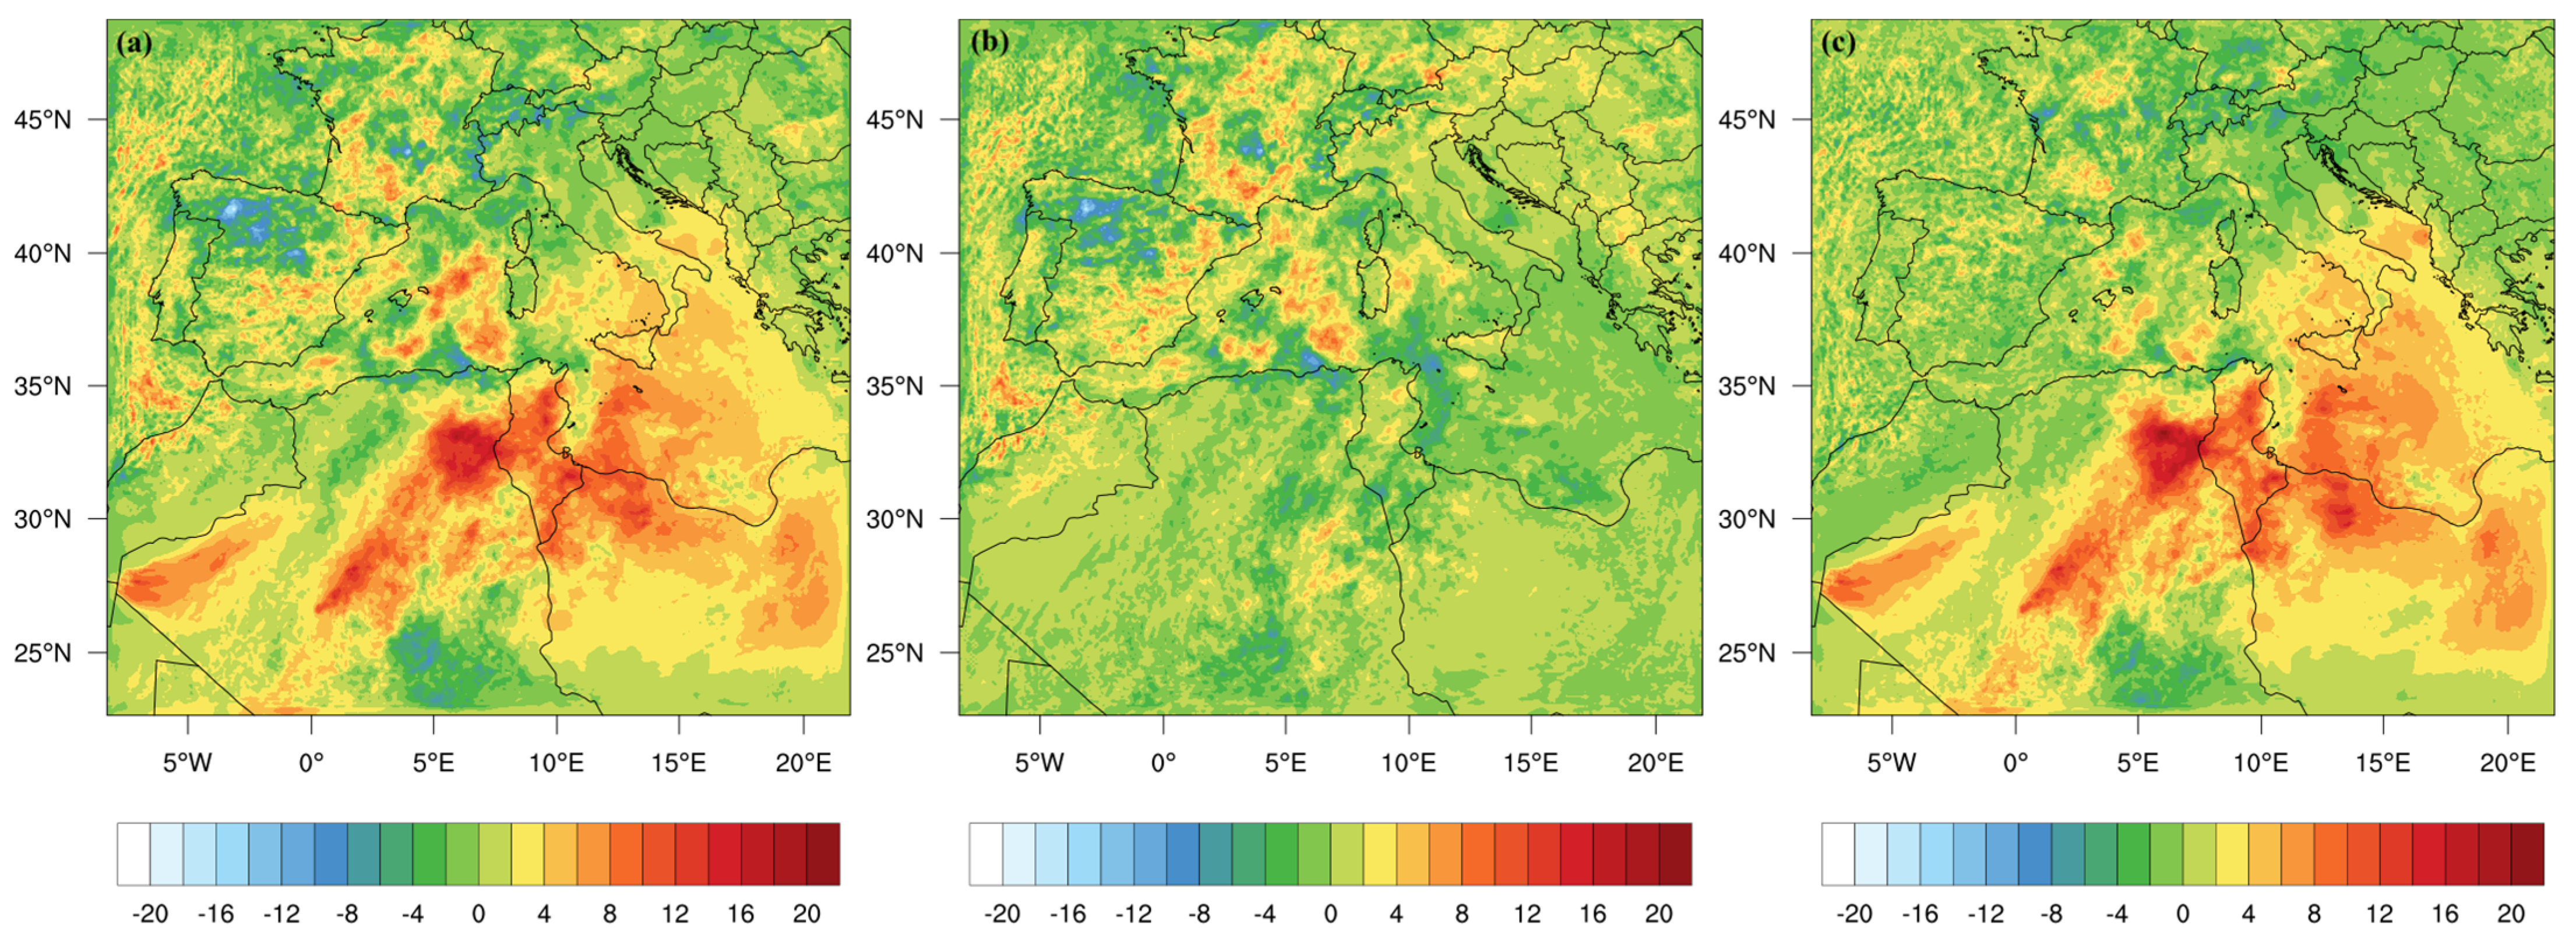
From this perspective, the results reported in Figure 11a–c represent the simulated surface SW downwelling flux (SSWDN) differences—FULL−CTL (Figure 11a), MP−CTL (Figure 11b) and RAD−CTL (Figure 11c)—while Figure 12a–c reports the same differences but for the downwelling longwave flux at the surface (SLWDN). The spatial patterns depicted in Figure 11 and Figure 12 were obtained by averaging over the simulation period.
In particular, considering the shortwave radiation and the period-average difference, SSWDN(FULL)–SSWDN(CTL), between the fully coupled and the non-coupled runs (Figure 11a), a reduction in SW radiation is evident at the surface in the range [30–60] W m−2, (i.e., of about 10–15%) for the whole simulated period. This reduction is consistent with the presence of dust (Figure 7a,b) and is caused almost entirely by the aerosol–radiation feedback, as shown in Figure 11c, which reports the SSWDN(RAD)–SSWDN(CTL) difference. Conversely, the increase of SW radiation that appears in Figure 11b in the area outside the region impacted by the dust storm (Spain and western France), can be attributed to the microphysics coupling, that is, the impact of aerosols on radiation may also affect the distribution of clouds as well as the model dynamics in the whole domain [38].
On the other side, if we consider the average longwave radiation at the surface, then the difference SLWDN(FULL)–SLWDN(CTL) shows an increase in the LW radiation at the surface of about [5–15] W m−2 (Figure 12a) due to the aerosol–radiation feedback (Figure 12c). Analysis of Figure 11 and Figure 12 brings some important considerations: (i) two opposing effects are found on the shortwave (Figure 11) and longwave (Figure 12) radiation for the direct coupling (RAD-CTL) and indirect coupling (MP-CTL); (ii) direct (plus semi-direct) and indirect effects have an overlapping outcome on the FULL coupled simulation. These variations of −15% of surface downwelling SW radiation and +4% of surface downwelling LW radiation are in agreement with the results of Bangert et al. [88], Huang et al. [89] and Sicard et al. [90]. Bangert et al. [88] used the online coupled model COSMO-ART [91] to study a dust outbreak in the Mediterranean basin which occurred in 2008 and found a reduction of the incoming SW radiation of in the range [40–80] W m−2 and an increase of 10 W m−2 for the incoming LW radiation at the surface.
A more quantitative comparison may be performed by considering the domain-averaged radiative perturbation for both downwelling short- and longwave components. These results, which are reported in Table 9, are in agreement with the above analysis; in particular, we may notice a reduction of −11.8 W m−2 for SSWDN. It is important to note some similarities with other studies in different continents, i.e., that of Kumar et al. [38], which found a regional (northern India) mean value of −10.1 W m−2 for SW dust radiative forcing at the surface, and that of Kalenderski et al. [92], which reported −6 W m−2 for the Arabian Peninsula and Red Sea.
For the SLWDN radiation components, we found a mean regional perturbation increment of 1.7 W m−2, comparable again with Kumar et al. [38], which reported a domain-averaged value of 5.8 ± 5.0 W m−2 for Northern India. The net (SW+LW) radiative perturbation of dust at the surface has a mean cooling effect of −10.1 W m−2, confirming that aerosols reflect solar radiation and reduce sunlight at Earth’s surface, thus exerting a cooling tendency on the Earth system.
A further analysis is here presented based on dust radiative forcing (DRF), which is defined as the variation of the radiative flux due to its scattering and absorption by aerosols. The DRF varies based on surface properties, particle size distribution and chemical composition. It is calculated by the difference between the net (downward minus upward) radiative fluxes (short and longwave) with and without dust in the domain according to the following expressions [22,93,94]:
D R F s w , S U R F = S S W D N F U L L S S W D N C T L S S W U P F U L L S S W U P C T L
D R F s w , T O A = T S W D N F U L L T S W D N C T L T S W U P F U L L T S W U P C T L
D R F l w , S U R F = S L W D N F U L L S L W D N C T L S L W U P F U L L S L W U P C T L
D R F l w , T O A = T L W D N F U L L T L W D N C T L T L W U P F U L L T L W U P C T L
These four expressions for DRF are utilized in order to calculate the net DRF at surface and TOA (shortwave–longwave) as follows:
DRFnetS = D R F s w , S U R F D R F l w , S U R F
DRFnetT = D R F s w , T O A D R F l w , T O A
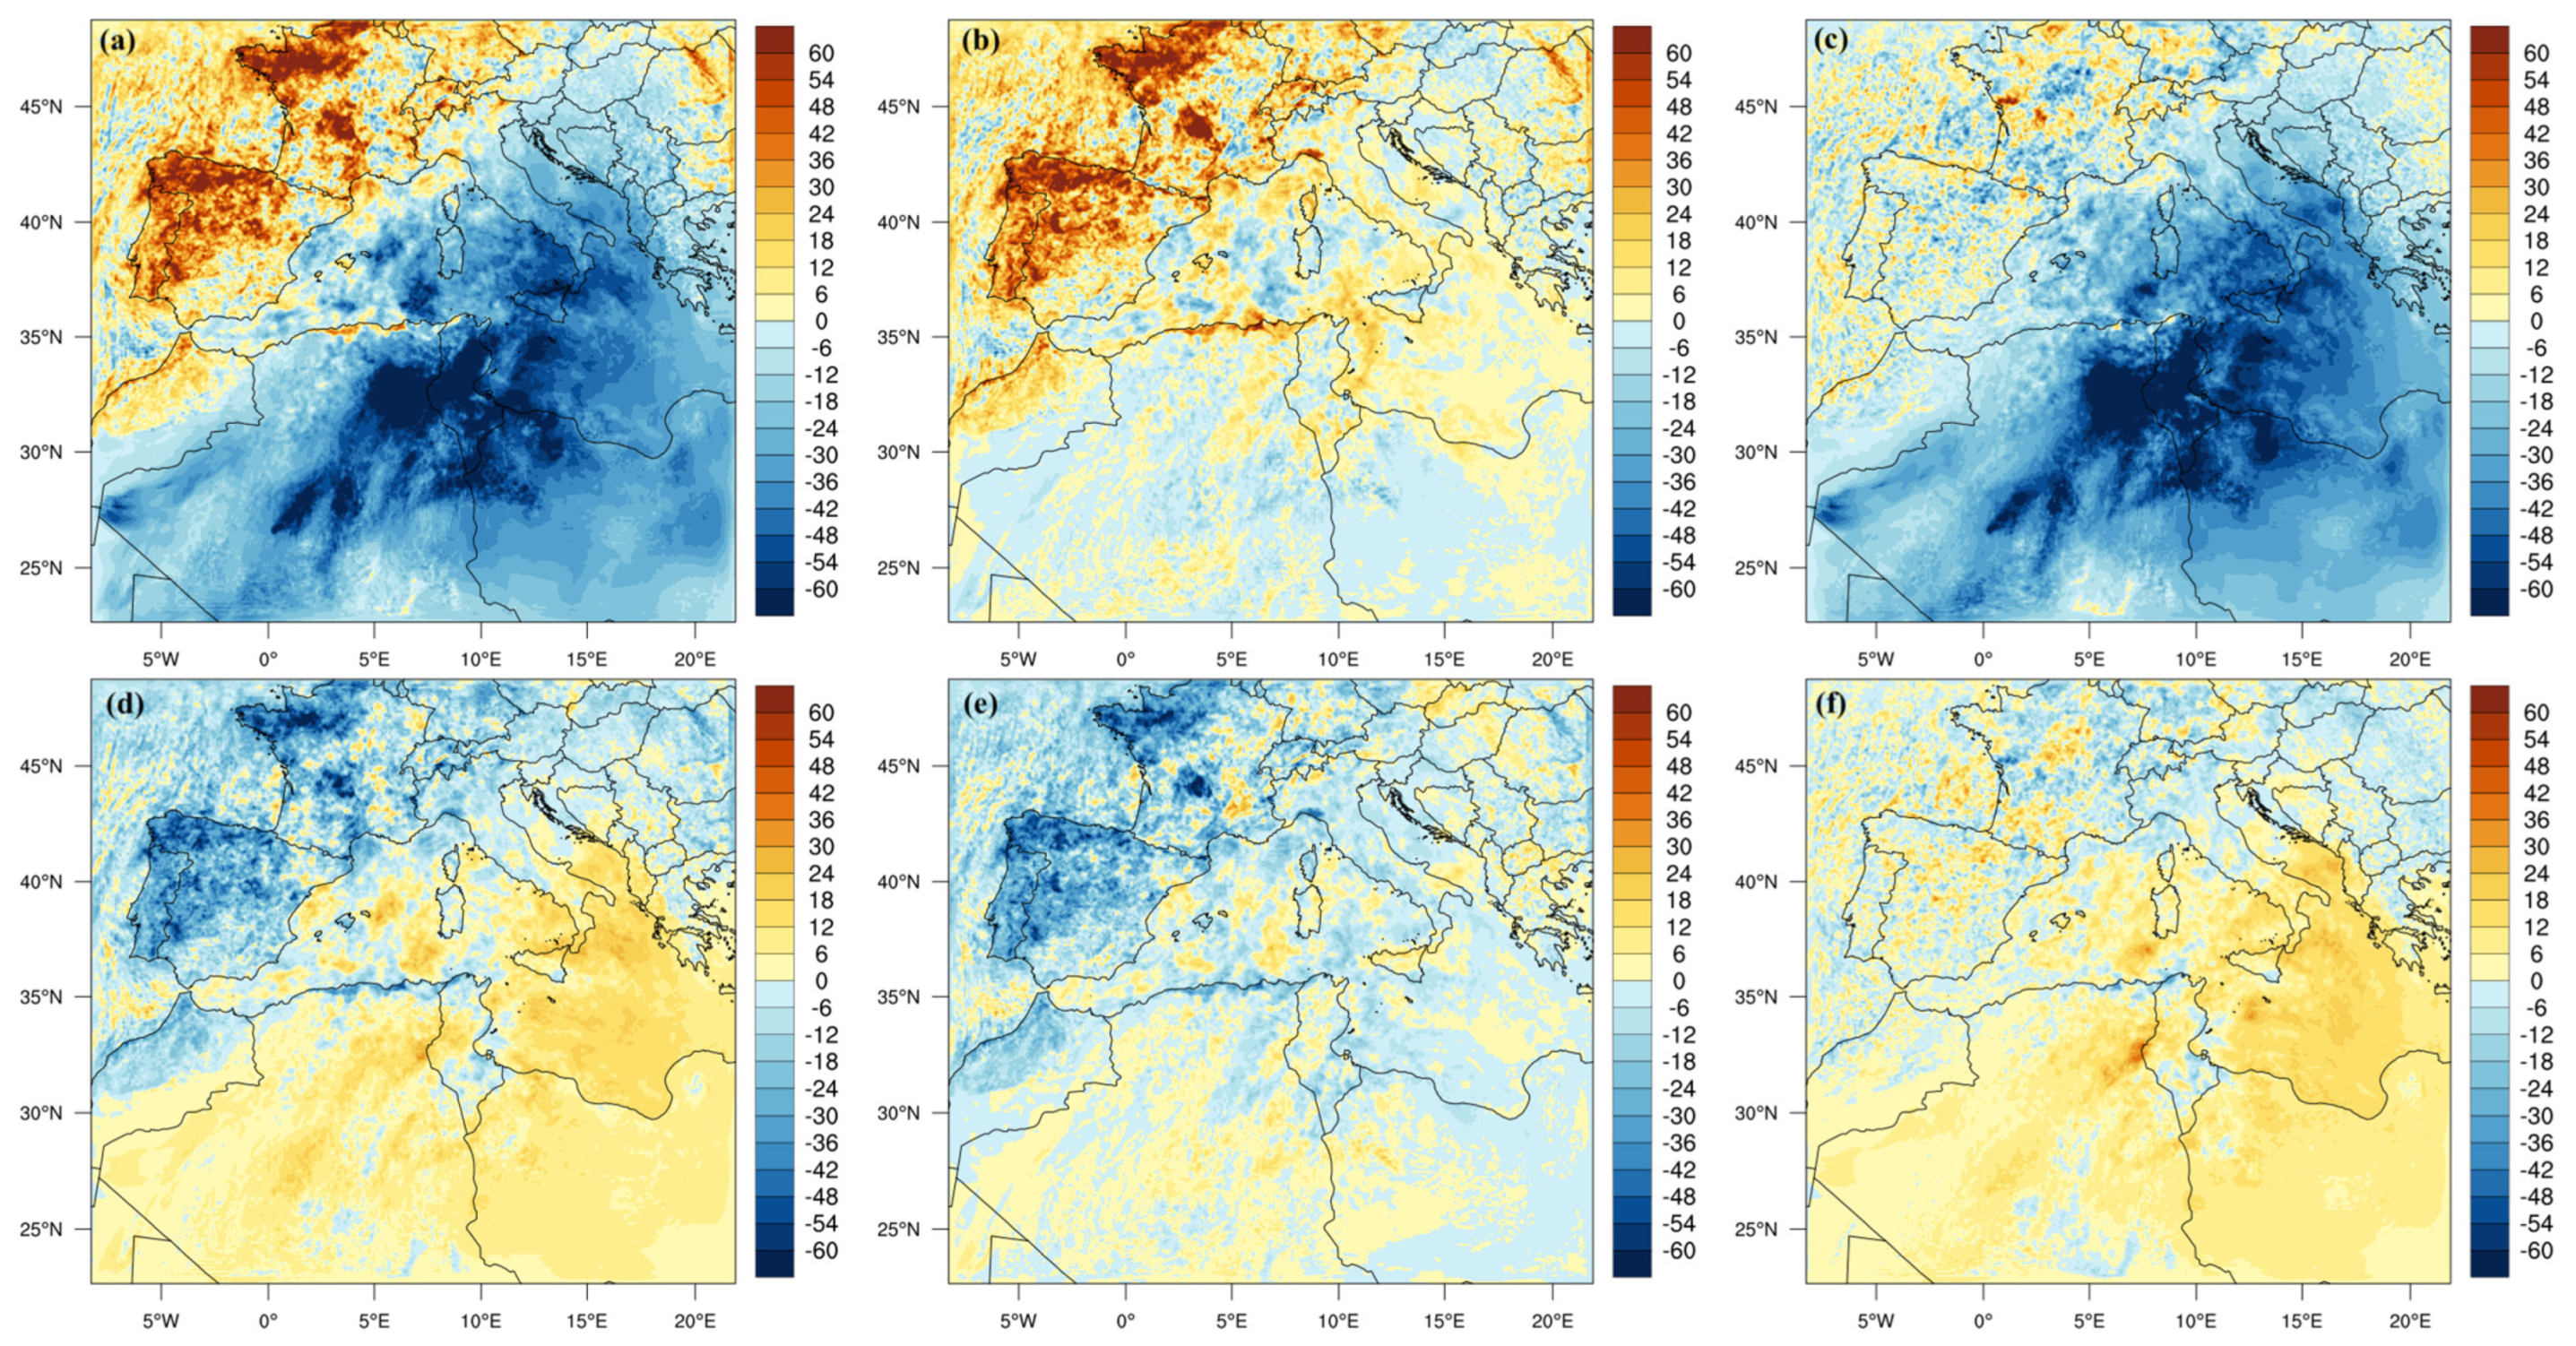
and after performing the 8-days’ period average of equations 4 and 5, their spatial patterns are reported on the six panels of Figure 13.
Analogous expressions may be obtained by changing FULL with MP (only microphysics) and RAD (only radiation) in Equation (3a–d). This allows for an evaluation of the direct and indirect feedback levels on the net DRF at both the surface and TOA.
The upper panel of Figure 13 is obtained by considering Equations (3a,c) and (4) in the case of a fully coupled run (Figure 13a), microphysics coupling alone (Figure 13b) and radiation coupling alone (Figure 13c) at the surface.
The net DRF at the surface (Figure 13a) clearly shows the cooling effect and a consequent reduction to the order of 40–80 W m−2 over the region affected by the dust outbreak (Figure 7a,b), indicating a net cooling effect at the surface caused by dust aerosols as a result of the reduction of SW radiation absorbed and scattered by dust particles [95,96]. Analysis of Figure 13b,c clearly shows that this cooling is almost entirely caused by dust–radiation feedback (Figure 13c).
Additionally, the lower panel of Figure 13 is obtained by considering Equations (3b,d) and (5) in the case of a fully coupled run (Figure 13d), microphysics coupling alone (Figure 13e) and radiation coupling alone (Figure 13f) at TOA. In this case, the simulated results show that the net DRF at TOA may be either negative or positive (Figure 13d), being positive over highly reflective surfaces such as the Sahara Desert in which DRF is reduced due to SW radiation [22]. Moreover, a large amount of AOD in the Mediterranean (Figure 7a,b) contributes to the maximum absorption/emission of the LW radiation and induces warming at the TOA. It is found that the presence of dust particles induces a net warming effect at the TOA which is estimated to be 10 W m−2 over reflective desertic surfaces. These results are in agreement with a similar study on Saharan dust outbreaks by Saidou Chaibou et al. [22].
A quantitative DRF comparison between the different configurations is depicted in Table 10. The average net DRF lost at the surface, in the whole numerical domain, is −14.2 W m−2 and −1.2 W m−2 at TOA. Saidou Chaibou et al. [22], using WRF-Chem for West-Africa and using only dust–radiation feedback, found an average net DRF −13 W m−2 at the surface and +9 W m−2 at TOA.
In order to complete the evaluation of the dust radiative effects, we define the simulated average surface energy balance anomaly ( Δ E ) that is calculated with the following expression [22,93]:
Δ E = E ( F U L L ) E ( C T L )
E = S L W D N S L W U P + ( 1 A × S S W D N ) F g r o u n d
where A is the albedo and F g r o u n d = S H F + L H F + G H is the sum of sensible heat flux (SHF), latent heat flux (LHF) and ground heat flux (GH); all quantities are expressed in W m−2.
The estimation of the dust impact is obtained in terms of anomalies, defined for surface energy fluxes by the difference between the coupled (FULL) and uncoupled (CTL) simulations. As for the DRF, analogous expressions may be obtained by changing FULL with MP (only microphysics) and RAD (only radiation) in Equation (6).
The anomalies of the simulated average surface energy balance, calculated with Equation (6), are reported in Figure 14a–c, which clearly shows how dust causes negative anomalies (up to −30 W m−2). Similar studies [97,98] found that the energy balance may be significantly altered and responds to variation of aerosols and greenhouse gasses. The analysis in Figure 14c shows clearly that the anomaly is almost entirely caused by dust–radiation feedback.
The area average of the surface energy anomaly ( Δ E ) is reported in Table 11. This table shows (i) an energy loss of 7 W m−2 when considering the fully coupled run; (ii) that the indirect effect (MP) represents an energy gain of 3 W m−2 while the direct effect (RAD) an energy loss of −10.4 W m−2; indirect and direct effects tend to overlap in a linear fashion.
As a response to these anomalies on the net radiative forcing, the surface sensible heat flux (SHF), which is associated with the transfer of energy (heat) between the surface and the atmosphere, also changes in order to balance the gain or the loss of energy at the ground level [38]. Subsequently, variations of the SHF have an impact on the turbulent kinetic energy and momentum transfer, which in turn affect near-surface winds and dust emission, as depicted in previous paragraphs. This is shown in Figure 15, which reports the re-gridded turbulent SHF (Figure 15a) from the MERRA-2 Surface Flux Diagnostics package (M2T1NXFLX) and the corresponding SHF from the CTL (Figure 15b) and FULL (Figure 15c) configurations; also, the difference between FULL and CTL is reported (Figure 15d).
A statistical evaluation through the global rmse parameter, calculated with the wgt_arearmse function, on the whole numerical domain yields gl_rmse = 88.5 W m−2 (MERRA-2 vs. CTL) and gl_rmse = 81.6 W m−2 (MERRA-2 vs. FULL). These values are quite high, suggesting that the Eta similarity scheme is likely not appropriate for the surface layer physics, but it is important to point out a relative improvement of the surface SHF description when the FULL simulation is considered.
The analysis from Figure 15a–d reveals a different pattern for the sensible heat flux at the surface; this is likely due to different surface layer parameterizations for the two models. Regardless, the FULL simulation (Figure 15c) shows (i) a decrease in SHF in the portion of the Sahara Desert affected by dust transport (yellow shading), and (ii) that the difference SHF(FULL)-SHF(CTL) shows a reduction to the order of 30 W m−2 over the Sahara Desert due to the presence in the atmosphere of mineral dust particles (Figure 15d).
Finally, knowing the link between radiative properties and atmospheric thermodynamics, we also evaluated the effects of the radiative coupling on the temperature field, considering the 500 hPa and 900 hPa pressure levels. In Figure A2 and Figure A3 of Appendix A, a comparison of the CTL and FULL simulated temperatures is reported, with the corresponding ERA5 reanalysis, at 500 and 900 hPa, respectively.
The temperature from the ERA5 reanalysis (Figure A2a and Figure A3a) is re-gridded over the WRF grid domain (Figure 1) in order to generate a consistent comparison. On each respective panel, “b” and “c” of Figure A2 and Figure A3, we displayed the corresponding averaged fields from the CTL (panel b) and FULL (panel c) runs. Finally, in Figure A2d and Figure A3d, the difference T(FULL)–T(CTL) is reported in order to highlight the temperature warming (yellow–red shading) and cooling (blue shading) regions both at 500 and 900 hPa. Figure A4 of Appendix A reports the total dust distribution at both 500 (Figure A4a) and 900 hPa (Figure A4b); this may be helpful when interpreting the distribution of the temperature field.
Analysis of Figure A2 and Figure A3 reveals a very good reproduction of the temperature at both pressure levels between ERA5 in both the CTL and FULL runs. The temperature fields for the CTL and FULL runs appear to be very similar, but if we analyze their differences (Figure A2d and Figure A3d), a different pattern may be inferred at the two pressure levels. At 500 hPa a prevalent cooling may be observed both overland and overwater with a peak value of −0.25 K over the coast of Libya and an area average value of −0.05 K over the whole domain. Closer to the surface (900 hPa), a warming area with a peak of +0.60 K can be noted over the northern part of the domain (water prevalence), and a cooling area can be noted over the Sahara Desert where the concentration of dust is higher (Figure A4b); an area average value of +0.13 K is present over the whole domain.
4. Conclusions

In this study we investigate the radiative effects during an intense desert dust outbreak that took place in the Mediterranean basin during 17–24 June 2021, based on a regional simulation of the WRF-Chem model. This outbreak was characterized by a series of desert dust plumes transported from the Sahara Desert toward the Mediterranean basin. The identification of the dust outbreaks has been accomplished utilizing a suite of remote sensing experimental data, including satellite retrievals at a resolution of 1 km (MODIS-MAIAC), the thermal emission dust index (TEDI) from VIIRS at a resolution of 750 m, AERONET measurements and aerosol vertical profiles from the ALICEnet lidar-ceilometers network operating in Italy. The meteorological parameters have been compared with ERA5 and MERRA-2 reanalysis products.
The coupling strategy between radiation/microphysics and aerosols has been defined using the Goddard radiation and microphysics schemes, which are coupled with Gocart aerosols in the WRF-Chem model. By performing a series of four simulations, it is possible to discriminate the role of aerosol–radiation and aerosol–microphysics feedback, and consequently the direct, semi-direct and indirect impacts of mineral dust on radiation. These processes modify the dust radiative forcing and the energy budgets at the surface.
Results show that WRF-Chem provides a good comparison of the modeled spatial distribution of AOD with MODIS retrievals. However, significant overprediction occurs in the spatial distribution of AOD over the Sahara part of the domain, which may be related to model configurations, specifically in the calculation of the threshold wind speed with the AFWA dust emission scheme, and surface properties. It is demonstrated that the presence of dust aerosols significantly influences radiative properties, specifically the downwelling components of short/longwave radiative fluxes, the dust radiative forcing and, finally, the surface energy budget. Concerning the downwelling components at the surface, we estimated a net cooling effect of −10.1 W m−2. Considering the DRF, the presence of dust particles induced a net cooling effect at both the SFC and TOA of, respectively, −14.2 and −1.2 W m−2. Finally, analysis of the perturbation of the surface energy budget gives a reduction of −7 W m−2 when considering the FULL simulation, an increase of +3 W m−2 for MP and a decrease of −10.4 W m−2 for RAD simulations. This suggests the necessity of performing fully coupled simulations including aerosols and their feedback with radiation and microphysics.
These results are in agreement with WRF-Chem simulations and other previous studies that used experimental data and chemical transport models (CTM) to study the impact of dust aerosols over the Mediterranean basin (e.g., [39,99]). Being strongly influenced by dust outbreaks from the Sahara Desert, dust–radiation–microphysics coupling should be considered in climate models in order to increase the accuracy of climate predictions in the Mediterranean hot-spot.
The results obtained here relate to a limited period of time and to a specific dust event and would therefore need to be further extended to other significant dust outbreaks to obtain a more complete and long-term picture of the impacts of desert dust on the radiative forcing and surface energy budget in the Mediterranean.

Author Contributions

Conceptualization, U.R. and E.M.; methodology, U.R. and E.A.; software, M.M. and S.V.; validation, A.B., F.B. and L.D.L.; formal analysis, F.B. and L.D.L.; investigation, E.M.; resources, G.P.; data curation, U.R. and A.B.; writing—original draft preparation, U.R. and E.A.; writing—review and editing, U.R., E.M. and F.B.; visualization, A.B., S.V. and M.M.; supervision, G.P. All authors have read and agreed to the published version of the manuscript.

Funding

This research received no external funding.

Data Availability Statement

Not applicable.

Acknowledgments

We acknowledge the MODIS, VIIRS, CERES, MAIAC and MERRA-2 scientists and associated NASA and NOAA personnel for the production of the data used in this research effort. NCEP reanalysis data were provided by the NOAA/OAR/ESRL PSD, Boulder, CO, USA, from their Web site at http://www.esrl.noaa.gov/psd/ (accessed on 20 January 2022). We thank the principal investigators and their staff for establishing and maintaining the AERONET sites whose data have been used in this study. ERA5 fields were downloaded from the Copernicus Climate Change Service (C3S) Climate Data Store; the results are generated using Copernicus Climate Change Service information 2020.

Conflicts of Interest

The authors declare no conflict of interest.

Appendix A

Figure A1. Period average (17–24 June 2021) of the observed (CERES) SW at TOA (a) and modelled (FULL) upwelling SW radiative flux at TOA (b); period average (17–24 June 2021) of the observed (CERES) at TOA (c) and modelled (FULL) upwelling LW radiative flux at TOA (d). Units are W m−2.
Remotesensing 15 00435 g0a1
Figure A2. Averaged (17–24 June) temperature at 500 hPa by (a) ERA5; (b) CTL; (c) FULL; (d) FULL−CTL. Units are K.
Remotesensing 15 00435 g0a2
Figure A3. Averaged (17–24 June) temperature at 900 hPa by (a) ERA5; (b) CTL; (c) FULL; (d) FULL−CTL. Units are K.
Remotesensing 15 00435 g0a3
Figure A4. Averaged (17–24 June) total dust at 500 hPa (a); 900 hPa (b). Units are μ g m−3.
Remotesensing 15 00435 g0a4

References

  1. Sokolik, I.N.; Winker, D.M.; Bergametti, G.; Gilette, D.A.; Carmichel, G.; Kaufmann, Y.J.; Gomes, L.; Schmetz, L.; Penner, J.E. Introduction to special section: Outstanding problems in quantifying the radiative impacts of mineral dust. J. Geophys. Res. 2001, 106, 18015–18027. [Google Scholar] [CrossRef]
  2. Heinold, B.; Tegen, I.; Schepanski, K.; Hellmuth, O. Dust Radiative feedback on Saharan boundary layer dynamics and dust mobilization. Geophys. Res. Lett. 2008, 35, L20817. [Google Scholar] [CrossRef] [Green Version]
  3. Choobari, O.A.; Zawar-Reza, P.; Sturman, A. The global distribution of mineral dust and its impacts on the climate system: A review. Atmos. Res. 2014, 138, 152–165. [Google Scholar] [CrossRef]
  4. Rajot, J.L.; Formenti, P.; Alfaro, S.; Desboeufs, K.; Chevaillier, S.; Chatenet, B.; Gaudichet, A.; Journet, E.; Marticorena, B.; Triquet, S.; et al. AMMA dust experiment: An overview of measurements performed during the dry season special observation period (SOP0) at the Banizoumbou (Niger) supersite. J. Geophys. Res. Atmos. 2008, 113, D23. [Google Scholar] [CrossRef]
  5. Huneeus, N.; Schulz, M.; Balkanski, Y.; Griesfeller, J.; Prospero, J.; Kinne, S.; Bauer, S.; Boucher, O.; Chin, M.; Dentener, F.; et al. Global dust model intercomparison in AeroCom phase I. Atmos. Chem. Phys. 2011, 11, 7781–7816. [Google Scholar] [CrossRef] [Green Version]
  6. Gliß, J.; Mortier, A.; Schulz, M.; Andrews, E.; Balkanski, Y.; Bauer, S.E.; Benedictow, A.M.; Bian, H.; Checa-Garcia, R.; Chin, M.; et al. AeroCom phase III multi-model evaluation of the aerosol life cycle and optical properties using ground-and space-based remote sensing as well as surface in situ observations. Atmos. Chem. Phys. 2021, 21, 87–128. [Google Scholar] [CrossRef]
  7. D’Almeida, G.A. A model for Saharan dust transport. J. Appl. Meteorol. Climatol. 1986, 25, 903–916. [Google Scholar] [CrossRef]
  8. Shao, Y. A model for mineral dust emission. J. Geophys. Res.-Atmos. 2001, 106, 20239–20254. [Google Scholar] [CrossRef]
  9. Molesworth, A.M.; Cuevas, L.E.; Connor, S.J.; Morse, A.P.; Thomson, M.C. Environmental risk and meningitis epidemics in Africa. Emerg. Infect. Dis. 2003, 9, 1287–1293. [Google Scholar] [CrossRef]
  10. Pérez, C.; Haustein, K.; Janjic, Z.; Jorba, O.; Huneeus, N.; Baldasano, J.M.; Black, T.; Basart, S.; Nickovic, S.; Miller, R.L.; et al. Atmospheric dust modeling from meso to global scales with the online NMMB/BSC-Dust model—Part 1: Model description, annual simulations and evaluation. Atmos. Chem. Phys. 2011, 11, 13001–13027. [Google Scholar] [CrossRef]
  11. Prospero, J.M.; Mayol-Bracero, O.L. Understanding the transport and impact of African dust on the Caribbean basin. Am. Meteorol. Soc. 2013, 94, 1329–1337. [Google Scholar] [CrossRef]
  12. Yu, H.; Chin, M.; Bian, H.; Yuan, T.; Prospero, J.M.; Omar, A.H.; Remer, L.A. Quantification of trans-Atlantic dust transport from seven-year (2007–2013) record of CALIPSO lidar measurements. Remote Sens. Environ. 2015, 159, 232–249. [Google Scholar] [CrossRef]
  13. Moulin, C.; Lambert, C.E.; Dayan, U.; Masson, V.; Ramonet, M.; Bousquet, P.; Legrand, M.; Balkanski, Y.J.; Guelle, W.; Marticorena, B.; et al. Satellite climatology of African dust transport in the Mediterranean atmosphere. J. Geophys. Res.-Atmos. 1998, 103, 13137–13144. [Google Scholar] [CrossRef]
  14. Barnaba, F.; Gobbi, G.P. Aerosol seasonal variability over the Mediterranean region and relative impact of maritime, conti- nental and Saharan dust particles over the basin from MODIS data in the year 2001. Atmos. Chem. Phys. 2004, 4, 2367–2391. [Google Scholar] [CrossRef] [Green Version]
  15. Pey, J.; Querol, X.; Alastuey, A.; Forastiere, F.; Stafoggia, M. African dust outbreaks over the Mediterranean Basin during 2001–2011: PM10 concentrations, phenomenology and trends, and its relation with synoptic and mesoscale meteorology. Atmos. Chem. Phys. 2013, 13, 1395–1410. [Google Scholar] [CrossRef] [Green Version]
  16. Rizza, U.; Kandler, K.; Eknayan, M.; Passerini, G.; Mancinelli, E.; Virgili, S.; Morichetti, M.; Nolle, M.; Eleftheriadis, K.; Vasilatou, V.; et al. Investigation of an intense dust outbreak in the mediterranean using XMed-Dry network, multiplatform observations, and numerical modeling. Appl. Sci. 2021, 11, 1566. [Google Scholar] [CrossRef]
  17. Calidonna, C.R.; Avolio, E.; Gullì, D.; Ammoscato, I.; De Pino, M.; Donateo, A.; Lo Feudo, T. Five Years of Dust Episodes at the Southern Italy GAW Regional Coastal Mediterranean Observatory: Multisensors and Modeling Analysis. Atmosphere 2020, 11, 456. [Google Scholar] [CrossRef]
  18. Pérez, C.; Nickovic, S.; Pajanovic, G.; Baldasano, J.M.; Ozsoy, E. Interactive dust-radiation modeling: A step to improve weather forecasts. J. Geophys. Res. 2006, 111, D16206. [Google Scholar] [CrossRef] [Green Version]
  19. Ukhov, A.; Ahmadov, R.; Grell, G.; Stenchikov, G. Improving dust simulations in WRF-Chem model v4. 1.3 coupled with GOCART aerosol module. Geosci. Model Dev. Discuss. 2020, 14, 473–493. [Google Scholar] [CrossRef]
  20. Hong, S.Y.; Kwon, Y.C.; Kim, T.H.; Esther Kim, J.E.; Choi, S.J.; Kwon, I.H.; Kim, J.; Lee, E.; Park, R.; Kim, D. The Korean Integrated Model (KIM) system for global weather forecasting. Asia-Pac. J. Atmos. Sci. 2018, 54, 267–292. [Google Scholar] [CrossRef]
  21. Santese, M.; Perrone, M.R.; Zakey, A.S.; De Tomasi, F.; Giorgi, F. Modeling of Saharan dust outbreaks over the Mediterranean by RegCM3: Case studies. Atmos. Chem. Phys. 2010, 10, 133–156. [Google Scholar] [CrossRef] [Green Version]
  22. Saidou Chaibou, A.A.; Ma, X.; Sha, T. Dust radiative forcing and its impact on surface energy budget over West Africa. Sci. Rep. 2020, 10, 12236. [Google Scholar] [CrossRef]
  23. Huang, C.C.; Chen, S.H.; Lin, Y.C.; Earl, K.; Matsui, T.; Lee, H.H.; Tsai, I.C.; Chen, J.P.; Cheng, C.T. Impacts of Dust–Radiation versus Dust–Cloud Interactions on the Development of a Modeled Mesoscale Convective System over North Africa. Mon. Weather Rev. 2019, 147, 3301–3326. [Google Scholar] [CrossRef]
  24. Barnaba, F.; Bolignano, A.; Di Liberto, L.; Morelli, M.; Lucarelli, F.; Nava, S.; Perrino, C.; Canepari, S.; Basart, S.; Costabile, F.; et al. Desert dust contribution to PM10 loads in Italy: Methods and recommendations addressing the relevant European Commission Guidelines in support to the Air Quality Directive 2008/50. Atmos. Environ. 2017, 161, 288–305. [Google Scholar] [CrossRef]
  25. Barnaba, F.; Bolignano, A.; Basart, S.; Renzi, M.; Stafoggia, M. Multiannual assessment of the desert dust impact on air quality in Italy combining PM10 data with physics-based and geostatistical models. Environ. Int. 2022, 163, 107204. [Google Scholar] [CrossRef]
  26. Grell, G.A.; Peckham, S.E.; Schmitz, R.; McKeen, S.A.; Frost, G.; Skamarock, W.C.; Eder, B. Fully coupled “online” chemistry within the WRF model. Atmos. Environ. 2005, 39, 6957–6976. [Google Scholar] [CrossRef]
  27. Michalakes, J.; Chen, S.; Dudhia, J.; Hart, L.; Klemp, J.; Middlecoff, J.; Skamarock, W. Development of a next-generation regional weather research and forecast model. In Developments in Teracomputing, Proceedings of the Ninth ECMWF Workshop on the Use of High Performance Computing in Meteorology, Reading, UK, 13–17 November 2000; Zwieflhofer, W., Kreitz, N., Eds.; World Scientific: Singapore, 2001; pp. 269–276. [Google Scholar]
  28. Chin, M.; Rood, R.B.; Lin, S.-J.; Muller, J.F.; Thomspon, A.M. Atmospheric sulfur cycle in the global model GO-CART: Model description and global properties. J. Geophys. Res.-Atmos. 2000, 105, 24671–24687. [Google Scholar] [CrossRef]
  29. LeGrand, S.L.; Polashenski, C.; Letcher, T.W.; Creighton, G.A.; Peckham, S.E.; Cetola, J.D. The AFWA dust emission scheme for the GOCART aerosol model in WRF-Chem v3.8.1. Geosci. Model Dev. 2019, 12, 131–166. [Google Scholar] [CrossRef] [Green Version]
  30. Monahan, E.C.; Spiel, D.E.; Davidson, K.L. A model of marine aerosol generation via whitecaps and wave disruption. In Oceanic Whitecaps; Monahan, E.C., Mac Niocaill, G., Eds.; Springer: Dordrecht, The Netherlands, 1986; pp. 167–174. [Google Scholar] [CrossRef]
  31. Gong, S.L. A parameterization of sea-salt aerosol source function for sub-and super-micron particles. Glob. Biogeochem. Cycles 2003, 17. [Google Scholar] [CrossRef]
  32. Rizza, U.; Canepa, E.; Miglietta, M.M.; Passerini, G.; Morichetti, M.; Mancinelli, E.; Virgili, S.; Besio, G.; De Leo, F.; Mazzino, A. Evaluation of drag coefficients under medicane conditions: Coupling waves, sea spray and surface friction. Atmos. Res. 2021, 247, 105207. [Google Scholar] [CrossRef]
  33. Tao, W.K.; Simpson, J.; Baker, D.; Braun, S.; Chou, M.D.; Ferrier, B.; Johnson, D.; Khain, A.; Lang, S.; Lynn, B. Microphysics, radiation and surface processes in the Goddard Cumulus Ensemble (GCE) model. Meteor. Atmos. Phys. 2003, 82, 97–137. [Google Scholar] [CrossRef]
  34. Lang, S.E.; Tao, W.K.; Chern, J.D.; Wu, D.; Li, X. Benefits of a fourth ice class in the simulated radar reflectivities of convective systems using a bulk microphysics scheme. J. Atmos. Sci. 2014, 71, 3583–3612. [Google Scholar] [CrossRef]
  35. Chou, M.D.; Suarez, M.J. A solar radiation parameterization for atmospheric studies. NASA Tech. Memo. 1999, 15, 40. [Google Scholar]
  36. Peters-Lidard, C.D.; Kemp, E.M.; Matsui, T.; Santanello, J.A., Jr.; Kumar, S.V.; Jacob, J.P.; Clune, T.; Tao, W.K.; Chin, M.; Hou, A.; et al. Integrated modeling of aerosol, cloud, precipitation and land processes at satellite-resolved scales. Environ. Model. Softw. 2015, 67, 149–159. [Google Scholar] [CrossRef] [Green Version]
  37. Shi, J.J.; Matsui, T.; Tao, W.K.; Tan, Q.; Peters-Lidard, C.; Chin, M.; Pickering, K.; Guy, N.; Lang, S.; Kemp, E.M. Implementation of an aerosol–cloud-microphysics–radiation coupling into the NASA unified WRF: Simulation results for the 6–7 August 2006 AMMA special observing period. Q. J. R. Meteorol. Soc. 2014, 140, 2158–2175. [Google Scholar] [CrossRef] [Green Version]
  38. Kumar, R.; Barth, M.C.; Pfister, G.G.; Naja, M.; Brasseur, G.P. WRF-Chem simulations of a typical pre-monsoon dust storm in northern India: Influences on aerosol optical properties and radiation budget. Atmos. Chem. Phys. 2014, 14, 2431–2446. [Google Scholar] [CrossRef] [Green Version]
  39. Gkikas, A.; Obiso, V.; Perez Garcia-Pando, C.; Jorba, O.; Hatzianastassiou, N.; Vendrell, L.; Basart, S.; Solomos, S.; Gassó, S.; Baldasano, J.M. Direct radiative effects during intense Mediterranean desert dust outbreaks. Atmos. Chem. Phys. 2018, 18, 8757–8787. [Google Scholar] [CrossRef] [Green Version]
  40. Mamun, A.; Chen, Y.; Liang, J. Radiative and cloud microphysical effects of the Saharan dust simulated by the WRF-Chem model. J. Atmos. Sol. Terr. Phys. 2021, 219, 105646. [Google Scholar] [CrossRef]
  41. National Centers for Environmental Prediction; National Weather Service; NOAA; U.S. Department of Commerce. NCEP GDAS/FNL 0.25 Degree Global Tropospheric Analyses and Forecast Grids; Research Data Archive at the National Center for Atmospheric Research, Computational and Information Systems Laboratory: Boulder, CO, USA, 2015. [CrossRef]
  42. Janjic, Z.I. The step-mountain Eta coordinate model: Further developments of the convection, viscous sublayer and turbulence closure schemes. Mon. Weather Rev. 1994, 122, 927–945. [Google Scholar] [CrossRef]
  43. Niu, G.Y.; Yang, Z.L.; Mitchell, K.E.; Chen, F.; Ek, M.B.; Barlage, M.; Kumar, A.; Manning, K.; Niyogi, D.; Rosero, E.; et al. The community Noah land surface model with multiparameterization options (Noah–MP): 1. Model description and evaluation with local–scale measurements. J. Geophys. Res. 2011, 116, D12. [Google Scholar] [CrossRef] [Green Version]
  44. Stauffer, D.R.; Seaman, N.L. Multiscale four-dimensional data assimilation. J. Appl. Meteorol. Climatol. 1994, 33, 416–434. [Google Scholar] [CrossRef]
  45. Rizza, U.; Mancinelli, E.; Canepa, E.; Piazzola, J.; Missamou, T.; Yohia, C.; Morichetti, M.; Virgili, S.; Passerini, G.; Miglietta, M.M. WRF Sensitivity Analysis in Wind and Temperature Fields Simulation for the Northern Sahara and the Mediterranean Basin. Atmosphere 2020, 11, 259. [Google Scholar] [CrossRef] [Green Version]
  46. Chou, M.-D.; Suarez, M.J. A thermal infrared radiation parameterization for atmospheric studies. NASA Tech. Rep. Serv. 2001, 19, 55. [Google Scholar]
  47. Chin, M.; Ginoux, P.; Kinne, S.; Holben, B.N.; Duncan, B.N.; Martin, R.V.; Logan, J.A.; Higurashi, A.; Nakajima, T. Tropospheric aerosol optical thickness fromt he GOCART model and comparisons with satellite and sunphotometer measurements. J. Atmos. Sci. 2002, 59, 461–483. [Google Scholar] [CrossRef]
  48. Freitas, S.R.; Longo, K.M.; Alonso, M.F.; Pirre, M.; Marecal, V.; Grell, G.; Stockler, R.; Mello, R.F.; Sánchez Gácita, M. PREP-CHEM-SRC—1.0: A preprocessor of trace gas and aerosol emission fields for regional and global atmospheric chemistry models. Geosci. Model Dev. 2011, 4, 419–433. [Google Scholar] [CrossRef] [Green Version]
  49. Khain, A.; Pokrovsky, A.; Pinsky, M.; Seifert, A.; Phillips, V. Simulation of effects of atmospheric aerosols on deep turbulent convective clouds using a spectral microphysics mixed-phase cumulus cloud model. Part I: Model description and possible applications. J. Atmos. Sci. 2004, 61, 2963–2982. [Google Scholar] [CrossRef] [Green Version]
  50. Thompson, G.; Eidhammer, T. A study of aerosol impacts on clouds and precipitation development in a large winter cyclone. J. Atmos. Sci. 2014, 71, 3636–3658. [Google Scholar] [CrossRef]
  51. Koehler, K.A.; Kreidenweis, S.M.; DeMott, P.J.; Prenni, A.J.; Carrico, C.M.; Ervens, B.; Feingold, G. Water activity and activation diameters from hygroscopicity data. Part II: Application to organic species. Atmos. Chem. Phys. 2006, 6, 795–809. [Google Scholar] [CrossRef] [Green Version]
  52. DeMott, P.J.; Prenni, A.J.; Liu, X.; Kreidenweis, S.M.; Petters, M.D.; Twohy, C.H.; Richardson, M.S.; Eidhammer, T.; Rogers, D. Predicting global atmospheric ice nuclei distributions and their impacts on climate. Proc. Natl. Acad. Sci. USA 2010, 107, 11217–11222. [Google Scholar] [CrossRef] [Green Version]
  53. Madhavan, S.; Qu, J.J.; Hao, X. Saharan dust detection using multi-sensor satellite measurements. Heliyon 2017, 3, e00241. [Google Scholar] [CrossRef]
  54. Hao, X.; Qu, J.J. Saharan dust storm detection using moderate resolution imaging spectroradiometer thermal infrared bands. J. Appl. Remote Sens. 2007, 1, 6656–6659. [Google Scholar] [CrossRef]
  55. Madhavan, S.; Sun, J.; Xiong, X. Sensor calibration impacts on dust detection based on MODIS and VIIRS thermal emissive bands. Adv. Space Res. 2021, 67, 3059–3071. [Google Scholar] [CrossRef]
  56. Salomonson, V.V.; Barnes, W.L.; Maymon, P.W.; Montgomery, H.E.; Ostrow, H. MODIS: Advanced facility instrument for studies of the Earth as a system, IEEET. Geosci. Remote 1989, 27, 145–153. [Google Scholar] [CrossRef]
  57. Lyapustin, A.; Wang, Y.; Laszlo, I.; Kahn, R.; Korkin, S.; Remer, L.; Levy, R.; Reid, J.S. Multiangle implementation of atmospheric correction (MAIAC): 2. Aerosol algorithm. J. Geophys. Res. Atmos. 2011, 116. [Google Scholar] [CrossRef]
  58. Lyapustin, A.; Wang, Y.; Korkin, S.; Huang, D. MODIS Collection 6 MAIAC algorithm. Atmos. Meas. Tech. 2018, 11, 5741–5765. [Google Scholar] [CrossRef] [Green Version]
  59. Doelling, D.R.; Loeb, N.G.; Keyes, D.F.; Nordeen, M.L.; Morstad, D.; Nguyen, C.; Wielicki, B.A.; Young, D.F.; Sun, M. Geostationary enhanced temporal interpolation for CERES flux products. J. Atmos. Ocean. Technol. 2013, 30, 1072–1090. [Google Scholar] [CrossRef]
  60. Chen, B.; Zhang, P.; Zhang, B.; Jia, R.; Zhang, Z.; Wang, T.; Zhou, T. An overview of passive and active dust detection methods using satellite measurements. J. Meteorol. Res. 2014, 28, 1029–1040. [Google Scholar] [CrossRef]
  61. Prata, A.J. Infrared radiative transfer calculations for volcanic ash clouds. Geophys. Res. Lett. 1989, 1293, 1296. [Google Scholar] [CrossRef]
  62. Rizza, U.; Donnadieu, F.; Magazu, S.; Passerini, G.; Castorina, G.; Semprebello, A.; Morichetti, M.; Virgili, S.; Mancinelli, E. Effects of Variable Eruption Source Parameters on Volcanic Plume Transport: Example of the 23 November 2013 Paroxysm of Etna. Remote Sens. 2021, 13, 4037. [Google Scholar] [CrossRef]
  63. Efremova, B.; Wu, A.; Xiong, X. Relative spectral response corrected calibration inter-comparison of S-NPP VIIRS and Aqua MODIS thermal emissive bands. Proc. SPIE 2014, 9218, 92180G. [Google Scholar] [CrossRef]
  64. Holben, B.N.; Eck, T.F.; Slutsker, I.; Tanre, D.; Buis, J.P.; Setzer, A.; Vermote, E.; Reagan, J.A.; Kaufman, Y.J.; Nakajima, T.; et al. AERONET—A federated instrument network and data archive for aerosol characterization. Remote Sens. Environ. 1998, 66, 1–16. [Google Scholar] [CrossRef]
  65. Dubovik, O.; King, M.D. A flexible inversion algorithm for retrieval of aerosol optical properties from Sun and sky radiance measurements. J. Geophys. Res.-Atmos. 2000, 105, 20673–20696. [Google Scholar] [CrossRef] [Green Version]
  66. Bellini, A.; Diémoz, H.; Di Liberto, L.; Gobbi, G.P.; Barnaba, F. Monitoring the aerosol vertical profiles across Italy with Alicenet: Retrievals and applications for air quality and multi risk-warning systems. Atmos. Meas. Tech. 2023; in press. [Google Scholar]
  67. Curci, G.; Ferrero, L.; Tuccella, P.; Barnaba, F.; Angelini, F.; Bolzacchini, E.; Carbone, C.; Denier van der Gon, H.A.C.; Facchini, M.C.; Gobbi, G.P.; et al. How much is particulate matter near the ground influenced by upper-level processes within and above the PBL? A summertime case study in Milan (Italy) evidences the distinctive role of nitrate. Atmos. Chem. Phys. 2015, 15, 2629–2649. [Google Scholar] [CrossRef] [Green Version]
  68. Diémoz, H.; Barnaba, F.; Magri, T.; Pession, G.; Dionisi, D.; Pittavino, S.; Tombolato, I.K.F.; Campanelli, M.; Della Ceca, L.S.; Hervo, M.; et al. Transport of Po Valley aerosol pollution to the northwestern Alps—Part 1: Phenomenology. Atmos. Chem. Phys. 2019, 19, 3065–3095. [Google Scholar] [CrossRef] [Green Version]
  69. Diémoz, H.; Gobbi, G.P.; Magri, T.; Pession, G.; Pittavino, S.; Tombolato, I.K.F.; Campanelli, M.; Barnaba, F. Transport of Po Valley aerosol pollution to the northwestern Alps—Part 2: Long-term impact on air quality. Atmos. Chem. Phys. 2019, 19, 10129–10160. [Google Scholar] [CrossRef] [Green Version]
  70. Ferrero, L.; Riccio, A.; Ferrini, B.S.; D’Angelo, L.; Rovelli, G.; Casati, M.; Angelini, F.; Barnaba, F.; Gobbi, G.P.; Cataldi, M.; et al. Satellite AOD conversion into ground PM10, PM2. 5 and PM1 over the Po valley (Milan, Italy) exploiting information on aerosol vertical profiles, chemistry, hygroscopicity and meteorology. Atmos. Pollut. Res. 2019, 10, 1895–1912. [Google Scholar] [CrossRef]
  71. Ferrero, L.; Gregorič, A.; Močnik, G.; Rigler, M.; Cogliati, S.; Barnaba, F.; Di Liberto, L.; Gobbi, G.P.; Losi, N.; Bolzacchini, E. The impact of cloudiness and cloud type on the atmospheric heating rate of black and brown carbon in the Po Valley. Atmos. Chem. Phys. 2012, 21, 4869–4897. [Google Scholar] [CrossRef]
  72. Campanelli, M.; Iannarelli, A.M.; Mevi, G.; Casadio, S.; Diémoz, H.; Finardi, S.; Castelli, E.; Di Sarra, A.; Di Bernardino, A.; Casasanta, G. A wide-ranging investigation of the COVID-19 lockdown effects on the atmospheric composition in various Italian urban sites (AER–LOCUS). Urban Clim. 2012, 39, 100954. [Google Scholar] [CrossRef]
  73. Hernández, A.; Hilboll, A.; Ziereis, H.; Förster, E.; Krüger, O.O.; Kaiser, K.; Schneider, J.; Barnaba, F.; Vrekoussis, M.; Schmidt, J.; et al. Overview: On the transport and transformation of pollutants in the outflow of major population centres–observational data from the EMeRGe European intensive operational period in summer 2017. Atmos. Chem. Phys. 2022, 22, 5877–5924. [Google Scholar] [CrossRef]
  74. Rizza, U.; Barnaba, F.; Miglietta, M.M.; Mangia, C.; Di Liberto, L.; Dionisi, D.; Costabile, F.; Grasso, F.; Gobbi, G.P. WRF-Chem model simulations of a dust outbreak over the central Mediterranean and comparison with multi-sensor desert dust observations. Atmos. Chem. Phys. 2017, 17, 93–115. [Google Scholar] [CrossRef]
  75. Gobbi, G.P.; Barnaba, F.; Di Liberto, L.; Bolignano, A.; Lucarelli, F.; Nava, S.; Perrino, C.; Pietrodangelo, A.; Basart, S.; Costabile, F.; et al. An inclusive view of Saharan dust advections to Italy and the Central Mediterranean. Atmos. Environ. 2019, 201, 242–256. [Google Scholar] [CrossRef]
  76. Wiegner, M.; Geiss, A. Aerosol profiling with the Jenoptik ceilometer CHM15kx. Atmos. Meas. Tech. 2012, 5, 1953–1964. [Google Scholar] [CrossRef] [Green Version]
  77. Dionisi, D.; Barnaba, F.; Diémoz, H.; Di Liberto, L.; Gobbi, G.P. A multiwavelength numerical model in support of quantitative retrievals of aerosol properties from automated lidar ceilometers and test applications for AOT and PM 10 estimation. Atmos. Meas. Tech. 2018, 11, 6013–6042. [Google Scholar] [CrossRef] [Green Version]
  78. Hersbach, H.; Bell, B.; Berrisford, P.; Biavati, G.; Horányi, A.; Muñoz Sabater, J.; Nicolas, J.; Peubey, C.; Radu, R.; Rozum, I.; et al. ERA5 Hourly Data on Single Levels from 1959 to Present. Copernicus Climate Change Service (C3S) Climate Data Store (CDS). 2018. Available online: https://confluence.ecmwf.int/display/CKB/Use+Case+2%3A+ERA5+hourly+data+on+single+levels+from+1959+to+present (accessed on 1 July 2022).
  79. Hersbach, H.; Bell, B.; Berrisford, P.; Biavati, G.; Horányi, A.; Muñoz Sabater, J.; Nicolas, J.; Peubey, C.; Radu, R.; Rozum, I.; et al. ERA5 Hourly Data on Pressure Levels from 1959 to Present. Copernicus Climate Change Service (C3S) Climate Data Store (CDS). 2018. Available online: https://confluence.ecmwf.int/pages/viewpage.action?pageId=127305868 (accessed on 1 July 2022).
  80. Gelaro, R.; McCarty, W.; Suárez, M.J.; Todling, R.; Molod, A.; Takacs, L.; Randles, C.A.; Darmenov, A.; Bosilovich, M.G.; Reichle, R.; et al. The modern-era retrospective analysis for research and applications, version 2 (MERRA-2). J. Clim. 2017, 30, 5419–5454. [Google Scholar] [CrossRef] [PubMed]
  81. Rienecker, M.M.; Suarez, M.J.; Gelaro, R.; Todling, R.; Bacmeister, J.; Liu, E.; Bosilovich, M.G. MERRA: NASA’s modern-era retrospective analysis for research and applications. J. Clim. 2011, 24, 3624–3648. [Google Scholar] [CrossRef]
  82. Rizza, U.; Miglietta, M.M.; Mangia, C.; Ielpo, P.; Morichetti, M.; Iachini, C.; Virgili, S.; Passerini, G. Sensitivity of WRF-Chem model to land surface schemes: Assessment in a severe dust outbreak episode in the Central Mediterranean (Apulia Region). Atmos. Res. 2018, 201, 168–180. [Google Scholar] [CrossRef]
  83. Bohren, C.F.; Huffman, D.R.; Kam, Z. Book-review-absorption and scattering of light by small particles. Nature 1983, 306, 625. [Google Scholar]
  84. Hsu, N.C.; Tsay, S.-C.; King, M.D.; Herman, J.R. Aerosol properties over bright-reflecting source regions, Geoscience and Remote Sensing. IEEE Trans. 2004, 42, 557–569. [Google Scholar] [CrossRef]
  85. Mhawish, A.; Kumar, M.; Mishra, A.K.; Srivastava, P.K.; Banerjee, T. Remote sensing of aerosols from space: Retrieval of properties and applications. In Remote Sensing of Aerosols, Clouds, and Precipitation; Elsevier: Amsterdam, The Netherlands, 2018; pp. 45–83. [Google Scholar]
  86. Pincus, R.; Baker, M. Precipitation, solar absorption and albedo susceptibility in marine boundary layer clouds. Nature 1994, 372, 250–252. [Google Scholar] [CrossRef]
  87. Myhre, G.; Shindell, D.; Bréon, F.-M.; Collins, W.; Fuglestvedt, J.; Huang, J.; Koch, D.; Lamarque, J.-F.; Lee, D.; Mendoza, B.; et al. Anthropogenic and Natural Radiative Forcing. In Climate Change 2013: The Physical Science Basis. Contribution of Working Group I to the Fifth Assessment Report of the Intergovernmental Panel on Climate Change; Stocker, T.F., Qin, D., Plattner, G.-K., Tignor, M., Allen, S.K., Boschung, J., Nauels, A., Xia, Y., Bex, V., Midgley, P.M., Eds.; Cambridge University Press: Cambridge, UK; New York, NY, USA, 2013. [Google Scholar]
  88. Bangert, M.; Nenes, A.; Vogel, B.; Vogel, H.; Barahona, D.; Karydis, V.A.; Kumar, P.; Kottmeier, C.; Blahak, U. Saharan dust event impacts on cloud formation and radiation over western Europe. Atmos. Chem. Phys. 2012, 12, 4045–4063. [Google Scholar] [CrossRef] [Green Version]
  89. Huang, J.; Wang, T.; Wang, W.; Li, Z.; Yan, H. Climate effects of dust aerosols over East Asian arid and semi-arid regions. J. Geophys. Res. 2014, 119, 11398–11416. [Google Scholar] [CrossRef]
  90. Sicard, M.; Bertolín, S.; Mallet, M.; Dubuisson, P.; Comerón, A. Estimation of mineral dust long-wave radiative forcing: Sensitivity study to particle properties and application to real cases in the region of Barcelona. Atmos. Chem. Phys. 2014, 14, 9213–9231. [Google Scholar] [CrossRef] [Green Version]
  91. Vogel, B.; Vogel, H.; Bäumer, D.; Bangert, M.; Lundgren, K.; Rinke, R.; Stanelle, T. The comprehensive model system COSMO-ART–Radiative impact of aerosol on the state of the atmosphere on the regional scale. Atmos. Chem. Phys. 2009, 9, 8661–8680. [Google Scholar] [CrossRef] [Green Version]
  92. Kalenderski, S.; Stenchikov, G.; Zhao, C. Modeling a typical winter-time dust event over the Arabian Peninsula and the Red Sea. Atmos. Chem. Phys. 2013, 13, 1999–2014. [Google Scholar] [CrossRef] [Green Version]
  93. Kantha, L.H.; Clayson, C.A. Small Scale Processes in Geophysical Fluid Flows; Academic Press: New York, USA, 2000; 883p. [Google Scholar]
  94. Quijano, A.L.; Sokolik, I.N.; Toon, O.B. Radiative heating rates and direct radiative forcing by mineral dust in cloudy atmos- pheric conditions. J. Geophys. Res. Atmos. 2000, 105, 12207–12219. [Google Scholar] [CrossRef] [Green Version]
  95. Gu, Y.; Liou, K.N.; Jiang, J.H.; Su, H.; Liu, X. Dust aerosol impact on North Africa climate: A GCM investigation of aerosol-cloud-radiation interactions using A-Train satellite data. Atmos. Chem. Phys. 2012, 12, 1667–1679. [Google Scholar] [CrossRef] [Green Version]
  96. Zhao, C.; Liu, X.; Leung, L.R.; Johnson, B.; McFarlane, S.A.; Gustafson, W.I., Jr.; Fast, J.D.; Easter, R. The spatial distribution of mineral dust and its shortwave radiative forcing over North Africa: Modeling sensitivities to dust emissions and aerosol size treatments. Atmos. Chem. Phys. 2010, 10, 8821–8838. [Google Scholar] [CrossRef] [Green Version]
  97. Mallet, M.; Tulet, P.; Serça, D.; Solmon, F.; Dubovik, O.; Pelon, J.; Pont, V.; Thouron, O. Impact of dust aerosols on the radiative budget, surface heat fluxes, heating rate profiles and convective activity over West Africa during March 2006. Atmos. Chem. Phys. 2009, 9, 7143–7160. [Google Scholar] [CrossRef] [Green Version]
  98. Miller, R.L.; Slingo, A.; Barnard, J.C.; Kassianov, E. Seasonal contrast in the surface energy balance of the Sahel. J. Geophys. Res. 2009, 114, D00E05. [Google Scholar] [CrossRef]
  99. Meloni, D.; Junkermann, W.; Di Sarra, A.; Cacciani, M.; De Silvestri, L.; Di Iorio, T.; Estellés, V.; Gómez-Amo, J.L.; Pace, G.; Sferlazzo, D.M. Altitude-resolved shortwave and longwave radiative effects of desert dust in the Mediterranean during the GAMARF campaign: Indications of a net daily cooling in the dust layer. J. Geophys. Res. Atmos. 2015, 120, 3386–3407. [Google Scholar] [CrossRef]
Figure 1. The WRF-Chem domain, the location of the ground-based remote sensing sites used in this study, including Aeronet stations (Ersa, Roma, L’Aquila, Napoli, and Messina) and sites of the Italian ALICEnet ceilometers network (Roma, Messina, Milano, and Capo Granitola).
Remotesensing 15 00435 g001
Figure 2. Period averaged (17–24 June) aerosol optical depth at 0.55 μm from Modis-MAIAC.
Remotesensing 15 00435 g002
Figure 3. (a) Thermal emissive dust index (TEDI) from the VIIRS NOAA-20 brightness temperature; (b) MODIS/MAIAC aerosol optical depth for 20 June 2021.
Remotesensing 15 00435 g003
Figure 4. Upper panels: NCEP-FNL geopotential height (m) and wind vectors at 500 hPa; bottom panels: NCEP-FNL temperature (K; colors) and geopotential height (m; contours) at 850 hPa. The panels refer to 20 (a,e), 21 (b,f), 22 (c,g) and 23 (d,h) June at 12:00 UTC.
Remotesensing 15 00435 g004
Figure 5. WRF-Chem geopotential height (m) and wind vectors at 500 hPa (upper panels) and 850 hPa (bottom panels), for 20 June at 12:00 UTC (a,c) and for 24 June at 00:00 UTC (b,d).
Remotesensing 15 00435 g005
Figure 6. Period averaged (17–24 June) wind speed at 10 m ( w s 10 ) in m s−1 for: (a) ERA5 reanalysis; (b) CTL run; (c) FULL run and (d) w s 10 difference between CTL and FULL.
Remotesensing 15 00435 g006
Figure 7. Period-averaged (17–24 June) aerosol optical depth at 0.55 μm from the WRF-Chem model under (a) CTL and (b) FULL configurations.
Remotesensing 15 00435 g007
Figure 8. Time series of AOD at 0.55 μm as derived from simulations (continuous and dotted red lines for the CTL and FULL run, respectively), AERONET measurements (black bullets), and ALICENET retrievals (blue bullets) during the period 19–24 June 2021 (x-axis) at different Mediterranean sites: (a) Roma, (b) Messina, (c) Capo Granitola, (d) Ersa, (e) L’Aquila, and (f) Napoli.
Remotesensing 15 00435 g008aRemotesensing 15 00435 g008b
Figure 9. Continuous (h24) time series (17–24 June 2021, x-axis) of the vertically resolved (0–6 km, y-axis) aerosol extinction [at 1.064 μm, (units km−1)] as derived from the four selected ALICENET ALC operating in (a) Milan, (b) Rome, (c) Messina and (d) Capo Granitola. Blank areas are cloud screened. The Messina ALC data are missing from 22 June due to power supply problems.
Remotesensing 15 00435 g009
Figure 10. Continuous (h24) time series of the extinction coefficient at 0.55 μm (units km−1) modeled by WRF-Chem for the period of 17–24 June 2021 (x-axis) by the FULL coupled configuration for (a) Milan, (b) Rome, (c) Messina and (d) Capo Granitola.
Remotesensing 15 00435 g010
Figure 11. Simulated surface shortwave downwelling flux (SSWDN) anomalies; (a) FULL−CTL runs difference; (b) MP−CTL runs difference and (c) RAD−CTL runs difference. Units are W m−2.
Remotesensing 15 00435 g011
Figure 12. Simulated surface longwave downwelling flux (SLWDN) anomalies; (a) FULL−CTL runs difference; (b) MP−CTL runs difference and (c) RAD−CTL runs difference. Units are W m−2.
Remotesensing 15 00435 g012
Figure 13. (a) Average net dust radiative forcing (DRF) at the surface (a) FULL−CTL; (b) MP−CTL; (c) RAD−CTL. Average net DRF at TOA for (d) FULL−CTL; (e) MP−CTL; (f) RAD−CTL. Units are expressed in W m−2.
Remotesensing 15 00435 g013
Figure 14. Simulated 8-day average surface energy budget anomaly Δ E for (a) FULL−CTL, (b) MP−CTL and (c) RAD−CTL. Units are W m−2.
Remotesensing 15 00435 g014
Figure 15. Simulated 8-day average sensible heat flux by (a) MERRA-2 model; (b) CTL, (c) FULL; (d) FULL−CTL. Units are W m−2.
Remotesensing 15 00435 g015
Table 1. Physical and chemical options and the namelist setting within the model.
Microphysicsmp_physics = 74-Ice Goddard Scheme
LW/SW radiationra_sw_physics = 5
ra_lw_physics = 5
New Goddard Shortwave and Longwave Schemes
Surface Layersf_sfclay_physics = 2Eta Similarity Scheme
PBLbl_pbl_physics = 2Mellor–Yamada–Janjic Scheme
Land surfacesf_surface_physics = 4Noah–MP Land Surface Model
chem_optchem_opt = 300GOCART
dust_optdust_opt = 3AFWA
Table 2. Coupling strategy: namelist variables for the different simulation configurations.
Casegsfcrad_gocart_couplinggsfcgce_gocart_couplingCoupling
CTL00No
FULL11Radiation + Microphysics
RAD01Radiation only
MP10Microphysics only
Table 3. Aerosol species defined by Godard coupling strategy.
NAerosol TypeDescription
1SO4sulfur and its precursors
2BC1 + BC2black carbon (soot)
3OC1non hygroscopic OC
4OC2hygroscopic OC
5SS1sea-salt accumulation mode
6SS1 + SS2 + SS3sea-salt coarse mode
7DU1dust mode 1
8DU1dust mode 2
9DU1dust mode 3
10DU1dust mode 4
11DU2dust mode 5
12DU3dust mode 6
13DU4dust mode 7
14DU5dust mode 8
Table 4. Matching of thermal emissive bands between MODIS and VIIRS.
MODIS BandB20B29B31B32
VIIRS BandM12M14M15M16
Table 5. Multiple regression coefficients for TEDI expressed by Equation (1).
CoefficientsC0C1C2C3C4
Values−18.45540.11310.3728−0.84320.4243
Table 6. Location of the AERONET and ALICENET stations selected for this study.
Station Name (Country)Station
Latitude
Station LongitudeAeronet
Sunphotometer
Alicenet Ceilometer
Ersa (France)43.00°N9.36°EYesNo
L’Aquila (Italy)42.37°N 13.35°EYesNo
Messina (Italy)38.20°N15.57°EYesYes
Napoli (Italy)40.84°N14.31°EYesNo
Roma (Italy) 41.60°N12.30°EYesYes
Capo Granitola (Italy)37.50°N12.60°ENoYes
Milano (Italy)45.40°N9.20°ENoYes
Table 7. WRF state variables for Goddard longwave (LW) and shortwave (SW) radiation at the surface and the top of the atmosphere (TOA); units are W m−2.
VariableDescription
SSWDNSurface SW downwelling flux
SLWDNSurface LW downwelling flux
SSWUPSurface SW upwelling flux
SLWUPSurface LW upwelling flux
TSWDNTOA SW downwelling flux
TLWDNTOA LW downwelling flux
TSWUPTOA SW upwelling flux
TLWUPTOA LW upwelling flux
Table 8. Full domain and whole period averages of shortwave (SW) and longwave (LW) radiative fluxes at the top of the atmosphere (TOA) by CERES and WRF-Chem. Units are Wm−2.
(SW) CERES (SW) WRF(LW) CERES(LW) WRF
128.8113.4272.7277.1
Table 9. Area average (wgt_areaave) of the mean downwelling long/shortwave at the surface. Units are W m−2.
FULL-CTL MP-CTL RAD-CTL
SSWDN−11.8+5.5−18.0
SLWDN+1.7−0.05+1.7
Table 10. Area average of mean dust radiative forcing (DRF) at the surface (SURF) [Equation (4)] and top of atmosphere (TOA) [Equation (5)]. Units are W m−2.
FULL-CTLMP-CTLRAD–CTL
DRF (SURF)−14.25.4−20.3
DRF (TOA)−1.2−4.63.7
Table 11. Area average of mean surface energy budget [Equation (6)]. Units are W m−2.
FULL-CTLMP-CTLRAD-CTL
Δ E −7+3−10.4
Disclaimer/Publisher’s Note: The statements, opinions and data contained in all publications are solely those of the individual author(s) and contributor(s) and not of MDPI and/or the editor(s). MDPI and/or the editor(s) disclaim responsibility for any injury to people or property resulting from any ideas, methods, instructions or products referred to in the content.