Article

Boba Shop, Coffee Shop, and Urban Vitality and Development—A Spatial Association and Temporal Analysis of Major Cities in China from the Standpoint of Nighttime Light

1
Department of Urban Planning and Spatial Analysis, Sol Price School of Public Policy, University of Southern California, Los Angeles, CA 90089, USA
2
School of Geography and Planning, Sun Yat-sen University, Guangzhou 510275, China
3
Key Laboratory of Sustainable Development of Xinjiang’s Historical and Cultural Tourism, College of Tourism, Xinjiang University, Urumqi 830049, China
*
Author to whom correspondence should be addressed.
Remote Sens. 2023, 15(4), 903; https://doi.org/10.3390/rs15040903
Submission received: 26 November 2022 / Revised: 31 January 2023 / Accepted: 2 February 2023 / Published: 6 February 2023

Abstract

:
Nighttime light (NTL) is a critical indicator of urban vitality and development. Using NTL as a representation of urban vitality and development, the study explores how different fresh-made beverage shops, namely boba and coffee shops, proxy various facets of urban vitality and development in four megacities in China. Existing studies mostly discuss urban vitality as a broad concept and seldom investigate the diverse urban vitality and development represented by different indicators. This study selects Beijing, Shanghai, Guangzhou, and Shenzhen as case study regions and explores (1) their urban vitality pattern represented by NTL. (2) the heterogeneous spatial distribution of boba and coffee shops; (3) how boba and coffee shops represent urban vitality differently; and (4) how boba and coffee shops portray the economy and population growth aspect of urban development differently. We acquired NTL data from remote sensing images to measure urban vitality and development. Cross-sectionally, the majority of urban vitality and development represented by NTL concentrates in urban centers. The distribution of coffee shops assimilates the spatial pattern of urban vitality represented by NTL while boba shops have a greater spatial extent in metropolitan fringes. Longitudinally, from 2012 to 2020, the global and local bivariate Moran’s I analysis between NTL and beverage shops shows that the coffee shops capture urban vitality and development better than boba shops in Beijing, while the pattern is reversed in Guangzhou and Shenzhen. Examining the evolving spatial dynamics between beverage shops’ growth and urban development using bivariate Moran’s I and Getis–Ord Gi/Mann–Kendall emerging hot spot analysis, we found that the locations with the most intense economic growth have seen the most spatial expansion of coffee shops. In contrast, those with the fastest population growth have seen the greatest spatial development of boba businesses. These results indicate that coffee shops represent the economic aspect of urban vitality while boba shops emphasize the population growth aspects. By examining the dynamic spatio–temporal relationship between small beverage shops and urban vitality and development represented by NTL data, this study broadens the usage of remote sensing data in urban studies and expands on previous research and offers insights for urban planners and geographers to reference when choosing indicators of urban vitality and growth.

1. Introduction

1.1. What Is Urban Vitality?

Urban vitality reflects a city’s competitiveness and attractiveness [1,2,3,4,5,6]. Intuitively, urban vitality refers to large numbers of active people at different times of the day and night; thus, it is directly related to places where activities happen [7,8]. Jane Jacobs defined urban vitality for the first time in 1961 as the production of diverse urban life constituted by human activity and life place [2]. Human activity, an indispensable element of urban vitality, generally refers to the spatio–temporal concentration of human flows [6]. Place is another important element of urban vitality that induces lively social and economic activities, because activities eventually gather in places [2]. In essence, human activity and place are the two major components of understanding urban vitality [9,10].
Urban vitality is the original power and energy of urban development [1,8,11,12,13,14,15]. A vibrant city is a desirable goal for urban planning because it drives urban development by attracting highly skilled talent, stimulating urban innovation, increasing resident happiness, and promoting social sustainability [16]. In contrast, the absence of urban vitality results in a slew of urban issues, including stagnant economic development, waste of land resources, urban decay, deteriorating public safety, and a lack of community cohesion, as well as the potential for ghost towns and cities [17,18,19].
Although it is widely acknowledged that urban vitality is the driving force of urban development, the growth of cities has numerous facets. In other words, urban vitality also has various facets, which are related to different aspects of urban development. Economic and population growth are two of the most notable aspects of urban development in the Chinese urbanization context. China’s economy and population have grown tremendously since the country’s economic and political reforms in 1978, making it one of the nations with the highest rates of urbanization in the world [20,21,22]. The increasing number of people moving into urban areas has driven massive urbanization and economic expansion, which has further enabled the government to upgrade urban infrastructure and encourage urban development [21,23]. Therefore, this study focuses on the economic and population aspects of urban vitality and development.

1.2. Using NTL and Other Data to Measure Urban Vitality

Although there is no broadly accepted consensus on the measurement of urban vitality, nighttime light (NTL) data is one of the most used and evident representations of urban vitality, as it objectively captures human settlements’ spatial distribution from satellites and highly assimilates socio-economic activities over space and time [6,24,25,26,27,28]. Urban social and economic activities often happen in the densely populated bright area of the cities, while few activities happen in sparsely populated dark areas [29,30]. As for NTL’s relationship with urban development, research have demonstrated that NTL has a direct relationship with urban development, particularly in terms of urban expansion, economic productivity, population density, and energy consumption. [31,32,33,34,35,36]. For example, Xie and Weng (2017) used time series DMSP/OLS NTL to detect spatiotemporally urban changes [37]. Lan et al. (2020) measured urban vitality with NPP-VIIRS NTL and discovered the beneficial effect of population growth on urban vitality [38].
Besides NTL, researchers have also measured urban vitality by examining people’s activity and mobility using data from location-based services [39,40], transportation card [41], and social media [42] to measure urban vitality. Or by focusing on urban form and built environments—i.e., where the activities happen—to measure urban vitality. It is overwhelmingly agreed upon that urban form and the built environment are significant factors determining urban vitality, because activities eventually take place in places [12]. Jacobs (1961,1993), Sung and Lee (2015) and Jin et al. (2017) used data on number of city facilities or points of interest (POI) to measure urban vitality [2,9,43]. For example, Yue et al. (2016) used POI data from 15 categories and found a positive association between mixed-type POI and neighborhood vibrancy [44]. Yang et al. (2021) measured the quantity and variety of human activities by calculating restaurant density, entertainment density, shopping density, and service density using POI data [45].

1.3. Small Catering Businesses and Urban Vitality

Small catering businesses, including bars and cafés, can be employed as a place-based POI indicator for urban vitality, since they are hubs of urban economic and public social lives and demonstrate the appeal of cities [46]. Although a small catering business may not represent all aspects of urban vitality, as an integral part of urban life and location attractiveness, scholars use it as a proxy for urban vitality primarily for two reasons [10,47] First, small catering enterprises rely on a steady stream of customers to be successful, so they must be in locations with a high level of urban activity [6,48,49]. Second, the survival of small catering businesses can provide the real-time status of urban vitality, as their turnover rate is high [10].
Among all small catering business, the coffee shop, particularly in the context of western countries, is a critical indicator of urban vitality as it can be seen as the third location of urban life after the workplace and the home, offering individuals areas in which to socialize, develop connections, and exchange ideas [8,50,51]. In the 18th century, coffee shops in downtown London became crucial gathering places where people could discuss news, politics, and scientific advancements, debate ideas, and socialize [52,53,54]. Later, scholars considered coffee shops to be critical components of vibrant places in creative cities [55,56]. In addition, an increasing number of office workers and freelancers prefer coffee shops as co-working spaces [50,57]. The prevalence of coffee shops is now widely acknowledged by academics, particularly those in western countries, to be a predictor of urban vitality and to also be related to urban development and creativity. Researchers have uncovered evidence that coffee shops are directly related to urban vitality and urban innovation, even in the Chinese context. In China’s Greater Bay Area, Chen et al. (2022) discovered that an increase in coffee shops was related to increased urban innovation [1].

1.4. Research Gap of Boba Shops, Urban Vitality, and Urban Development

While coffee has a long history that can be traced back to the 18th century [58], boba tea, alternatively known as bubble tea, milk tea, or tapioca milk tea, has a much shorter history. It became popular in Asia in the 1990s and became well known globally around the 2000s [59]. The global bubble tea industry is rapidly expanding. Assuming a 7.2% annual growth rate, the market had a value of USD 2.20 billion in 2019 and is projected to reach USD 3.39 billion by 2027 [60]. Chinese people prefer tea to coffee because of their long-standing tea culture, with 14 mg of 16 mg caffeine per day being consumed from tea [61,62]. Boba, a tea-based drink, is particularly popular among the younger Chinese generation [63,64]. As a result, China’s boba sector is expanding quickly. For instance, the first half of 2021 saw Nayuki’s Tea, a premium boba tea brand in China, earn USD 328.1 million [65]. Another bubble tea business, Mixue Ice Cream & Tea, which caters to lower-end consumers, has more than 10,000 stores domestically and internationally and generates USD one billion in revenue annually [66].
Although boba shops have grown in popularity worldwide, there has been little research examining how they relate to urban growth and vitality. Most studies on boba tea have looked at its connection to customers’ mental health or buying patterns [67,68]. Even though bubble tea shops and coffee shops are comparable, there has been very little research looking at the connection between bubble tea shops and urban vitality or, more specifically, urban development. This study aims to fill this research gap and extends the existing research by comparably looking at the spatial association between coffee, boba shops and urban vitality, and further, their relationship with different aspects of urban development (Figure 1).

2. Materials and Methods

2.1. Study Area

The studied cities include Beijing, Shanghai, Guangzhou, and Shenzhen, playing important roles as China’s financial, political, innovation, and trade centers, respectively (Figure 2). According to the national bureau of statistics, these are the top four cities in China with the highest regional GDP in 2021 [69]. Beijing and Shanghai are two economic development centers, as the capital city and the frontier of foreign trade since the 1900s, while Guangzhou and Shenzhen are two development engines that have newly evolved since the reform and opening in 1979. Specifically, Beijing is known for its long history, prominent political and cultural position, and its integrated industrial structure, which includes the production of electronics, machinery, chemicals, light industry, textiles, and cars [70]. Shanghai is considered a global financial, trade, economic, and shipping hub with an increasing number of highly educated and skilled people [71]. Both Guangzhou and Shenzhen are located in Guangdong province and the Guangdong–Hong Kong–Macao Greater Bay Area—the largest urban agglomeration in China, previously known as the Pearl River Delta. The urbanization in Shenzhen and Guangzhou is largely driven by foreign investment, thus attracting migrant workers from around the nation. Guangzhou is the largest city and the political, economic, and cultural hub of Guangdong Province [72]. Shenzhen was once famous for its manufacturing industry, and was known as the world’s factory, whereas it is now gradually transforming into the innovation center of China.

2.2. Study Data

2.2.1. Longitudinal Nighttime Light Data 2012–2020

Nocturnal remote sensing captures visible-near-infrared electromagnetic wave information emitted from the earth’s surface under cloud-free conditions. The majority of this information is emitted by human activities, primarily human nighttime lights. In addition, it also includes sources such as oil and gas flaring, offshore fishing vessels, forest fires, and volcanic eruptions. Compared to conventional remote sensing satellite images, nighttime light remote sensing images more directly reflect human activities. There are many sensors that have the capability to detect the light brightness at night, including the OLS sensor on board the U.S. military meteorological satellite DMSP, the VIIRS sensor on board the Suomi NPP satellite, and the Luojia-01 satellite launched by Wuhan University in China, etc. Compared with the DMSP/OLS data, NPP/VIIRS has largely solved the problem of light saturation and increased spatial resolution. However, the parameters of DMSP/OLS and NPP/VIIRS are different in time periods, satellite sensors, and spatial resolution, and thus not comparable with each other across time [73]. Therefore, this study uses monthly average transformed NPP/VIIRS NTL data that were originally captured by the Suomi National Polar Partnership (SNPP) satellite flown by NASA and NOAA (https://ngdc.noaa.gov/eog/viirs/download_ut_mos.html, accessed on 1 August 2022), and integrates with DMSP/OLS data to obtain consistent and comparable long time-series NTL dataset, which is a common practice in existing research [74,75,76,77]. The detailed correction process in this study is as follows. First, we performed continuity correction and logarithmic transformation on the DMSP/OLS annual product and the NPP/VIIRS monthly synthetic product, respectively. Second, we conducted oversaturation correction on DMSP/OLS and NPP/VIIRS data using NDVI data. At last, we further corrected desaturated NPP/VIIRS nighttime light data to be consistent with desaturated DMSP/OLS nighttime light data. The resolution of the used NTL data is about 1 km × 1 km, which is consistent with kilometer spatial grid resolution.

2.2.2. Longitudinal POI Data (2012–2022)

As publicly accessible geographical information data, the spatial distribution and temporal evolution trend of POI can not only reflect the heterogeneity among different areas of a city but can also indicate the development status of a certain urban function. There are two kinds of POI data: basic framework POI, and business application POI. Basic framework POI is the objective composition of real urban space, such as the name and location of shops and restaurants in the real world, while business application POI is the virtual elements generated on the basis of the needs of application scenarios, such as Uber’s recommended pickup and drop-off locations. As we are interested in real-world urban vitality and development, we used the basic framework POI data of boba and coffee shops in our analysis.
For this study, we acquired the longitudinal POI data (2012–2022) for boba tea shops and coffee shops in Beijing, Shanghai, Guangzhou, and Shenzhen via Amap API (https://lbs.amap.com/, accessed on 1 August 2022). According to the POI category code of Amap, we defined coffee shops using POIs under the coffee house subtype (type code: 050500, 050501, 050502, 050503, and 050504) and boba tea shops using POIs under the cold drink shop subtype (type code: 050600). To ensure the data quality, we carried out rigorous data cleaning process on POI data (Table 1) and captured POIs of boba and coffee shops in Beijing, Shanghai, Guangzhou, and Shenzhen from 2012 to 2022 (Table 2).

2.2.3. Longitudinal Kilometer Spatial Grid GDP and Population Data 2010–2020

Although GDP and population distribution data are important basic indicators for the analysis of social and economic development and regional planning, both take administrative divisions as the basic spatial boundary, which makes it impossible to use them to carry out spatial statistics and calculations. Therefore, in order to spatialize the GDP and population distribution data, we uniformly used the GDP and population data in the kilometer spatial grid from the Resource and Environment Science and Data Center, which was processed and provided by the Institute of Geographic Sciences and Natural Resources Research, Chinese Academy of Sciences [78,79]. According to the unified standard, the study area was divided into several 1 km × 1 km pixels, and each pixel was assigned an identifier and an attribute value. The identifier value identifies the spatial data of the pixel, and the attribute value identifies the thematic attribute value of the grid, intuitively and accurately reflecting the spatial distribution of the thematic data in the region. Kilometer grid data distribution processing is a relatively advanced and mature GIS data distribution technology at present. It can convert the data taking administrative divisions as units into kilometer grid units, avoiding data distribution bias caused by administrative division. Spatial grid data per square kilometer of GDP (2010, 2014 and 2019) and population (2010–2020) is calculated based on county-level GDP and population data in the corresponding year. It is weighted and interpolated to kilometer grid using land use data, nighttime light brightness, residential density, and other factors that connect to human activity intensity [80,81,82]. The validation result of the kilometer spatial grid dataset shows that the relative error is between 6–17% for the spatialized GDP data [81] and 4.5–13.6% for spatialized population data [82]. The spatial grid GDP and population data has been widely used in contemporary geographical research [83,84,85]. For example, Kang et al. used spatial grid GDP to represent social factors and analyzed its association with vegetation change in Mongolia [85]. Table 3 shows a description and the source of all analyzed data.

2.3. Study Method

2.3.1. Kernel Density Analysis

Kernel density analysis simulates the distribution of points and line sets in space by calculating the distribution density of different points and line sets in geographic space, so as to objectively reflect the agglomeration form of different elements in space. We used kernel density analysis to visualize the spatial clusters of boba and coffee shops in the four sampled cities (Equation (1)):
p i = 1 n π R 2 × j = 1 n k j 1 D i j 2 R 2 2  
where p i is the kernel density value of the spatial position, D i j is the distance between the spatial point i and the study object j , n is the distance less than or equal to the spatial position to D i j , k j is the spatial weight, and R is the search radius. The geometric meaning of kernel density analysis is that the density value is the highest in each core, and the increase in spatial distance will lead to the decrease in density until the kernel density value is 0. In addition, a different search radius will lead to different results of kernel density analysis.
We used the default research radius computed for the dataset based on the spatial variant of Silverman’s rule of thumb [86] (Equation (2)):
R = 0.9 × min S D , D m × 1 ln 2 × n 0.2
where n is the count of input points, D m is the median of the distance from the mean center, and S D is the standard distance.

2.3.2. Bivariate Moran’s I Analysis

Figure 3 shows the workflow of bivariate Moran’s I used in the study. We first transformed the nightlight raster to points with values and created four 1 km × 1 km fishnets that overlap with the four city boundaries. We chose to set 1 km fishnets, considering that, on the one hand, the resolution of the used NTL, GDP and population data is 1000 m, while on the other hand basing the choice on the size of an ordinary neighborhood unit of approximately 160 acres, defined by [87], which is about 800 m × 800 m square. Second, for each year, we spatially joined the count of boba shop POI, count of coffee shop POI, mean value of the nightlight point, and mean value of GDP to each unit of the fishnet and obtained four resulting polygons for cities with the information above embedded in each 1 km × 1 km fishnet unit. We then moved the analysis platform to GEODA to determine the global and local bivariate Moran’s I estimate for spatial correlation analysis. All the spatial data are projected into the projected coordinate system of WGS 1984 UTM Zone 50 N.
Bivariate Moran’s I has a similar working mechanism to univariate Moran’s I spatial autocorrelation. Instead of analyzing the spatial relationships between variables of interest and their surrounding variables of interest, bivariate Moran’s examines the spatial relationship between independent variables and their surrounding outcome variables. To define spatial weights, we used the Queen’s case method and assigned all the fishnet units that connect with the analyzed fishnet unit either by edge or corners as 1. The bivariate global Moran’s I coefficient is calculated using Equation (3) [88]:
I G B = i ( j w i j y j   ×   x i   ) i x i 2  
where I G B is the global bivariate Moran’s I coefficient, i   represents the i th feature unit (a fishnet grid); j represents the neighbor units of i ; w i j is the spatial weight of j to i (spatial weights matrix); x i is the independent variable value (count of boba or coffee shops) in the analyzed fishnet unit; and y j   is the outcome variable value (NTL or GDP growth) of neighborhood units. All variables are in standardized form, and spatial weights are row standardized (means are 0 and variances equal to 1).
The output of bivariate local Moran is the local indicator of spatial association (LISA), which captures the association between the independent value in the fishnet unit i and the outcome values of the neighboring unit j (Equation (4)). The LISA index produces scatter plots in four quadrants, and the H–H, H–L, L–H, and L–L zones are generated according to the positive or negative signs of x i and j w i j y j   (all variables are standardized) [28,89].
I L B = c x i   j w i j y j    
Here, I L B is the local bivariate Moran’s I coefficient; c is a constant scaling factor; w i j is the spatial weight of j to i (spatial weights matrix); y j   is outcome value of neighborhood units; and x i   is the independent value in the analyzed fishnet unit. All variables are in standardized form, and spatial weights are row standardized (means are 0 and variances equal to 1).

2.3.3. Emerging Hot Spot Analysis

The preparation step of the emerging hot spot analysis is performed to create space–time cubes using 2012 to 2022 yearly boba and coffee shop POI and a 2010–2020 population raster with timestamps. We aggregated the yearly POI points by the 1 km × 1 km fishnet polygon created for four cities and defined the time step interval as one year.
The emerging hot spot analysis employed a combination of Getis–Ord Gi* statistic [90], which identifies spatial clustering in one time section, and Mann–Kendall trend test [91,92], which evaluates temporal trends across time sections [93]. For Getis–Ord Gi* statistic (hot spot analysis), we defined the spatial relationship between bins as the same with bivariate Moran’s I analysis using the Queen’s Case spatial weights matrix. The calculated Getis–Ord Gi* statistic returned z-score ( G i * , Equations (5)–(7)). The larger the statistically significant positive z-score, the more intense the clustering of high values (hot spot). The smaller the statistically significant negative z-score, the more intense the clustering of low values (cold spot). Then, the Mann–Kendall trend test was used to analyze the hot and cold spot temporal trends and returned the trend z-score and p-value for each fishnet unit. We specified the neighborhood time step as one, meaning that the bins were considered to be associated with their counterparts in the next year. The bin value for the first and second time periods are compared. The outcome is +1 if the first is smaller than the second, and is −1, if the first is larger than the second. When values from adjacent time periods are the same, the outcome is 0. The function recorded the z-score and p-value for each bin across time to see if there was a statistically significant difference between the observed sum of results and the expected sum (zero), where there is no trend of value change over time. The statistical significance of the trend is indicated by low p-values. The z-sign score indicates whether the trend represents an increase in bin values (positive z-score) or a drop in bin values (negative z-score) [94]. Based on the result of both the temporal trend and the hot spot analysis, each fishnet unit is categorized as new, consecutive, intensifying, persistent, diminishing, sporadic, oscillating, historical hot/cold spots, or locations with no pattern detected. The definition of the above category can be found in the reference on how emerging hot spot analysis works [95]. Figure 4 shows the workflow of the emerging hot spot analysis.
G i * = j = 1 n w i , j x j X ¯ j = 1 n w i , j S n j = 1 n w i , j 2 j = 1 n w i , j 2 n 1
X ¯ = j = 1 n x j n
S = j = 1 n x j 2 n ( X ¯ ) 2
Here xj is the value of feature j , w i , j is the spatial weight between features i and j , and n is the total number of features.
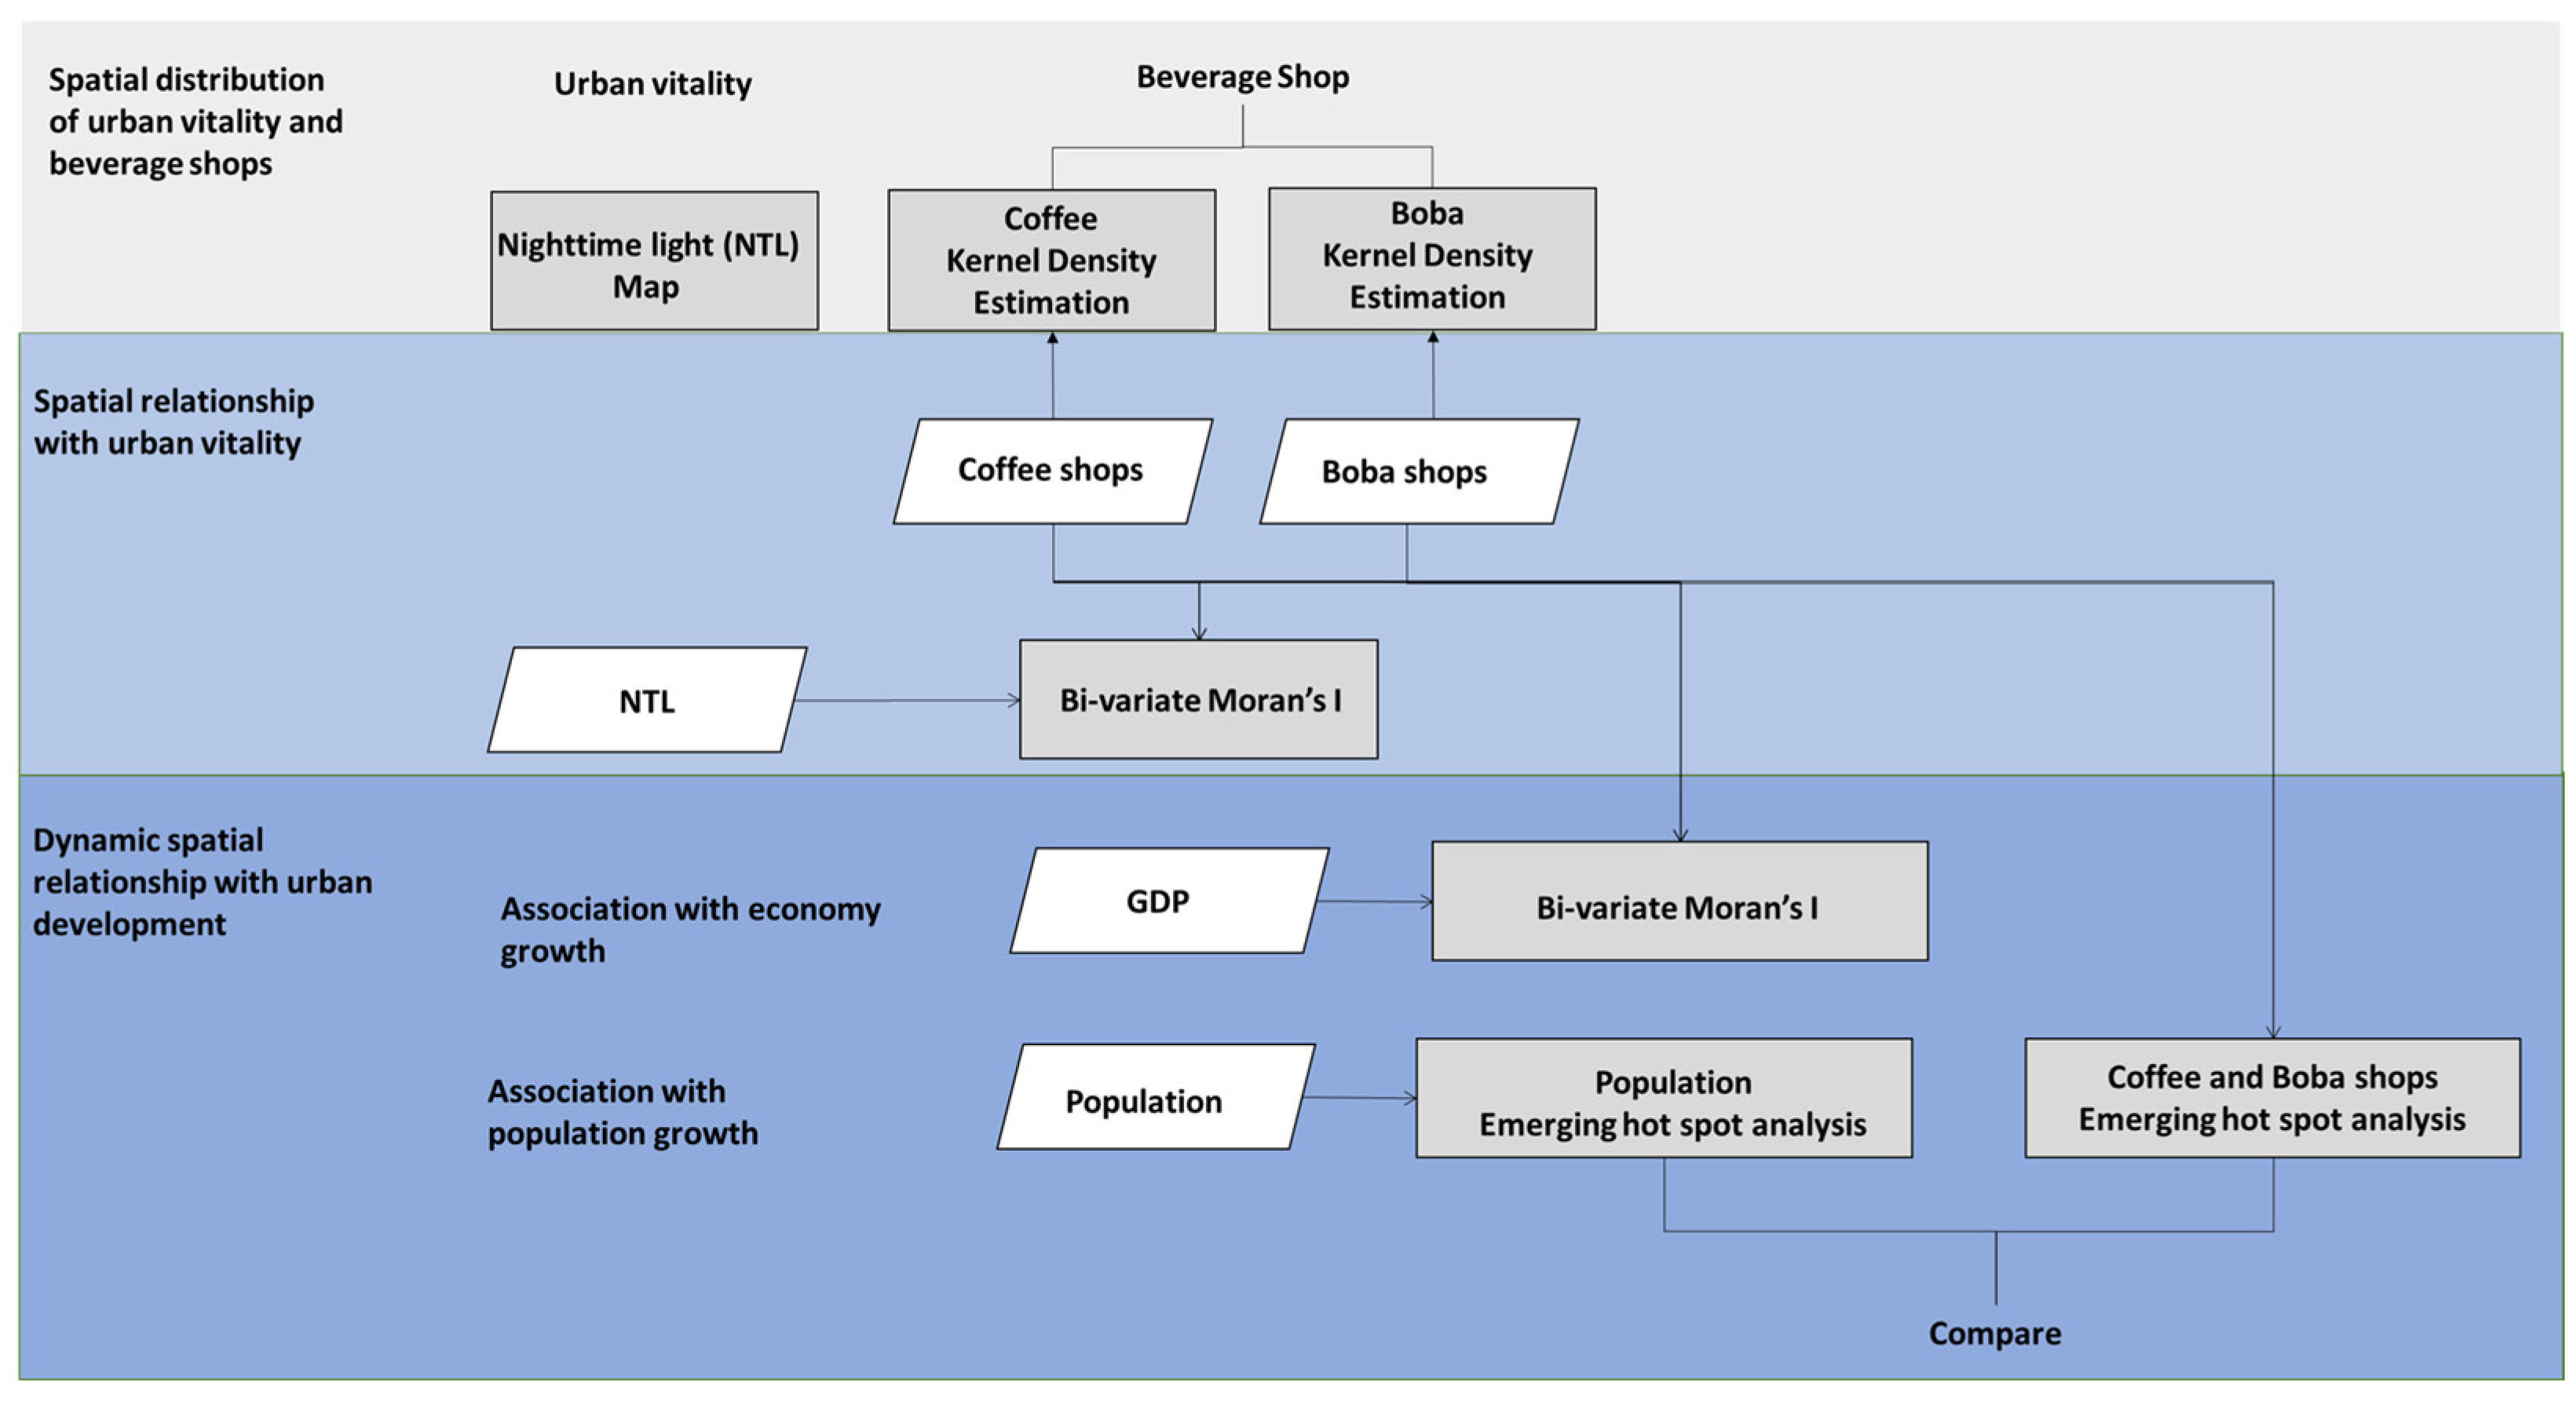
We integrated the methods and data listed in Table 3 into our analysis to better understand the dynamic spatial distribution of urban vitality and the relationship between boba/coffee businesses and urban vitality/development. To answer our first research question regarding the spatial distribution of urban vitality represented by NTL and beverage shops, we employed kernel density analysis to map their location. For the second research question on how boba and coffee shops represent urban vitality, we used bivariate Moran’s I analysis to observe their spatio–temporal global and local spatial association with NTL. In terms of our third research question on how the growth of boba and coffee shops relates to different aspects of urban development, we first investigated their spatial relationship with economic growth using bivariate Moran’s I analysis. We then compared the emerging hot spot analysis results among the growths of coffee shops, boba shops, and population to explore their spatial similarities and differences. The research workflow is shown in Figure 5.

3. Results

3.1. Spatial Distribution of Urban Vitality Represented by Nighttime Light (NTL)

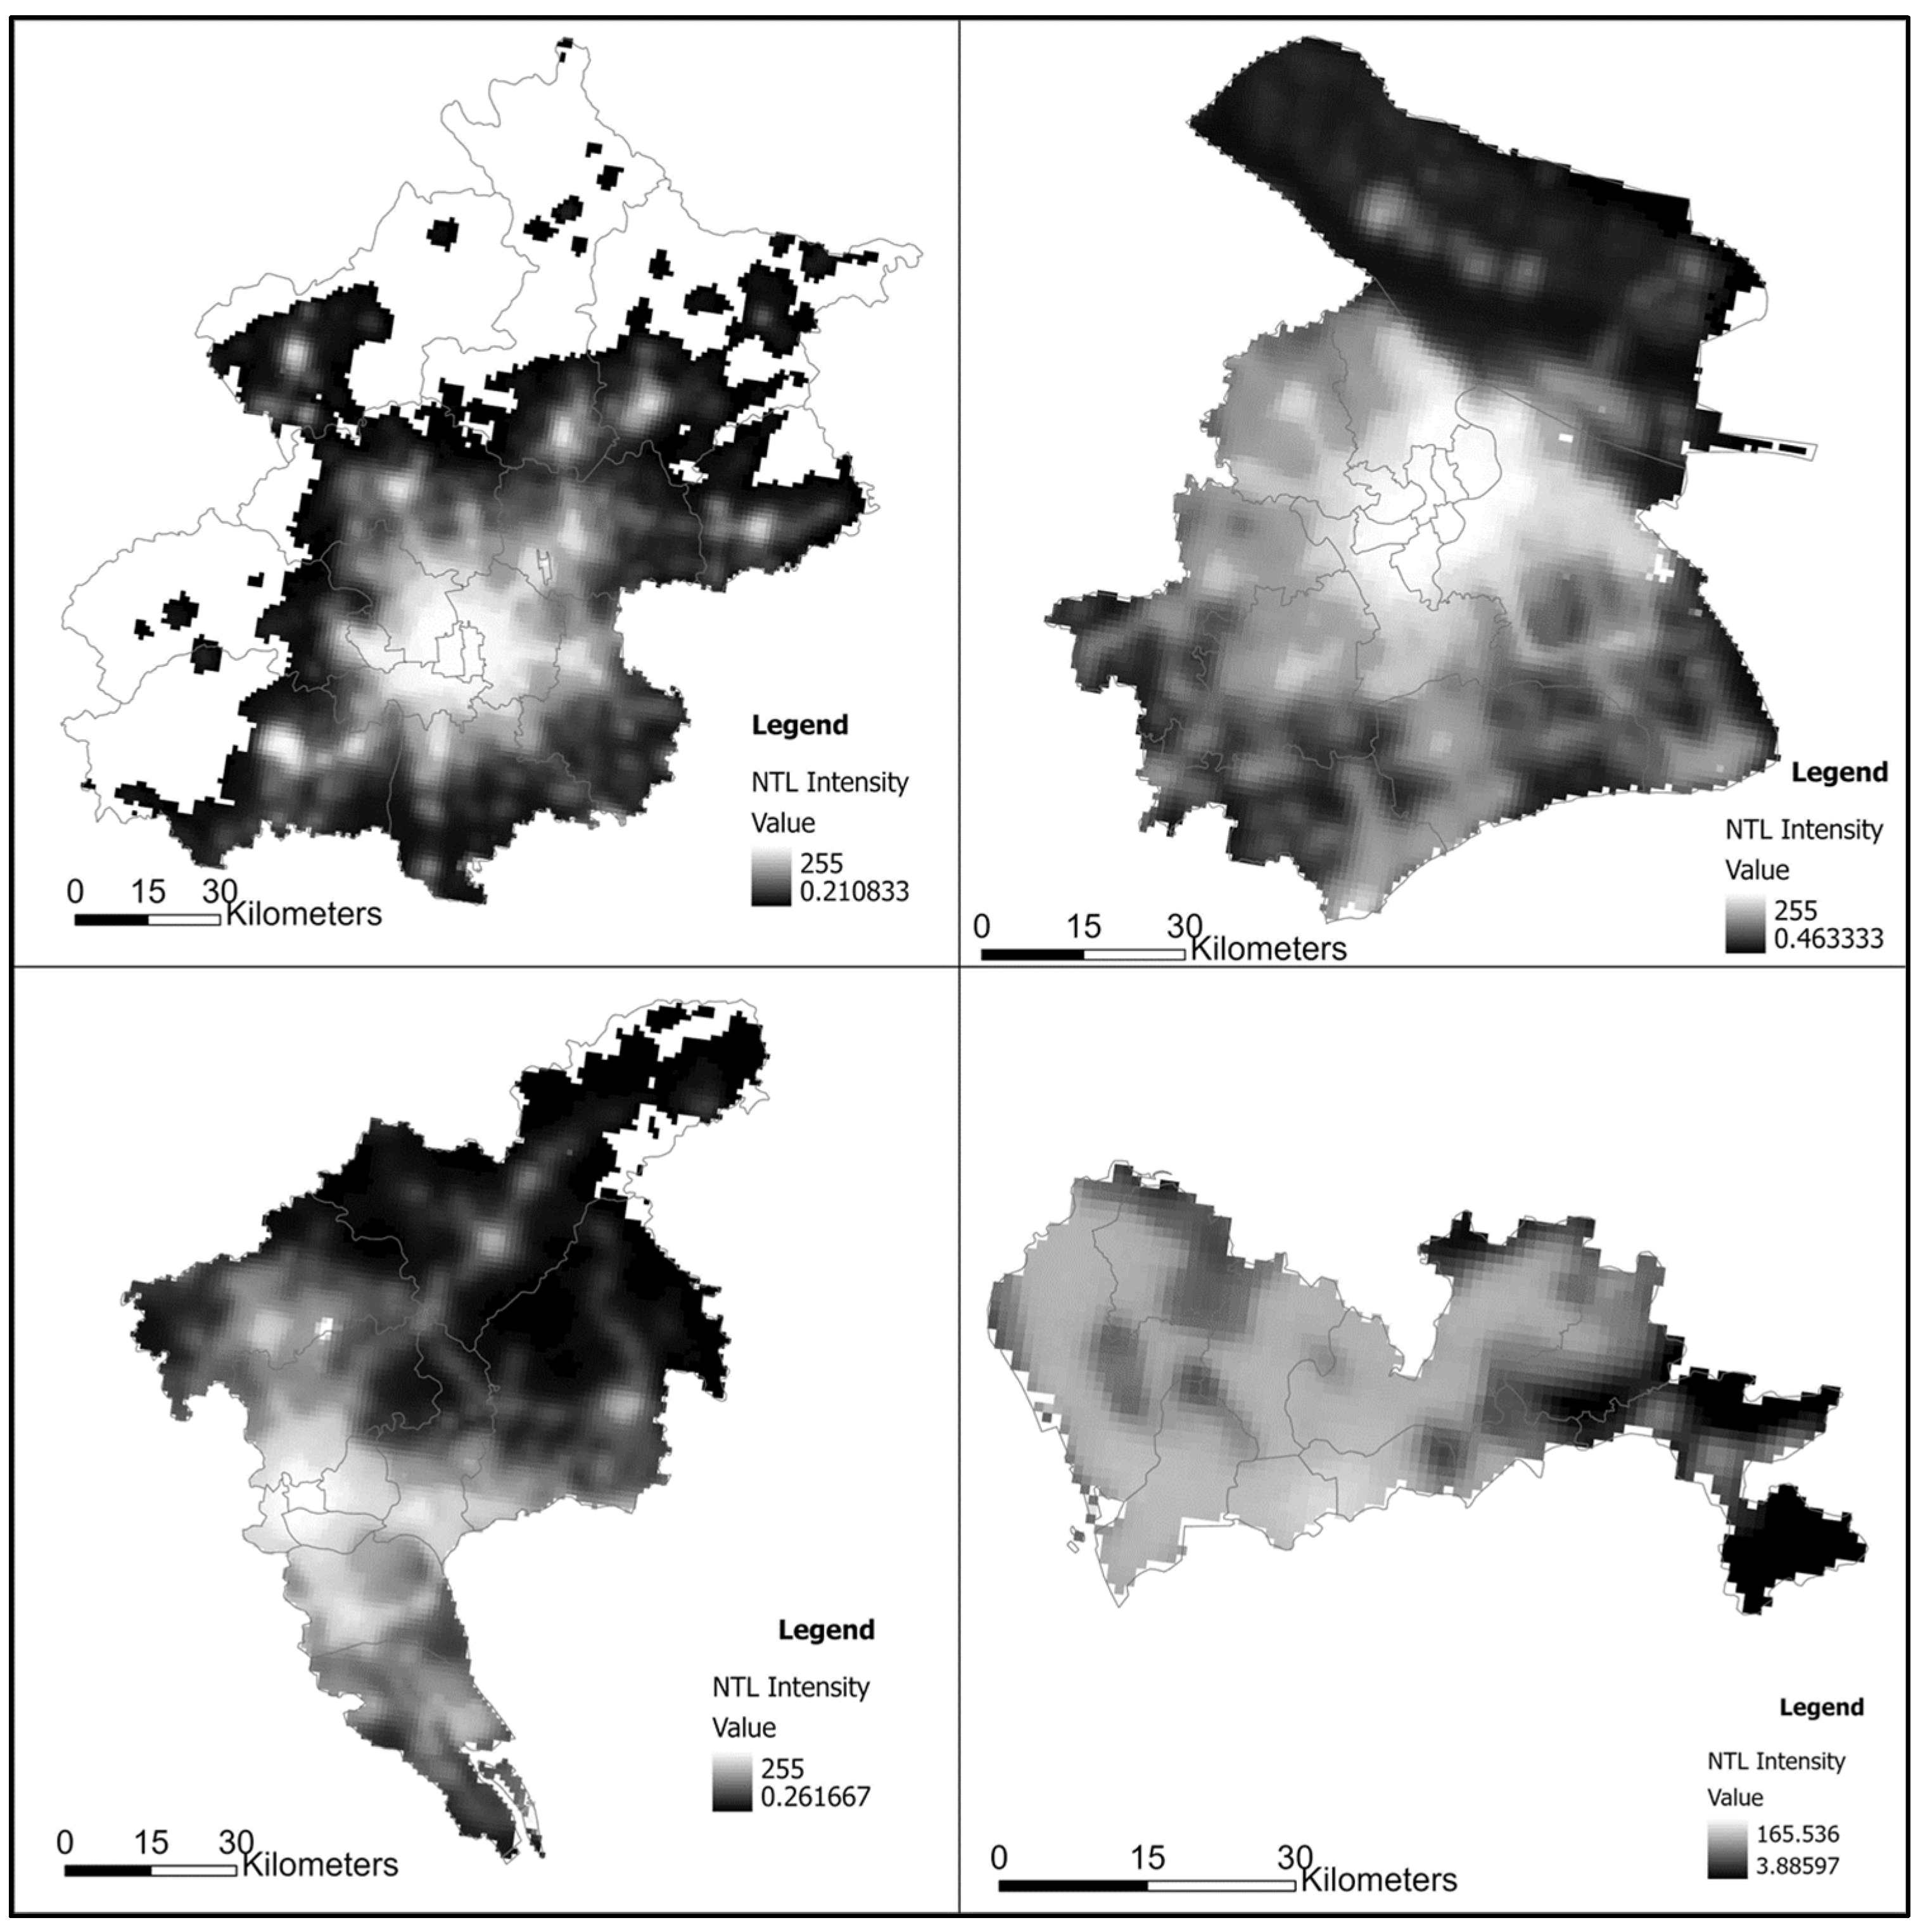
NTL is closely related to urban socioeconomic activities because it distinguishes artificially lit urban areas from natural dark areas [28,96]. Locations with bright nighttime illumination are hubs of human activity [6,37]. In contrast, most dark places are uninhabited or impoverished, and few activities occur there [29]. Therefore, NTL has been a widely accepted and used remote sensing data sources to measure urban vitality.
Figure 6 shows the spatial distribution of the NTL in four studied megacities. The brighter the color, the greater the NTL intensity and the greater the urban vitality. In each of the four cities, the area with the highest urban vitality is concentrated in the urban core, with Beijing, Shanghai, and Guangzhou exhibiting a distinct monocentric pattern. The districts of Xicheng and Dong-cheng in Beijing’s urban core have the highest nightlight intensity and, therefore, urban vitality. Its surrounding districts, including Chaoyang, Haidian, and Fengtian, have the second highest urban vitality. Contrary to this, districts in the urban periphery lack urban vitality. Shanghai’s urban core (Jing’An, Huangpu, Hongkou, Changning, Putuo, and Hongkou districts) is home to the city’s areas with the highest urban vitality. The more remote a region is, the lower its urban vitality. Particularly, the Chongming district has the lowest urban vitality in Shanghai. Central districts in Guangzhou, including Tianhe, Yuexiu, Liwan, and Haizhu, have the highest urban vitality. Even though other neighboring districts have lower urban vitality, they have their own vitality hubs. In Shenzhen, the areas with high urban vitality are two districts neighboring HongKong—Futian and Luohu District, while areas on suburban regions—Longgang District, have the lowest urban vitality.

3.2. Heterogenous Spatial Distribution of Beverage Shops

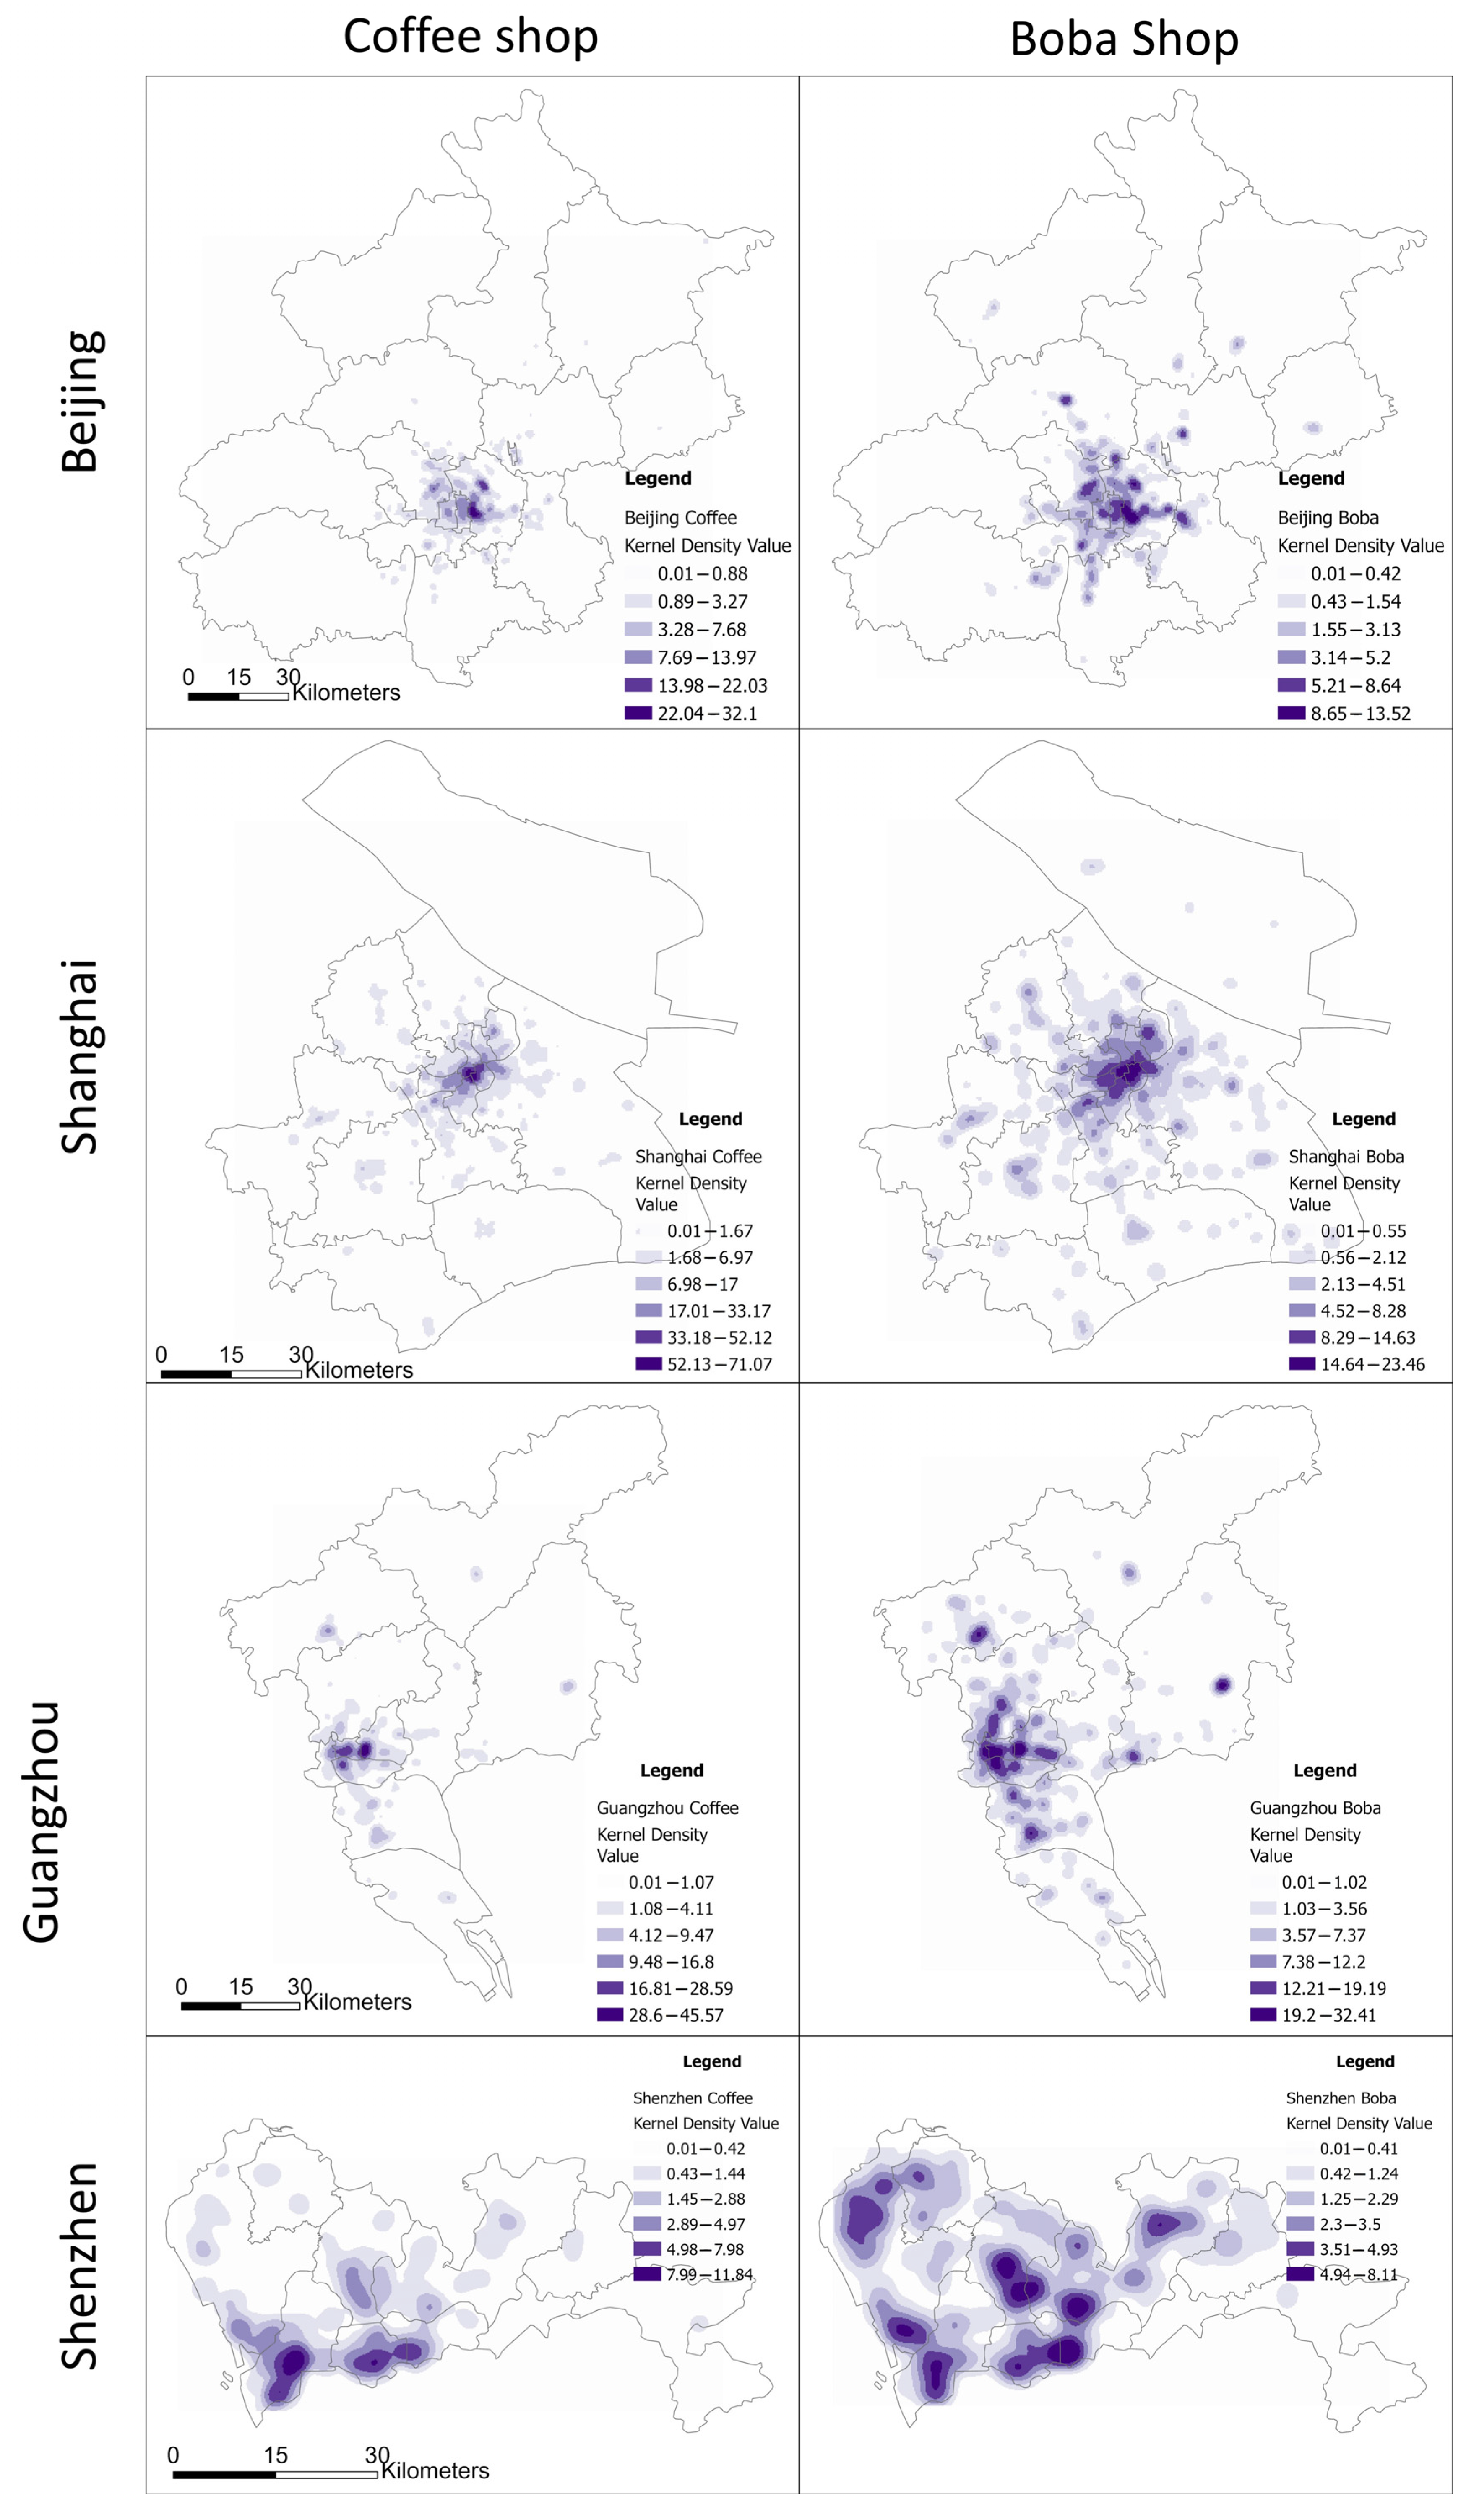
Figure 7 shows the coffee and boba store kernel density maps for the four megacities in 2022, with color classification based on natural breaks (Jenks). There is a noticeable cluster of coffee shops in the central business district (CBD) of the four cities. In Beijing, areas within the fourth ring road are home to the corporate offices of numerous media, technology, and financial organizations. Here, coffee hotspots are grouped together. Shanghai’s coffee shop hotspots are concentrated in the intersections of the Jing’an, Xuhui, and Huangpu districts, where the People’s Square commercial center is located, along with malls, office buildings, and museums. The Tianhe, Yuexiu, and Haizhu districts of Guangzhou are concentrated with coffee shops. The coffee shops are particularly dense in Tianhe CBD, which is where the headquarters of a large firm are located. Most of Shenzhen’s coffee shops are concentrated in the Nanshan, Futian, and Luohu districts, with the Nanshan CBD having the highest density. These areas are home to IT enterprises such as Ali Center and business centers such as Coastal City.
Compared to coffee shops, boba shops have a wider geographic dispersion. Numerous boba clusters can be found across the city, particularly in Guangzhou and Shenzhen. Apart from the Tianhe CBD cluster, Guangzhou’s boba stores are visible in noticeable clusters everywhere else but Nansha District. Similar in Shenzhen, except for Longang District, all other districts in Shenzhen have large and noticeable clusters of boba stores. There are also more clusters of boba shops in Beijing and Shanghai in the areas surrounding the city centers. Overall, the boba shops’ spatial distribution is more extensive than that of coffee shops, but it is less densely concentrated in hot spot locations. In other words, coffee shops are more densely concentrated in city centers, while boba shops are more widely dispersed.

3.3. Beverage Shops and Urban Vitality Represented by NTL

3.3.1. Global Bivariate Spatial Relationship with NTL throughout 2012–2020

We conducted a bivariate Moran’s I analysis between the number of boba or coffee shops and nighttime light (NTL) intensity in Beijing, Shanghai, Guangzhou, and Shenzhen from 2012 to 2020. The larger the coefficient, the stronger the correlation between boba or coffee shop density and NTL intensity, further indicating a stronger association with urban vitality. The results are shown in Figure 8. In Beijing, between 2012 and 2020, coffee shops continuously show a stronger spatial correlation with urban vitality than boba shops. Conversely, in Guangzhou and Shenzhen, boba shops have a stronger spatial correlation with urban vitality than coffee shops (except that in Shenzhen in 2012, the coffee–NTL coefficient was slightly higher than the boba–NTL coefficient). In Shanghai, boba and coffee shops share a similar spatial correlation with urban vitality. From 2012 to 2014, coffee shops and urban vitality were more closely related than boba was. From 2015 to 2018, the tendency was reversed, and from 2019 to 2020, the coffee–NTL coefficient once more outpaced that of boba.

3.3.2. Local Bivariate Spatial Relationship with NTL in 2020

Using bivariate local Moran’s I analysis (LISA), we then looked into the heterogeneity of the spatial association between boba tea shops and coffee shops and nighttime light urban vitality. The results are shown in Figure 9. On a macro scale, the spatial distributions of boba–NTL and coffee–NTL on both LISA maps in every city are similar. The H–H zones (High–High zone, representing places of high boba/coffee density in neighborhoods with places with high nighttime light urban vitality) in all four cities are concentrated in the city centers, where intensive business transactions and activities happen every day, showing that city centers are the places with clusters of both high boba/coffee shop density and nighttime light intensity. L–L zones, which stand for locations with low coffee/boba density and nearby locations with low evening light vitality, tend to cluster in urban peripheral and suburban areas, which often have lower population densities. In Shanghai, for instance, the H–H zones are concentrated in the city’s core, where the Jing’an, Huangpu, Hongkou, Changning, and Xuhui districts are located, but the L–L zones are on Chongming Island, which is on the outskirts of the city. The spatial distribution of H–H and L–L zones is in line with the urban development patterns. Additionally, in four cities, the L–H zones of boba–NTL and coffee–NTL are larger than the H–L zones, demonstrating that neither boba nor coffee businesses are catching the full picture of urban vibrancy symbolized by urban evening light. In contrast, boba and coffee vitality is heavily captured by NTL. This confirms that boba and coffee businesses can serve as a proxy for urban vitality.

3.4. Boba Shops, Coffee Shops and Urban Development

3.4.1. Economic Development

Over the last ten years, we further explored the dynamic spatial relationships between boba and coffee shops growth (2012–2019) and economic growth (2010–2019) for the four sampled cities in China on the basis of bivariate local Moran’s I analysis.
Looking into the local spatial relationship between the expansion of boba and coffee shops and GDP growth within each city (Figure 10, the H–H zones of both coffee growth–GDP growth and boba growth–GDP growth (High–High zone, representing places of high boba/coffee growth with neighbors of places with high GDP growth) are in city centers for all four cities. For instance, both H–H zones of GDP development in Shenzhen are concentrated in the district of Luohu, which borders Hong Kong, and was the earliest developed region in Shenzhen Special Economic Zone, with major commercial and transportation hubs in Shenzhen, such as Dongmen and Renmin South shopping center and Shenzhen Railway Station. Except for Guangzhou, all three cities have more coffee–GDP H–H zones than boba–GDP H–H zones. This finding demonstrates that the four studied cities’ GDP growth is concentrated in the urban core, where coffee shops have likewise expanded and grown. The proliferation of coffee shops is a stronger spatial proxy for urban economic growth than the spread of boba businesses.

3.4.2. Population Growth

Figure 11 shows the emerging hot spot map of boba and coffee shops (2012–2022) and population (2010–2020) for the four megacities. The emerging hot spot map shows the spatial distribution of hot spots and cold spots for the development of certain features over time. Comparing the results of boba and coffee shops, the emerging boba shops are scattered to a broader spatial extent than the coffee shops in all four cities. In terms of hot spot categories, we identified five categories of hot spot: persistent, consecutive, intensifying, new, and sporadic hot spots.
On the one hand, coffee shops have more persistent hot spots than boba shops, meaning that there are more locations in which coffee shops have been consistently identified as hot spots over the past nine years. The persistent hot spots of coffee shops in all four cities all are located in the city centers and city CBDs—central areas within the second ring in Beijing; Lujiazui, the People’s square, and the Bund in Shanghai; Tianhe and Yuexiu business district in Guangzhou; and Nanshan, Futian, and Luohu CBD in Shenzhen. On the other hand, a larger extent and number of hot spots was identified for boba shops, especially in the case of consecutive, sporadic, and new hot spots. This indicates that, compared with coffee, boba is a relatively new phenomenon, but has been gaining more popularity in the recent years. It also indicates that boba shops are more mobile, fluctuating more than coffee shops. Geographically, boba hotspots are dispersed throughout different non-urban districts in addition to the urban center.
The emerging hot spot results regarding population growth are more dispersed than those of coffee shops, but show a similar spatial pattern to that of boba shops. The locations identified as hot spots for population growth are mostly intensifying hot spots, referring to areas in which the density of clusters has increased over time in addition to being statistically significant hot spots for nine years, including the most recent year (2020). In other words, intensifying hot spots are areas in which the population has increased and become more concentrated over the last nine years. The areas with the fastest population growth are not only concentrated in the metropolitan core but can also be found in nearby regions. Overall, boba shop development patterns reflect population increase, suggesting that boba shops are more able to capture the urban vitality brought on by population growth than coffee shops.

4. Discussion

Urban vitality is a complex concept that encompasses multiple levels of urban development, including society, the economy, innovation, population, cultural development, etc. [28]. In this study, we used NTL as a broad gold standard to measure urban vitality and examined which features of urban vitality and development were best represented by the spatial distribution and expansion of coffee and boba shops over the past ten years.
Besides the widely used NTL data, urban vitality is sometimes portrayed via POIs, particularly via those of small catering businesses. However, the majority of prior studies have focused on the broad context of urban vitality, or the concentration of all kinds of human activities at a particular location and moment. For instance, Ye et al. (2017) investigated the general association between urban design and urban vitality using cross-sectional POI data related to small catering firms to represent urban vitality in Shenzhen [10]. Xia et al. (2020) also used small catering businesses as a critical component of urban vitality and explored their spatial relationships with urban land use intensity [97]. Yang et al. (2021) used a Baidu heat map, which was derived from several hundred million mobile application users, to measure urban vitality, and explored the manner in which built environment factors, including POI, land use, and transportation, were related to urban vitality in Shenzhen [45]. In these contexts, urban vitality is mainly measured cross-sectionally, with a focus on the concentration of all human activities, without discussing the specific aspect of urban development they are associated with.
Urban vitality, however, is related to a variety of urban development issues, and its temporal variation is associated with dynamic urban growth. This is a newly developing study theme, with few findings. For instance, Chen et al. (2022) concentrated on the urban innovation component of urban growth and used the quantity of coffee shops to represent urban vitality. Their findings demonstrate that coffee shops’ representation of urban life is favorably related to urban innovation [1]. Our research extends the existing studies by exploring how various small businesses can represent different aspects of urban vitality that drive dynamic urban development over time.
Our empirical findings demonstrate that boba and coffee businesses have diverse geographical distributions and might reflect various facets of urban vitality and development. Where boba stores are distributed more widely within the four cities, coffee businesses are concentrated in the urban core. Beijing’s urban vitality was better captured by coffee shops from 2010 to 2020, whereas Guangzhou and Shenzhen’s urban vitality was better captured by boba shops. A possible explanation behind this phenomenon is that Guangzhou and Shenzhen have a higher proportion of migrant workers compared to Beijing and Shanghai. On the one hand, the Pearl River Delta (PRD), where Guangzhou and Shenzhen are situated, has drawn a significant number of relocated low-skilled and low-value-added industries, especially the manufacturing industry, from developed regions. These industries have since absorbed significant numbers of migrant workers from rural areas, fueling rapid urban growth [98]. Although the PRD wants to move these low-skilled industries to other areas, migrant workers have historically been drawn to and integrated into city life. On the other hand, Beijing and Shanghai were the country’s political and economic hubs and top cities long before the People’s Republic of China was founded, and had access to the best financial and educational resources in the nation. Beijing and Shanghai are therefore less inclusive than Guangzhou and Shenzhen due to higher living costs and more demanding entry requirements. The relationship between boba/coffee shops and urban vitality thus reflects this disparity. In China, coffee is mostly consumed by middle-class consumers, and it is seen as a rather high-end product and a symbol of a high-quality lifestyle [99]. A cup of Starbucks coffee typically costs around CNY 35 in China, whereas the price of a cup of boba varies from CNY 5 to 30. As a result, boba drinks appeal to a wider spectrum of consumers, including young college students and low-wage migrant workers.
The findings are consistent across the four megacities in terms of the relationship between the spread of coffee and boba shops and the economic and population aspects of urban development. The expansion of coffee shops has a stronger spatial correlation with GDP development, while expansion of boba shops has a greater spatial association with population growth. Given that they cater mostly to middle-class consumers who are likely to be high-skilled white-collar workers, expansion of coffee shops is concentrated in metropolitan CBDs, which act as cities’ economic growth engines. Meanwhile, boba shops are starting to appear in other non-CBD neighborhoods in which urban residents live and work.
This study contributes to existing research in the following respects. First, our study extends the usage of NTL in urban vitality analysis. Second, to the best of our knowledge, the study is one of the first to examine the spatial relationship between boba shops and urban vitality, bringing boba shops into the urban vitality and urban development discussion. Third, it expands on previous research that has used all kinds of POI to represent urban vitality globally and looked creatively at the diverse urban vitality and development represented by coffee and boba shops. Lastly, this study examined urban vitality and growth in a dynamic and evolving fashion across time, and it analyzed the manner in which it symbolizes various facets of urban development, rather than perceiving it as a static phenomenon.
However, the study has certain limitations that can be improved upon in the future. First, we used nighttime light as a proxy for urban vitality. Although it has been used to represent urban vitality in multiple previous studies, we acknowledge its limitations. Despite the high geographic stability and impartiality of NTL data, light spillover effects can prevent it from accurately reflecting human activity in metropolitan areas [100,101]. In addition, even with oversaturation correction, it is undeniable that the identification of places such as industrial zones, power plants, and airports on the basis of NTL data may be biased towards high-urban-vitality zones when they are actually low-urban-vitality zones, as few human activities happen there. Future studies could consider the use of data fusion techniques to address the illusion of urban vitality introduced by NTL [102]. Or manually exclude these regions. Second, we have some concerns on the POI data quality. Being a navigation-based tool, Amap attempts to record as many POIs as possible, and it includes a time lag for eliminating closed businesses. As a result, there may be years where businesses are listed as being operational in Amap but are closed in reality. Although we performed a rigorous data cleaning and deduplication process prior to the analysis, we acknowledge the limitation of lagged removal of businesses in the original dataset. Third, although we aimed to compare different sources of data in the same year or the same period of time, there are still some year inconsistencies. For example, we compared the shop growth during 2012–2019 to GDP growth during 2010–2019. Although the general development trend should be consistent, we acknowledge that there is a 2-year difference. Fourth, considering that the GDP and population kilometer grid data was interpolated from the county-level data using land use categories, nighttime light, residential density, and other factors, the GDP and population gridded data is not completely independent of the nighttime light data. However, considering the spatial similarity among places with high GDP, population, and nighttime light intensity, such as CBD, this dependency is expected to affect the result trivially. Fifth, with a more extended dataset, we plan to carry out analyses covering a longer time period since the 1990s in future study.

5. Conclusions

To investigate the spatial distribution of boba and coffee shops and their dynamic spatial relationship with urban vitality and development in four Chinese megacities, we conducted kernel density estimation, bivariate Moran’s I analysis, and emerging hot spot analysis on longitudinal POI data on boba and coffee shops (2012–2022), urban nighttime light data (2010–2020), kilometer spatial grid data on GDP (2010, 2014, and 2019), and population (2010–2020). We found the following:
(1)
The urban vitality indicated by NTL is highly concentrated in urban centers, regions with the most intense economic activities, and coffee shops have a similar spatial distribution, while boba shops have a larger spatial extent in urban peripheries.
(2)
Both boba and coffee shops can represent urban vitality. In Beijing, a political and educational hub teeming with high talent, the spatial distribution of coffee shops better captures urban vitality than boba shops, while in Guangzhou and Shenzhen, cities with a high proportion of migrant workers, boba shops better capture urban vitality than coffee shops.
(3)
Within the four megacities, the spatial expansion of coffee shops during the past ten years corresponds to locations with the most intense economic growth, whereas the spatial expansion of boba shops corresponds to places with a rapid population rise.
This study extends the existing research by dynamically looking into different aspects of urban vitality and development instead of discussing urban vitality in a broad context and from a static perspective. By investigating and comparing the heterogenous urban vitality and development implications from the expansion of boba and coffee shops, we provide new insights, placing the focus on different aspects of urban vitality and development in future study. Based on these study results, future urban planners and geographers will be able to choose indicators accordingly in order to measure the various aspects of urban vitality and urban development.

Author Contributions

Conceptualization, Y.Z., X.H. and B.Z.; methodology, Y.Z. and X.H.; software, Y.Z. and X.H.; validation, Y.Z. and X.H.; formal analysis, Y.Z.; investigation, Y.Z.; resources, X.H.; data curation, Y.Z. and X.H.; writing—original draft preparation, Y.Z.; writing—review and editing, Y.Z. and X.H.; visualization, Y.Z. and X.H.; supervision, B.Z.; project administration, B.Z. All authors have read and agreed to the published version of the manuscript.

Funding

This research received no external funding.

Data Availability Statement

Please contact the corresponding author for the dataset.

Conflicts of Interest

The authors declare no conflict of interest.

References

  1. Chen, Z.; Dong, B.; Pei, Q.; Zhang, Z. The impacts of urban vitality and urban density on innovation: Evidence from China’s Greater Bay Area. Habitat Int. 2021, 119, 102490. [Google Scholar] [CrossRef]
  2. Jacobs, J. The Death and Life of Great American Cities; Random House: New York, NY, USA, 1961. [Google Scholar]
  3. Li, M.; Shen, Z.; Hao, X. Revealing the relationship between spatio-temporal distribution of population and urban function with social media data. Geojournal 2016, 81, 919–935. [Google Scholar] [CrossRef]
  4. Lynch, K. Good City Form; MIT Press: Cambridge, MA, USA, 1984. [Google Scholar]
  5. Yue, W.; Chen, Y.; Thy, P.T.M.; Fan, P.; Liu, Y.; Zhang, W. Identifying urban vitality in metropolitan areas of developing countries from a comparative perspective: Ho Chi Minh City versus Shanghai. Sustain. Cities Soc. 2020, 65, 102609. [Google Scholar] [CrossRef]
  6. Zhang, A.; Li, W.; Wu, J.; Lin, J.; Chu, J.; Xia, C. How can the urban landscape affect urban vitality at the street block level? A case study of 15 metropolises in China. Environ. Plan. B Urban Anal. City Sci. 2020, 48, 1245–1262. [Google Scholar] [CrossRef]
  7. Gehl, J. Life between Buildings; Van Nostrand Reinhold: Washington, DC, USA, 1987. [Google Scholar]
  8. Montgomery, J. Making a city: Urbanity, vitality and urban design. J. Urban Des. 2007, 3, 93–116. [Google Scholar] [CrossRef]
  9. Long, Y.; Huang, C.C. Does block size matter? The impact of urban design on economic vitality for Chinese cities. SAGE J. 2017, 46, 406–422. [Google Scholar] [CrossRef]
  10. Ye, Y.; Li, D.; Liu, X. How block density and typology affect urban vitality: An exploratory analysis in Shenzhen, China. Urban Geogr. 2018, 39, 631–652. [Google Scholar] [CrossRef]
  11. Braun, L.M.; Malizia, E. Downtown vibrancy influences public health and safety outcomes in urban counties. J. Transp. Health 2015, 2, 540–548. [Google Scholar] [CrossRef]
  12. He, Q.S.; He, W.S.; Song, Y.; Wu, J.Y.; Yin, C.H.; Mou, Y.C. The impact of urban growth patterns on urban vitality in newly built-up areas based on an association rules analysis using geographical ‘big data’. Land Use Policy 2018, 78, 726–738. [Google Scholar] [CrossRef]
  13. Landry, C. Urban Vitality: A New Source of Urban Competitiveness. Archis 2000, 12, 8–13. [Google Scholar]
  14. Li, S.-M.; Liu, Y. The jobs-housing relationship and commuting in Guangzhou, China: Hukou and dual structure. J. Transp. Geogr. 2016, 54, 286–294. [Google Scholar] [CrossRef]
  15. Mouratidis, K.; Poortinga, W. Built environment, urban vitality and social cohesion: Do vibrant neighborhoods foster strong communities? Landsc. Urban Plan. 2020, 204, 103951. [Google Scholar] [CrossRef]
  16. Brenner, N. Implosions/Explosions; Jovis: Capri, Italy, 2014. [Google Scholar]
  17. Hall, P.; Pfeiffer, U. Urban Future 21: A Global Agenda for Twenty-First Century Cities; Routledge: London, UK, 2013. [Google Scholar] [CrossRef]
  18. Stead, D.; Hoppenbrouwer, E. Promoting an urban renaissance in England and the Netherlands. Cities 2004, 21, 119–136. [Google Scholar] [CrossRef]
  19. Woodworth, M.D.; Wallace, J.L. Seeing ghosts: Parsing China’s “ghost city” controversy. Urban Geogr. 2017, 38, 1270–1281. [Google Scholar] [CrossRef]
  20. Haas, J.; Ban, Y. Urban growth and environmental impacts in Jing-Jin-Ji, the Yangtze, River Delta and the Pearl River Delta. Int. J. Appl. Earth Obs. Geoinf. 2014, 30, 42–55. [Google Scholar] [CrossRef]
  21. Zhang, Y.; Xie, H. Interactive Relationship among Urban Expansion, Economic Development, and Population Growth since the Reform and Opening up in China: An Analysis Based on a Vector Error Correction Model. Land 2019, 8, 153. [Google Scholar] [CrossRef]
  22. Zhu, X.; Zhang, P.; Wei, Y.; Li, Y.; Zhao, H. Measuring the efficiency and driving factors of urban land use based on the DEA method and the PLS-SEM model—A case study of 35 large and medium-sized cities in China. Sustain. Cities Soc. 2019, 50, 101646. [Google Scholar] [CrossRef]
  23. Huang, Y. Urban Development in Contemporary China. In China’s Geography: Globalization and the Dynamics of Political, Economic and Social Change; Roman & Littlefield Publishers: Lanham, MD, USA, 2006; pp. 233–262. [Google Scholar]
  24. Elvidge, C.D.; Baugh, K.E.; Kihn, E.A.; Kroehl, H.W.; Davis, E.R.; Davis, C.W. Relation between satellite observed visible-near infrared emissions, population, economic activity and electric power consumption. Int. J. Remote. Sens. 1997, 18, 1373–1379. [Google Scholar] [CrossRef]
  25. Li, X.; Xu, H.; Chen, X.; Li, C. Potential of NPP-VIIRS Nighttime Light Imagery for Modeling the Regional Economy of China. Remote. Sens. 2013, 5, 3057–3081. [Google Scholar] [CrossRef]
  26. Li, X.; Levin, N.; Xie, J.; Li, D. Monitoring hourly night-time light by an unmanned aerial vehicle and its implications to satellite remote sensing. Remote. Sens. Environ. 2020, 247, 111942. [Google Scholar] [CrossRef]
  27. Zhang, J.; Liu, X.; Tan, X.; Jia, T.; Senousi, A.M.; Huang, J.; Yin, L.; Zhang, F. Nighttime Vitality and Its Relationship to Urban Diversity: An Exploratory Analysis in Shenzhen, China. IEEE J. Sel. Top. Appl. Earth Obs. Remote. Sens. 2021, 15, 309–322. [Google Scholar] [CrossRef]
  28. Zikirya, B.; He, X.; Li, M.; Zhou, C. Urban Food Takeaway Vitality: A New Technique to Assess Urban Vitality. Int. J. Environ. Res. Public Health 2021, 18, 3578. [Google Scholar] [CrossRef] [PubMed]
  29. Bennett, M.M.; Smith, L.C. Advances in using multitemporal night-time lights satellite imagery to detect, estimate, and monitor socioeconomic dynamics. Remote Sens. Environ. 2017, 192, 176–197. [Google Scholar] [CrossRef]
  30. Hadfield, P. The night-time city. Four modes of exclusion: Reflections on the Urban Studies special collection. SAGE J. 2014, 52, 606–616. [Google Scholar] [CrossRef]
  31. Wang, L.; Wang, S.; Zhou, Y.; Liu, W.; Hou, Y.; Zhu, J.; Wang, F. Mapping population density in China between 1990 and 2010 using remote sensing. Remote. Sens. Environ. 2018, 210, 269–281. [Google Scholar] [CrossRef]
  32. Zhang, Q.; Seto, K.C. Mapping urbanization dynamics at regional and global scales using multi-temporal DMSP/OLS nighttime light data. Remote. Sens. Environ. 2011, 115, 2320–2329. [Google Scholar] [CrossRef]
  33. Dai, Z.; Hu, Y.; Zhao, G. The Suitability of Different Nighttime Light Data for GDP Estimation at Different Spatial Scales and Regional Levels. Sustainability 2017, 9, 305. [Google Scholar] [CrossRef]
  34. Doll, C.N.; Muller, J.-P.; Morley, J.G. Mapping regional economic activity from night-time light satellite imagery. Ecol. Econ. 2006, 57, 75–92. [Google Scholar] [CrossRef]
  35. Huang, Q.; Yang, Y.; Li, Y.; Gao, B. A Simulation Study on the Urban Population of China Based on Nighttime Light Data Acquired from DMSP/OLS. Sustainability 2016, 8, 521. [Google Scholar] [CrossRef]
  36. Sutton, P.C.; Elvidge, C.D.; Ghosh, T. Estimation of gross domestic product at sub-national scales using nighttime satellite imagery. Int. J. Ecol. Econ. Stat. 2007, 8, 5–21. [Google Scholar]
  37. Xie, Y.; Weng, Q. Spatiotemporally enhancing time-series DMSP/OLS nighttime light imagery for assessing large-scale urban dynamics. ISPRS J. Photogramm. Remote. Sens. 2017, 128, 1–15. [Google Scholar] [CrossRef]
  38. Lan, F.; Gong, X.; Da, H.; Wen, H. How do population inflow and social infrastructure affect urban vitality? Evidence from 35 large- and medium-sized cities in China. Cities 2020, 100, 102454. [Google Scholar] [CrossRef]
  39. Jin, X.; Long, Y.; Sun, W.; Lu, Y.; Yang, X.; Tang, J. Evaluating cities’ vitality and identifying ghost cities in China with emerging geographical data. Cities 2017, 63, 98–109. [Google Scholar] [CrossRef]
  40. Wu, W.; Niu, X. Influence of Built Environment on Urban Vitality: Case Study of Shanghai Using Mobile Phone Location Data. J. Urban Plan. Dev. 2019, 145, 04019007. [Google Scholar] [CrossRef]
  41. Sulis, P.; Manley, E.; Zhong, C.; Batty, M. Using mobility data as proxy for measuring urban vitality. J. Spat. Inf. Sci. 2018, 16, 137–162. [Google Scholar] [CrossRef]
  42. Wu, J.; Ta, N.; Song, Y.; Lin, J.; Chai, Y. Urban form breeds neighborhood vibrancy: A case study using a GPS-based activity survey in suburban Beijing. Cities 2018, 74, 100–108. [Google Scholar] [CrossRef]
  43. Sung, H.; Lee, S. Residential built environment and walking activity: Empirical evidence of Jane Jacobs’ urban vitality. Transp. Res. Part D: Transp. Environ. 2015, 41, 318–329. [Google Scholar] [CrossRef]
  44. Yue, Y.; Zhuang, Y.; Yeh, A.G.-O.; Xie, J.-Y.; Ma, C.-L.; Li, Q.-Q. Measurements of POI-based mixed use and their relationships with neighbourhood vibrancy. Int. J. Geogr. Inf. Sci. 2017, 31, 658–675. [Google Scholar] [CrossRef]
  45. Yang, J.; Cao, J.; Zhou, Y. Elaborating non-linear associations and synergies of subway access and land uses with urban vitality in Shenzhen. Transp. Res. Part A Policy Pr. 2020, 144, 74–88. [Google Scholar] [CrossRef]
  46. Montgomery, J. Café culture and the city: The role of pavement cafés in urban public social life. J. Urban Des. 2007, 2, 83–102. [Google Scholar] [CrossRef]
  47. Zukin, S. Naked City: The Death and Life of Authentic Urban Places; Oxford University Press: Oxford, UK, 2009. [Google Scholar]
  48. Dong, L.; Ratti, C.; Zheng, S. Predicting neighborhoods’ socioeconomic attributes using restaurant data. Proc. Natl. Acad. Sci. USA 2019, 116, 15447–15452. [Google Scholar] [CrossRef] [Green Version]
  49. Philipsen, K. How Food Became the Ferment of Urbanity. Community Architecture Website. 2015. Available online: http://archplanbaltimore.blogspot.com/2015/10/how-food-became-ferment-of-urbanity.html (accessed on 1 August 2022).
  50. Ferreira, J.; Ferreira, C.; Bos, E. Spaces of consumption, connection, and community: Exploring the role of the coffee shop in urban lives. Geoforum 2021, 119, 21–29. [Google Scholar] [CrossRef]
  51. Oldenburg, R. The Great Good Place: Cafes, Coffee Shops, Bookstores, Bars, Hair Salons, and Other Hangouts at the Heart of a Community; Da Capo Press: Cambridge, MA, USA, 1999. [Google Scholar]
  52. Ellis, A. The Penny Universities: A History of the Coffee-Houses; Secker & Warburg: London, UK, 1956. [Google Scholar]
  53. Morris, J. Coffee: A Global History; Reaktion Books: London, UK, 2018. [Google Scholar]
  54. Pendergrast, M. Uncommon grounds: The History of Coffee and how it Transformed Our World; Basic Books: New York, NY, USA, 2010. [Google Scholar]
  55. Landry, C. The Creative City: A Toolkit for Urban Innovators; Routledge: London, UK, 2012. [Google Scholar] [CrossRef]
  56. Maas, P.R. Towards a Theory of Urban Vitality; University of British Columbia: Vancouver, BC, Canada, 1984. [Google Scholar] [CrossRef]
  57. Di Marino, M.; Lapintie, K. Emerging Workplaces in Post-Functionalist Cities. J. Urban Technol. 2017, 24, 5–25. [Google Scholar] [CrossRef]
  58. Smith, R.F. A History of Coffee. In Coffee; Springer: Boston, MA, USA, 1985; pp. 1–12. [Google Scholar] [CrossRef]
  59. Min, J.E.; Green, D.B.; Kim, L. Calories and sugars in boba milk tea: Implications for obesity risk in Asian Pacific Islanders. Food Sci. Nutr. 2016, 5, 38–45. [Google Scholar] [CrossRef] [PubMed]
  60. Fortune Business Insights. Bubble Tea Market Size, Industry Trends | Analysis Report, 2027. Market Res. Rep. 2019. Available online: https://www.fortunebusinessinsights.com/industry-reports/bubble-tea-market-101564 (accessed on 1 August 2022).
  61. Foster, J. Caffeine (Coffee) Consumption By Country. 2022. Available online: https://www.caffeineinformer.com/caffeine-what-the-world-drinks (accessed on 1 August 2022).
  62. Reyes, C.M.; Cornelis, M.C. Caffeine in the Diet: Country-Level Consumption and Guidelines. Nutrients 2018, 10, 1772. [Google Scholar] [CrossRef] [PubMed]
  63. Luo, W. Tea Time Rides Bubbles of New Popularity|Business|China Daily. 2020. Available online: https://www.chinadailyhk.com/article/151386#Tea-time-rides-bubbles-of-new-popularity (accessed on 1 August 2022).
  64. Wang, Z. Taiwanese Bubble Tea Chain Characteristics and Strategic Analysis of Branding Challenges in China’s Customized Beverage Industry. Sport. Exerc. Res. 2019, 12, 1–76. (In Chinese) [Google Scholar] [CrossRef]
  65. Pandaily. Nayuki Tea Releases First Financial Report After IPO—Pandaily. 2021. Available online: https://pandaily.com/nayuki-tea-releases-first-financial-report-after-ipo/ (accessed on 1 August 2022).
  66. Xu, V. Bubble Tea Brand MXBC Goes Viral 24 Years After Creation—What’s In the Recipe?—Pandaily. 2021. Available online: https://pandaily.com/bubble-tea-brand-mxbc-goes-viral-24-years-after-creation-whats-in-the-recipe/ (accessed on 1 August 2022).
  67. Lei, S.; Lei, S. Repurchase Behavior of College Students in Boba Tea Shops: A Review of Literature. Coll. Stud. J. 2020, 53, 465–473. [Google Scholar]
  68. Wu, Y.; Lu, Y.; Xie, G. Bubble tea consumption and its association with mental health symptoms: An observational cross-sectional study on Chinese young adults. J. Affect. Disord. 2021, 299, 620–627. [Google Scholar] [CrossRef]
  69. National Bureau of Statistics. (n.d.). National Data. Available online: https://data.stats.gov.cn/index.htm (accessed on 31 December 2022).
  70. Liu, G.; Yang, Z.; Chen, B.; Ulgiati, S. Monitoring trends of urban development and environmental impact of Beijing, 1999–2006. Sci. Total Environ. 2011, 409, 3295–3308. [Google Scholar] [CrossRef] [PubMed]
  71. Shi, J.; Miao, W.; Si, H.; Liu, T. Urban Vitality Evaluation and Spatial Correlation Research: A Case Study from Shanghai, China. Land 2021, 10, 1195. [Google Scholar] [CrossRef]
  72. Gong, J.; Chen, W.; Liu, Y.; Wang, J. The intensity change of urban development land: Implications for the city master plan of Guangzhou, China. Land Use Policy 2014, 40, 91–100. [Google Scholar] [CrossRef]
  73. Zhao, M.; Zhou, Y.; Li, X.; Cao, W.; He, C.; Yu, B.; Elvidge, C.D.; Cheng, W. Applications of Satellite Remote Sensing of Nighttime Light Observations: Advances, Challenges, and Perspectives. Remote. Sens. 2019, 11, 1971. [Google Scholar] [CrossRef]
  74. Zheng, Q.; Weng, Q.; Wang, K. Developing a new cross-sensor calibration model for DMSP-OLS and Suomi-NPP VIIRS night-light imageries. ISPRS J. Photogramm. Remote. Sens. 2019, 153, 36–47. [Google Scholar] [CrossRef]
  75. Huang, Y.; Yang, J.; Chen, M.; Wu, C.; Ren, H.; Liu, Y. An Approach for Retrieving Consistent Time Series “Urban Core–Suburban-Rural” (USR) Structure Using Nighttime Light Data from DMSP/OLS and NPP/VIIRS. Remote. Sens. 2022, 14, 3642. [Google Scholar] [CrossRef]
  76. Zhao, M.; Zhou, Y.; Li, X.; Zhou, C.; Cheng, W.; Li, M.; Huang, K. Building a Series of Consistent Night-Time Light Data (1992–2018) in Southeast Asia by Integrating DMSP-OLS and NPP-VIIRS. IEEE Trans. Geosci. Remote Sens. 2019, 58, 1843–1856. [Google Scholar] [CrossRef]
  77. Nechaev, D.; Zhizhin, M.; Poyda, A.; Ghosh, T.; Hsu, F.-C.; Elvidge, C. Cross-Sensor Nighttime Lights Image Calibration for DMSP/OLS and SNPP/VIIRS with Residual U-Net. Remote. Sens. 2021, 13, 5026. [Google Scholar] [CrossRef]
  78. Xu, X. China’s GDP Spatial Distribution in 1 km Grid. Resour. Environ. Sci. Data Cent. 2017. (In Chinese) [Google Scholar] [CrossRef]
  79. Xu, X. China’s Population Spatial Distribution in 1 km Grid. Resour. Environ. Sci. Data Cent. 2017. (In Chinese) [Google Scholar] [CrossRef]
  80. Liu, H.; Jiang, D.; Yang, X.; Luo, C. Spatialization Approach to 1 km Grid GDP Supported by Remote Sensing. Geo-Inf. Sci. 2005, 7, 120–123. (In Chinese) [Google Scholar]
  81. Huang, Y.; Jiang, D.; Fu, J. 1 KM Grid GDP Data of China (2005, 2010). Glob. Change Res. Data Publ. Repos. 2014, 69 (Suppl. S1), 140–143. (In Chinese) [Google Scholar]
  82. Fu, J.; Jiang, D.; Huang, Y. 1 km grid population dataset of China (2005, 2010). Acta Geogr. Sin. 2014, 69 (Suppl. S1), 136–139. (In Chinese) [Google Scholar]
  83. Shan, L.; Wang, H.; Zhang, B.; Pan, P. Land Use Simulation of the City Clusters Around Poyang Lake based on Land Ecological Security Assessment. J. Geo-Inf. Sci. 2020, 22, 543–556. (In Chinese) [Google Scholar] [CrossRef]
  84. Jiao, Y.; Zhao, N.; Yue, T.; Deng, J. The effect of urbanization on extreme climate events in Beijing. Geogr. Res. 2020, 2, 461–472. (In Chinese) [Google Scholar] [CrossRef]
  85. Kang, Y.; Guo, E.; Wang, Y.; Bao, Y.; Bao, Y.; Mandula, N. Monitoring Vegetation Change and Its Potential Drivers in Inner Mongolia from 2000 to 2019. Remote. Sens. 2021, 13, 3357. [Google Scholar] [CrossRef]
  86. Silverman, B.W. Density Estimation for Statistics and Data Analysis; Chapman and Hall: London, UK, 1986. [Google Scholar]
  87. Perry, C. The Neighbourhood Unit (1929) (Reprinted); Routledge: London, UK; Thoemmes: New York, NY, USA, 1998. [Google Scholar]
  88. Anselin, L. Global Spatial Autocorrelation (2)- Geoda documentation. 2019. Available online: https://geodacenter.github.io/workbook/5b_global_adv/lab5b.html#bivariate-moran-scatter-plot (accessed on 8 May 2022).
  89. Anselin, L. Local Spatial Autocorrelation (3)- Geoda documentation. 2020. Available online: https://geodacenter.github.io/workbook/6c_local_multi/lab6c.html#bivariate-local-moran (accessed on 8 May 2022).
  90. Ord, J.K.; Getis, A. Local Spatial Autocorrelation Statistics: Distributional Issues and an Application. Geogr. Anal. 1995, 27, 286–306. [Google Scholar] [CrossRef]
  91. Kendall, M.G.; Gibbons, J.D. 1990 Rank Correlation Methods; Griffin: New York, NY, USA, 1990. [Google Scholar]
  92. Mann, H.B. Nonparametric tests against trend. Econometrica 1945, 13, 245. [Google Scholar] [CrossRef]
  93. Harris, N.L.; Goldman, E.; Gabris, C.; Nordling, J.; Minnemeyer, S.; Ansari, S.; Lippmann, M.; Bennett, L.; Raad, M.; Hansen, M.; et al. Using spatial statistics to identify emerging hot spots of forest loss. Environ. Res. Lett. 2017, 12, 024012. [Google Scholar] [CrossRef]
  94. How Create Space Time Cube works—ArcGIS Pro | Documentation. (n.d.). Available online: https://pro.arcgis.com/en/pro-app/latest/tool-reference/space-time-pattern-mining/learnmorecreatecube.htm (accessed on 2 November 2022).
  95. How Emerging Hot Spot Analysis works—ArcGIS Pro | Documentation. (n.d.). Available online: https://pro.arcgis.com/en/pro-app/2.8/tool-reference/space-time-pattern-mining/learnmoreemerging.htm (accessed on 8 May 2022).
  96. Wang, R.; Wan, B.; Guo, Q.; Hu, M.; Zhou, S. Mapping Regional Urban Extent Using NPP-VIIRS DNB and MODIS NDVI Data. Remote Sens. 2017, 9, 862. [Google Scholar] [CrossRef]
  97. Xia, C.; Yeh, A.G.-O.; Zhang, A. Analyzing spatial relationships between urban land use intensity and urban vitality at street block level: A case study of five Chinese megacities. Landsc. Urban Plan. 2020, 193, 103669. [Google Scholar] [CrossRef]
  98. Wang, X.; Chan, C.K.C.; Yang, L. Economic restructuring and migrant workers’ coping strategies in China’s Pearl River Delta. Third World Q. 2021, 42, 812–830. [Google Scholar] [CrossRef]
  99. Ferreira, J.; Ferreira, C. Challenges and opportunities of new retail horizons in emerging markets: The case of a rising coffee culture in China. Bus. Horizons 2018, 61, 783–796. [Google Scholar] [CrossRef]
  100. Chen, Z.; Yu, B.; Song, W.; Liu, H.; Wu, Q.; Shi, K.; Wu, J. A New Approach for Detecting Urban Centers and Their Spatial Structure With Nighttime Light Remote Sensing. IEEE Trans. Geosci. Remote. Sens. 2017, 55, 6305–6319. [Google Scholar] [CrossRef]
  101. Ou, J.; Liu, X.; Liu, P.; Liu, X. Evaluation of Luojia 1-01 nighttime light imagery for impervious surface detection: A comparison with NPP-VIIRS nighttime light data. Int. J. Appl. Earth Obs. Geoinformation 2019, 81, 1–12. [Google Scholar] [CrossRef]
  102. Zhou, Y.; He, X.; Zhu, Y. Identification and Evaluation of the Polycentric Urban Structure: An Empirical Analysis Based on Multi-Source Big Data Fusion. Remote. Sens. 2022, 14, 2705. [Google Scholar] [CrossRef]
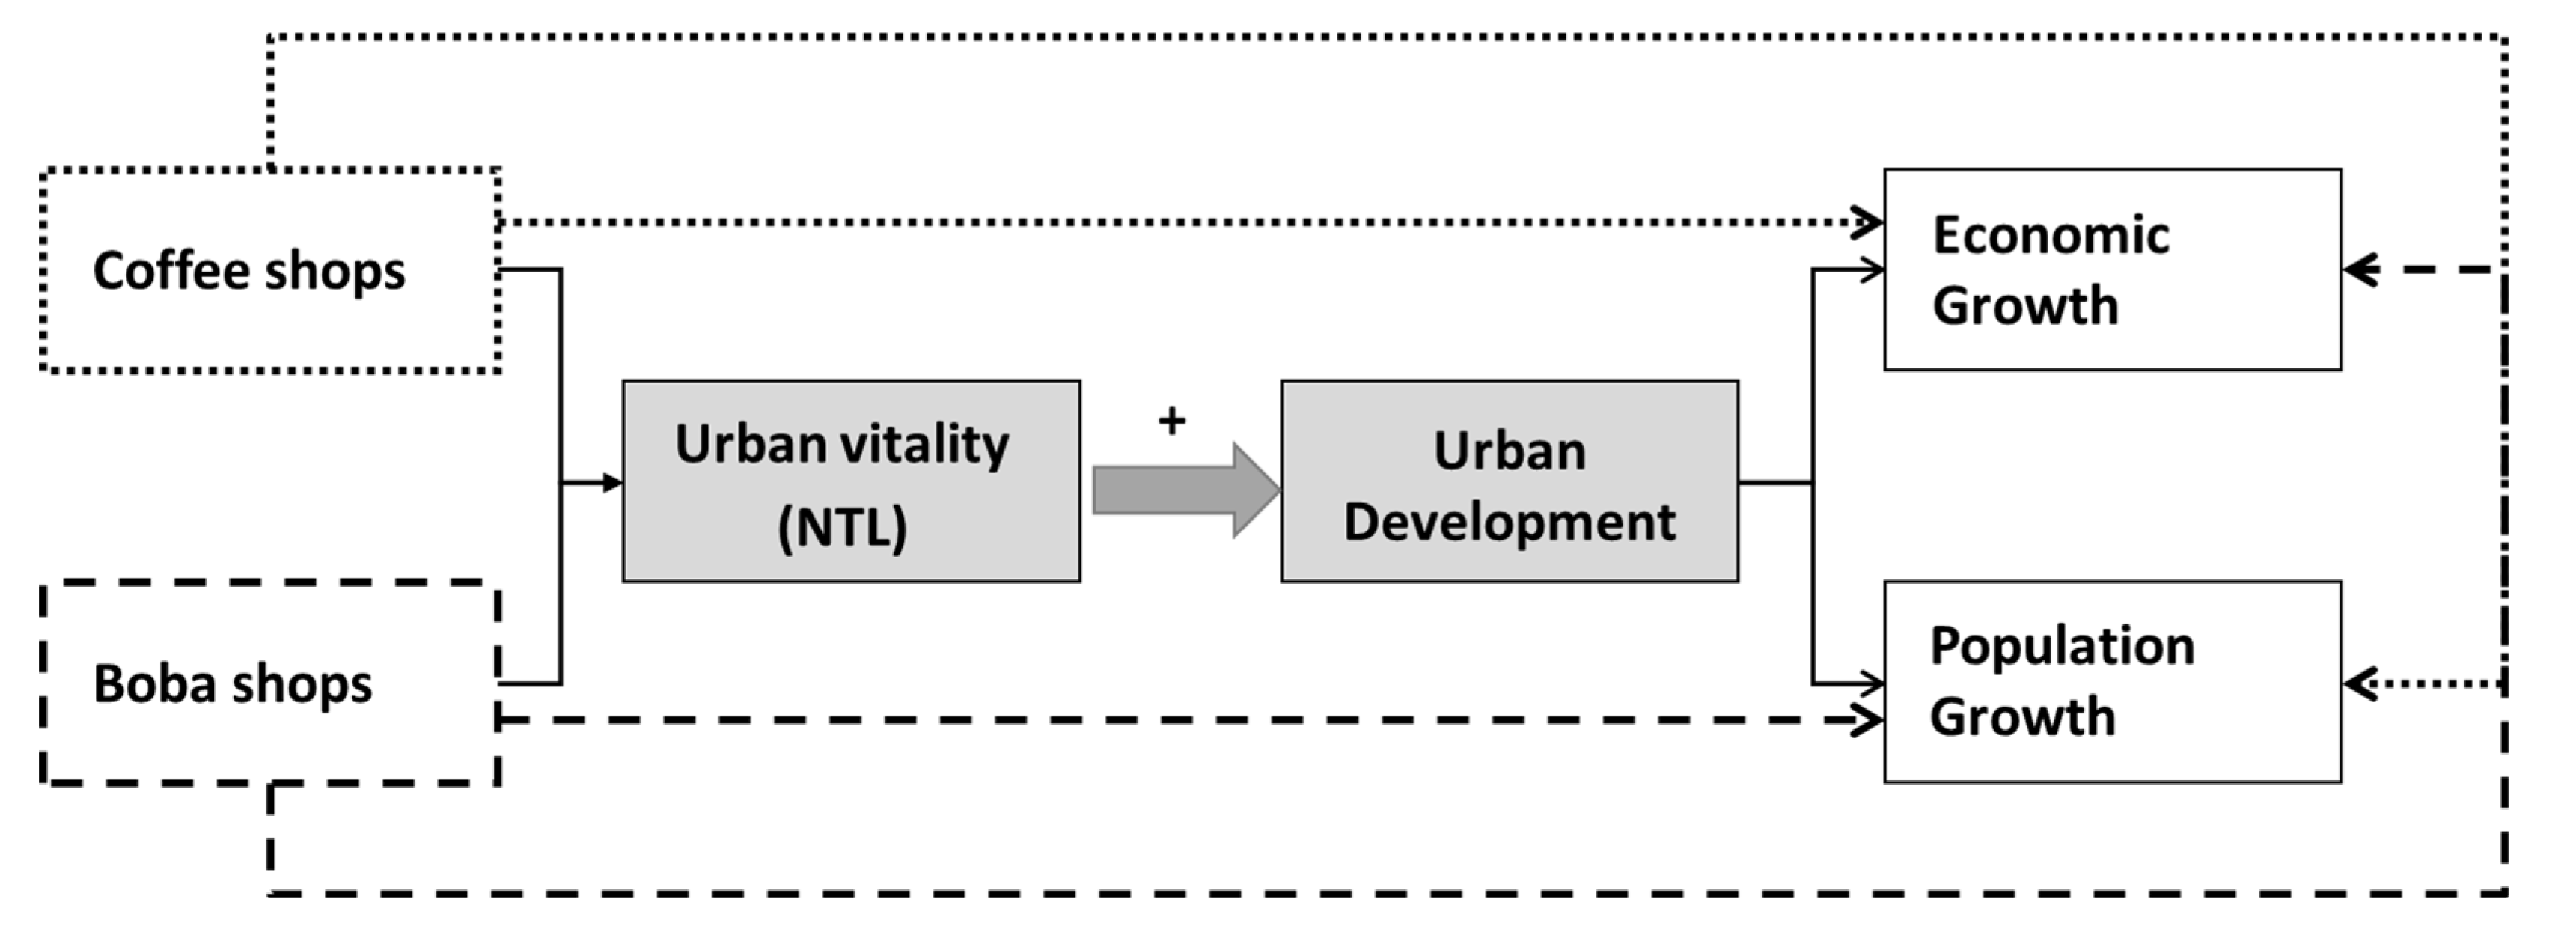
Figure 1. Research framework.
Remotesensing 15 00903 g001
Figure 2. Location of the study areas.
Remotesensing 15 00903 g002
Figure 3. The workflow of bivariate Moran’s I analysis for four cities in China.
Remotesensing 15 00903 g003
Figure 4. The working process of emerging hot spot analysis.
Remotesensing 15 00903 g004
Figure 5. Research workflow.
Remotesensing 15 00903 g005
Figure 6. Nighttime image of Beijing, Shanghai, Guangzhou, and Shenzhen in 2020 (the higher the value the brighter the nightlight).
Remotesensing 15 00903 g006
Figure 7. Kernel density maps of coffee and boba shops in 2022 in Beijing, Shanghai, Guangzhou, and Shenzhen (from top to bottom).
Remotesensing 15 00903 g007
Figure 8. Global bivariate Moran’s I coefficient between boba/coffee shops and NTL intensity (urban vitality) in Beijing, Shanghai, Guangzhou, Shenzhen.
Remotesensing 15 00903 g008
Figure 9. Maps of local indicator of spatial associations (LISA) between expansion of boba tea shops or coffee shops and nighttime urban vitality for four cities in China in 2020.
Remotesensing 15 00903 g009
Figure 10. Maps of local indicators of spatial associations (LISA) between expansion of boba tea shops or coffee shops (2012–2019) and GDP (2010–2019) in four cities in China.
Remotesensing 15 00903 g010
Figure 11. Emerging hot spot analysis results for population from 2010 to 2020 in four cities.
Remotesensing 15 00903 g011
Table 1. POI data cleaning process.
Data Cleaning StepDetailTotal Number of Entries Dropped and Retained (across Four Cities from 2012 to 2022)
Step 1:
Deduplication
Within same year and same city, an entry is considered a duplication if:
-
They are the same in name, telephone number, and coordinates;
Or
-
They have the same POI ID;
Or
-
They are similar in coordinates (within 0.001 marginal difference) and have a similar name (the first two Chinese characters are the same, and 80% of the shop name is the same), and do not have a Chinese character for a number from two to five in the shop name. (For example, there are cases where there are multiple shops of the same brand in one shopping mall called, e.g., Starbucks number two and Starbucks number three).
1793 dropped
270,366 retained
Step 2:
Excluding non boba drink shops
A shop is not considered a boba tea shop if it has ‘herbal tea’, ‘corn juice’, ‘ice cream’, and ‘wholesale’ indicated in the shop name.20,187 dropped
250,179 retained
Table 2. Number of boba and coffee shops captured per year by city.
YearBoba Tea ShopCoffee Shop
BeijingShanghaiGuangzhouShenzhenBeijingShanghaiGuangzhouShenzhen
201225760047223011851444470456
201325372047323411771564475461
201494011031183118316231907752659
201518714436419541254024593324642176
201618704423418441174021592324532175
201719875622532447393801583923812181
201817696502603741853151498620861920
201915323082394025892682410317531073
202012984428419336332181349913521279
202132565059809865483004556924382391
202233374576818124972856507125931367
Table 3. Description and source of analyzed data.
Analyzed DataSpatial ResolutionData SourceCovered Time Period
NPP/VIIRS nighttime light1 km × 1 kmEarth observation group: https://eogdata.mines.edu/products/vnl/#monthly (accessed on 1 August 2022)2012–2020
Coffee and boba shop POI-Amap: www.amap.com (accessed on 1 August 2022)2012–2022
Kilometer Spatial Grid Data—GDP1 km × 1 kmResource and environmental science and data center: https://www.resdc.cn/DOI/doi.aspx?DOIid=33&WebShieldDRSessionVerify=4lU6OJ7MEbbxzEYFudbY (accessed on 1 August 2022)2010, 2015, 2019
Kilometer Spatial Grid Data—Population1 km × 1 kmResource and environmental science and data center: https://www.resdc.cn/DOI/doi.aspx?DOIid=32&WebShieldDRSessionVerify=2ugwETj6fQQDlCLgDoga (accessed on 1 August 2022)2010–2020
Disclaimer/Publisher’s Note: The statements, opinions and data contained in all publications are solely those of the individual author(s) and contributor(s) and not of MDPI and/or the editor(s). MDPI and/or the editor(s) disclaim responsibility for any injury to people or property resulting from any ideas, methods, instructions or products referred to in the content.