Abstract
The Land Surface Temperature (LST) obtained by remote sensing data is an essential indicator for analyzing the Surface Urban Heat Island (SUHI). A factor contributing to its occurrence is the reflections of the different materials in urban and rural areas, which significantly affect the energy balance near the surface. Therefore, recent studies have increasingly used the Local Climate Zones (LCZs) classification system to discriminate those urban areas. Therefore, our study aims to perform a systematic review using the PRISMA method of LCZ classification applied to understand the LST and the SUHI phenomenon. At first, 10,403 related articles were found in the scientific literature which, after passing through filtering stages, resulted in 51 that were further analyzed. Our results showed that these articles were very recent, beginning in 2016, and present an increasing trend. Even though all articles reviewed somehow try to understand the Urban Heat Island phenomenon, in more than half of them, the SUHI calculation method was not mentioned. China was the country with the most studies. Images from Landsat and TERRA/AQUA sensors appeared in 82% of the studies. The method that appears the most to LCZ definitions is from the World Urban Database. Finally, we conclude that LCZ mapping methodologies were accurate enough for SUHI studies considering the current climatic changes. Therefore, this systematic review can help new studies on SUHI identification through LCZ in different world areas using remote sensing data to estimate the LST.
1. Introduction
Cities have been the main human settlements in the world since 2007 when they overtook rural regions. Currently, about 55% of the population lives in urban areas, and it is expected to reach 68% in 2050 [1]. This increase in urbanization causes urban climate problems. One of the best known is the Urban Heat Island (UHI) phenomenon, referred to in the literature as the increase in the city’s center temperature concerning their rural surroundings.
According to [2], there are three UHI types: (i) The Canopy Layer Urban Heat Island (CLUHI), (ii) The Urban Boundary Layer (UBL), and (iii) The Surface Urban Heat Island (SUHI). This last one was considered in this study. This phenomenon is critical because it disturbs the urban system, which is more enhanced by climate change, affecting the population psychologically and physiologically. In addition, it also impacts economic activities and increases morbidity and mortality, energy consumption, and violent behaviors [3].
The SUHI can be obtained using several Land Surface Temperature (LST) remote sensing data. The LST is an important indicator to measure the SUHI phenomenon since it measures the energy balance near the surface, affecting the surface heat distribution process, which significantly alters the urban climate [4].
As a result, the land urbanization effects in SUHI are well-discussed in Land Use and Land Cover (LULC) maps. In this context, a new LULC classification system called Local Climate Zones (LCZs) arranges the different urban and rural areas in more detail. In addition, the LCZ has been increasingly used in Urban Heat Islands studies [5]. It was initially proposed in 2012 when regional climate zones were divided into several Local Climate Zones within cities according to different LULC surface types, consequently allowing the correlation between climate information and urban planning [6]. The LCZ classification system consists of two main categories, the built and the land cover type, based on building density shape geometry and surface characteristics, including 17 subcategories, as seen in Figure 1 [7].
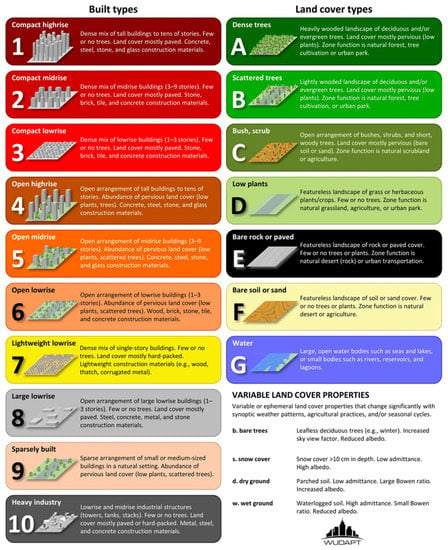
Figure 1.
LCZ classification scheme [7].
In the scientific literature, we only found a few articles which made a systematic review considering the LCZ, such as [8,9,10]. However, they have not focused on understanding the LST differences inside each LCZ class or the SUHI phenomenon, which is essential considering the population increase in urban areas and climate change and is the main novelty of our article. Therefore, the scientific literature that uses the Local Climate Zones classification to study the Land Surface Temperature and the Surface Urban Heat Island phenomenon was systematically reviewed with VosViewer and PRISMA method in this study to follow the state of the art of this scientific theme. Consideration was dedicated principally to the following goals: (i) scientific production’s relevance and regional and global contribution; (ii) satellites and sensor analysis; (iii) methods to obtain LST, LCZ, and SUHI; (iv) and variables associated with SUHI and LCZ and the most used software. Thus, this is a pioneering study in this type of analysis, serving as a reference for future SUHI studies using LCZ and LST obtained by remote sensing data.
2. Materials and Methods
Few studies make a systematic review to understand the Local Climate Zones application to analyze Urban Heat Islands, such as [8,9,10]. However, these studies have not focused on the Surface Urban Heat Islands. Therefore, a systematic review was conducted using the Preferred Reporting Items for Systematic Reviews (PRISMAs) method to identify the remote sensing research trends applied to Surface Urban Heat Islands identification considering the Local Climate zones classification. Each review step was described in more detail and synthesized in the flowchart shown in Figure 2.
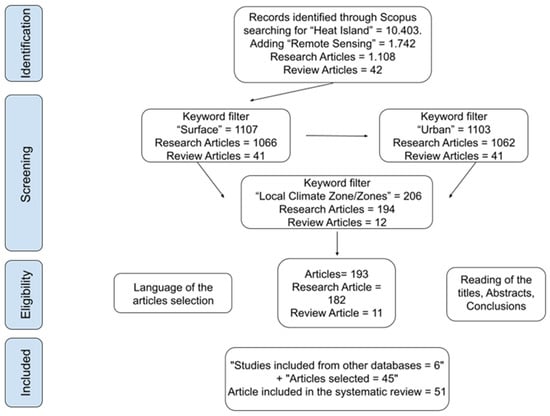
Figure 2.
PRISMA flowchart of the phases of the research methodology.
2.1. Step 1: Identification
In the identification phase, the approach adopted for consulting the literature consisted of a search for words that best represented the subject of interest. The keywords were used to filter the Scopus library (www.scopus.com, accessed on 30 June 2020). Scopus is one of the world’s most extensive peer-reviewed scientific literature databases [11]. Using “heat island”, 10,403 articles were found in this first step. However, after using the “remote sensing” keyword, 1174 documents remained. Of these, 1108 were research articles, and 42 were review articles.
2.2. Step 2: Selection
The articles found in the previous step were subsequently extracted to the selection stage. The keywords “Surface” and “Urban” were applied through a filtering tool, but it did not reduce the number of articles found. Then, they were passed through a new filter using the keyword “local climate zone/zones”, and the number of articles was significantly reduced to 206. Of these, 194 were research articles, and 12 were review articles.
2.3. Step 3: Eligibility
For the eligibility step, it is essential to highlight that only research and review articles in Portuguese or English were chosen. In addition, titles, abstracts, and conclusions of these 206 documents were read, and only the ones whose content was directly related to Surface Urban Heat Islands using remote sensing data within the Local Climate Zones LULC classification were selected.
2.4. Step 4: Inclusion
In this final step, inclusion, 45 articles were selected, none being review articles. In addition, six articles cited by the articles read and found in databases other than Scopus were added to the analysis. Therefore, 51 articles were included in this systematic review and had their information cataloged.
2.5. Step 5: Data Analysis
All the articles selected in the inclusion stage were read and had their information cataloged. Some aspects considered were: (i) the relevance of scientific production; (ii) regional and global contribution; (iii) the satellites and sensors used, as well as their frequency; (iv) the methods used to obtain the Land Surface Temperature (LST); (v) the methods used to identify the Surface Urban Heat Island (SUHI); (vi) the methods used to obtain the Local Climate Zones (LCZs); (vii) the variables associated with SUHI and LCZ; and (viii) the most frequent software used. In addition, the VosViewer was used to identify the article’s reviewed relevance, regional and global contributions, main keywords used, year of publication, and trends among the authors.
3. Results and Discussion
This section is divided into subheadings to provide an organized, concise, and precise description of the results and their interpretation and discussion.
3.1. Relevance of Scientific Production
Of the 10,403 articles found in the scientific literature Scopus database, during the applications of the filters shown in Figure 1, only 51 articles remained to be analyzed in more detail. These reviewed articles were published between 2016 and 2022 (Figure 3), The oldest one was published in September 2016, and the most recent was in June 2022, the month in which the data were collected. Therefore, the influence factor of each factor was calculated on the same date considering their citations and year of publication.
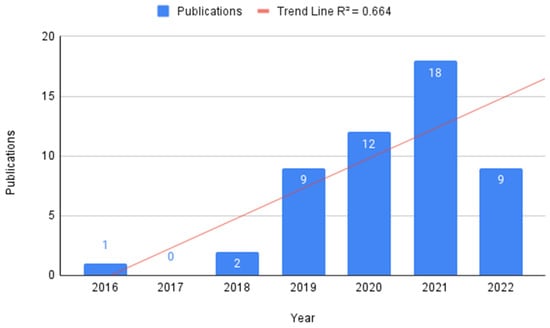
Figure 3.
Distribution of publications from September 2016 to June 2022.
Excluding the year 2017 from the period because there was no publication on the subject, we noticed a growing trend in publications beginning in 2019 with nine publications. The most prominent years were the most recent ones, 2020 and 2021, with 12 and 18 publications, respectively. Quite possibly, the last year of analysis, 2022, can easily exceed the previous ones since nine publications were found in the literature related to the subject studied only in the first semester. It is worth highlighting that the LCZs were only created in 2012 [6]. In addition, their approach focused only on Atmospheric Urban Heat Islands, explaining why publications on Local Climate Zones related to Surface Urban Heat Islands began to appear only in 2016.
In addition to the publications distributions analysis, each article’s citations were counted, thus serving to evaluate its influence. However, even if the articles are all recent, a normalization was used to adjust their citation number over time and define their influence using (Equation (1)).
where Citations are the article citations number; Year basis is the year that the systematic review is being performed, in this case, 2022; and Year of publication is the year in which the article was published.
Influence = Citations/(Year basis − Year of publication)
Therefore, after applying this equation, the articles were ranked from most to least influential, and the six most influential found in this systematic review are presented in Table 1. Furthermore, all the other articles reviewed are presented in chronological order in Appendix A, Table A1.

Table 1.
Most influential articles.
Among the most influential articles, some things in common are the regional scale study area and the Landsat sensors used in their research, except for [16], which used hyperspectral and thermal data aided by Light Detection and Ranging (LIDAR) to identify vegetation, constructions, soil, and water surfaces.
The most influential article tries to mitigate Urban Heat Island effects [4]. In this study, the authors identified human settlement in a city in China and analyzed the different LCZ classes’ thermal characteristics to alleviate the SUHI effect and improve the citizens’ quality of life. However, although this article is the most influential one, the author did not present a good connection between the authors reviewed, considering the cluster produced using the VosViewer software shown in Figure 4.
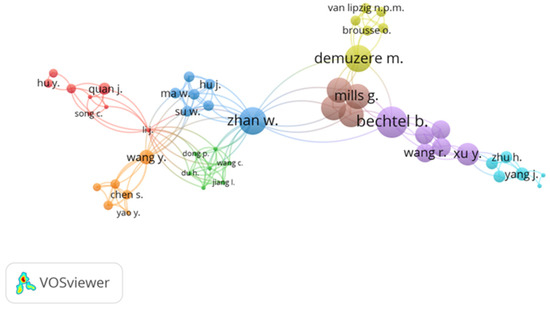
Figure 4.
Authors’ maps by citation.
3.2. Regional and Global Contribution
The connection between the country’s collaboration network using VosViewer is presented in Figure 5 and Table 2.
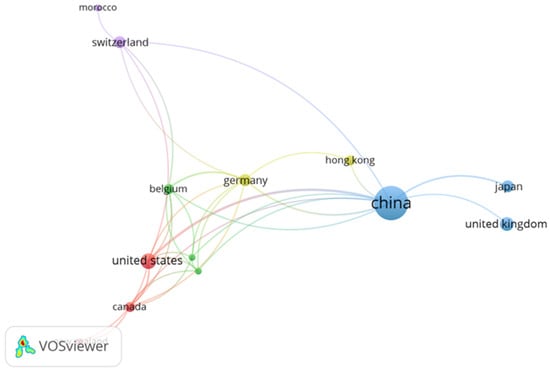
Figure 5.
Cluster network analysis of the principal connections among the authors’ countries of the reviewed articles.
Table 2.
Originating countries of the reviewed authors’ institutions.
The connection network among the authors’ countries has 13 nodes, 5 clusters, and 32 links. The link has a force and is represented by a positive numerical value; the higher the value, the stronger the power. Indicating, for example, the number of cited references that two nodes have in common, publications in which the authors are co-authors, or even the number of publications in which two terms coincide [17].
With VosViewer, the authors’ country and institution origin were assessed and are presented in Table 2.
It is noticed that the highest contribution comes from China, with 48% of the articles and approximately 33% of the citations, followed by the US, with 10% of the articles and about 12% of the quotation. In the third place, the United Kingdom obtained a greater strength, even with one article less than the US. This fact may occur due to the connections between the authors of the respective countries with China. In addition, the other countries have less than four articles each, with strength below the average.
3.3. Analysis of Satellites and Sensors
In the articles reviewed, several sensors and platforms were used in different stages to obtain the LST thermal surface behavior and to identify the LCZ classes. Their frequency and information, such as the operator and temporal and spatial resolution, are shown in Table 3 and Figure 6.
Table 3.
Information about satellites and sensors used in the reviewed articles.
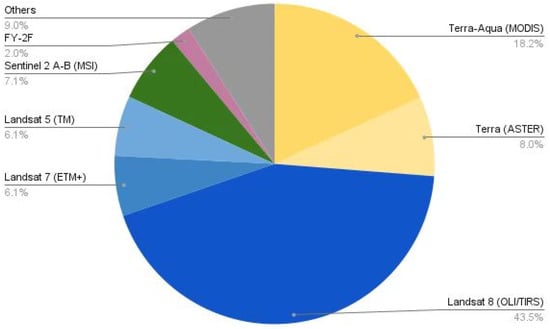
Figure 6.
Satellites and sensors by publication.
The Landsat series is managed by the National Aeronautics and Space Administration (NASA) and the US Geological Survey (USGS) and involved the launch of nine satellites, of which Landsat 5, 7, and 8 were used by the reviewed articles, covering 55% of the publications. The satellite of the series most used in the reviewed articles was Landsat 8, which was launched in 2013, and operates with the Operational Land Imager (OLI) instruments and the Thermal Infrared Sensor (TIRS). The OLI sensor has spectral bands that collect data in the visible range, near infrared and infrared of short waves, and a panchromatic band, with spatial resolution from 15 to 30 m and 16 days of temporal resolution. The thermal sensor has two bands, with 100 m spatial resolution [18].
In addition to the Landsat satellites, the AQUA and TERRA satellites are part of the Earth Observation System (EOS), a program founded by NASA and developed in partnership with Japan and Brazil, launched in 2002. The TERRA satellite was launched in 1999, involving aerospace agencies from Canada and Japan. The MODIS sensor is on board these two satellites, which can acquire Earth images from 1 to 2 days, with a spatial resolution of 250, 500, and 1000 m. This sensor was used in approximately 18% of all reviewed articles. In addition, the TERRA satellite has in its instruments the ASTER sensor, which offers better spatial resolution, reaching 15 m for the visible and near-infrared region, 30 m for the short-wave infrared region, and 90 m for the thermal bands [19,20,21].
In general, Landsat and TERRA/AQUA sensors were more often used due to the long historical series and the free acquisition cost. However, although Landsat 8 provides the thermal data at a good spatial resolution of 100 m, their 16 days revisit time is too long. However, with Landsat 7, 8, and 9 in operation, this temporal resolution can decrease to five days. In contrast, the MODIS sensor provides its data in a shorter revisit period, although the thermal data spatial resolution is rougher, with 1 km. Therefore, one of the remote sensing challenges is acquiring surface temperature data in high spatial and temporal resolution, which is currently not possible [22].
The satellites and sensors highlighted as “others” are those that had only one occurrence in the reviewed articles, such as Worldview 3 used in [23], Meteosat Seviri in [24], Sentinel 1 A-B Multispectral Instrument (MSI) used by [25], PROBA-V: Copernicus Global Land Cover Layers (CGLS-LC) 100 in [26], ECOSTRESS used in [27], Copernicus Global Cover maps (C-GLOPS) also in [27], NECP-GR data by [28], Gaofen-1 in [29], and Visible Infrared Imaging Radiometer Suite (VIIRS) by [30].
In addition to satellite images, one alternative is non-orbital data use, such as that obtained by unmanned aerial vehicles (UAVs) and aerodynamic twin engines. Their main advantage is the high spatial and temporal resolution, which is very useful for obtaining land surface temperature and their analysis in specific local climate zones. However, the operational cost of these tools is relatively high [31].
3.4. Method to Obtain the Land Surface Temperature (LST)
Land Surface Temperature (LST) is essential for Surface Urban Heat Island studies. Usually, it is not measured directly by remote sensors, requiring mathematical methods to be estimated. Therefore, the methods used in the LST calculations used by the articles reviewed were cataloged and presented in Figure 7.
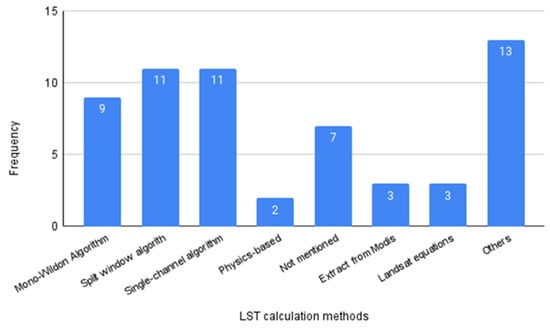
Figure 7.
Land Surface Temperature (LST) calculation methods.
Many LST estimation algorithms have been proposed and can be classified, according to [32], into three categories: Single-Channel Algorithms (SCAs), Multi-Channel, and Split-Window Algorithms (SWAs). Together they account for 52% of the methods used in the articles reviewed to obtain LST.
The SCA advantage is that it estimates the LST with only one thermal channel. Thus, this method is the only one that can be applied to the Landsat platform with a thermal channel, such as the Landsat 4, 5, and 7 TM bands [33]. However, according to [34], the SWA is the best for calculating the LST from satellite data to understand SUHI. This method requires simultaneous data from at least two sensor channels, requiring only the atmospheric moisture content and surface emissivity as the parameters. The Statistical Mono-Window Algorithm (MWA) uses the thermal band brightness temperature, mean, and surface emissivity difference to estimate the LST [35]. The equations of the three algorithms mentioned can be seen in Table 4.
Table 4.
Equations of LST estimation algorithms.
The LST calculation methods obtained through algorithms were already implemented in several software such as ENVI-met, Google Earth Engine, ArcGIS, and QGIS classification plugins in the reviewed articles. Using friendlier software to obtain LST has become increasingly common and generally increases the number of users. In addition, it is worth highlighting they were used not only to obtain the LST but also to calculate the SUHI and the LCZ, among others.
The method classified as “others” is the most often found in our review, reaching 13 in this category. It is worth noting that among them, some are used only once, such as the Two-Channel Algorithm [30], Algorithm Practical Single-channel [28], and the Normalized Emissivity Method (NEM) [16]. Furthermore, 12% of the studies do not inform the method to classify the LST, which is a problem for replicating the methodology.
3.5. Surface Urban Heat Island (SUHI) Calculation
The Surface Urban Heat Islands (SUHIs) are commonly calculated as the difference between the LST in urban and rural areas according to [31], as illustrated in Figure 8. However, there are several proposals for calculating SUHI because not every urban cluster is the same, and the urban and rural border areas are sometimes difficult to discriminate [30].
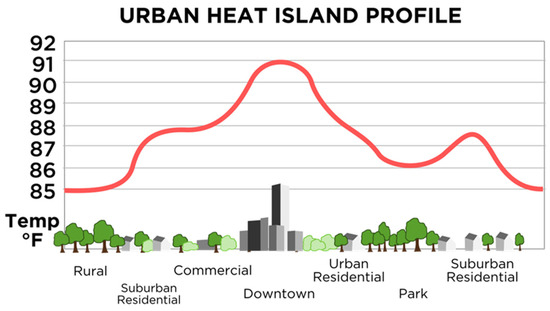
Figure 8.
Urban Heat Island representation.
Therefore, all SUHI calculation methods found in the articles reviewed were cataloged and shown in Figure 9.
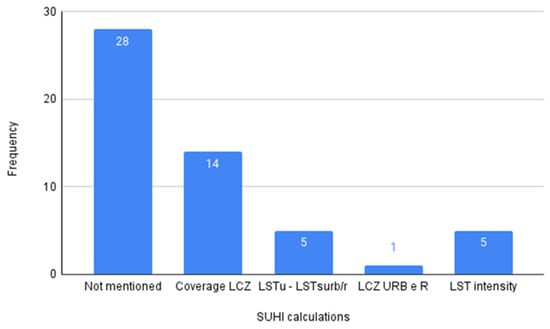
Figure 9.
SUHI calculation methods. LSTu: LST of the urban area; LSTsurb/r: LST of the suburban and rural areas.
Even though all articles reviewed somehow try to understand the Urban Heat Island phenomenon, in more than half of them, the SUHI calculation method was not mentioned. In addition, only 20 articles used the term SUHI directly, which is a serious problem since it is essential in the methodology to describe how the Urban Heat Island was obtained. One explanation is that not all research focuses on identifying the heat islands, only verifying the LST effects on each LULC class.
From the articles in which the SUHI method was mentioned, the majority, about 56%, used the difference between the LST average of LCZ built and land cover types. This last one is usually class D, representing low vegetation such as grasslands or herbaceous plants/crops (see Figure 1). In addition, only [38] used another LCZ land cover class as a reference, which used class B, which means scattered trees with mostly pervious land. However, only using LCZ classes to improve the SUHI calculation is considered an improvement in the research’s articles [5,39] mainly for two reasons: First to improve the identification accuracy of urban and rural areas, since it is difficult to establish what would currently be rural or urban in certain areas using remote sensing data. Second, to improve the LST comparison inside several LCZ classes considering different urban types and land cover.
Other methods used to differentiate SUHI in urban and suburban/rural areas appear in 20% of the articles reviewed. While [35,40] uses the traditional SUHI method, consisting of the difference between the urban and rural areas LST, other studies, such as [41,42], only analyze the study area using the LST intensity and heat maps.
3.6. Method to Obtain the Local Climate Zones
Some methods are used in the literature to obtain the local climate zones (LCZs). The most used among the articles reviewed is shown in Figure 10.
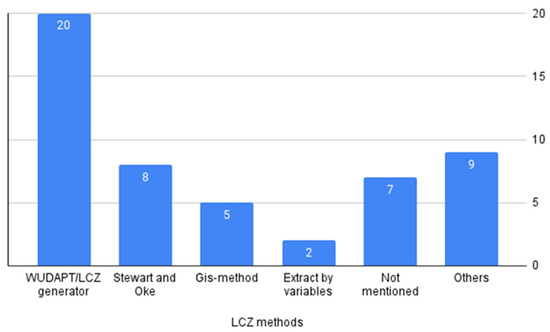
Figure 10.
Methods of LCZ calculation.
The method that appears the most, 39% of the publications, is from the World Urban Database and Access Portal Tools (WUDAPTs). According to [5], it provides instructions for the LCZ classification using open access data and software, and the classification system consists basically of (1) data processing: including satellite image obtention, usually using Landsat; (2) selection of training and verification samples using a visual interpretation method with Google Earth images; (3) LCZ classification: based on the samples obtained previously using the Random Forest classifier in some Geographic Information System (GIS) software, such as the System for Automated Geoscientific Analyses (SAGA); and finally the (4) accuracy assessment: using confusion matrix, the Kappa coefficient, and general precisions. After these steps, if the LCZ classification is not considered good, the training and verification samples should be collected again until a good map accuracy is reached.
Furthermore, according to [43], the WUDAPT collects, stores, and disseminates data at different levels, each representing an accuracy degree of the urban types. There are three LCZ levels: Level 0 is a raster of a city and surroundings, which are categorized according to LCZ types; Level 1 is the product of LCZ maps that provide more information about aspects and shapes; and Level 2 is the product of LCZ map that has the highest detail, with a greater specific spatial resolution. Furthermore, the study by [43] included an analysis of 50 cities around the planet, all of which were analyzed with the WUDAPT product Level 0, identifying significant differences in LST between the built and natural classes of cities considering differences in sizes, composition, and surrounding microclimates.
The “others” LCZ classification methods appear in 17% of the publications, corresponding to unique ways with an appearance in only one article each. These usually are approaches developed by the authors of the works, such as [25] using field samples and data from Palsar-2 and [28] using object-based classification (OBIA) for the LCZ classification.
Stewart and Oke’s procedure was used in about 15% of the articles reviewed, such as in the [44,45] articles. This LCZ classification method consists of (i) local data collection: where it is proposed to visit the site for data collection such as building geometries, land cover, and population density, among others. It is recommended to use secondary sources such as aerial photographs, satellite images, or land use and cover maps only if it is not possible to visit the studied area; (ii) the thermal source, which are usually weather stations but can be adapted for optical sensors; and finally, the (iii) selection of local climate zones based in the first step data. In addition, the authors also raised the possibility of adapting the LCZ classes by joining two or more of them or even creating new ones, such as the snow cover for cold places [6].
According to [13], the GIS method analyzes a dataset more accurately than manual samples and remote sensing methods. There are two types of GIS methods, raster, and vector-based. The first is suitable for classifying land surface properties and spatial analysis, while the second aims to show the upper edges of object shapes. The GIS method used in the [13] study was the vector method, and approximately 9% of the article reviewed used this method. It is also important to highlight that in about 13% of the articles reviewed in this study, the LCZ methodology was not mentioned.
Additionally, it is worth noting the study area’s extension used in the LCZ maps among the articles reviewed, which vary from relatively small areas such as [46], in which the authors analyzed only a Hong Kong district of 47 km2, and large regions extension, such as the [47] research performed in Wuhan city, reaching 8494 km2.
3.7. Variables Associated with SUHI and LCZ
Some variables associated with SUHI identification used in conjunction with LCZs were cataloged in this systematic review and shown in Figure 11. Of these variables, three of them were based on spectral indices presented in Table 5.
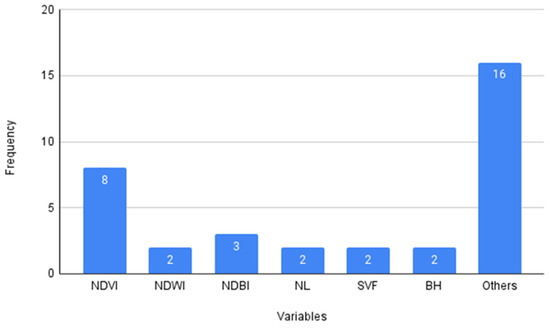
Figure 11.
Variables associated with SUHI and LCZ used in the articles reviewed.
Table 5.
Equations of principal spectral indexes used in the articles reviewed.
The NDVI is one of the most well-known and used spectral indexes in the articles reviewed, present in 23% of the articles. It was proposed by [48], and it is obtained by a normalized equation of reflectance in the near infrared (NIR) and red (R) bands, with values ranging from −1 to +1. This index was used in studies such as [40], where the index allows for analyzing the vegetation spatial distribution difference in urban and rural areas.
Other spectral indices mostly used were the Normalized Difference Water Index (NDWI) and Normalized Difference Building Index (NDBI), which appeared in 14% of the studies. For example, [50] also used them with the NDVI as conditional arguments for pixel size reclassification and LST variables for the prediction model.
The category cited as “others” among the variables associated with SUHI and LCZ was the most frequent, present in 46% of the articles. However, all the variables are only used once considered in all the articles reviewed. Some are related to population, such as in [47], which was used to determine the urban thermal environment influence. Another one is the heat island ratio, an index generated by [51] that makes temperatures of different years comparable. Further, Night Lights (NLs), Sky View Factor (SVF), and Building Height (BH) appeared in almost 6% of studies, respectively.
In addition, although it is not a variable, many studies used statistical methods to improve their analysis and results among the articles reviewed and were also cataloged in this systematic review and presented in Figure 12.
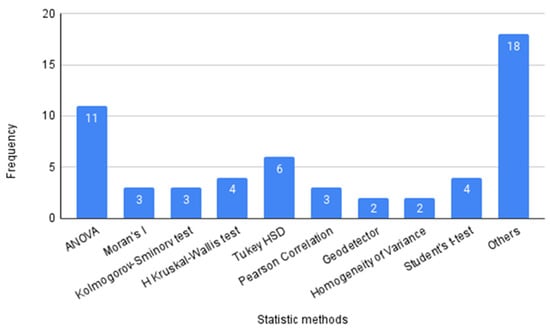
Figure 12.
Statistic methods used in the articles reviewed.
The analysis of variance (ANOVA) was the most statistical method found in 20% of studies. Generally, it is used to decide whether the observed sample differences are real, caused by significant differences in the populations, or if they are casual, resulting from the sample variability. Thus, this analysis goes from the assumption that chaos produces slight deviations while significant differences are generated by natural causes [52]. In the articles reviewed, the ANOVA was used to examine the significance of the difference among the thermal groups.
Together with ANOVA, the Tukey test, also known as Tukey Honestly Significance Difference (HSD), was found in 11% of studies. It was used to determine which pair of LCZ is significantly different in terms of LST mean. Studies using these two statistical methods were those of [53,54,55].
In addition to these methods, many others are used, as highlighted in the “others” category, demonstrating the statistical procedure’s importance for better evaluating the LST and LCZ correlations.
3.8. Most Used Software
In the SUHI and LCZ studies, using more than one software is very common. In this systematic review, the most used software in the articles reviewed was cataloged and shown in Figure 13.
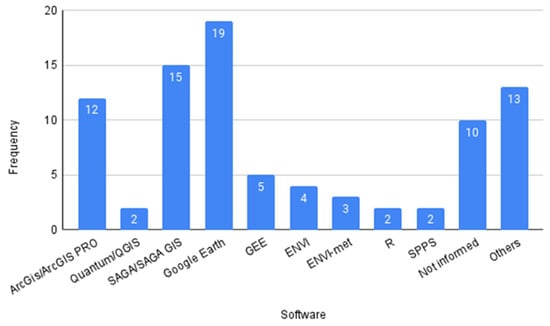
Figure 13.
Software most used in the reviewed articles. GEE: Google Earth Engine; ENVI: Environment for Visualizing Images; R: R language; SPPS: Statistics Package for the Social Science.
Google Earth is the most widely used software in 22% of the studies, followed by SAGA/GIS in 17%. The first is a program developed by Google, providing a three-dimensional model of the globe built from satellite image mosaics. Using this software it is possible to identify features, places, constructions, cities, and landscapes. More information about it is available at (https://www.google.com.br/intl/pt-BR/earth/, accessed on 1 February 2022). While SAGA/GIS, a free GIS software, is used as an effective spatial algorithm implementation providing a set of geostatistical methods. More information about it is available at the link (https://saga-gis.sourceforge.io/en/index.html, accessed on 1 February 2022). This two software were widely used to generate the LCZ maps, Google Earth for collecting training and verification samples, and the SAGA/GIS to run the classifier, usually Random Forest, as mentioned in Section 3.6.
Another widely used software is ArcGIS, with a 14% appearance. During the reviews of the articles, it was observed that it was used for various functions, statistical analysis [53], and LST calculation [51], among others. This platform is maintained by Esri, which is a private company in geographic information services. More information about it can be found at (https://www.esri.com/en-us/arcgis/products/arcgis-online/overview, accessed on 1 February 2022). A well-known software that replaces ArcGIS is QGIS. Its main advantage is that it is free-to-use software, although, in the systematic review, it was only presented in a few studies.
4. Final Considerations
This systematic review evaluates the state of the art related to the use of local climatic zones to identify the Surface Urban Heat Islands through remote sensing techniques. It was revealed that the theme interest has increased over the years and has a growth trend in the future. Therefore, using the PRISMA method, 10,406 articles were identified in the literature, which after being submitted to the selection, eligibility, and, finally, inclusion steps, resulted in 51 articles. They were further analyzed, cataloged, presented, and discussed in this article using tables, cluster analysis figures, and maps.
Among the satellite found in the publications, Landsat and TERRA/AQUA sensors appeared the most, appearing in 82% of the articles. However, there is a tendency for other sensors to be used, such as Sentinel 2, with 7% appearances. Regarding the methods to obtain LST, the Split Window and Single-Channel Algorithm were the most used, reaching more than 18% of the articles each.
For the SUHI calculation, more than half of the articles did not inform or detail the methodology used. However, in 56% of the articles, the difference between the LST average of a given LCZ urban and land cover class was used, demonstrating the concern of scholars to improve the SUHI calculation considering the LCZ. Therefore, we concluded that LCZ classification is accurate enough for SUHI studies. It can be performed with more detail considering the LCZ levels, depending on the spatial resolution used and the study’s primary goal.
In addition, for the LCZ classification, the WUDAPT method is the one that appears the most, occurring in 39% of publications. In addition, three spectral indices, NDVI, NDWI, and NDBI, were identified among all the variables related to SUHI and LCZ. However, several other variables appeared, some of them just once. It is worth noting that many statistical methods were used for better analysis of LST and LCZ, demonstrating the importance of these methods for assessing the correlations among them and highlighting ANOVA as the most used statistical method. For last, the most used software was Google Earth and SAGA/GIS, widely used to obtain the LCZ maps, justifying the frequency of their appearances.
It is worth noting that this study has some limitations, such as the article’s method choice, which used the Scopus database. However, to mitigate this problem, other articles from other databases were included in this systematic review. In addition, different keywords were added to find the articles to be reviewed, and their order in the PRISMA steps also changed the articles found.
Finally, considering the current climatic changes, this systematic review is a reference for news studies on Surface Urban Heat Island identification through Local Climate Zones in different areas of the world using remote sensing data to estimate the Land Surface Temperature; therefore, helping decision-makers mitigate these effects.
Author Contributions
Conceptualization and Methodology, R.F. and V.N.; software, R.F.; Formal Analysis and Investigation, V.N., M.F., R.F. and J.O.; data curation and writing—original draft preparation, R.F.; writing—review and editing, V.N.; supervision, V.N. and M.F.; funding acquisition, J.O. All authors have read and agreed to the published version of the manuscript.
Funding
This research was funded by Coordenação de Aperfeiçoamento de Pessoal Nível Superior (CAPES) R.F scholarship number (88887.645454/2021-00) and the Fundação de Amparo à Pesquisa do Estado de São Paulo (FAPESP) project number (2017/22269-2).
Acknowledgments
The authors thank the National Institute for Space Research (INPE), the Federal University of Rio Grande do Sul (UFRGS), and the Federal University of ABC (UFABC) for the support provided during this research.
Conflicts of Interest
The authors declare no conflict of interest.
Appendix A
Table A1.
Articles read in the systematic review in chronological order of publication.
Table A1.
Articles read in the systematic review in chronological order of publication.
| Title | Year of Publication | Authors |
|---|---|---|
| Dynamics and controls of urban heat sink and island phenomena in a desert city: Development of a local climate zone scheme using remotely sensed inputs | 2016 | [22] |
| Analysis of land use change and expansion of surface urban heat island in Bogor city by remote sensing | 2018 | [53] |
| Understanding Land Surface Temperature Differences of Local Climate Zones Based on Airborne Remote Sensing Data | 2018 | [16] |
| Analysis of the Spatial and Temporal Variations in Land Surface Temperature Based on Local Climate Zones: A Case Study in Nanjing, China | 2019 | [29] |
| Detecting multi-temporal land cover change and land surface temperature in Pearl River Delta by adopting local climate zone | 2019 | [15] |
| Enhanced geographic information system-based mapping of local climate zones in Beijing, China | 2019 | [56] |
| Impact of atmospheric conditions and levels of urbanization on the relationship between nocturnal surface and urban canopy heat islands | 2019 | [57] |
| Inter-/intra-zonal seasonal variability of the surface urban heat island based on local climate zones in three central European cities | 2019 | [58] |
| Multi-Temporal Effects of Urban Forms and Functions on Urban Heat Islands Based on Local Climate Zone Classification | 2019 | [44] |
| Seasonality of Surface Urban Heat Island in Delhi City Region Measured by Local Climate Zones and Conventional Indicators | 2019 | [54] |
| SUHI analysis using Local Climate Zones—A comparison of 50 cities | 2019 | [43] |
| Urban design factors influencing surface urban heat island in the high-density city of Guangzhou based on the local climate zone | 2019 | [59] |
| Annual and monthly analysis of surface urban heat island intensity with respect to the local climate zones in Budapest | 2020 | [60] |
| Evaluation of urban heat islands using local climate zones and the influence of sea–land breeze. | 2020 | [14] |
| Inter-local climate zone differentiation of land surface temperatures for Management of Urban Heat in Nairobi City, Kenya | 2020 | [61] |
| Mapping Local Climate Zones Using ArcGIS-Based Method and Exploring Land Surface Temperature Characteristics in Chenzhou, China | 2020 | [62] |
| Optimizing local climate zones to mitigate urban heat island effect in human settlements | 2020 | [4] |
| Remote sensing of urban thermal environments within local climate zones: A case study of two high-density subtropical Chinese cities | 2020 | [63] |
| Spatial and temporal analysis of the increasing effects of large-scale infrastructure construction on the surface urban heat island | 2020 | [51] |
| Spatiotemporal Changes in the Urban Heat Island Intensity of Distinct Local Climate Zones: Case Study of Zhongshan District, Dalian, China | 2020 | [38] |
| The local climate impact of an African city during clear-sky conditions—Implications of the recent urbanization in Kampala (Uganda) | 2020 | [24] |
| Urban Spatial Patterns and Heat Exposure in the Mediterranean City of Tel Aviv | 2020 | [45] |
| Use of Local Climate Zones to investigate surface urban heat islands in Texas | 2020 | [64] |
| Using local climate zones to compare remotely sensed surface temperatures in temperate cities and hot desert cities | 2020 | [40] |
| A cooled city? Comparing human activity changes on the impact of urban thermal environment before and after city-wide lockdown | 2021 | [47] |
| A practical approach of urban green infrastructure planning to mitigate urban overheating: A case study of Guangzhou | 2021 | [42] |
| An application of the LCZ approach in surface urban heat island mapping in Sofia, Bulgaria | 2021 | [31] |
| Analyses of land surface temperature (LST) variability among local climate zones (LCZs) comparing Landsat-8 and ENVI-met model data | 2021 | [13] |
| Combination of Sentinel-2 and PALSAR-2 for Local Climate Zone Classification: A Case Study of Nanchang, China | 2021 | [25] |
| Dynamic changes of local climate zones in the Guangdong–Hong Kong–Macao greater bay area and their spatial-temporal impacts on the surface urban heat island effect between 2005 and 2015 | 2021 | [65] |
| Evaluation of seasonal variability in magnitude of urban heat islands using local climate zone classification and surface albedo | 2021 | [41] |
| Exploring diurnal thermal variations in urban local climate zones with ECOSTRESS land surface temperature data | 2021 | [27] |
| Exploring the relationship between urban form and land surface temperature (LST) in a semi-arid region case study of Ben Guerir city—Morocco | 2021 | [35] |
| LCZ scheme for assessing Urban Heat Island intensity in a complex urban area (Beirut, Lebanon) | 2021 | [66] |
| Local climate zones and thermal characteristics in Riyadh City, Saudi Arabia | 2021 | [67] |
| Local climate zones mapping using object-based image analysis and validation of its effectiveness through urban surface temperature analysis in China | 2021 | [28] |
| Seasonal SUHI analysis using local climate zone classification: A case study of Wuhan, China | 2021 | [68] |
| Spatial variability and temporal heterogeneity of surface urban heat island patterns and the suitability of local climate zones for land surface temperature characterization | 2021 | [12] |
| Spatiotemporal characteristics of the surface urban heat island and its driving factors based on local climate zones and population in Beijing, China | 2021 | [5] |
| The suitability of the urban local climate zone classification scheme for surface temperature studies in distinct macroclimate regions | 2021 | [69] |
| Time Evolution of the Surface Urban Heat Island | 2021 | [70] |
| Urban Thermal Characteristics of Local Climate Zones and Their Mitigation Measures across Cities in Different Climate Zones of China | 2021 | [55] |
| An urban energy balance-guided machine learning approach for synthetic nocturnal surface Urban Heat Island prediction: A heatwave event in Naples | 2022 | [50] |
| Analysis of surface urban heat islands based on local climate zones via spatiotemporally enhanced land surface temperature | 2022 | [30] |
| Diurnally continuous dynamics of surface urban heat island intensities of local climate zones with spatiotemporally enhanced satellite-derived land surface temperatures | 2022 | [39] |
| Estimation of the Urban Heat Island Effect in a Reformed Urban District: A Scenario-Based Study in Hong Kong | 2022 | [46] |
| Geographical Detection of Urban Thermal Environment Based on the Local Climate Zones: A Case Study in Wuhan, China | 2022 | [71] |
| Identification of SUHI in Urban Areas by Remote Sensing Data and Mitigation Hypothesis through Solar Reflective Materials | 2022 | [23] |
| Spatiotemporal evolution of urban development and surface urban heat island in Guangdong–Hong Kong–Macau greater bay area of China from 2013 to 2019 | 2022 | [72] |
| The role of blue green infrastructure in the urban thermal environment across seasons and local climate zones in East Africa | 2022 | [26] |
| Using Local Climate Zones to investigate Spatio-temporal evolution of thermal environment at the urban regional level: A case study in Xi’an, China | 2022 | [32] |
References
- United Nations. Available online: https://www.un.org/development/desa/en/news/population/2018-revision-of-world-urbanization-prospects.html (accessed on 9 August 2022).
- Dewan, A.; Kiselev, G.; Botje, D. Diurnal and Seasonal Trends and Associated Determinants of Surface Urban Heat Islands in Large Bangladesh Cities. Appl. Geogr. 2021, 135, 102533. [Google Scholar] [CrossRef]
- Sobrino, J.A.; Irakulis, I.A. Methodology for Comparing the Surface Urban Heat Island in Selected Urban Agglomerations Around the World from Sentinel-3 SLSTR Data. Remote Sens. 2020, 12, 2052. [Google Scholar] [CrossRef]
- Yang, J.; Wang, Y.; Xiu, C.; Xiao, X.; Xia, J.; Jin, C. Optimizing Local Climate Zones to Mitigate Urban Heat Island Effect in Human Settlements. J. Clean. Prod. 2020, 275, 123767. [Google Scholar] [CrossRef]
- Zhang, Y.; Li, D.; Liu, L.; Liang, Z.; Shen, J.; Wei, F.; Li, S. Spatiotemporal Characteristics of the Surface Urban Heat Island and Its Driving Factors Based on Local Climate Zones and Population in Beijing, China. Atmosphere 2021, 12, 1271. [Google Scholar] [CrossRef]
- Stewart, I.D.; Oke, T.R. Local Climate Zones for Urban Temperature Studies. Bull. Am. Meteorol. Soc. 2012, 93, 1879–1900. [Google Scholar] [CrossRef]
- Demuzere, M.; Kittner, J.; Bechtel, B. LCZ Generator: A Web Application to Create Local Climate Zone Maps. Front. Environ. Sci. 2021, 9, 637455. [Google Scholar] [CrossRef]
- Souza, C.A.; De Paranhos Filho, A.C.; Guaraldo, E. IDENTIFICAÇÃO E CARACTERIZAÇÃO DA PAISAGEM URBANA E ENTORNO RURAL DE CAMPO GRANDE. Rev. Gestão Sustentabilidade Ambient. 2020, 9, 263. [Google Scholar] [CrossRef]
- Lehnert, M.; Savić, S.; Milošević, D.; Dunjić, J.; Geletič, J. Mapping Local Climate Zones and Their Applications in European Urban Environments: A Systematic Literature Review and Future Development Trends. Int. J. Geo-Inf. 2021, 10, 260. [Google Scholar] [CrossRef]
- Xue, J.; You, R.; Liu, W.; Chen, C.; Lai, D. Applications of Local Climate Zone Classification Scheme to Improve Urban Sustainability: A Bibliometric Review. Sustainability 2020, 12, 8083. [Google Scholar] [CrossRef]
- Viana, J.; Santos, J.; Neiva, R.; Souza, J.; Duarte, L.; Teodoro, A.; Freitas, A. Remote Sensing in Human Health: A 10-Year Bibliometric Analysis. Remote Sens. 2017, 9, 1225. [Google Scholar] [CrossRef]
- Zhao, Z.; Sharifi, A.; Dong, X.; Shen, L.; He, B.-J. Spatial Variability and Temporal Heterogeneity of Surface Urban Heat Island Patterns and the Suitability of Local Climate Zones for Land Surface Temperature Characterization. Remote Sens. 2021, 13, 4338. [Google Scholar] [CrossRef]
- Unal Cilek, M.; Cilek, A. Analyses of Land Surface Temperature (LST) Variability among Local Climate Zones (LCZs) Comparing Landsat-8 and ENVI-Met Model Data. Sustain. Cities Soc. 2021, 69, 102877. [Google Scholar] [CrossRef]
- Zhou, X.; Okaze, T.; Ren, C.; Cai, M.; Ishida, Y.; Watanabe, H.; Mochida, A. Evaluation of Urban Heat Islands Using Local Climate Zones and the Influence of Sea-Land Breeze. Sustain. Cities Soc. 2020, 55, 102060. [Google Scholar] [CrossRef]
- Wang, R.; Cai, M.; Ren, C.; Bechtel, B.; Xu, Y.; Ng, E. Detecting Multi-Temporal Land Cover Change and Land Surface Temperature in Pearl River Delta by Adopting Local Climate Zone. Urban Clim. 2019, 28, 100455. [Google Scholar] [CrossRef]
- Bartesaghi Koc, C.; Osmond, P.; Peters, A.; Irger, M. Understanding Land Surface Temperature Differences of Local Climate Zones Based on Airborne Remote Sensing Data. IEEE J. Sel. Top. Appl. Earth Obs. Remote Sens. 2018, 11, 2724–2730. [Google Scholar] [CrossRef]
- Van Eck, N.J.; Waltman, L. VOSviewer Manual, version 1.6.18. Leiden University: Leiden, The Netherlands, 2022. [Google Scholar]
- USGS. Available online: https://www.usgs.gov/landsat-missions/landsat-satellite-missions (accessed on 28 June 2022).
- NASA. Available online: http://aqua.nasa.gov/ (accessed on 28 June 2022).
- NASA. Available online: http://www.nasa.gov/mission_pages/terra/index.html (accessed on 28 June 2022).
- Sattelite Imaging Corporation. Available online: www.satimagingcorp.com/satellite-sensors/aster.html (accessed on 28 June 2022).
- Nassar, A.K.; Blackburn, G.A.; Whyatt, J.D. Dynamics and Controls of Urban Heat Sink and Island Phenomena in a Desert City: Development of a Local Climate Zone Scheme Using Remotely-Sensed Inputs. Int. J. Appl. Earth Obs. Geoinf. 2016, 51, 76–90. [Google Scholar] [CrossRef]
- Costanzini, S.; Despini, F.; Beltrami, L.; Fabbi, S.; Muscio, A.; Teggi, S. Identification of SUHI in Urban Areas by Remote Sensing Data and Mitigation Hypothesis through Solar Reflective Materials. Atmosphere 2021, 13, 70. [Google Scholar] [CrossRef]
- Brousse, O.; Wouters, H.; Demuzere, M.; Thiery, W.; Walle, J.V.; Lipzig, N.P.M. The Local Climate Impact of an African City During Clear-Sky Conditions-Implications of the Recent Urbanization in Kampala (Uganda). Int. J. Climatol. 2020, 40, 4586–4608. [Google Scholar] [CrossRef]
- Chen, C.; Bagan, H.; Xie, X.; La, Y.; Yamagata, Y. Combination of Sentinel-2 and PALSAR-2 for Local Climate Zone Classification: A Case Study of Nanchang, China. Remote Sens. 2021, 13, 1902. [Google Scholar] [CrossRef]
- Li, X.; Stringer, L.C.; Dallimer, M. The Role of Blue Green Infrastructure in the Urban Thermal Environment across Seasons and Local Climate Zones in East Africa. Sustain. Cities Soc. 2022, 80, 103798. [Google Scholar] [CrossRef]
- Chang, Y.; Xiao, J.; Li, X.; Middel, A.; Zhang, Y.; Gu, Z.; Wu, Y.; He, S. Exploring Diurnal Thermal Variations in Urban Local Climate Zones with ECOSTRESS Land Surface Temperature Data. Remote Sens. Environ. 2021, 263, 112544. [Google Scholar] [CrossRef]
- Ma, L.; Yang, Z.; Zhou, L.; Lu, H.; Yin, G. Local Climate Zones Mapping Using Object-Based Image Analysis and Validation of Its Effectiveness through Urban Surface Temperature Analysis in China. Build. Environ. 2021, 206, 108348. [Google Scholar] [CrossRef]
- Hu, J.; Yang, Y.; Pan, X.; Zhu, Q.; Zhan, W.; Wang, Y.; Ma, W.; Su, W. Analysis of the Spatial and Temporal Variations of Land Surface Temperature Based on Local Climate Zones: A Case Study in Nanjing, China. IEEE J. Sel. Top. Appl. Earth Obs. Remote Sens. 2019, 12, 4213–4223. [Google Scholar] [CrossRef]
- Xia, H.; Chen, Y.; Song, C.; Li, J.; Quan, J.; Zhou, G. Analysis of Surface Urban Heat Islands Based on Local Climate Zones via Spatiotemporally Enhanced Land Surface Temperature. Remote Sens. Environ. 2022, 273, 112972. [Google Scholar] [CrossRef]
- Dimitrov, S.; Popov, A.; Iliev, M. An Application of the LCZ Approach in Surface Urban Heat Island Mapping in Sofia, Bulgaria. Atmosphere 2021, 12, 1370. [Google Scholar] [CrossRef]
- Han, B.; Luo, Z.; Liu, Y.; Zhang, T.; Yang, L. Using Local Climate Zones to Investigate Spatio-Temporal Evolution of Thermal Environment at the Urban Regional Level: A Case Study in Xi′an, China. Sustain. Cities Soc. 2022, 76, 103495. [Google Scholar] [CrossRef]
- Jimenez-Munoz, J.C.; Cristobal, J.; Sobrino, J.A.; Soria, G.; Ninyerola, M.; Pons, X.; Pons, X. Revision of the Single-Channel Algorithm for Land Surface Temperature Retrieval From Landsat Thermal-Infrared Data. IEEE Trans. Geosci. Remote Sens. 2009, 47, 339–349. [Google Scholar] [CrossRef]
- Wang, M.; He, G.; Zhang, Z.; Wang, G.; Wang, Z.; Yin, R.; Cui, S.; Wu, Z.; Cao, X. A Radiance-Based Split-Window Algorithm for Land Surface Temperature Retrieval: Theory and Application to MODIS Data. Int. J. Appl. Earth Obs. Geoinf. 2019, 76, 204–217. [Google Scholar] [CrossRef]
- Azmi, R.; Tekouabou Koumetio, C.S.; Diop, E.B.; Chenal, J. Exploring the Relationship between Urban Form and Land Surface Temperature (LST) in a Semi-Arid Region Case Study of Ben Guerir City—Morocco. Environ. Chall. 2021, 5, 100229. [Google Scholar] [CrossRef]
- Wan, Z.; Dozier, J. A Generalized Split-Window Algorithm for Retrieving Land-Surface Temperature from Space. IEEE Trans. Geosci. Remote Sens. 1996, 34, 892–905. [Google Scholar] [CrossRef]
- Qin, Z.; Karnieli, A.; Berliner, P. A Mono-Window Algorithm for Retrieving Land Surface Temperature from Landsat TM Data and Its Application to the Israel-Egypt Border Region. Int. J. Remote Sens. 2001, 22, 3719–3746. [Google Scholar] [CrossRef]
- Han, J.; Liu, J.; Liu, L.; Ye, Y. Spatiotemporal Changes in the Urban Heat Island Intensity of Distinct Local Climate Zones: Case Study of Zhongshan District, Dalian, China. Complexity 2020, 2020, 1–9. [Google Scholar] [CrossRef]
- Dong, P.; Jiang, S.; Zhan, W.; Wang, C.; Miao, S.; Du, H.; Li, J.; Wang, S.; Jiang, L. Diurnally Continuous Dynamics of Surface Urban Heat Island Intensities of Local Climate Zones with Spatiotemporally Enhanced Satellite-Derived Land Surface Temperatures. Build. Environ. 2022, 218, 109105. [Google Scholar] [CrossRef]
- Fricke, C.; Pongrácz, R.; Gál, T.; Savić, S.; Unger, J. Using Local Climate Zones to Compare Remotely Sensed Surface Temperatures in Temperate Cities and Hot Desert Cities. Morav. Geogr. Rep. 2020, 28, 48–60. [Google Scholar] [CrossRef]
- Dutta, K.; Basu, D.; Agrawal, S. Evaluation of Seasonal Variability in Magnitude of Urban Heat Islands Using Local Climate Zone Classification and Surface Albedo. Int. J. Environ. Sci. Technol. 2021, 19, 8677–8698. [Google Scholar] [CrossRef]
- Wang, Y.; Ni, Z.; Hu, M.; Chen, S.; Xia, B. A Practical Approach of Urban Green Infrastructure Planning to Mitigate Urban Overheating: A Case Study of Guangzhou. J. Clean. Prod. 2021, 287, 124995. [Google Scholar] [CrossRef]
- Bechtel, B.; Demuzere, M.; Mills, G.; Zhan, W.; Sismanidis, P.; Small, C.; Voogt, J. SUHI Analysis Using Local Climate Zones—A Comparison of 50 Cities. Urban Clim. 2019, 28, 100451. [Google Scholar] [CrossRef]
- Quan, J. Multi-Temporal Effects of Urban Forms and Functions on Urban Heat Islands Based on Local Climate Zone Classification. Int. J. Environ. Res. Public Health 2019, 16, 35. [Google Scholar] [CrossRef] [PubMed]
- Mandelmilch, M.; Ferenz, M.; Mandelmilch, N.; Potchter, O. Urban Spatial Patterns and Heat Exposure in the Mediterranean City of Tel Aviv. Atmosphere 2020, 11, 963. [Google Scholar] [CrossRef]
- Zhu, R.; Dong, X.; Wong, M.S. Estimation of the Urban Heat Island Effect in a Reformed Urban District: A Scenario-Based Study in Hong Kong. Sustainability 2022, 14, 4409. [Google Scholar] [CrossRef]
- Cai, Z.; Tang, Y.; Zhan, Q. A Cooled City? Comparing Human Activity Changes on the Impact of Urban Thermal Environment before and after City-Wide Lockdown. Build. Environ. 2021, 195, 107729. [Google Scholar] [CrossRef] [PubMed]
- Rouse, W.; Haas, R.H. Monitoring vegetation systems in the Great Plains with Erts. NASA Spec. Publ. 1974, 351, 309. [Google Scholar]
- Gao, B. NDWI—A Normalized Difference Water Index for Remote Sensing of Vegetation Liquid Water from Space. Remote Sens. Environ. 1996, 58, 257–266. [Google Scholar] [CrossRef]
- Oliveira, A.; Lopes, A.; Niza, S.; Soares, A. An Urban Energy Balance-Guided Machine Learning Approach for Synthetic Nocturnal Surface Urban Heat Island Prediction: A Heatwave Event in Naples. Sci. Total Environ. 2022, 805, 150130. [Google Scholar] [CrossRef]
- Wan, J.; Yong, B.; Zhou, X. Spatial and Temporal Analysis of the Increasing Effects of Large-Scale Infrastructure Construction on the Surface Urban Heat Island. Ecotoxicol. Environ. Saf. 2022, 237, 113521. [Google Scholar] [CrossRef]
- Martins, G.A.; Domingues, O. Estatística Geral E Aplicada, 6th ed.; Publisher: Atlas, Brazil, 2017; pp. 1–360. [Google Scholar]
- Nurwanda, A.; Honjo, T. Analysis of Land Use Change and Expansion of Surface Urban Heat Island in Bogor City by Remote Sensing. ISPRS Int. J. Geo-Inf. 2018, 7, 165. [Google Scholar] [CrossRef]
- Budhiraja, B.; Gawuc, L.; Agrawal, G. Seasonality of Surface Urban Heat Island in Delhi City Region Measured by Local Climate Zones and Conventional Indicators. IEEE J. Sel. Top. Appl. Earth Obs. Remote Sens. 2019, 12, 5223–5232. [Google Scholar] [CrossRef]
- Li, N.; Yang, J.; Qiao, Z.; Wang, Y.; Miao, S. Urban Thermal Characteristics of Local Climate Zones and Their Mitigation Measures across Cities in Different Climate Zones of China. Remote Sens. 2021, 13, 1468. [Google Scholar] [CrossRef]
- Quan, J. Enhanced Geographic Information System-Based Mapping of Local Climate Zones in Beijing, China. Sci. China Technol. Sci. 2019, 62, 2243–2260. [Google Scholar] [CrossRef]
- Feng, J.; Cai, X.; Chapman, L. Impact of Atmospheric Conditions and Levels of Urbanization on the Relationship between Nocturnal Surface and Urban Canopy Heat Islands. Q. J. R. Meteorol. Soc. 2019, 145, 3284–3299. [Google Scholar] [CrossRef]
- Geletič, J.; Lehnert, M.; Savić, S.; Milošević, D. Inter-/Intra-Zonal Seasonal Variability of the Surface Urban Heat Island Based on Local Climate Zones in Three Central European Cities. Build. Environ. 2019, 156, 21–32. [Google Scholar] [CrossRef]
- Shi, Y.; Xiang, Y.; Zhang, Y. Urban Design Factors Influencing Surface Urban Heat Island in the High-Density City of Guangzhou Based on the Local Climate Zone. Sensors 2019, 19, 3459. [Google Scholar] [CrossRef]
- Dian, C.; Pongrácz, R.; Dezső, Z.; Bartholy, J. Annual and Monthly Analysis of Surface Urban Heat Island Intensity with Respect to the Local Climate Zones in Budapest. Urban Clim. 2020, 31, 100573. [Google Scholar] [CrossRef]
- Ochola, E.M.; Fakharizadehshirazi, E.; Adimo, A.O.; Mukundi, J.B.; Wesonga, J.M.; Sodoudi, S. Inter-Local Climate Zone Differentiation of Land Surface Temperatures for Management of Urban Heat in Nairobi City, Kenya. Urban Clim. 2020, 31, 100540. [Google Scholar] [CrossRef]
- Chen, Y.; Zheng, B.; Hu, Y. Mapping Local Climate Zones Using ArcGIS-Based Method and Exploring Land Surface Temperature Characteristics in Chenzhou, China. Sustainability 2020, 12, 2974. [Google Scholar] [CrossRef]
- Chen, X.; Xu, Y.; Yang, J.; Wu, Z.; Zhu, H. Remote Sensing of Urban Thermal Environments within Local Climate Zones: A Case Study of Two High-Density Subtropical Chinese Cities. Urban Clim. 2020, 31, 100568. [Google Scholar] [CrossRef]
- Zhao, C.; Jensen, J.L.R.; Weng, Q.; Currit, N.; Weaver, R. Use of Local Climate Zones to Investigate Surface Urban Heat Islands in Texas. GIScience Remote Sens. 2020, 57, 1083–1101. [Google Scholar] [CrossRef]
- Lu, Y.; Yang, J.; Ma, S. Dynamic Changes of Local Climate Zones in the Guangdong–Hong Kong–Macao Greater Bay Area and Their Spatial-Temporal Impacts on the Surface Urban Heat Island Effect between 2005 and 2015. Sustainability 2021, 13, 6374. [Google Scholar] [CrossRef]
- Badaro-Saliba, N.; Adjizian-Gerard, J.; Zaarour, R.; Najjar, G. LCZ Scheme for Assessing Urban Heat Island Intensity in a Complex Urban Area (Beirut, Lebanon). Urban Clim. 2021, 37, 100846. [Google Scholar] [CrossRef]
- Alghamdi, A.S.; Alzhrani, A.I.; Alanazi, H.H. Local Climate Zones and Thermal Characteristics in Riyadh City, Saudi Arabia. Remote Sens. 2021, 13, 4526. [Google Scholar] [CrossRef]
- Shi, L.; Ling, F.; Foody, G.M.; Yang, Z.; Liu, X.; Du, Y. Seasonal SUHI Analysis Using Local Climate Zone Classification: A Case Study of Wuhan, China. Int. J. Environ. Res. Public Health 2021, 18, 7232. [Google Scholar] [CrossRef] [PubMed]
- Eldesoky, A.H.M.; Gil, J.; Pont, M.B. The Suitability of the Urban Local Climate Zone Classification Scheme for Surface Temperature Studies in Distinct Macroclimate Regions. Urban Clim. 2021, 37, 100823. [Google Scholar] [CrossRef]
- Stewart, I.D.; Krayenhoff, E.S.; Voogt, J.A.; Lachapelle, J.A.; Allen, M.A.; Broadbent, A.M. Time Evolution of the Surface Urban Heat Island. Earths Future 2021, 9, e2021EF002178. [Google Scholar] [CrossRef]
- Wang, R.; Wang, M.; Zhang, Z.; Hu, T.; Xing, J.; He, Z.; Liu, X. Geographical Detection of Urban Thermal Environment Based on the Local Climate Zones: A Case Study in Wuhan, China. Remote Sens. 2022, 14, 1067. [Google Scholar] [CrossRef]
- Wang, Y.; Yao, Y.; Chen, S.; Ni, Z.; Xia, B. Spatiotemporal Evolution of Urban Development and Surface Urban Heat Island in Guangdong-Hong Kong-Macau Greater Bay Area of China from 2013 to 2019. Resour. Conserv. Recycl. 2022, 179, 106063. [Google Scholar] [CrossRef]


Disclaimer/Publisher’s Note: The statements, opinions and data contained in all publications are solely those of the individual author(s) and contributor(s) and not of MDPI and/or the editor(s). MDPI and/or the editor(s) disclaim responsibility for any injury to people or property resulting from any ideas, methods, instructions or products referred to in the content. |
© 2023 by the authors. Licensee MDPI, Basel, Switzerland. This article is an open access article distributed under the terms and conditions of the Creative Commons Attribution (CC BY) license (https://creativecommons.org/licenses/by/4.0/).