Article

Greenland-Ice-Sheet Surface Temperature and Melt Extent from 2000 to 2020 and Implications for Mass Balance

1
Shaanxi Key Laboratory of Earth Surface System and Environmental Carrying Capacity, College of Urban and Environmental Sciences, Northwest University, Xi’an 710127, China
2
Institute of Earth Surface System and Hazards, College of Urban and Environmental Sciences, Northwest University, Xi’an 710127, China
3
Institute of Tibetan Plateau Research, Chinese Academy of Sciences, Beijing 100101, China
*
Author to whom correspondence should be addressed.
Remote Sens. 2023, 15(4), 1149; https://doi.org/10.3390/rs15041149
Submission received: 24 November 2022 / Revised: 9 February 2023 / Accepted: 13 February 2023 / Published: 20 February 2023
(This article belongs to the Section Ocean Remote Sensing)

Abstract

:
Accurate monitoring of surface temperature and melting on the Greenland Ice Sheet (GrIS) is important for tracking the ice sheet’s mass balance as well as global and Arctic climate change. Using a moderate-resolution-imaging-spectroradiometer (MODIS)-derived land-surface-temperature (LST) data product with a resolution of 1 km from 2000 to 2020, the temporal and spatial variations of annual and seasonal ‘clear-sky’ surface temperature were evaluated. We also monitored summer surface melting and studied the relationship between the mass balance of the ice sheet and changes in surface temperature and melting. The results show that the mean annual LST during the study period is −24.86 ± 5.46 °C, with the highest of −22.48 ± 5.61 °C in 2010 and the lowest temperature of −26.49 ± 5.30 °C in 2015. With the change of season, the spatial variation of the ice-sheet surface temperature changes greatly. 2012 and 2019 experienced the warmest summers (−5.92 ± 4.01 °C and −6.51 ± 3.93 °C), with extreme cumulative melting detected on the ice-sheet surface (89.9% and 89.7%, respectively), and 2002 also experienced a greater extent of melting. But short period of melt in 2002 and 2019 (30.6% and 31.4%, respectively), accounted for a larger proportion, with neither the duration nor intensity of the melt reaching that of 2012. There is a strong correlation between the GrIS surface temperature and its mass balance. By fitting the relationship between surface temperature and mass balance, it was found that 93.83% (6.17%) of the ice-sheet response to surface-temperature change was via surface-mass balance (discharge and basal-mass balance).

1. Introduction

Cryosphere refers to the negative-temperature layer with a certain thickness and continuous distribution on the earth surface, which is an important part of the climate system and is particularly sensitive to global warming [1]. With the climate warming, glaciers, permafrost and snow cover are shrinking and decreasing, which has significant impact on global climate change and sea-level rise. As an essential component of the cryosphere, the response of the polar ice sheet to climate change and its influence on sea level and ocean currents have been the focus of global-change research for a long time [2,3,4,5]. The GrIS (Greenland Ice Sheet) and the Antarctic ice sheet are the world’s largest ice sheets, accounting for 97% of the global glacier area, and total melting would raise sea levels by 7 m and 54 m [6,7], respectively, which would have serious impacts on coastal economies and societies, even with a small rise in sea level [8]. The GrIS is more sensitive to climate change than the Antarctic ice sheet, and the Arctic has warmed two to three times as fast as the global average over the past decade [9]. From the 1960s to the 1980s, the GrIS were relatively stable, with accumulation and loss relatively balanced [10,11]. However, with continuously increasing global temperatures, numerous studies have shown significant melting and mass loss of the GrIS since the 1990s [12,13,14,15,16,17], with particularly extreme melting events occurred on the surface of the GrIS during the summers of 2012 and 2019, both of which were detected at Summit station [18,19,20,21]. Melting on the surface and subsurface of the GrIS can be detected using microwave data, but subsurface melting tends to refreeze, so the surface melting of the GrIS may have accelerated its disintegration more directly [22,23], with surface melting accounting for nearly half of the mass loss. The GrIS mass loss have increased much this century than in the 1990s, due to increased surface melting and abnormal weather conditions [24,25,26].
Surface temperature determines the distribution of its surface thermal state and melting condition, which has important characterizing significance for the changes of the GrIS radiation budget and mass balance [27,28]. Recent studies show that the increase of the GrIS mass loss is mainly due to the increase of surface-melting runoff [29,30], and the increase in surface temperature indicates that the glacier’s surface is absorbing more energy, thus directly leading to an increase in surface melting [31,32]. Models predict that a 1 °C rise in the temperature of the GrIS will increase ice melt by 20–50%, and that rising summer temperatures will accelerate the rate of melting, leading to more mass loss [33,34,35]. Therefore, accurate monitoring of the surface temperature of the GrIS is of great significance to explain the melting and mass loss and to understand the changes and mechanisms of the ice sheet. However, the existing climate network of the GrIS tend to be limited by the low quality of unsupervised observations, resulting in data gaps, and the uneven distribution of weather stations on the GrIS, which do not represent the entire surface of the GrIS. The emergence of new technologies and methods, such as satellite remote sensing, an emerging new technology that can fill the gaps in time and space [17,36], is now widely used by researchers to obtain LST [37].
Accurate monitoring of temporal and spatial changes of the GrIS surface temperature and its response to mass balance can not only better understand the change and mechanism, but also have important scientific and practical significance for assessing regional and even global climate change. Although many studies have been conducted on the Greenland ice sheet, most of them focused on the last century, and cannot accurately measure the surface temperature of the ice sheet, and few have systematically studied the surface temperature, melting and mass balance of the ice sheet. Currently, the MODIS LST (moderate-resolution imaging spectroradiometer land-surface-temperature) product has been applied since 2000 have been applied to systematically study the temporal- and spatial-variation characteristics of the GrIS surface temperature, and to evaluate the melting extent of the GrIS, due to its high data quality and good temporal resolution. Therefore, based on MODIS-LST-product data, this study evaluated the temporal and spatial changes of the GrIS surface temperature from 2000 to 2020, and analyzed the summer surface melting in detail, as well as the effects of temperature change and melting on mass balance, so as to better understand the surface-process changes and mechanisms of the GrIS in the 21st century.

2. Materials and Methods

2.1. Data

2.1.1. MODIS LST

The Moderate Resolution Imaging Spectroradiometer (MODIS) is a polar-orbiting, 36-channel, and across-track scanning spectro-radiometer whose images cover the whole region of the planet every one to two days. MODIS is on board the Terra and Aqua satellites of the NASA Earth Observation System (EOS), with data dating back to 2000 and 2002, respectively. The 1-d L3 Global Land Surface Temperature and Emissivity product (MOD11A1, discussed in detail in Wan [38]) Version 6, considered a proxy for the intensity of summer melting, was used to monitor the spatial and temporal evolution of mean LST on the GrIS. The MODIS Reprojection Tool was used for data Mosaic and projection transformation. According to the processing method of Qie et al. [39], 2 K was set as the threshold, and data with an error less than 2 K was used as the data for analysis. Pixels with an error greater than 2 K were removed. Meanwhile, as the ice surface temperature is less than or equal to 0 °C, a few spurious pixels (>0 °C) were calculated as 0 °C when calculating the mean LST [28].

2.1.2. PROMICE Data

The Programme for Monitoring of the Greenland Ice Sheet (PROMICE) has been applied to measure climate and ice-sheet properties since 2007, making precise measurements of surface and near-surface climate conditions [40].
Based on data volume and site location, 12 PROMICE in situ data were used to evaluated the applicability of MODIS LST products. The location of the weather station is shown in Figure 1. In this study, PROMICE skin temperature was derived from measured incoming and outgoing longwave-radiation measurements, using the following equation,
L S T = ( L R o u t ( 1 ε ) × L R i n ϵ × 5.67 × 10 8 ) 0.25 273.15
where L R o u t ( L R i n ) is outgoing (incoming) longwave radiation (in W m−2), and ε (surface emissivity) is set to 0.97 [41].

2.1.3. Mass Balance Data

To determine the effect of surface temperature changes on mass balance (MB), surface mass balance (SMB), discharge (D) and basal mass balance (BMB) of the GrIS, a fitting relationship between LST and mass balance, was established. We use the recently published mass-balance dataset of Mankoff [42], which is the first daily IO (input–output) product to include BMB, using an IO (MB = SMB-D-BMB) approach to assess the mass balance of the GrIS. SMB gains and losses come from a semi-empirical SMB model and three regional-climate models (RCMs, MAR, RACMO). D is solid-ice discharge. It includes both calving and submarine melting at marine-terminating glaciers. BMB comes from geothermal flux, frictional heating from ice velocity, and viscous heat dissipation. These products provided an annual estimate of the GrIS mass balance from 1840 through 1985, and a daily estimate at sector and regional scale from 1986 to the following week.

2.1.4. Other Relevant Data

In recent years, the climate of the GrIS has been affected by various atmospheric circulations [43,44]. Two indices, the North Atlantic Oscillation (NAO) and Greenland Blocking Index (GBI), were selected to analyze their effects on the surface temperature of the ice sheet. The GBI represents the mean 500-hPa geopotential height for the region 60°–80°N, 20°–80°W [45]. The NAO index represents the normalized sea-level-pressure (SLP) difference between Iceland and the Azores [46,47]. Monthly NAO data is available from (https://www.cpc.ncep.noaa.gov/products/precip/CWlink/pna/nao.shtml. Accessed on: 23 November 2022) [48], the GBI monthly data comes from the U.S. National Oceanic and Atmospheric Administration Earth System Research Laboratory [20] (NOAA’s ESRL) (https://www.esrl.noaa.gov/psd/gcos_wgsp/Timeseries/GBI_UL/. Accessed on: 23 November 2022) and Hanna [49].

2.2. Method

In this study, the mean annual and seasonal LST of the entire ice sheet and six basins were calculated [50] (Spring: MAM, Summer: JJA, Autumn: SON, Winter: DJF). The temporal and spatial interannual variation of the GrIS LST was fitted by linear least-squares regression. Since the data started from March 2000, only 20 years of data were used to calculate seasonal and annual LST trends of each grid.
Summer is the major melting period of the GrIS. This study mainly evaluated the melting of the ice-sheet surface during summer. I. Välisuo et al. [51] summarized 15 indicators of studies on the surface melting of the GrIS, mainly using the melting extent and days and duration to define the melting. Recent studies have shown that there may be a cold bias in the MODIS-derived surface temperature [23,52,53]. Discrimination of surface melting in summer, like Hall [27], in this paper, we used −1 °C as the threshold; that is, LST ≥ −1 °C is defined as melt, and the maximum extent of the GrIS LST ≥ −1 °C in summer is regarded as the maximum melt extent of the ice sheet in that year. It is worth noting that the melting percentage for each date is calculated based on the available pixels for that day, and cloud cover has an impact on determining the maximum melting. At the same time, we plotted the cumulative extent of summer surface melting and the regions where a short period of melting occurred. One–two days of melting was defined as a short period of melting, and the areas where summer melting occurred were defined as the cumulative extent of melting.

2.3. Accuracy Verification of MODIS LST

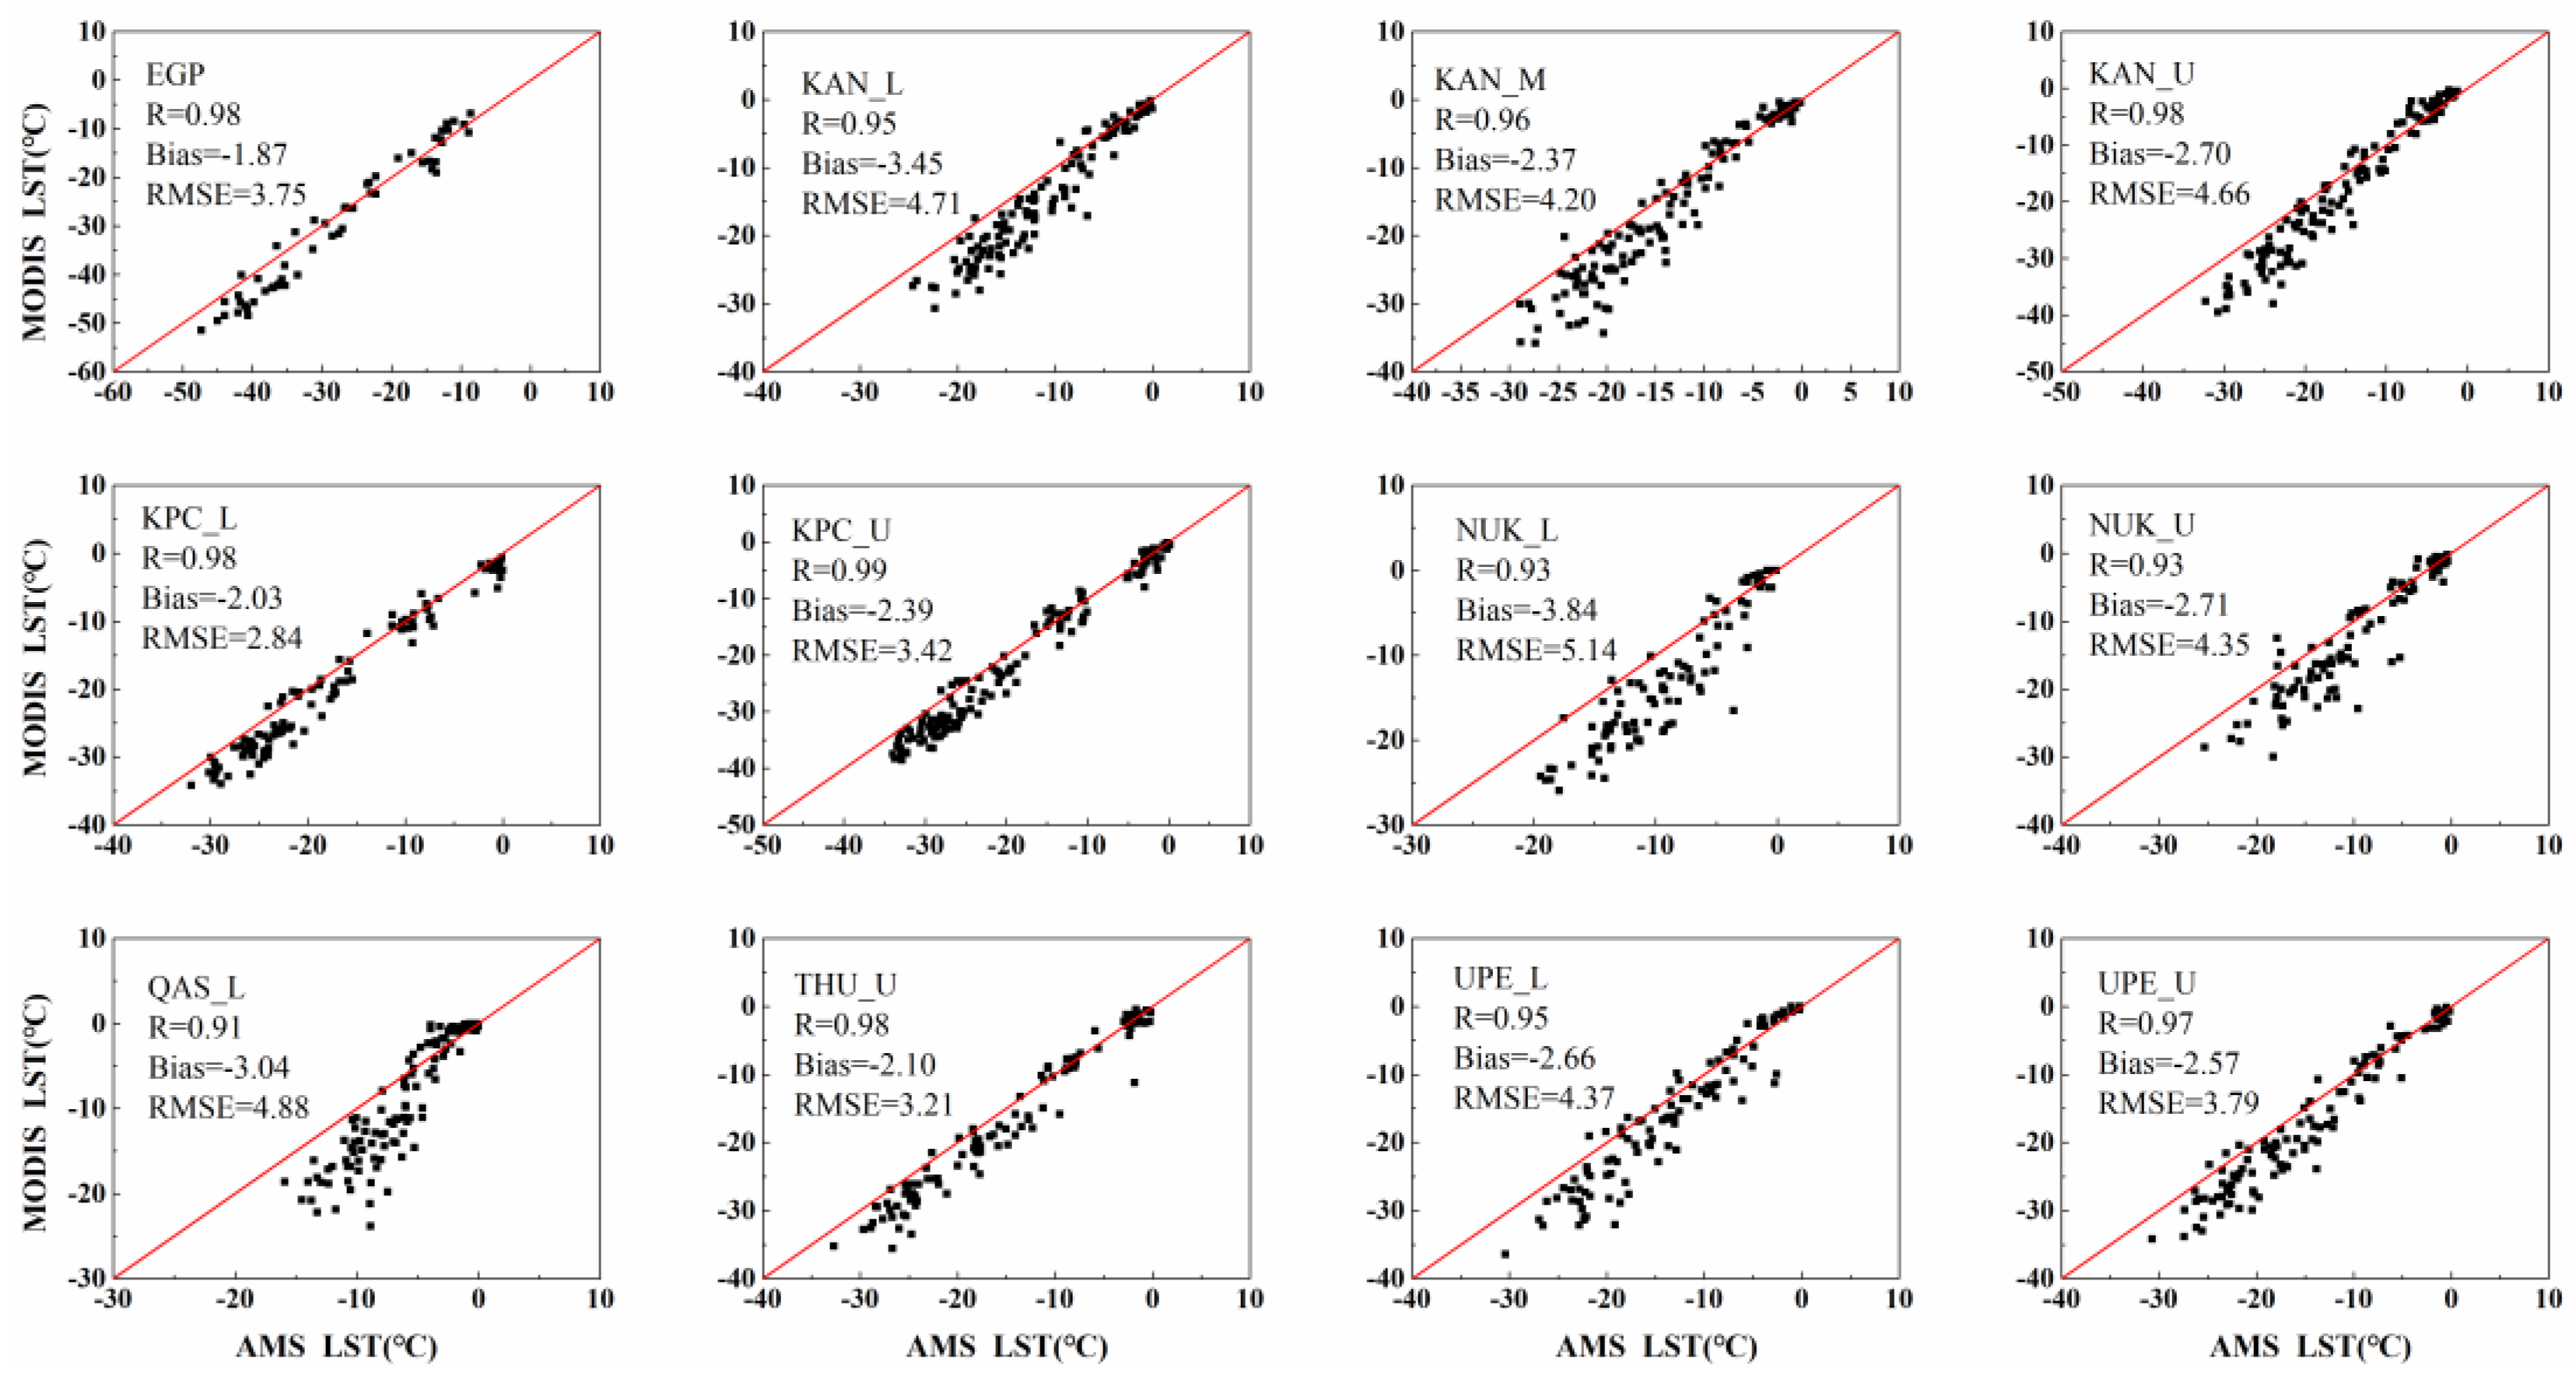
We evaluated the adaptability of the MODIS LST data using measured data from the PROMICE site. Since there are relatively few meteorological stations on the ice-sheet surface, we selected PROMICE 12 automatic meteorogical stations (AMS) to analyze the accuracy of the MODIS LST based on site locations and relative data volume. Meanwhile, three classical statistical indexes were used to estimate the performance of the MODIS product, including the bias, root-mean-square (RMSE), and correlation (R). It can be seen from Figure 2 that the MODIS LST agrees well with the AMS; with the R > 0.91, the EGP and KPC sites of AMS were 0.98 and 0.99, respectively. At the same time, we also obtained that the MODIS LST has a cold deviation of 2–4 °C, and the average RMSE was 4.12 °C, which was similar to the results obtained in previous studies. In short, the MODIS LST has a good applicability for assessing the surface temperature of the GrIS.

3. Results

3.1. Spatial Distribution and Trend of LST of the GrIS

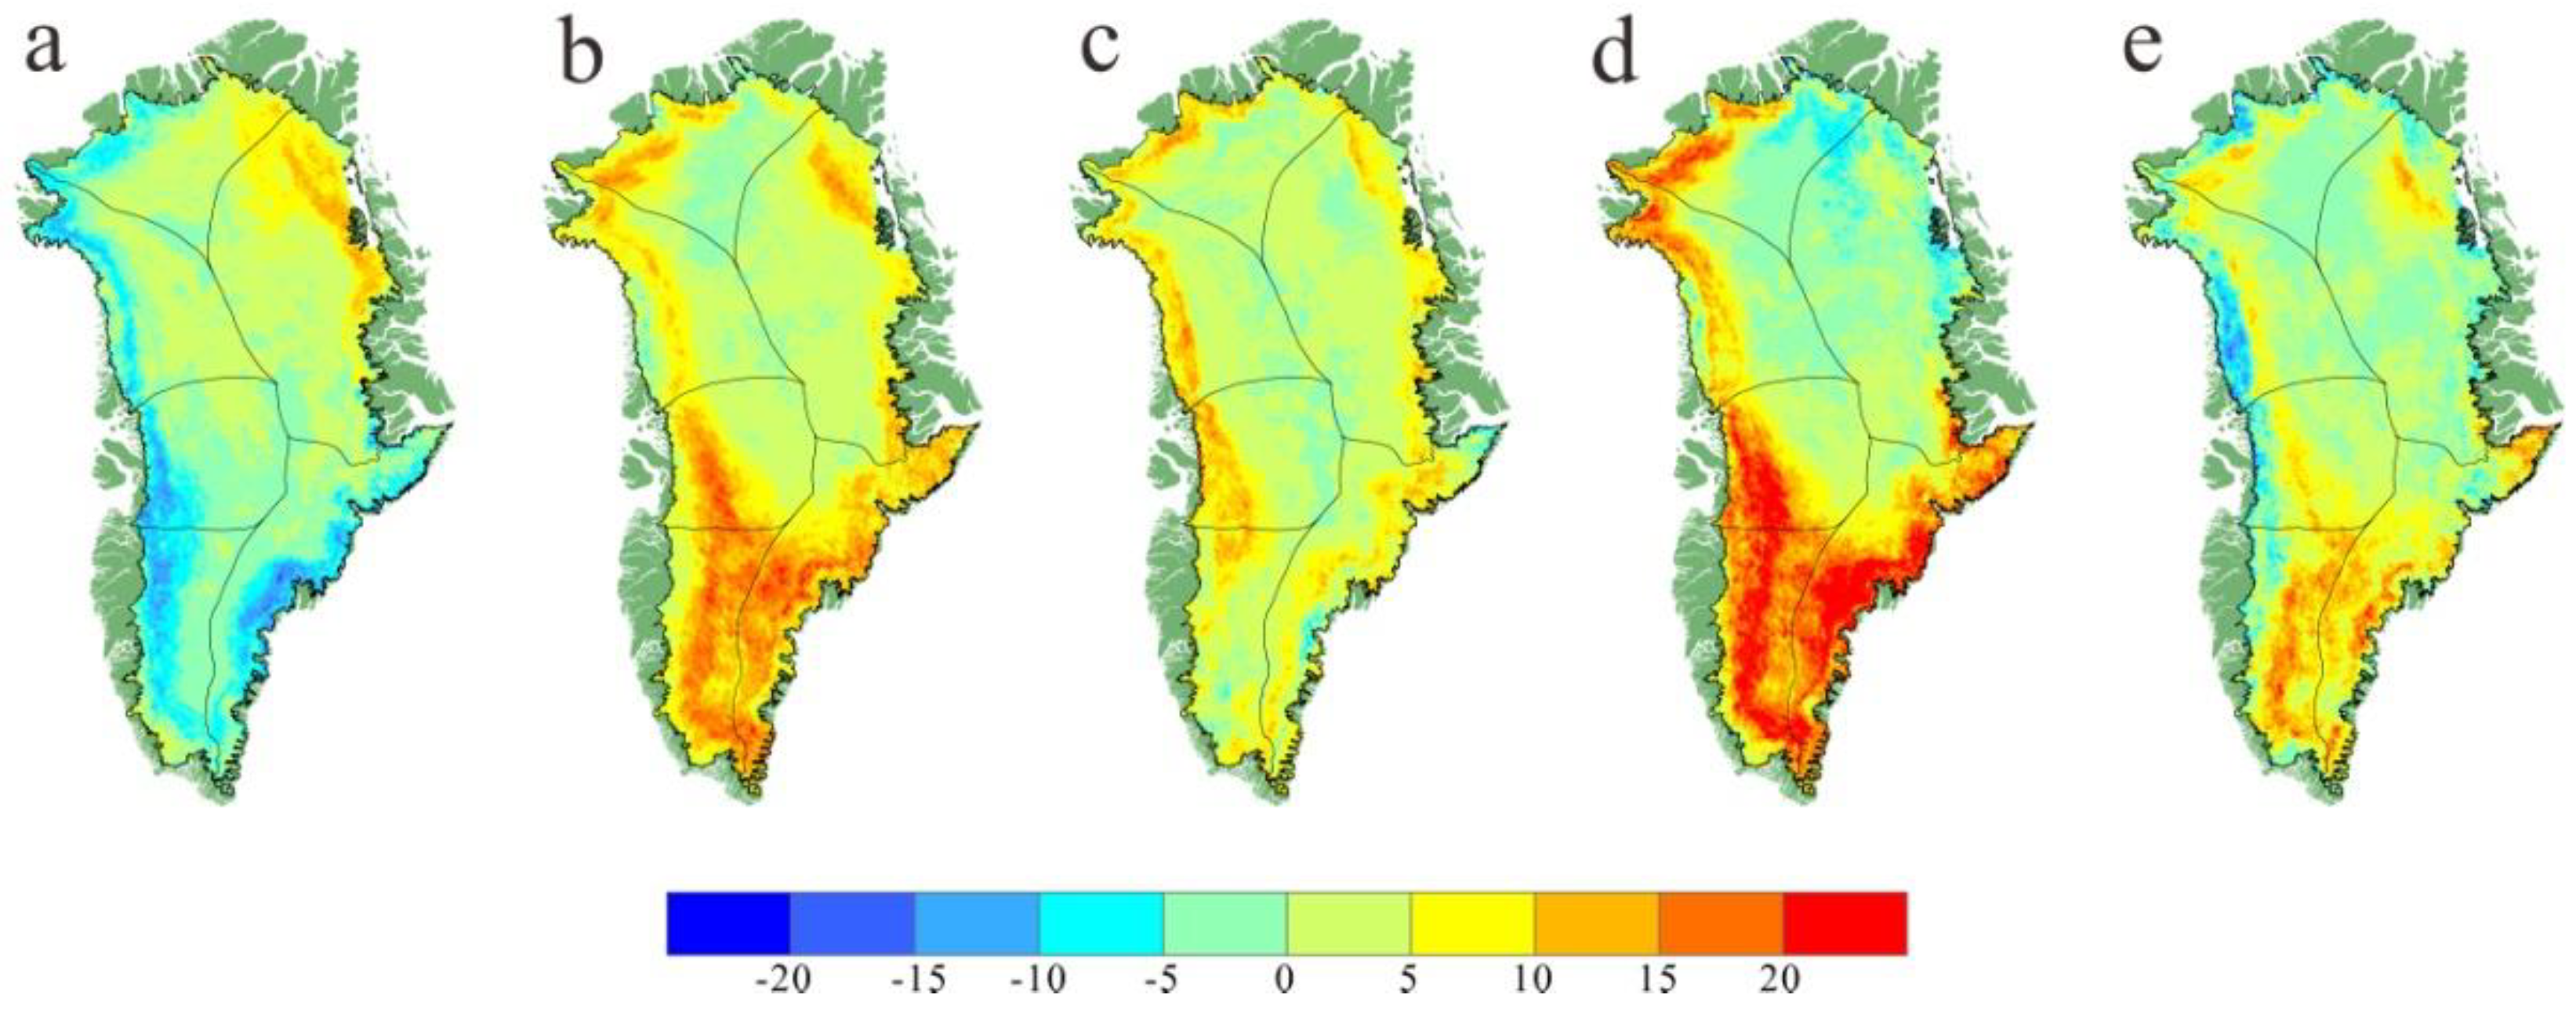
The mean LST of the GrIS from 2000 to 2020 calculated by the MODIS LST product is shown in Table 1 and Figure 3. During the study period, the mean annual LST is −24.86 ± 5.46 °C, with the highest of −22.48 ± 5.61 °C in 2010 and the lowest temperature of −26.49 ± 5.30 °C in 2015. Apparently, the mean LST is similar in spring and annually, mainly between −20 °C and −35 °C, in summer between −5 °C and −15 °C, mainly between −30 °C and −50 °C in winter, and slightly lower in autumn, inland of the ice sheet, than in spring and annually. Meanwhile, the LST in the northern GrIS is much lower than that in the southern region; the SE and SW are the warmer basins, with 6.9 °C higher than other regions, and there was no significant difference in LST in the other basins.
Obviously, the spatial pattern of surface-temperature changes in the GrIS is different, as with the change of season, the GrIS LST-change trend has a great spatial difference. The LST increases mainly in spring and summer, and decreases in autumn and winter. The variation trend of LST in spring and autumn varies greatly from north to south, and from east to west in winter. Meanwhile, the NO is the region with the strongest warming, while SE and SW are the region with the highest temperature but which experienced the most common cooling, showing obvious cooling except in summer.

3.2. Changes in Summer LST and Its Indicative Melt Extent

3.2.1. Summer LST Anomaly

The GrIS summer-LST anomaly from 2000 to 2020 as shown in Figure 4. The mean summer LST of the GrIS during the study period is −7.72 ± 4.34 °C, varying from a low of −9.24 ± 4.91 °C in 2000, to a high of −5.92 ± 4.01 °C in 2012. All six regions showed high LST in the summers of 2012 and 2019. In 2012, except for the NO, the LST in other regions increased to the highest, especially in the SE and SW, where the surface temperatures reached −2.7 ± 3.39 °C and −1.72 ± 1.87 °C, respectively. In the summer of 2000, the NO, NE and NW of the GrIS recorded the lowest LST in the last 21 years, while the lowest LST in the rest of the basin ware recorded in 2018 (SW and CW) and 2020 (SE), respectively.

3.2.2. Summer Surface Ablation in Extreme Years

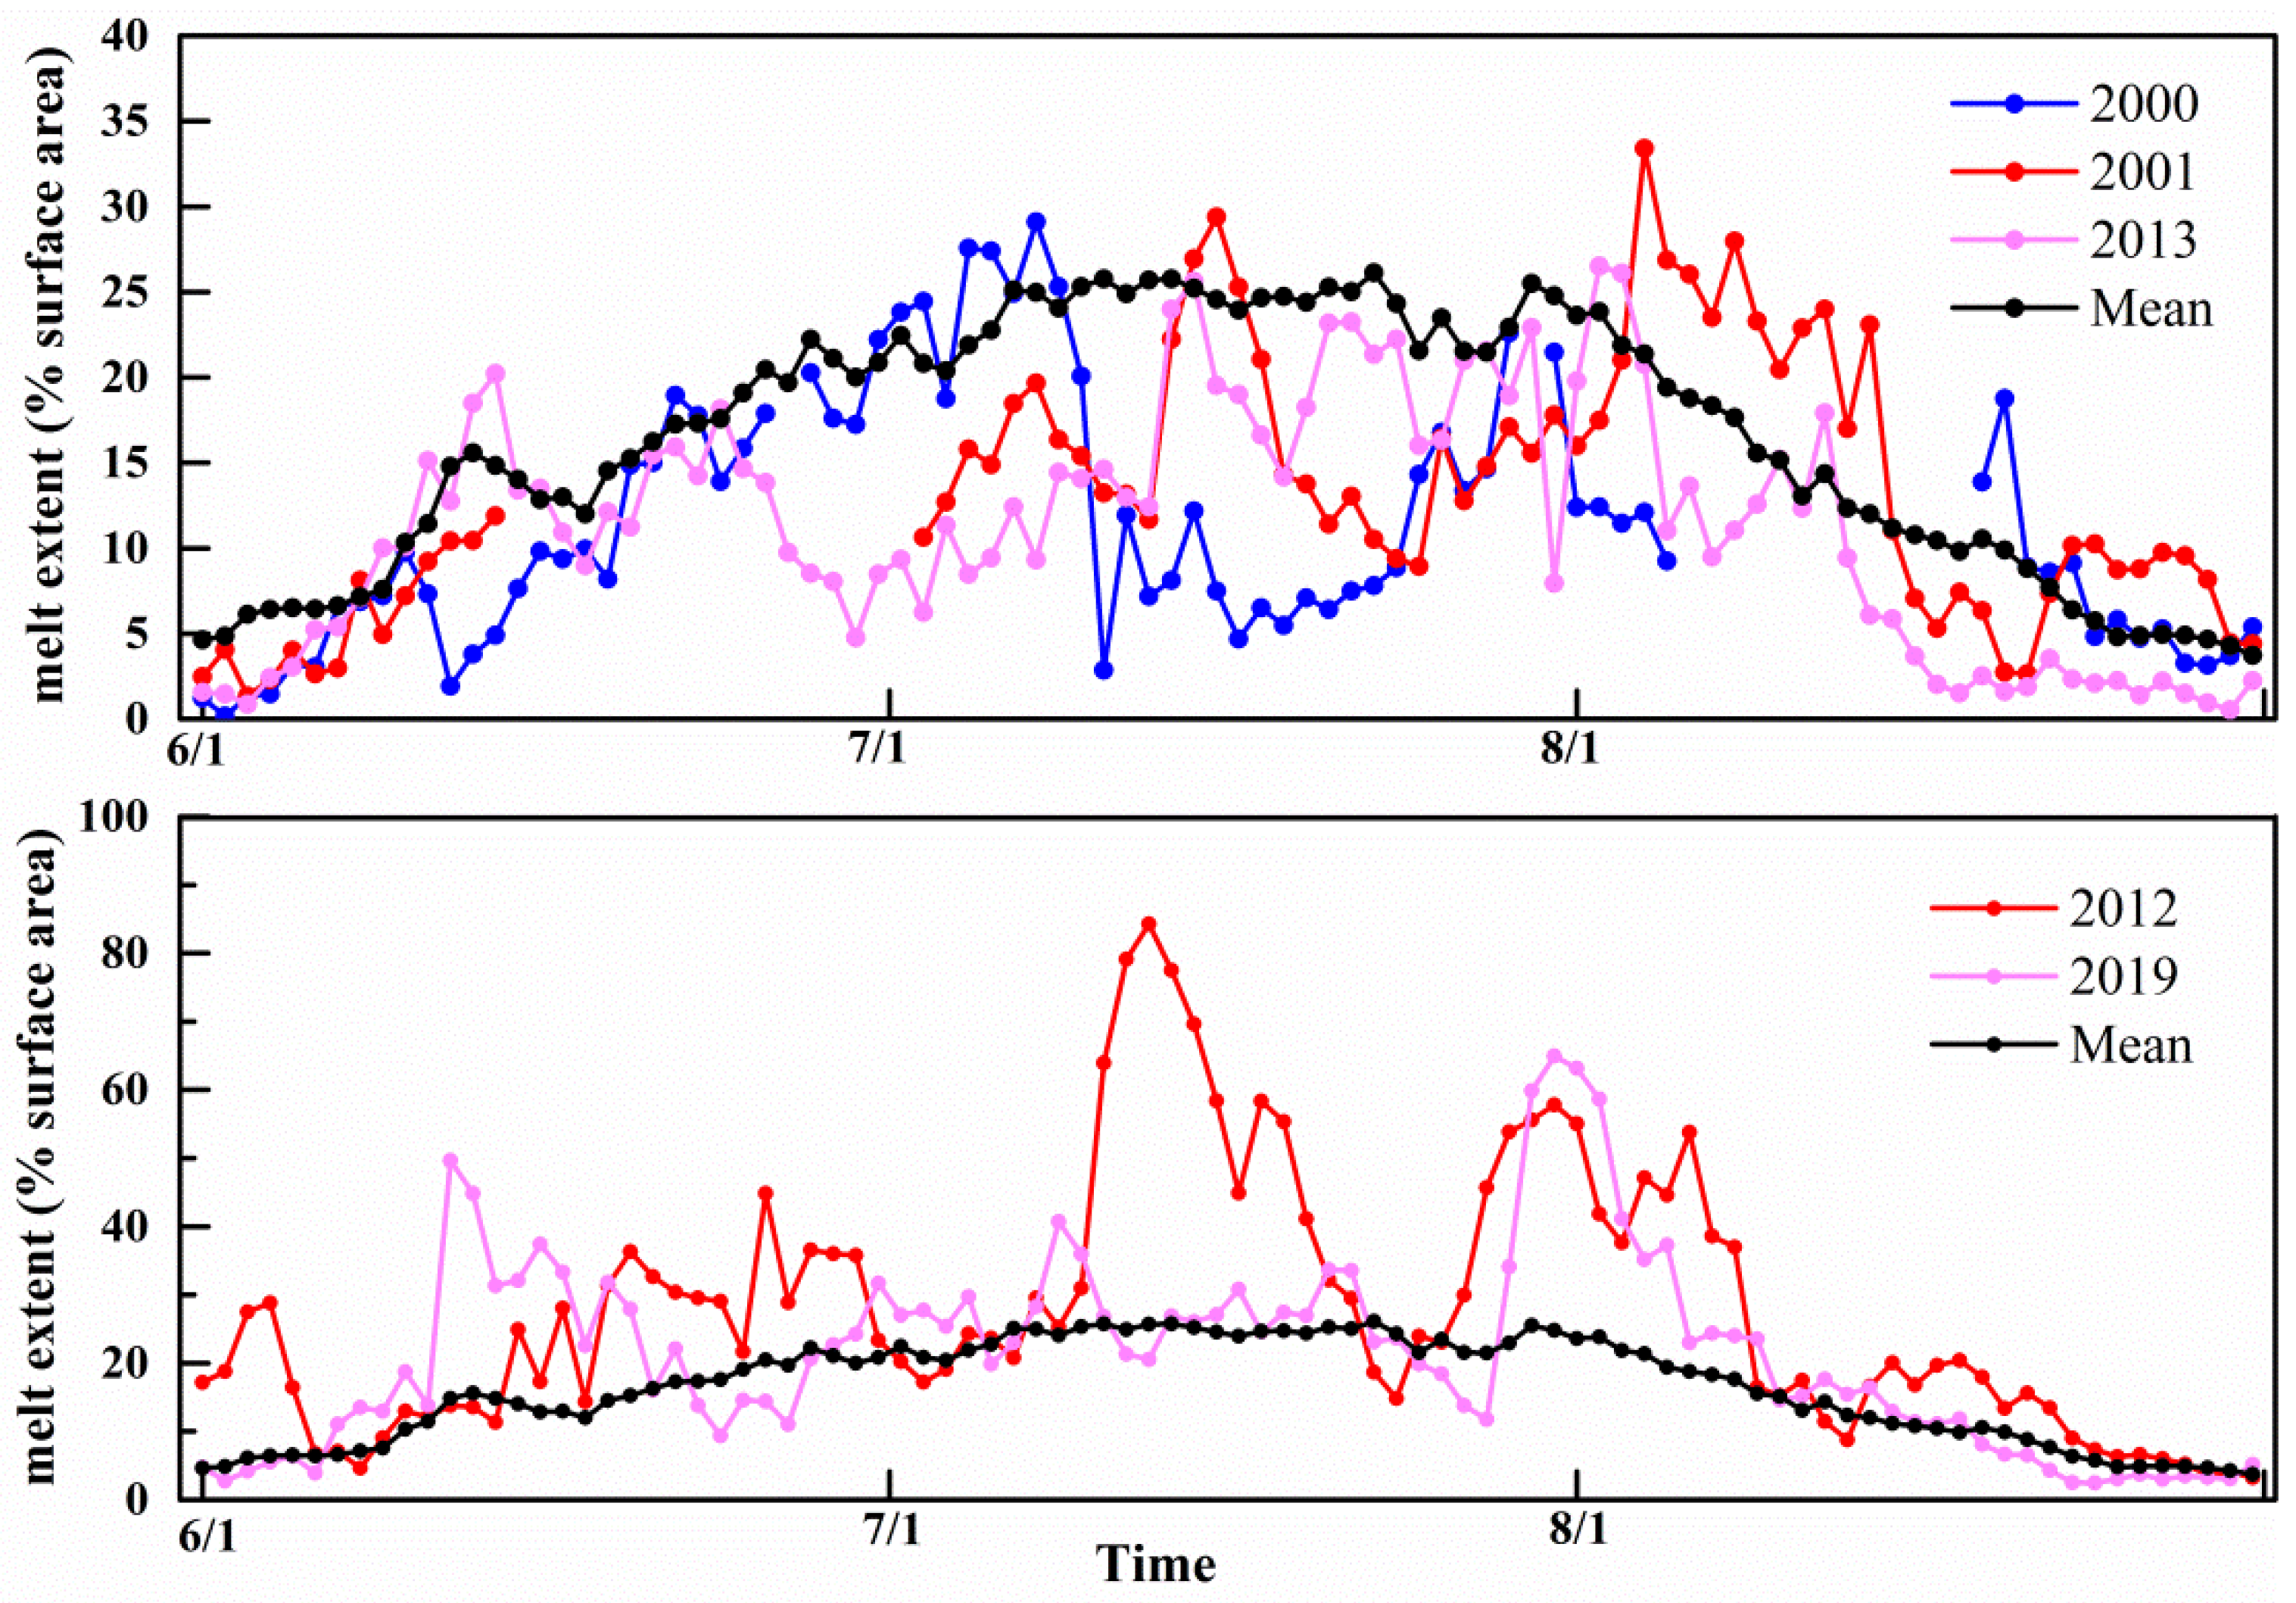
The summer surface temperature and melting extent of the GrIS have important effects on its mass balance; we have mapped the daily surface melting extent from 2000 to 2020, based on the MODIS daily LST (the ratio of the number of melt pixels multiplied by the total number of pixels over the GrIS. Percentage is calculated with respect to total number of pixels with LST observations for each date). In terms of daily melting, the summers of 2012 and 2019 experienced relatively intense melting with higher LST, while the cooler summers of 2000, 2001 and 2013 experienced less melting. As shown in Figure 5, 2012 was the most severe year for melting, with the maximum melting occurring between 12 July and 14 July. During these three days, an average of 74.9% of the ice sheet’s surface melted, compared with an average of 25.5% from 2000 to 2020. In 2019, the most severe melting occurred between 30 July and 2 August, the first time since 11 July 2012 that melting was detected at the highest point of the GrIS (Summit Station) [20]. For years with less melting, all dates showed less than the 2000–2020 average except for 4–14 August 2001. At the same time, the melting was stronger in July than in June and August, which was also due to the higher LST in July.
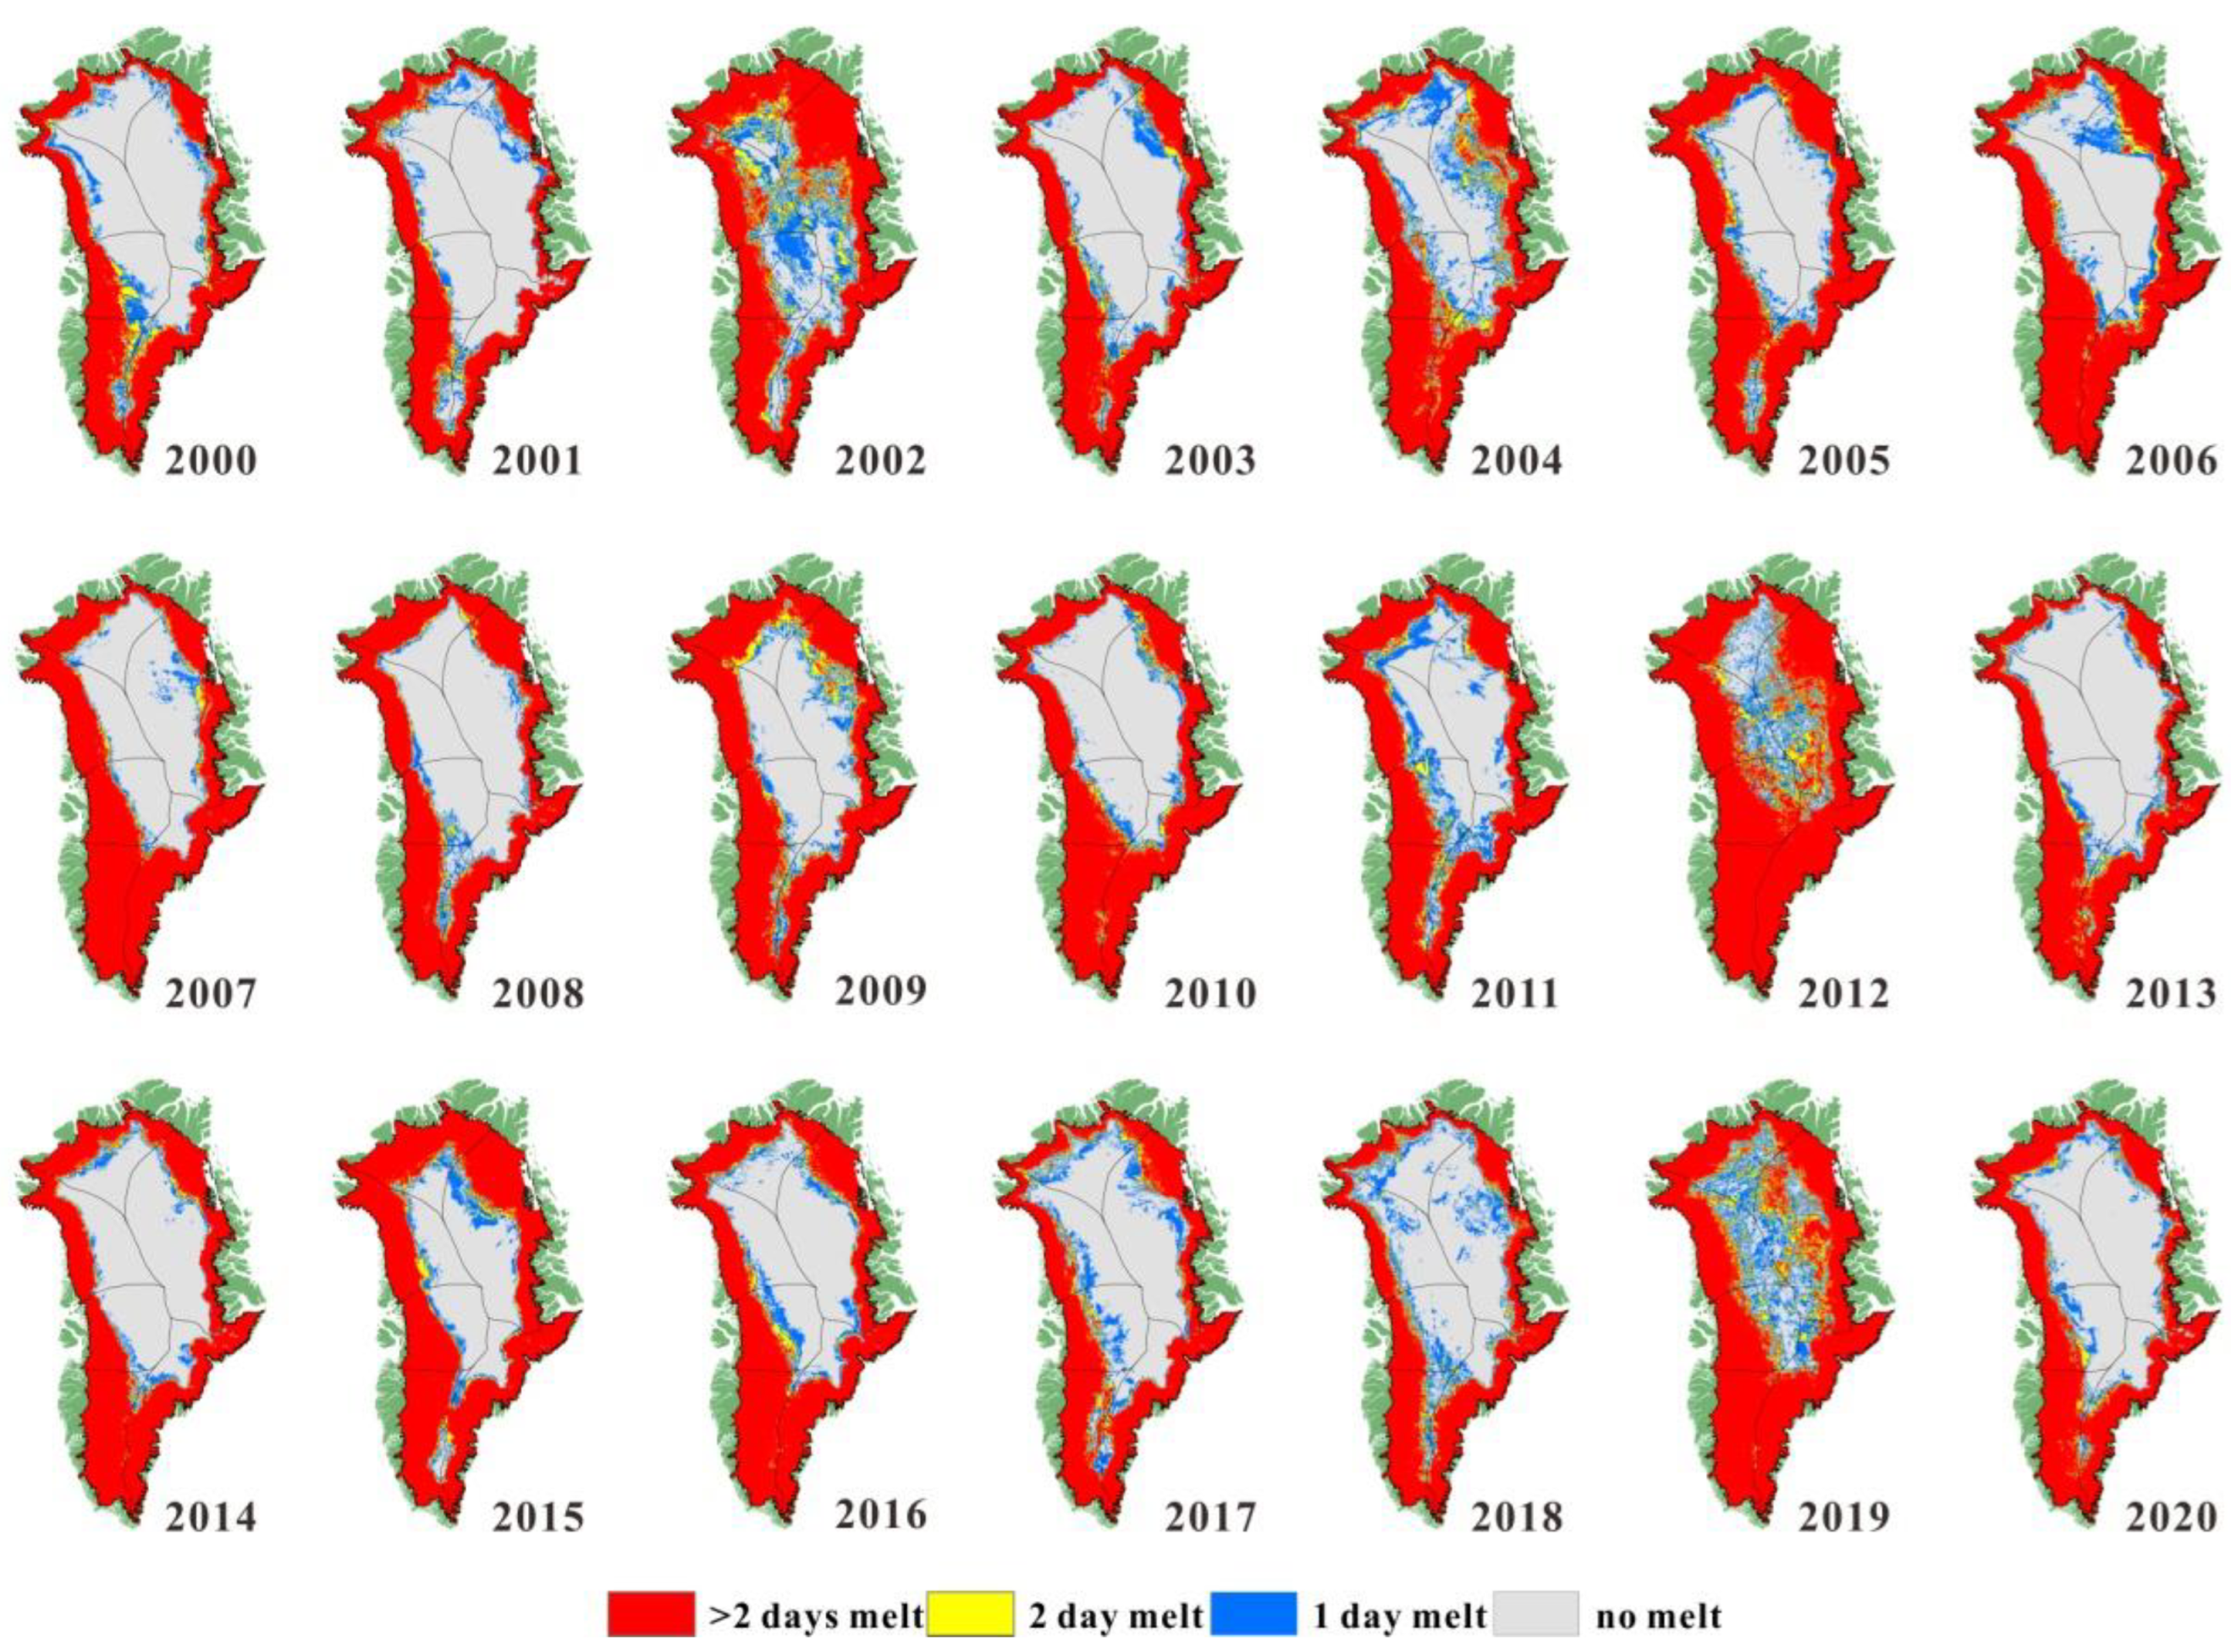
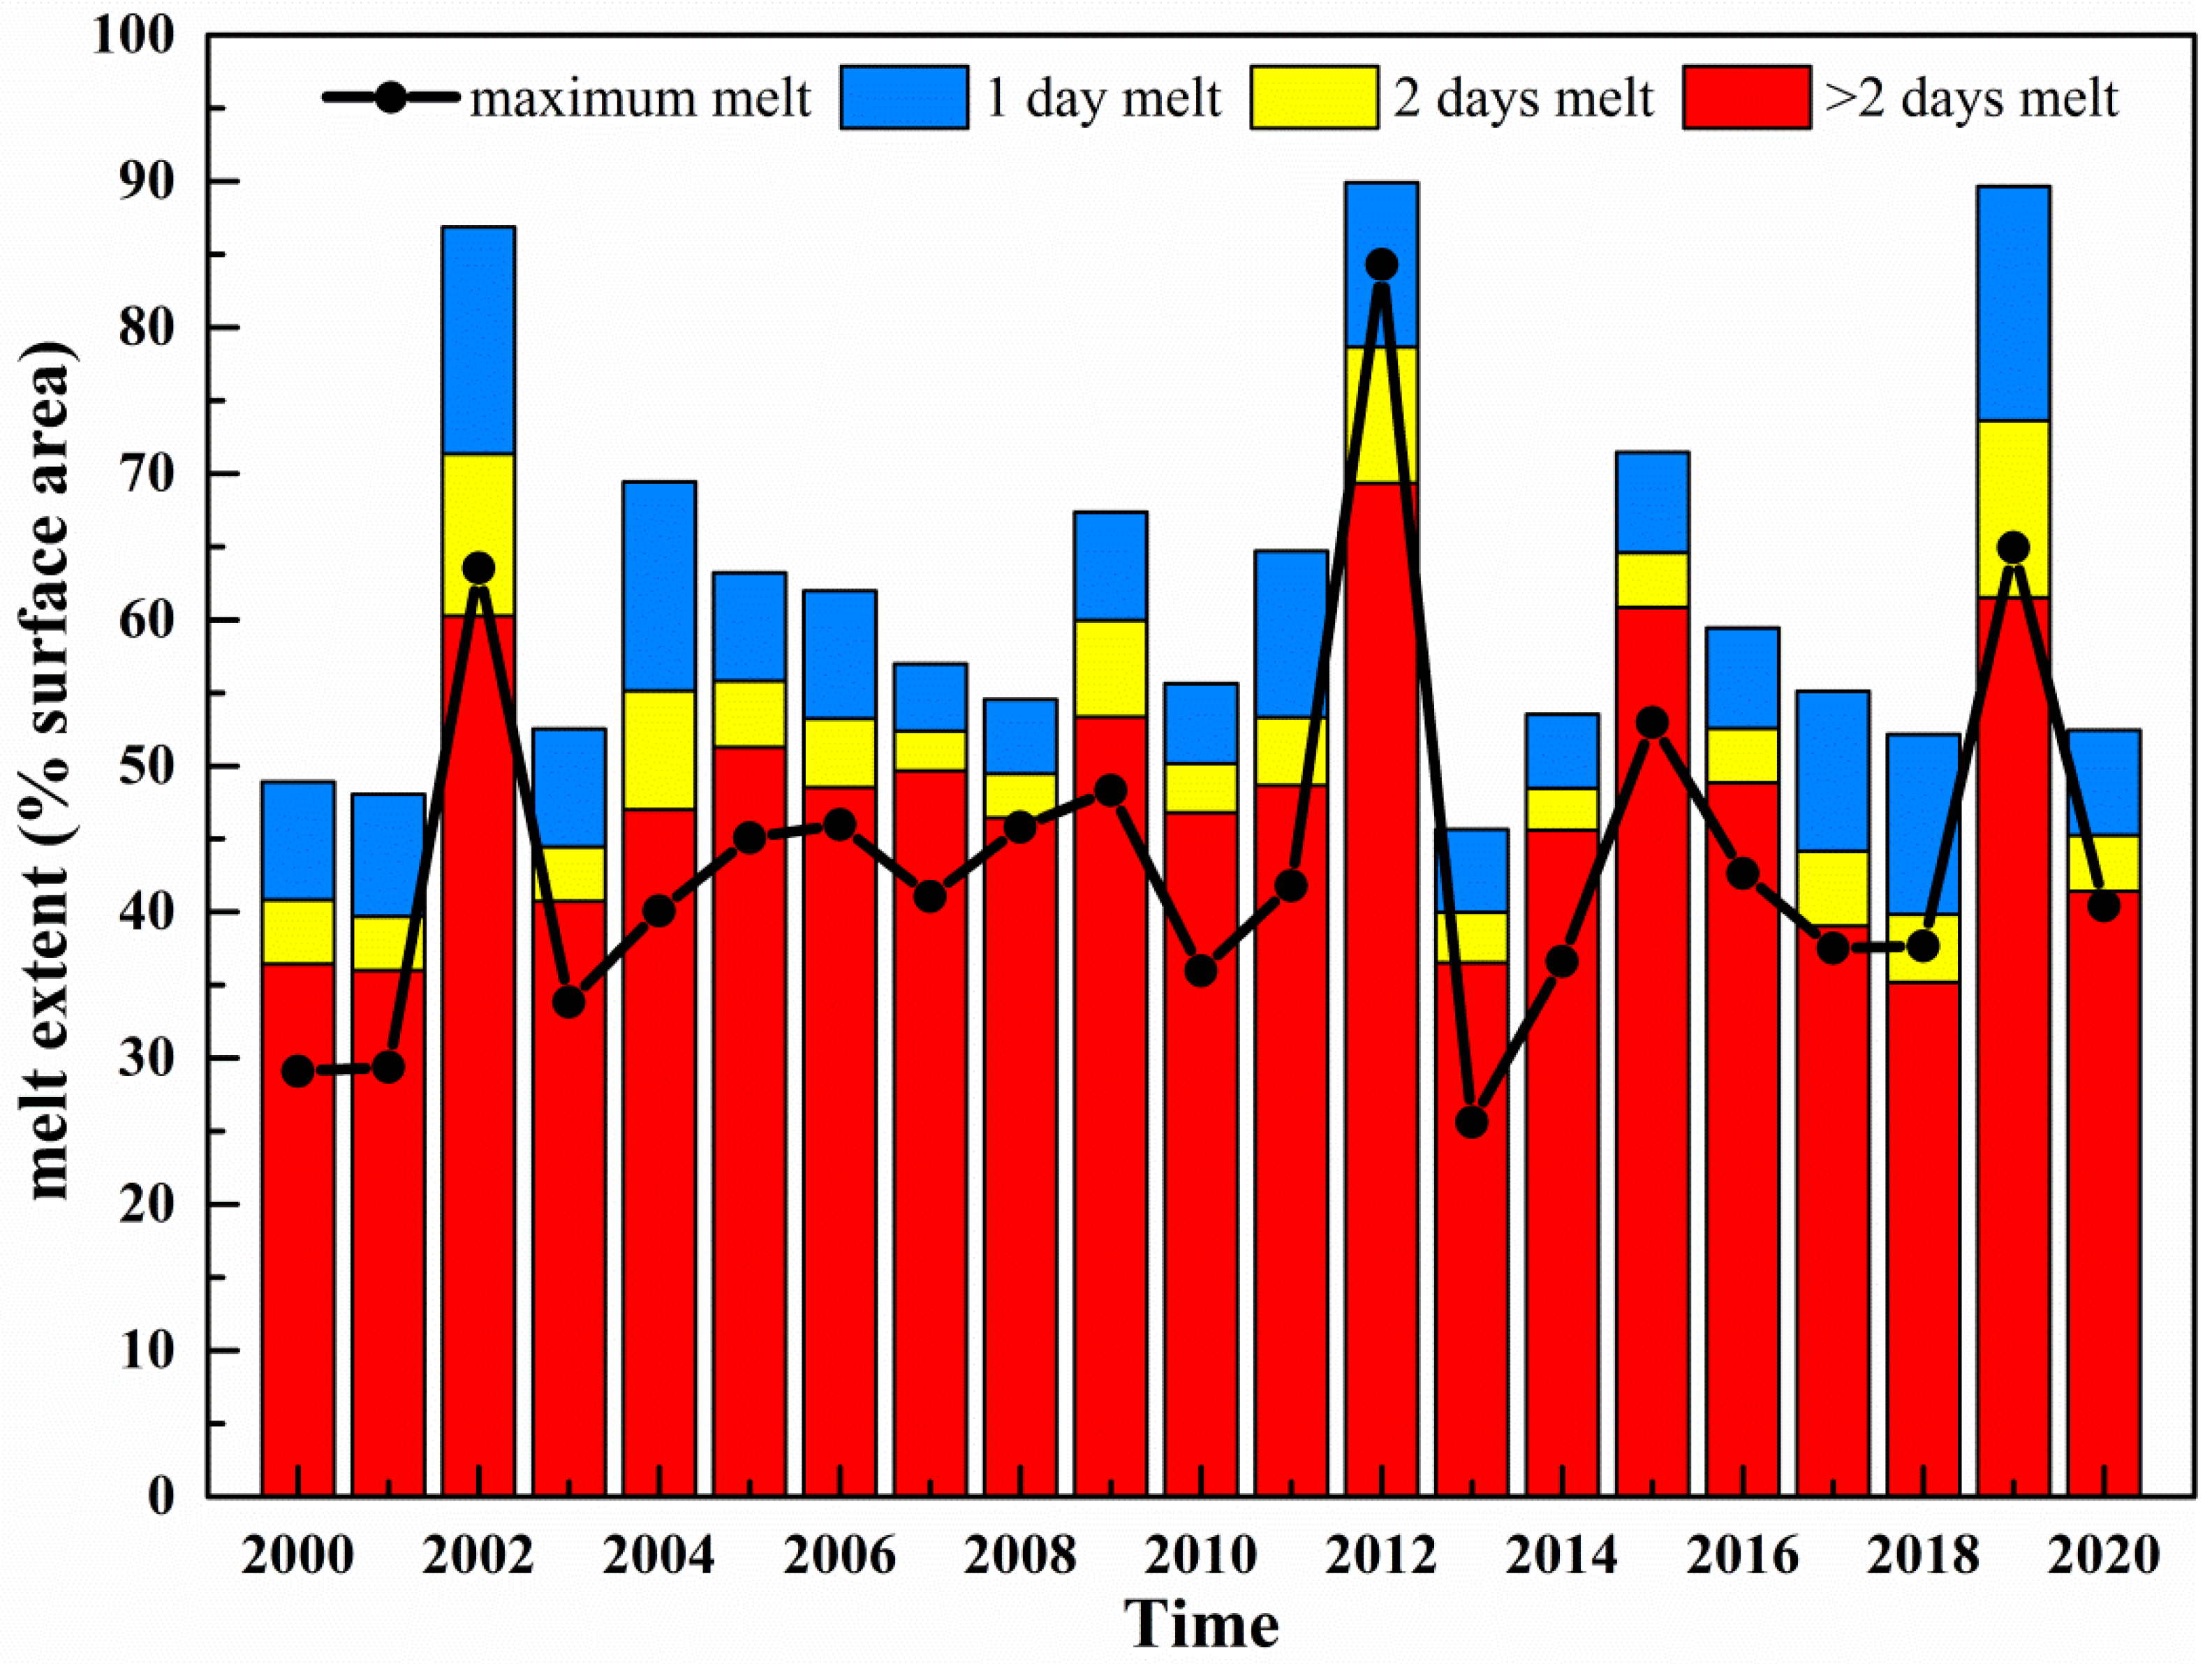
Cumulative melting, the maximum and short period of the melting extent, are shown in Figure 6 during 2000–2020 summer. Map of annual melting extent derived from MODIS LST record are shown in Figure 6. As shown in the figure, the cumulative melting extent of the GrIS experienced over 80% melting in the summer of 2002, 2012 and 2019, with 86.9%, 89.9% and 89.7%, of the area experiencing melting, respectively. From Figure 7, however, compared with 2012, the area of short period of melting in 2002 and 2019 is larger, accounting for 30.6% and 31.4%, of the cumulative melting extent respectively. In 2012, it is only 22.9%. The fact that a short period of melting was more common in 2002 and 2019 (especially one-day melts) than in 2012, and that the maximum melt extent in 2012 was much higher than in 2002 and 2019, suggests that the surface melting of the GrIS in the summer of 2012 was more sustained and severe than in 2002 and 2019. The unusual warmth and extreme melting in July 2012 was caused by a combination of reduced albedo and high Greenland blocking [53,54,55]; the atmospheric conditions of the anticyclone south of the ice sheet caused advection in a relatively warm southwest stream, to the western side of the GrIS, resulting in a warmer and drier ice sheet.
Apparently, in the summers of 2002, 2012 and 2019, the GrIS experienced the most severe melting of the ice sheet. We then compared the surface melting of the ice sheet over the three years in detail, as shown in Figure 8. Positive (negative) day anomaly indicates longer (shorter) melt times than the 2000–2020 mean. Apparently, 2012 was the year with the largest positively anomaly; the entire southern part of the ice sheet had at least 15 more days with melt, and in some areas by more than 20 days. Although the cumulative melting extent in the summer of 2002 was 86.9%, melting was below average in the SW and SE near the coast, with some areas by more than 10 days. In the interior of the ice sheet, there was no significant difference between the summer in 2002, 2012 and 2019, while there was significant difference in the southern region and the western region near the coast. The summer melt experienced in the southern region in 2012 was more than 20 days longer than in 2002 and 10 days longer than in 2019. In the Northwest of the ice sheet, summer melt was also 15 days longer in 2012 than in 2002, and 5–15 days shorter than in 2019. Thus, both 2012 and 2019 were more severe than 2002 in terms of duration and intensity of the melt. Likewise, 2019 as a whole did not reach the level of the melt in 2012.

3.3. Correlation between Changes in Summer LST and MB in the GrIS

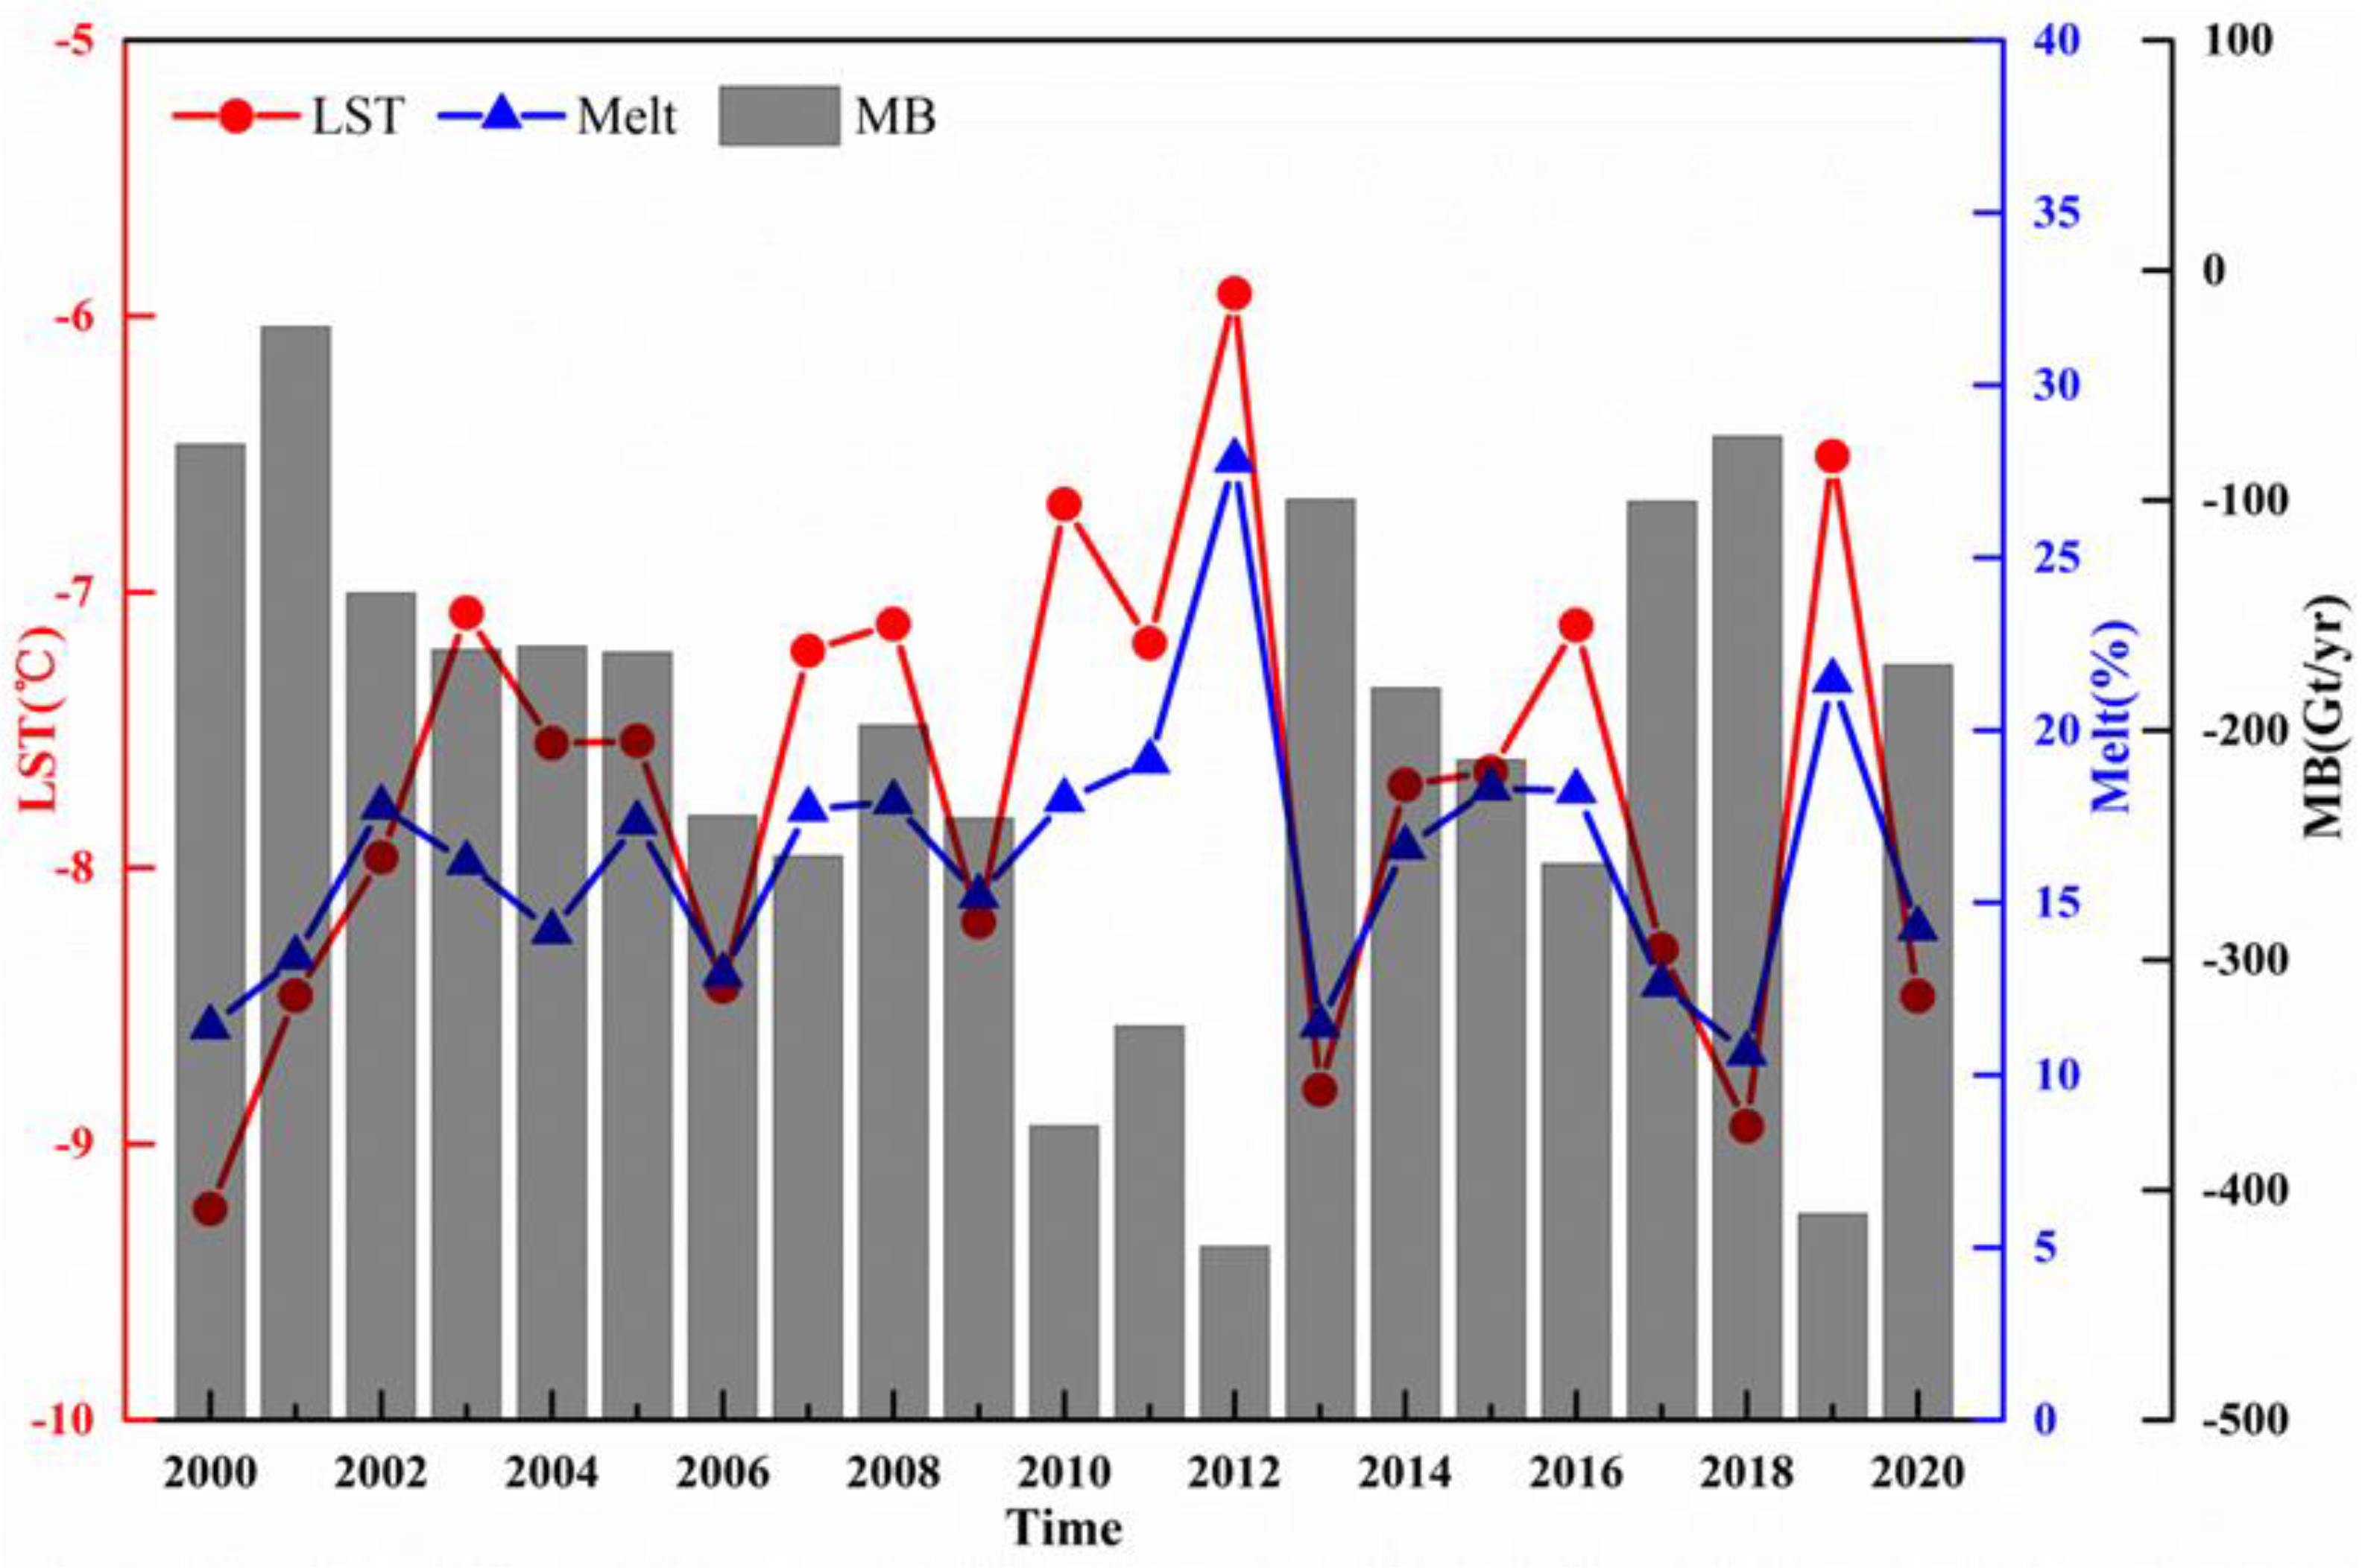
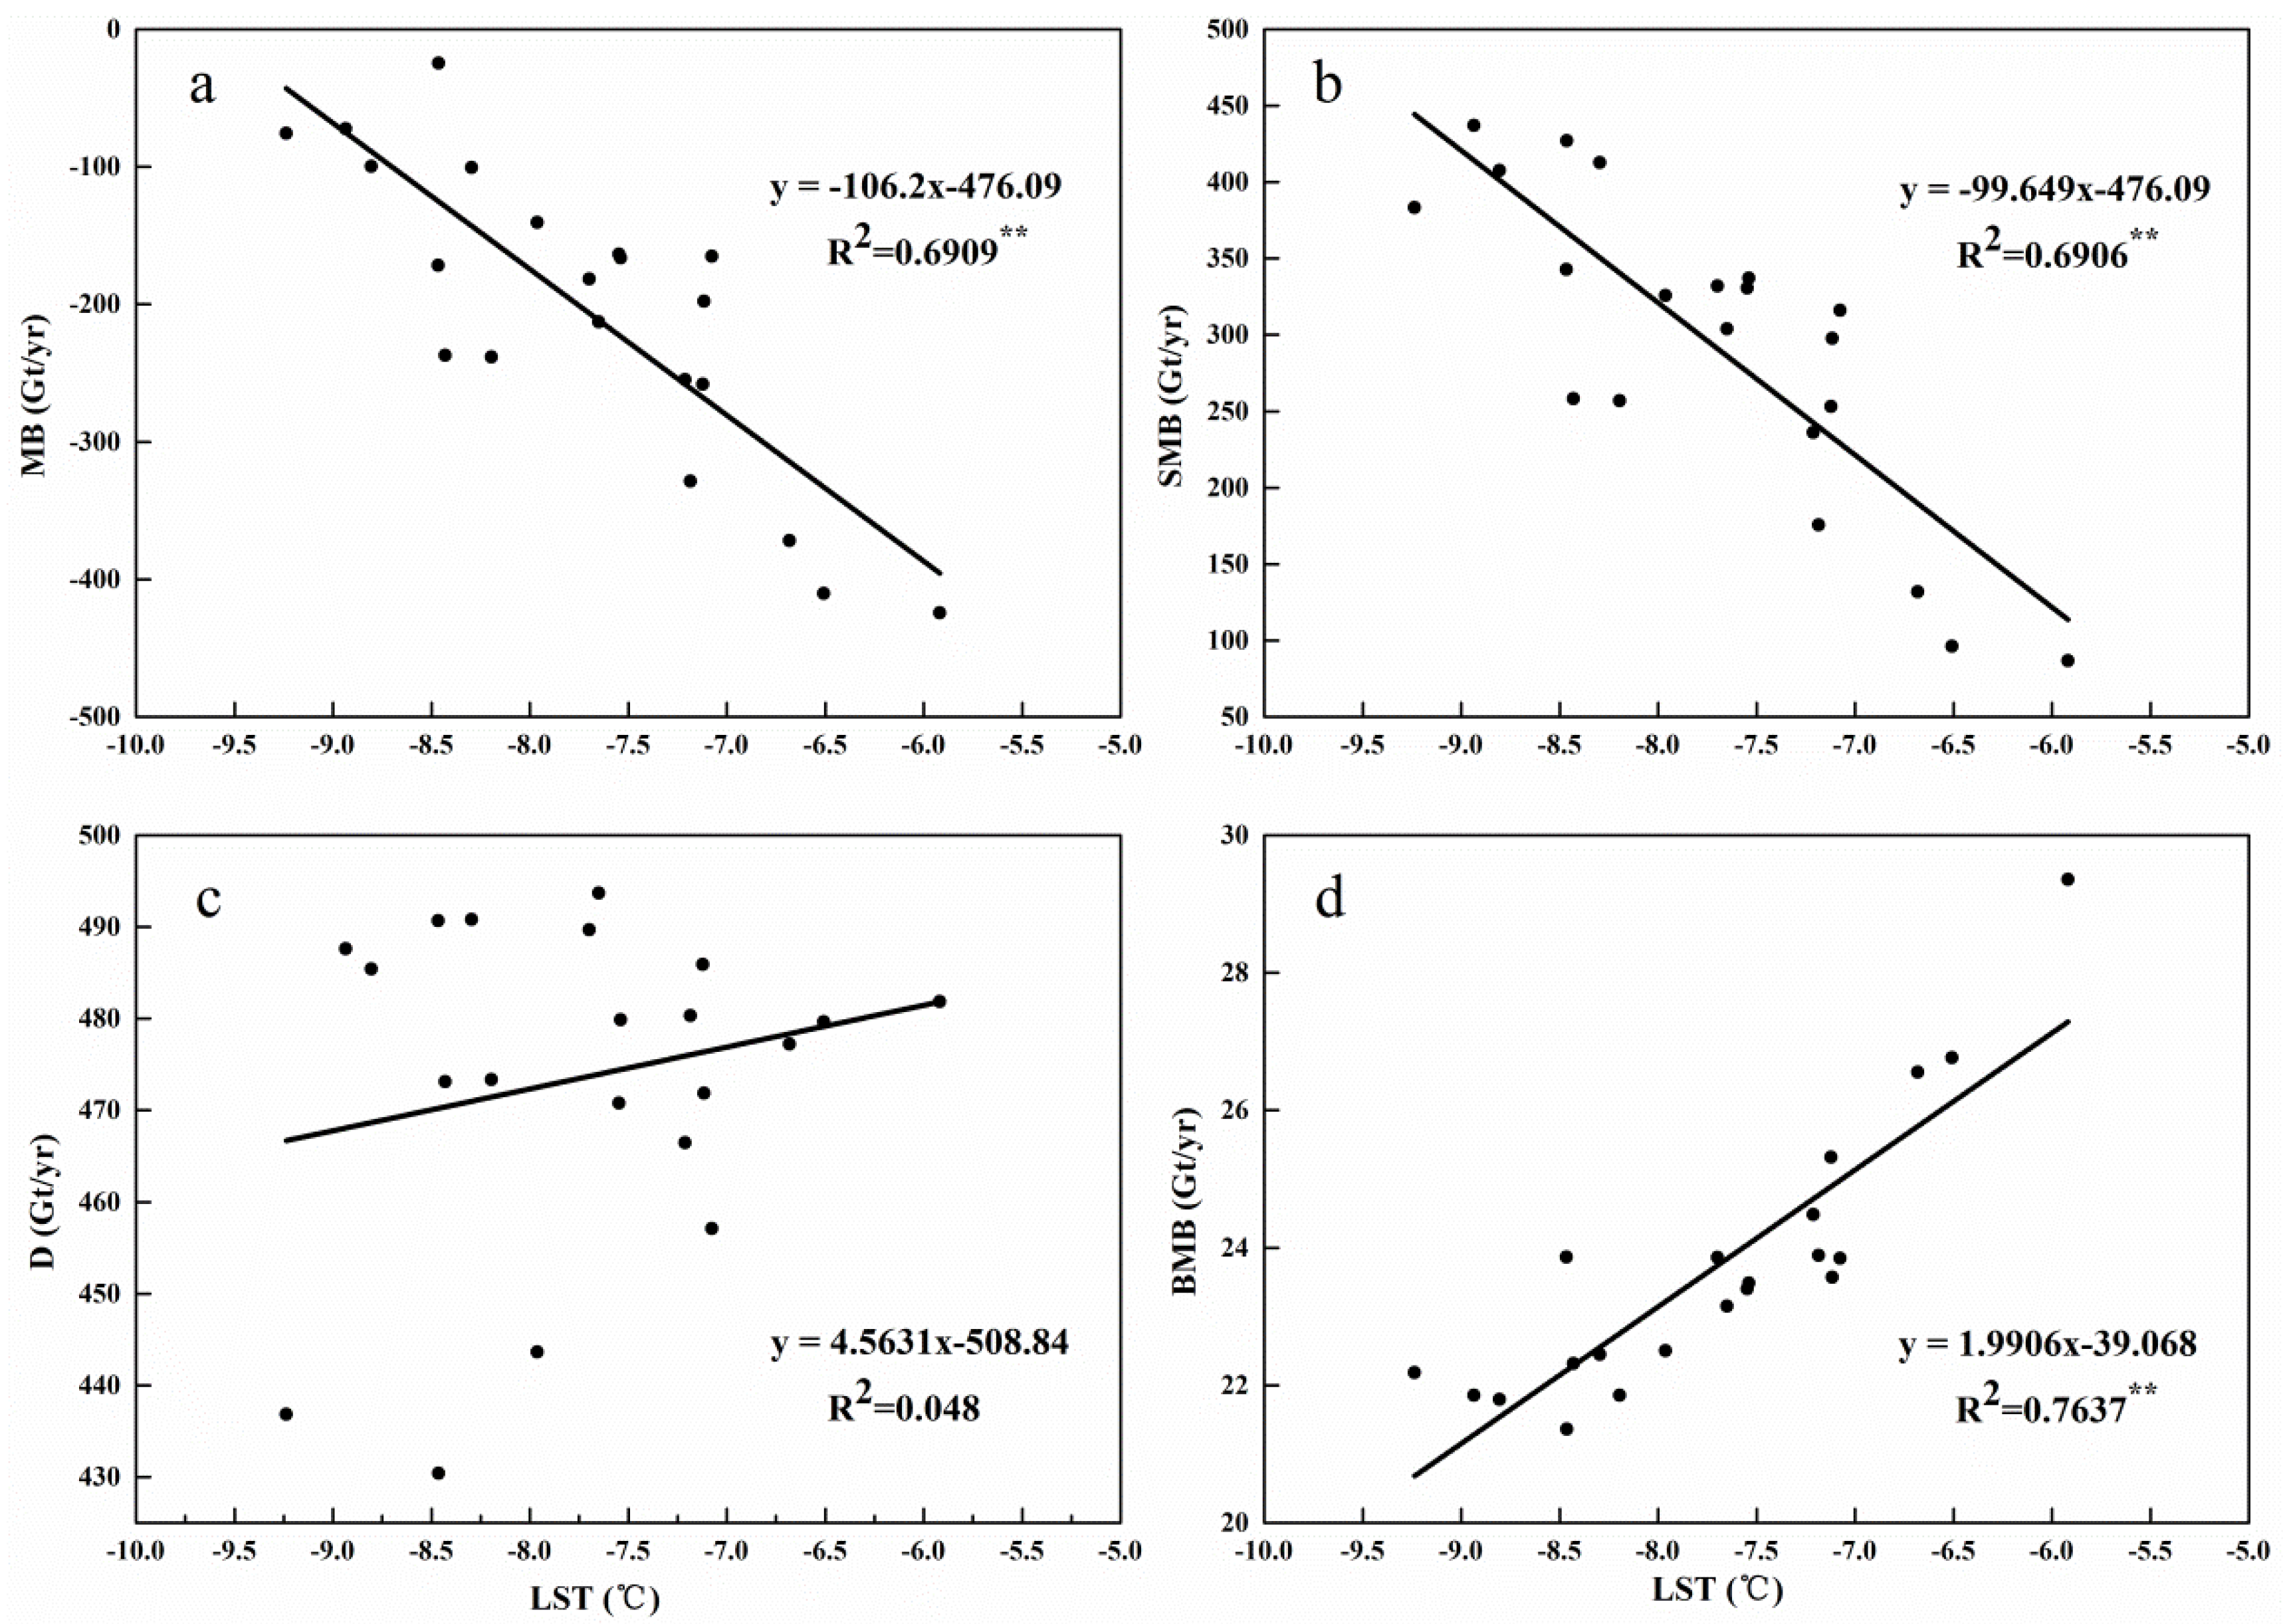
Although there are many factors affecting the mass balance of the Greenland ice sheet, such as air temperature, precipitation, topographic conditions and surface moraines, climate factors (temperature and precipitation) are the key factors affecting the mass balance. The time series of mean LST, melting extent and MB of the GrIS from 2000 to 2020 are shown in Figure 9. The results show that the LST has a good consistency with the melting extent, but both of them show a roughly opposite trend to the MB, that is, the higher the LST, the greater the melting extent, and the greater the mass loss. Based on the summer LST from 2000 to 2020, the impact of surface-temperature changes on the mass balance of the GrIS is evaluated, as shown in Figure 10. The surface temperature of the GrIS is significantly correlated with MB, SMB and BMB, but has no relative significant correlation with D. This may be because the influence of surface temperature on the SMB and BMB is relatively rapid, while D is affected by sea-surface temperature. Meanwhile, the linear fit results show that a 1 °C increased in the GrIS surface temperature equates to a 106.2 Gt/yr decrease in MB, which for this temperature change consists of a 99.65 Gt/yr decrease in SMB, and a 1.99 Gt/yr increase in BMB. It can be concluded that 93.83% (6.17%) of the ice sheet’s response to changing surface temperature has been via SMB (D and BMB), excluding other conditions such as precipitation changes. We also made a comparison of the ablation range and MB, and Figure 11 showed that the ablation range calculated based on LST was also a good indicator of MB change. When the surface of the ice sheet melts, mass loss is initiated within a few days thereafter. When a relatively large surface melting occurs, it is usually accompanied by a large mass loss.

4. Discussion

4.1. Uncertainty in Analysis

With the increasingly mature development of satellite-remote-sensing technology, compared with traditional field observation, satellite remote sensing provides a more effective and convenient means for the study of polar ice-sheet change. In this paper, we study the spatiotemporal variation of surface temperature over the GrIS and construct the spatiotemporal distribution of surface ablation; and the impact of these changes on mass balance is discussed. These findings could improve measurements and modeling of SMB of the GrIS. However, due to the defects of remote-sensing-satellite data and the limitations of data-processing methods, there are still some areas to be improved. Several factors may be key to future research. Although this study is validated with data from the PROMICE site, the PROMICE site is mainly distributed in the ice-sheet-ablation area, and the performance of MODIS LST for the inland ice sheet is unknown, so that further evaluation is needed. Recent studies [56,57,58] have also shown that there is a significant difference between MODIS and PROMIC LST at lower temperatures, lower latent-heat fluxes and higher specific humidity. Meanwhile, the MODIS LST product averages data over a 1 by 1 km area, while the PROMICE in situ AMSs collect data from an area on the scale of a meter. This will also lead to a certain error between the MODIS LST and the PROMICE in situ skin temperature. Although these differences will lead to some inherent differences between PROMICE and MODIS LST, Zikan et al. [56] do not anticipate that this introduces systematic bias.
At the same time, the cloud blockage in the MODIS LST data set limits its application, as the existing MODIS cloud-detection algorithm cannot identify all types of clouds. The research shows that there was a large proportion of undetected cloud pollution in MODIS products (about 15%) [59]. When the ground object photographed by the satellite is blocked by the cloud, the temperature observed by the pixel does not represent the actual temperature of the surface object, but rather the temperature of the cloud top, which is usually smaller than the temperature of the actual surface [60]. In addition, it has been found that for the cloud-mask product of the MODIS product, the daytime cloud mask is more reliable than the night cloud mask [61], as the MODIS-night-LST product has significantly more undetected cloud grids than the daytime. We therefore selected daytime-MODIS-LST products that accurately reflect the ice-sheet surface temperature. For the MODIS LST product, Zhang et al. [62] found that high-quality data account for 50–70% of the total MODIS data, and that even with more stringent data-quality controls (for example, errors greater than 1 K are excluded), the MODIS LST product may still have errors introduced by cloud pollution. Nonetheless, data filtering is an indispensable step, which will make our analysis results closer to the real situation. Removing cloud pollution is still a big challenge for the application of MODIS data to the GrIS. In the next step, it is considered to use other remote-sensing data or regional-climate-model data to help improve the accuracy, such as using ERA skin-temperature data to supplement the missing values of MODIS LST data.

4.2. Relation between the GrIS LST and Atmospheric Circulation

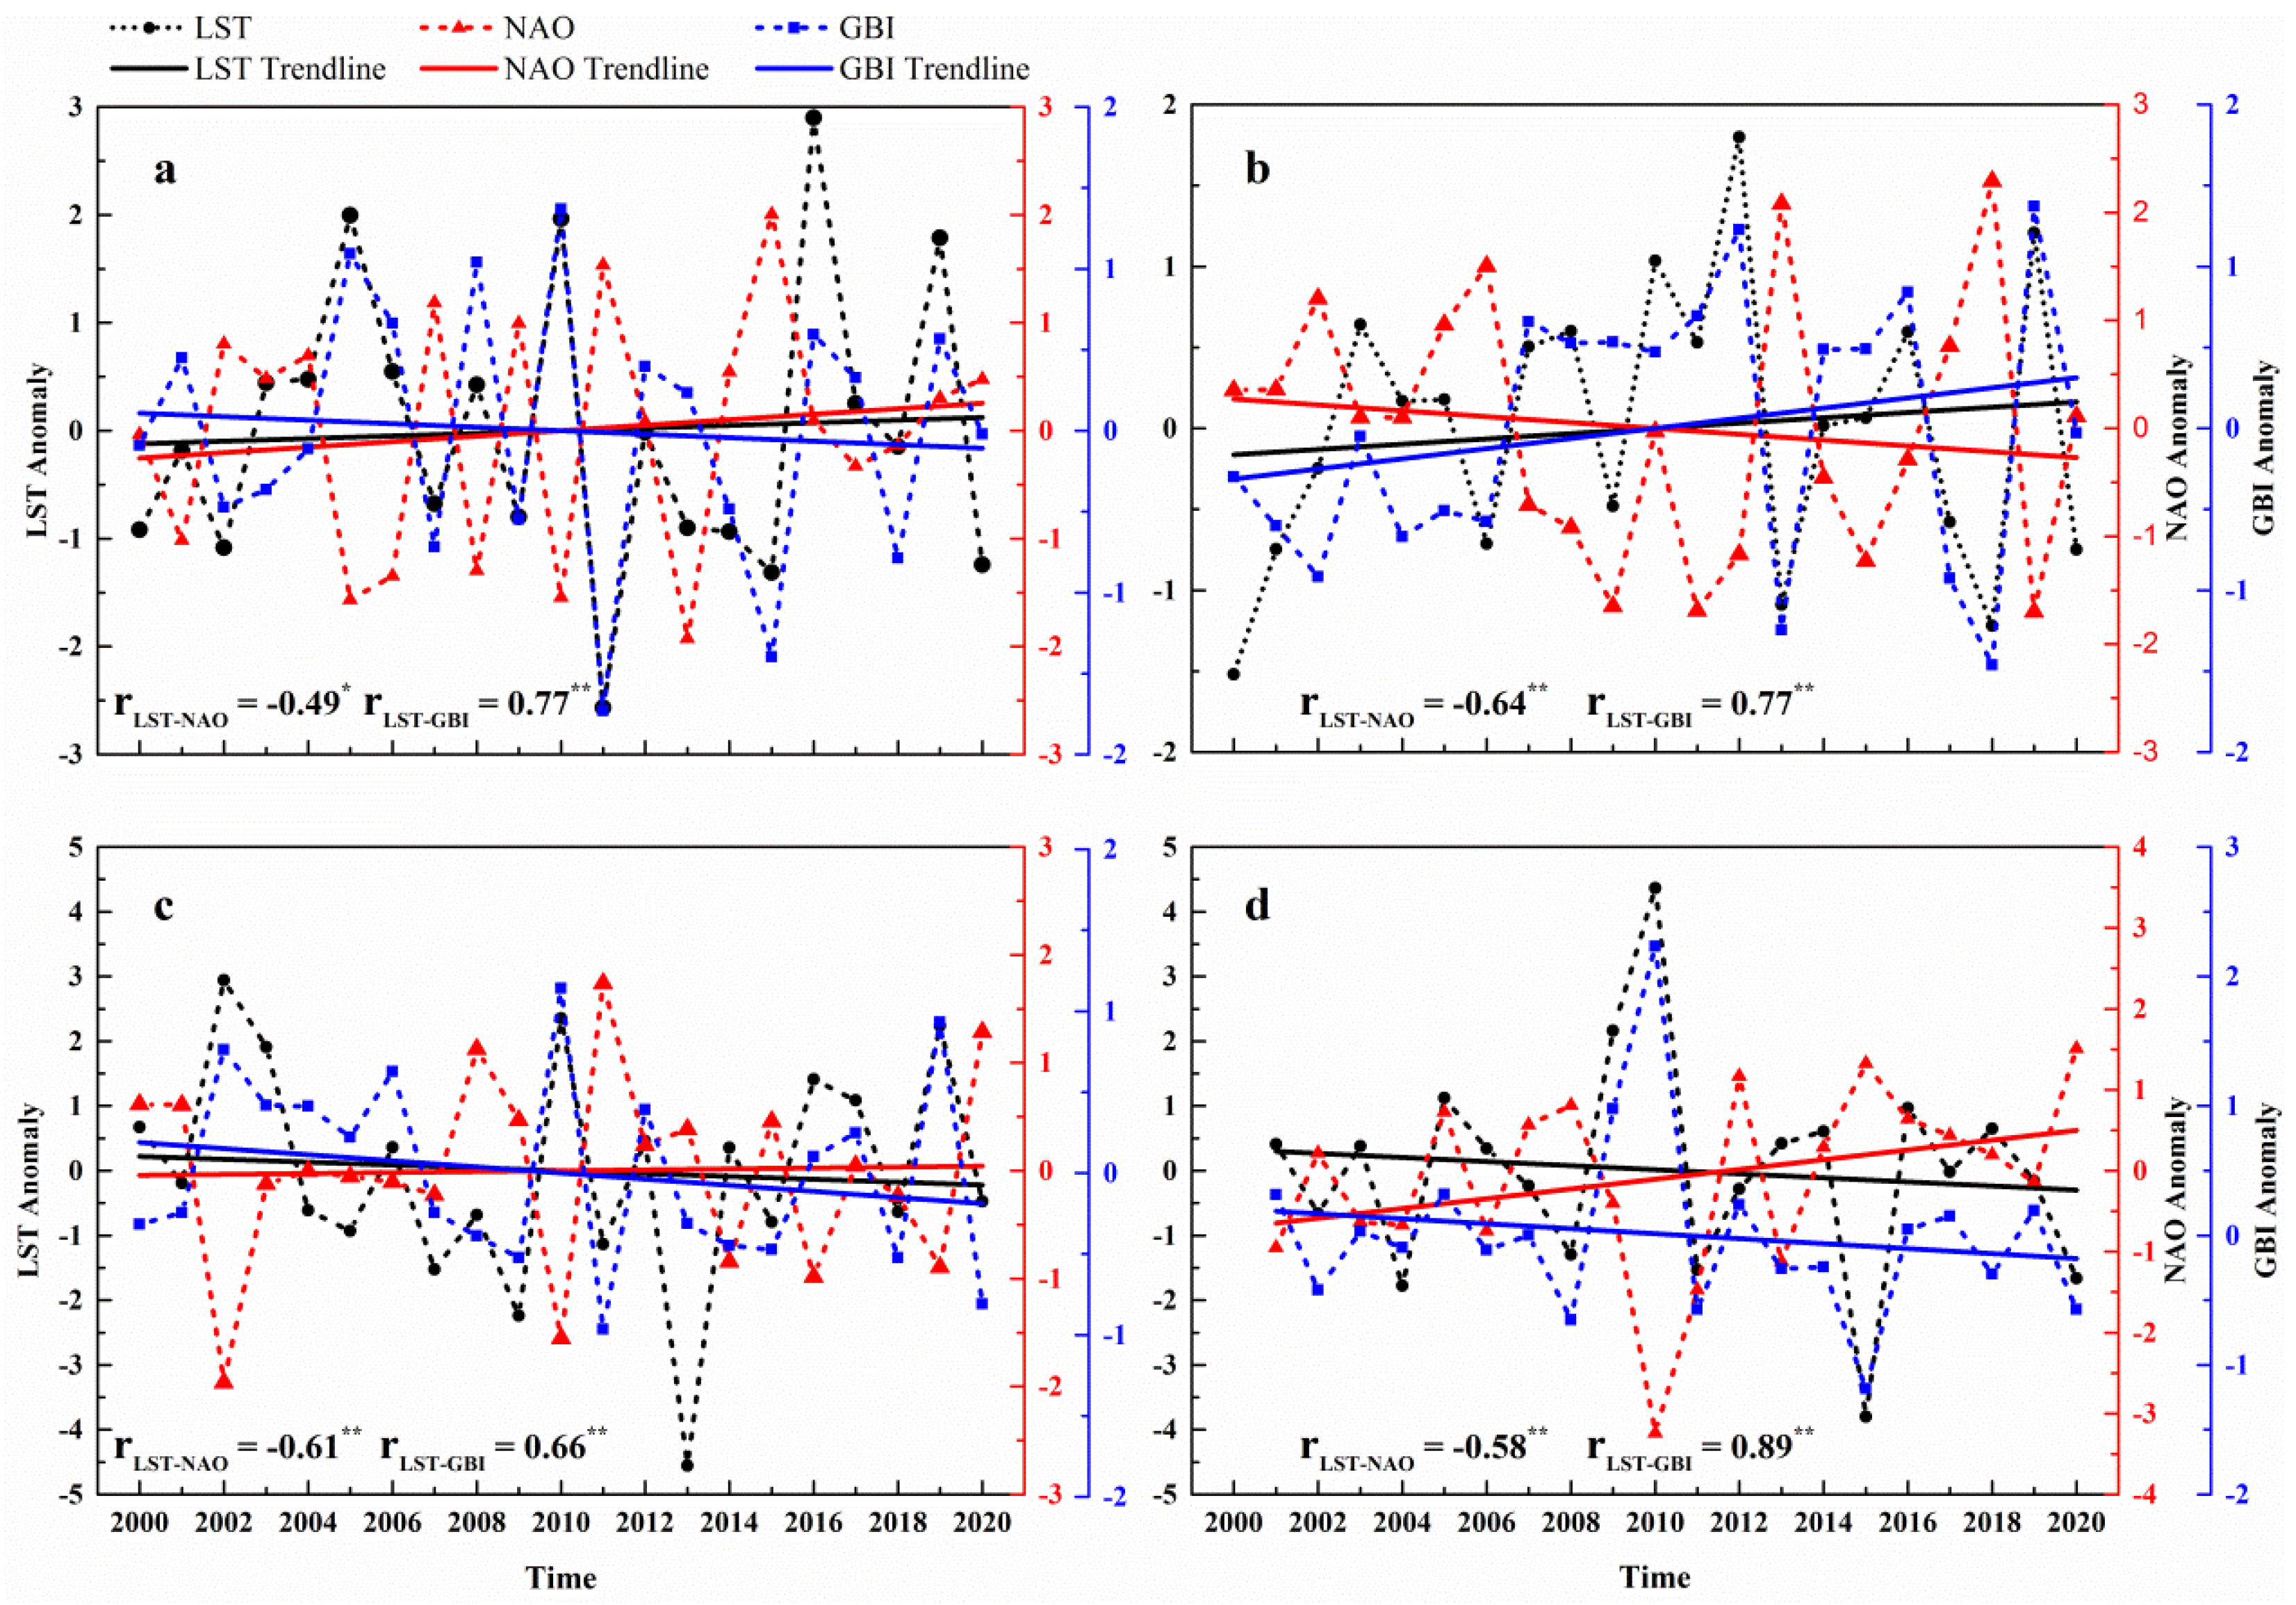
The GBI and NAO reflect the state of the general atmospheric circulation over the GrIS, and have an important impact on its climate. In order to analyze the relationship between the GrIS’s LST and the atmospheric circulation, we calculated the GBI and NAO indices for each season from 2000 to 2020. The GrIS LST, GBI and NAO time series are shown in Figure 12. It can be clearly seen that LST has a significant correlation with NAO and GBI. In general, for all seasons the GrIS LST during 2000–2020 is positively correlated with GBI and negatively correlated with NAO, and correlations between seasonal series of the GrIS LST and GBI are all significant, and stronger than NAO correlations. At the same time, the correlation between GBI and LST is the strongest in winter and the weakest in autumn. On the contrary, the effect of NAO on LST is weakest in spring and strongest in summer. The unusually high summer temperatures of 2012 and 2019 also suggest that surface temperature in the GrIS has become more sensitive to variability in circulation in a background of a warming climate.

5. Conclusions

The GrIS surface temperature, especially in summer, largely determines the length and intensity of the melting season of the ice sheet, and affects its mass balance. Based on the MODIS LST, the temporal and spatial changes in annual and seasonal surface temperature from 2000 to 2020 are evaluated, the surface melting in summer is monitored, and the impact of these changes on mass balance is discussed. The results show that, during the study period, the mean annual LST is −24.86 ± 5.46 °C, with the highest, of −22.48 ± 5.61 °C, in 2010, and the lowest temperature of −26.49 ± 5.30 °C in 2015. With the change of seasons, the trend in ice-sheet surface temperature shows a great spatial difference. The warming is mainly in spring and summer, while the cooling is mainly in autumn and winter. Among the six regions, the NO showed the largest warming trend in different seasons, while the SW and SE showed an obvious decreasing trend. Both 2012 and 2019 experienced the warmest summers, with extreme melting on the surface of the ice sheet detected; although 2002 also experienced a more extensive year of melting, neither 2002 nor 2019 was as long or intense as 2012, and the maximum melt extent in the summer of 2012 was also far more than 2002 and 2019. There is a strong correlation between the GrIS surface temperature and its mass balance. By fitting the relationship between the surface temperature and mass balance, it is found that 93.83% (6.17%) of the ice sheet’s response to changing surface temperature has been via SMB (D and BMB), excluding other conditions such as precipitation changes. The linear-fit results show that a 1 °C increase in the GrIS surface temperature equates to a 106.2 Gt/yr decrease in MB, which for this temperature change consists of a 99.65 Gt/yr decrease in SMB, and a 1.99 Gt/yr increase in BMB. Meanwhile, LST has a significant correlation with NAO and GBI, is negatively correlated with NAO, and positively correlated with GBI. In the absence of in situ data, the MODIS LST provides an effective data source for us to understand the GrIS surface processes, although errors are unavoidable during data acquisition and processing.

Author Contributions

Conceptualization, N.W.; data curation, Z.F.; formal analysis, Y.W. and Y.Z.; funding acquisition, N.W.; project administration, N.W.; resources, Z.F.; supervision, Y.W.; validation, Z.F. and Y.W.; visualization, Z.F. and Y.W.; writing—original draft, Z.F.; writing—review and editing, Z.F., N.W., Y.W. and Y.Z. All authors have read and agreed to the published version of the manuscript.

Funding

This research was funded by the Strategic Priority Research Program of the Chinese Academy of Sciences (XDA19070302), the National Natural Science Foundation of China (41971088).

Data Availability Statement

All data and the script of the whole processes are available through an email request to the authors.

Acknowledgments

The authors would like to acknowledge the National Aeronautics and Space Administration (NASA) for providing MODIS MOD11A1 products; AMS data were acquired from the Programme for Monitoring the Greenland Ice Sheet (PROMICE), the mass-balance dataset from Mankoff et al. and atmospheric-circulations data from the U.S. National Oceanic and Atmospheric Administration.

Conflicts of Interest

The authors declare that they have no known competing financial interest or personal relationship that could have appeared to influence the work reported in this paper.

References

  1. Qin, D.; Ding, Y. Cryospheric changes and their impacts: Present, trends and key issues. Adv. Clim. Res. 2009, 5, 187–195. [Google Scholar] [CrossRef]
  2. Forsberg, R.; Sørensen, L.; Simonsen, S. Greenland and Antarctica Ice Sheet Mass Changes and Effects on Global Sea Level. In Integrative Study of the Mean Sea Level and Its Components; Springer: Cham, Switzerland, 2017; pp. 91–106. [Google Scholar] [CrossRef] [Green Version]
  3. Chylek, P.; Box, J.E.; Lesins, G. Global warming and the Greenland ice sheet. Clim. Chang. 2004, 63, 201–221. [Google Scholar] [CrossRef]
  4. Moros, M.; Emeis, K.; Risebrobakken, B.; Snowball, I.; Kuijpers, A.; McManus, J.; Jansen, E. Sea surface temperatures and ice rafting in the Holocene North Atlantic: Climate influences on northern Europe and Greenland. Quat. Sci. Rev. 2004, 23, 2113–2126. [Google Scholar] [CrossRef]
  5. Zwally, H.J.; Giovinetto, M.B.; Li, J.; Cornejo, H.G.; Beckley, M.A.; Brenner, A.C.; Saba, J.L.; Yi, D. Mass changes of the Greenland and Antarctic ice sheets and shelves and contributions to sea-level rise: 1992–2002. J. Glaciol. 2005, 51, 509–527. [Google Scholar] [CrossRef] [Green Version]
  6. Bamber, J.L.; Aspinall, W.P. An expert judgement assessment of future sea level rise from the ice sheets. Nat. Clim. Chang. 2013, 3, 424–427. [Google Scholar] [CrossRef]
  7. Lythe, M.B.; Vaughan, D.G. BEDMAP: A NewIce Thickness and Subglacial Topographic Model of Antarctica. J. Geophys. Res. Solid Earth 2001, 106, 11335–11351. [Google Scholar] [CrossRef] [Green Version]
  8. Rowley, R.J.; Kostelnick, J.C.; Braaten, D.; Li, X.; Meisel, J. Risk of rising sea level to population and land area. Eos 2007, 88, 105–107. [Google Scholar] [CrossRef]
  9. Stroeve, J.C.; Serreze, M.C.; Holland, M.M.; Kay, J.E.; Malanik, J.; Barrett, A.P. The Arctic’s rapidly shrinking sea ice cover: A research synthesis. Clim. Chang. 2011, 110, 1005–1027. [Google Scholar] [CrossRef] [Green Version]
  10. Rignot, E.; Box, J.E.; Burgess, E.; Hanna, E. Mass balance of the Greenland ice sheet from 1958 to 2007. Geophys. Res. Lett. 2008, 35. [Google Scholar] [CrossRef] [Green Version]
  11. Mouginot, J.; Rignot, E.; Bjørk, A.A.; Broeke, M.V.D.; Millan, R.; Morlighem, M.; Noël, B.; Scheuchl, B.; Wood, M. Forty-six years of Greenland Ice Sheet mass balance from 1972 to 2018. Proc. Natl. Acad. Sci. USA 2019, 116, 9239–9244. [Google Scholar] [CrossRef] [Green Version]
  12. Abdalati, W.; Steffen, K. Greenland ice sheet melt extent: 1979–1999. J. Geophys. Res. Atmos. 2001, 106, 33983–33988. [Google Scholar] [CrossRef]
  13. Steffen, K.; Nghiem, S.V.; Huff, R.; Neumann, G. The melt anomaly of 2002 on the Greenland Ice Sheet from active and passive microwave satellite observations. Geophys. Res. Lett. 2004, 31. [Google Scholar] [CrossRef]
  14. Zwally, H.J.; Li, J.; Brenner, A.C.; Beckley, M.; Cornejo, H.G.; DiMarzio, J.; Giovinetto, M.B.; Neumann, T.A.; Robbins, J.; Saba, J.L.; et al. Greenland ice sheet mass balance: Distribution of increased mass loss with climate warming; 2003–07 versus 1992–2002. J. Glaciol. 2011, 57, 88–102. [Google Scholar] [CrossRef] [Green Version]
  15. Mote, T.L. Greenland surface melt trends 1973–2007: Evidence of a large increase in 2007. Geophys. Res. Lett. 2007, 34. [Google Scholar] [CrossRef]
  16. Fettweis, X.; Mabille, G.; Erpicum, M.; Nicolay, S.; Broeke, M.V.D. The 1958–2009 Greenland ice sheet surface melt and the mid-tropospheric atmospheric circulation. Clim. Dyn. 2010, 36, 139–159. [Google Scholar] [CrossRef] [Green Version]
  17. Hanna, E.; Huybrechts, P.; Steffen, K.; Cappelen, J.; Huff, R.; Shuman, C.; Irvine-Fynn, T.; Wise, S.; Griffiths, M. Increased Runoff from Melt from the Greenland Ice Sheet: A Response to Global Warming. J. Clim. 2008, 21, 331–341. [Google Scholar] [CrossRef] [Green Version]
  18. Nghiem, S.V.; Hall, D.K.; Mote, T.L.; Tedesco, M.; Albert, M.R.; Keegan, K.; Shuman, C.A.; DiGirolamo, N.E.; Neumann, G. The extreme melt across the Greenland ice sheet in 2012. Geophys. Res. Lett. 2012, 39, L20502. [Google Scholar] [CrossRef]
  19. Keegan, K.M.; Albert, M.R.; McConnell, J.R.; Baker, I. Climate change and forest fires synergistically drive widespread melt events of the Greenland Ice Sheet. Proc. Natl. Acad. Sci. USA 2014, 111, 7964–7967. [Google Scholar] [CrossRef] [Green Version]
  20. Hanna, E.; Cappelen, J.; Fettweis, X.; Mernild, S.H.; Mote, T.L.; Mottram, R.; Steffen, K.; Ballinger, T.J.; Hall, R.J. Greenland surface air temperature changes from 1981 to 2019 and implications for ice-sheet melt and mass-balance change. Int. J. Clim. 2020, 41, E1336–E1352. [Google Scholar] [CrossRef]
  21. Tedesco, M.; Fettweis, X. Unprecedented atmospheric conditions (1948–2019) drive the 2019 exceptional melting season over the Greenland ice sheet. Cryosphere 2020, 14, 1209–1223. [Google Scholar] [CrossRef] [Green Version]
  22. Joshi, M.; Merry, C.J.; Jezek, K.C.; Bolzan, J.F. An edge detection technique to estimate melt duration, season and melt extent on the Greenland Ice Sheet using Passive Microwave Data. Geophys. Res. Lett. 2001, 28, 3497–3500. [Google Scholar] [CrossRef] [Green Version]
  23. Hall, D.K.; Williams, R.S.; Casey, K.A.; DiGirolamo, N.E.; Wan, Z. Satellite-derived, melt-season surface temperature of the Greenland Ice Sheet (2000–2005) and its relationship to mass balance. Geophys. Res. Lett. 2006, 33. [Google Scholar] [CrossRef] [Green Version]
  24. Tedesco, M.; Serreze, M.; Fettweis, X. Diagnosing the extreme surface melt event over southwestern Greenland in 2007. Cryosphere 2008, 2, 159–166. [Google Scholar] [CrossRef] [Green Version]
  25. Hanna, E.; Fettweis, X.; Mernild, S.H.; Cappelen, J.; Ribergaard, M.H.; Shuman, C.A.; Steffen, K.; Wood, L.; Mote, T.L. Atmospheric and oceanic climate forcing of the exceptional Greenland ice sheet surface melt in summer. Int. J. Clim. 2013, 34, 1022–1037. [Google Scholar] [CrossRef] [Green Version]
  26. Wouters, B.; Bamber, J.L.; Broeke, M.R.V.D.; Lenaerts, J.T.M.; Sasgen, I. Limits in detecting acceleration of ice sheet mass loss due to climate variability. Nat. Geosci. 2013, 6, 613–616. [Google Scholar] [CrossRef]
  27. Hall, D.K.; Comiso, J.C.; DiGirolamo, N.E.; Shuman, C.A.; Box, J.E.; Koenig, L.S. Variability in the surface temperature and melt extent of the Greenland ice sheet from MODIS. Geophys. Res. Lett. 2013, 40, 2114–2120. [Google Scholar] [CrossRef]
  28. Hall, D.K.; Williams, R.S., Jr.; Luthcke, S.B.; Nicolo, E.D. Greenland ice sheet surface temperature, melt and mass loss: 2000–06. J. Glaciol. 2008, 54, 81–93. [Google Scholar] [CrossRef] [Green Version]
  29. van den Broeke, M.; Bamber, J.; Ettema, J.; Rignot, E.; Schrama, E.; van de Berg, W.J.; Wouters, B. Partitioning recent Greenland mass loss. Science 2009, 326, 984–986. [Google Scholar] [CrossRef] [Green Version]
  30. Velicogna, I. Increasing rates of ice mass loss from the Greenland and Antarctic ice sheets revealed by GRACE. Geophys. Res. Lett. 2009, 36. [Google Scholar] [CrossRef] [Green Version]
  31. Hall, D.K.; Cullather, R.I.; DiGirolamo, N.E.; Comiso, J.C.; Medley, B.C.; Nowicki, S.M. A Multilayer Surface Temperature, Surface Albedo, and Water Vapor Product of Greenland from MODIS. Remote. Sens. 2018, 10, 555. [Google Scholar] [CrossRef] [Green Version]
  32. Miller, N.B.; Shupe, M.D.; Cox, C.J.; Noone, D.; Persson, P.O.G.; Steffen, K. Surface energy budget responses to radiative forcing at Summit, Greenland. Cryosphere 2017, 11, 497–516. [Google Scholar] [CrossRef] [Green Version]
  33. Oerlemans, J. The mass balance of the Greenland ice sheet: Sensitivity to climate change as revealed by energy-balance modelling. Holocene 1991, 1, 40–48. [Google Scholar] [CrossRef] [Green Version]
  34. Hanna, E.; Huybrechts, P.; Janssens, I.; Cappelen, J.; Steffen, K.; Stephens, A. Runoff and mass balance of the Greenland ice sheet: 1958–2003. J. Geophys. Res. Atmos. 2005, 110. [Google Scholar] [CrossRef] [Green Version]
  35. Janssens, I.; Huybrechts, P. The treatment of meltwater retardation in mass-balance parameterizations of the Greenland ice sheet. Ann. Glaciol. 2000, 31, 133–140. [Google Scholar] [CrossRef] [Green Version]
  36. Zhang, Q.; Huai, B.; Broeke, M.R.V.D.; Cappelen, J.; Ding, M.; Wang, Y.; Sun, W. Temporal and Spatial Variability in Contemporary Greenland Warming (1958–2020). J. Clim. 2022, 35, 2755–2767. [Google Scholar] [CrossRef]
  37. Hall, D.K.; Box, J.E.; Casey, K.A.; Hook, S.J.; Shuman, C.A.; Steffen, K. Comparison of satellite-derived and in-situ observations of ice and snow surface temperatures over Greenland. Remote Sens. Environ. 2008, 112, 3739–3749. [Google Scholar] [CrossRef] [Green Version]
  38. Wan, Z. New refinements and validation of the collection-6 MODIS land-surface temperature/emissivity product. Remote Sens. Environ. 2014, 140, 36–45. [Google Scholar] [CrossRef]
  39. Qie, Y.; Wang, N.; Wu, Y.; Chen, A. Variations in Winter Surface Temperature of the Purog Kangri Ice Field, Qinghai–Tibetan Plateau, 2001–2018, Using MODIS Data. Remote. Sens. 2020, 12, 1133. [Google Scholar] [CrossRef] [Green Version]
  40. Ahlstrom, A.P.; Gravesen, P.; Andersen, S.B.; van As, D.; Citterio, M.; Fausto, R.S.; Nielsen, S.; Jepsen, H.F.; Kristensen, S.S.; Christensen, E.L. A new programme for monitoring the mass loss of the Greenland ice sheet. Geol. Surv. Den. Greenl. Bull. 2008, 15, 61–64. [Google Scholar] [CrossRef]
  41. Fausto, R.S.; van As, D.; Mankoff, K.D.; Vandecrux, B.; Citterio, M.; Ahlstrøm, A.P.; Andersen, S.B.; Colgan, W.; Karlsson, N.B.; Kjeldsen, K.K.; et al. Programme for Monitoring of the Greenland Ice Sheet (PROMICE) automatic weather station data. Earth Syst. Sci. Data 2021, 13, 3819–3845. [Google Scholar] [CrossRef]
  42. Mankoff, K.D.; Fettweis, X.; Langen, P.L.; Stendel, M.; Kjeldsen, K.K.; Karlsson, N.B.; Noël, B.; Broeke, M.R.V.D.; Solgaard, A.; Colgan, W.; et al. Greenland ice sheet mass balance from 1840 through next week. Earth Syst. Sci. Data 2021, 13, 5001–5025. [Google Scholar] [CrossRef]
  43. Previdi, M.; Veron, D.E. North Atlantic Oscillation–related climate variability in a regional atmospheric model. J. Geophys. Res. Atmos. 2005, 110. [Google Scholar] [CrossRef] [Green Version]
  44. Hanna, E.; Jones, J.M.; Cappelen, J.; Mernild, S.H.; Wood, L.; Steffen, K.; Huybrechts, P. The influence of North Atlantic atmospheric and oceanic forcing effects on 1900-2010 Greenland summer climate and ice melt/runoff. Int. J. Clim. 2012, 33, 862–880. [Google Scholar] [CrossRef]
  45. Fang, Z.F. Statistical relationship between the northern hemisphere sea ice and atmospheric circulation during wintertime. In Observation, Theory and Modeling of Atmospheric Variability: Selected Papers of Nanjing Institute of Meteorology Alumni in Commemoration of Professor Jijia Zhang; World Scientific: Singapore, 2004; pp. 131–141. [Google Scholar]
  46. Rogers, J.C. The association between the North Atlantic Oscillation and the Southern Oscillation in the northern hemisphere. Mon. Weather Rev. 1984, 112, 1999–2015. [Google Scholar] [CrossRef]
  47. Jones, P.D.; Jónsson, T.; Wheeler, D. Extension to the North Atlantic Oscillation using early instrumental pressure observations from Gibraltar and south-west Iceland. Int. J. Climatol. A J. R. Meteorol. Soc. 1997, 17, 1433–1450. [Google Scholar] [CrossRef]
  48. Peng, Z.; Wang, L.; Chen, C. The Short-term Mass Change of Greenland Ice Sheet and the Atmospheric Forcing. IOP Conf. Ser. Earth Environ. Sci. 2021, 660, 012091. [Google Scholar] [CrossRef]
  49. Hanna, E.; Cropper, T.E.; Hall, R.J.; Cappelen, J. Greenland Blocking Index 1851–2015: A regional climate change signal. Int. J. Clim. 2016, 36, 4847–4861. [Google Scholar] [CrossRef] [Green Version]
  50. Rignot, E.; Velicogna, I.; Broeke, M.R.V.D.; Monaghan, A.; Lenaerts, J.T.M. Acceleration of the contribution of the Greenland and Antarctic ice sheets to sea level rise. Geophys. Res. Lett. 2011, 38. [Google Scholar] [CrossRef] [Green Version]
  51. Välisuo, I.; Vihma, T.; Pirazzini, R.; Schäfer, M. Interannual Variability of Atmospheric Conditions and Surface Melt in Greenland in 2000–2004. J. Geophys. Res. Atmos. 2018, 123, 10443–10463. [Google Scholar] [CrossRef]
  52. Wan, Z.; Zhang, Y.; Zhang, Q.; Li, Z.L. Validation of the land-surface temperature products retrieved from Terra Moderate Resolution Imaging Spectroradiometer data. Remote Sens. Environ. 2002, 83, 163–180. [Google Scholar] [CrossRef]
  53. Koenig, L.S.; Hall, D.K. Comparison of satellite, thermochron and station temperatures at Summit, Greenland, during the winter of 2008/09. J. Glaciol. 2010, 56, 735–741. [Google Scholar] [CrossRef] [Green Version]
  54. Box, J.E.; Fettweis, X.; Stroeve, J.C.; Tedesco, M.; Hall, D.K.; Steffen, K. Greenland ice sheet albedo feedback: Thermodynamics and atmospheric drivers. Cryosphere 2012, 6, 593–634. [Google Scholar] [CrossRef] [Green Version]
  55. Bennartz, R.; Shupe, M.D.; Turner, D.D.; Walden, V.P.; Steffen, K.; Cox, C.J.; Kulie, M.S.; Miller, N.B.; Pettersen, C. July 2012 Greenland melt extent enhanced by low-level liquid clouds. Nature 2013, 496, 83–86. [Google Scholar] [CrossRef] [PubMed]
  56. Zikan, K.H.; Adolph, A.C.; Brown, W.P.; Fausto, R.S. Comparison of MODIS surface temperatures to in situ measurements on the Greenland Ice Sheet from 2014 to 2017. J. Glaciol. 2022, 1–12. [Google Scholar] [CrossRef]
  57. Østby, T.I.; Schuler, T.V.; Westermann, S. Severe cloud contamination of MODIS Land Surface Temperatures over an Arctic ice cap, Svalbard. Remote Sens. Environ. 2014, 142, 95–102. [Google Scholar] [CrossRef]
  58. Wenny, B.N.; Xiong, X.; Madhavan, S. Evaluation of Terra and Aqua MODIS thermal emissive band calibration consistency. Sens. Syst. Next-Gener. Satell. XVI 2012, 8533, 853317. [Google Scholar] [CrossRef]
  59. Ackerman, S.A.; Holz, R.E.; Frey, R.; Eloranta, E.W.; Maddux, B.C.; McGill, M. Cloud detection with MODIS. Part II: Validation. J. Atmos. Ocean. Technol 2008, 25, 1073–1086. [Google Scholar] [CrossRef] [Green Version]
  60. Qie, Y. Spatial and Temporal Variations of Glacier Surface Temperature and Albedo in the Qinghai-Tibetan Plateau during the Past 20 Years Using MODIS Data; Northwest University: Kirkland, WA, USA, 2020. [Google Scholar]
  61. Ackerman, S.A.; Strabala, K.I.; Menzel, W.P.; Frey, R.A.; Moeller, C.C.; Gumley, L.E. Discriminating clear sky from clouds with MODIS. J. Geophys. Res. Atmos. 1998, 103, 32141–32157. [Google Scholar] [CrossRef]
  62. Zhang, H.; Zhang, F.; Ye, M.; Che, T.; Zhang, G. Estimating daily air temperatures over the Tibetan Plateau by dynamically integrating MODIS LST data. J. Geophys. Res. Atmos. 2016, 121. [Google Scholar] [CrossRef] [Green Version]
Figure 1. Map of the location of the GrIS, dividing the area according to Rignot et al. NO: North, NE: Northeast, SE: Southeast, SW: Southwest, CW: Central and West, NW: Northwest. Elevation contour lines are also represented (m).
Remotesensing 15 01149 g001
Figure 2. MODIS and Observed monthly LST, Observed LST is from AMS. the red diagonal represents the 1:1 line. * and ** Indicates a confidence level of 0.05 and 0.01.
Remotesensing 15 01149 g002
Figure 3. Seasonal LST and LST trend over the GrIS in Spring (a), Summer (b), Autumn (c) and Winter (d) and the mean Annual results (e) from March 2000 to December 2020.
Remotesensing 15 01149 g003
Figure 4. Summer LST anomaly of the GrIS from 2000 to 2020.
Remotesensing 15 01149 g004
Figure 5. The GrIS daily and mean melt extent for summer (here, 1 June–31 August). (Data for 2000 and 2001 are partly missing. Percentage is calculated with respect to total number of pixels with LST observations for each date. The mean melting extent is derived from the summer 2000–2020 daily melting extent).
Remotesensing 15 01149 g005
Figure 6. The GrIS cumulative melting extent for summer from 2000 to 2020.
Remotesensing 15 01149 g006
Figure 7. Percentage of the GrIS melting extent for summer from 2000 to 2020. (Extent of maximum melt as derived from the MODIS daily LST).
Remotesensing 15 01149 g007
Figure 8. Melt-day anomaly for summer, 2002 (a), 2012 (b), and 2019 (c) compared to 2000–2020 summer mean. Difference in melt days between 2002, 2012 and 2019 ((d): 2012 minus 2002, (e): 2012 minus 2019).
Remotesensing 15 01149 g008
Figure 9. Time series of summer surface temperature, melting extent and mass balance of the GrIS.
Remotesensing 15 01149 g009
Figure 10. Modelled the GrIS annual (a) total mass balance, (b) surface mass balance, (c) Ice discharge and (d) Basal mass balance versus summer LST. All relations are built using 2000–2020 data. * and ** Indicates a confidence level of 0.05 and 0.01.
Remotesensing 15 01149 g010
Figure 11. Daily melting extent and mass balance of the GrIS. * and ** Indicates a confidence level of 0.05 and 0.01.
Remotesensing 15 01149 g011
Figure 12. The GrIS LST, NAO and GBI anomaly time series, (a) MAM; (b) JJA; (c) SON; (d) DJF; * and ** Indicates a confidence level of 0.05 and 0.01.
Remotesensing 15 01149 g012
Table 1. Mean annual temperature and standard deviation of the GrIS, as a whole and for basins (°C).
NONESESWCWNWMean
2001−27.79 ± 3.57−28.17 ± 4.84−20.07 ± 5.69−18.74 ± 3.81−25.38 ± 5.27−25.98 ± 5.03−25.67 ± 5.77
2002−25.90 ± 3.12−26.55 ± 4.35−20.39 ± 5.41−18.87 ± 4.05−24.72 ± 5.11−24.66 ± 5.02−24.51 ± 5.16
2003−26.04 ± 3.01−26.61 ± 4.42−19.48 ± 4.91−17.66 ± 3.54−24.25 ± 5.30−24.53 ± 5.12−24.29 ± 5.33
2004−26.52 ± 3.42−27.06 ± 4.61−20.15 ± 5.22−19.46 ± 3.77−25.71 ± 5.05−25.83 ± 5.08−25.13 ± 5.33
2005−25.73 ± 3.25−26.38 ± 4.79−19.48 ± 5.67−18.61 ± 3.89−25.34 ± 5.10−25.14 ± 5.13−24.45 ± 5.44
2006−26.41 ± 3.51−27.10 ± 4.67−19.85 ± 5.52−19.12 ± 3.89−25.53 ± 5.16−25.68 ± 5.32−25.01 ± 5.50
2007−26.99 ± 3.30−27.74 ± 4.78−20.64 ± 5.37−19.45 ± 3.75−25.75 ± 5.27−25.58 ± 4.96−25.46 ± 5.42
2008−26.15 ± 3.31−27.48 ± 4.72−20.72 ± 5.52−19.75 ± 3.71−26.09 ± 5.17−25.64 ± 5.14−25.28 ± 5.34
2009−26.37 ± 3.47−27.73 ± 4.88−20.64 ± 5.20−18.91 ± 4.07−25.08 ± 5.50−25.46 ± 5.53−25.19 ± 5.60
2010−24.48 ± 3.31−25.20 ± 4.36−17.39 ± 4.92−14.56 ± 3.72−21.76 ± 5.35−22.92 ± 5.11−22.48 ± 5.61
2011−27.18 ± 3.29−28.01 ± 4.87−21.42 ± 5.44−20.91 ± 4.34−26.94 ± 4.94−27.07 ± 5.38−26.17 ± 5.41
2012−25.67 ± 3.35−26.50 ± 4.65−19.31 ± 5.01−19.36 ± 3.63−25.34 ± 4.41−25.40 ± 4.73−24.56 ± 5.15
2013−27.25 ± 3.53−28.10 ± 4.72−20.79 ± 5.61−19.02 ± 3.99−25.99 ± 5.42−26.12 ± 5.29−25.73 ± 5.64
2014−26.43 ± 3.49−27.16 ± 4.81−20.03 ± 5.10−19.87 ± 3.45−25.09 ± 5.11−25.43 ± 5.39−25.03 ± 5.38
2015−27.42 ± 3.31−28.53 ± 4.92−21.62 ± 5.72−22.24 ± 3.82−27.48 ± 4.70−26.60 ± 5.04−26.49 ± 5.30
2016−24.52 ± 3.15−25.56 ± 4.47−18.51 ± 4.94−18.05 ± 3.47−23.42 ± 4.95−23.64 ± 4.92−23.32 ± 5.11
2017−26.45 ± 3.36−26.77 ± 4.62−20.02 ± 5.29−18.57 ± 3.64−24.89 ± 5.16−25.17 ± 5.07−24.74 ± 5.36
2018−26.52 ± 3.49−27.43 ± 4.72−20.58 ± 5.46−19.79 ± 4.03−25.02 ± 5.24−25.68 ± 5.19−25.22 ± 5.41
2019−24.87 ± 3.16−26.11 ± 4.42−20.14 ± 5.00−17.88 ± 3.84−23.88 ± 5.46−23.56 ± 5.03−23.78 ± 5.15
2020−26.67 ± 3.52−28.12 ± 4.98−21.26 ± 5.81−19.11 ± 3.97−26.13 ± 5.82−26.20 ± 5.12−25.77 ± 5.60
Mean−26.24 ± 3.39−27.09 ± 4.72−20.03 ± 5.42−19.01 ± 3.81−25.18 ± 5.18−25.28 ± 5.17−24.86 ± 5.46
Disclaimer/Publisher’s Note: The statements, opinions and data contained in all publications are solely those of the individual author(s) and contributor(s) and not of MDPI and/or the editor(s). MDPI and/or the editor(s) disclaim responsibility for any injury to people or property resulting from any ideas, methods, instructions or products referred to in the content.