Article

The Impact of Altimetry Corrections of Sentinel-3A Sea Surface Height in the Coastal Zone of the Northwest Atlantic

1
School of Geographical Sciences, University of Bristol, Bristol BS8 1SS, UK
2
AI4EO Future Lab, Technical University of Munich, 85521 Ottobrunn, Germany
*
Author to whom correspondence should be addressed.
Remote Sens. 2023, 15(4), 1132; https://doi.org/10.3390/rs15041132
Submission received: 17 January 2023 / Revised: 15 February 2023 / Accepted: 17 February 2023 / Published: 18 February 2023
(This article belongs to the Special Issue Advances in Satellite Altimetry)

Abstract

:
Corrections to altimeter-measured sea surface height anomalies (SSHA) have a larger proportional effect for synthetic aperture radar (SAR) altimetry than conventional, pulse-limited altimetry because of lower range noise. Here, we quantified the impact of the current generation of altimeter corrections in the coastal zone of the Northwest Atlantic, a region with significant dynamic activity. In this study, we used the sea level variance analysis to determine the change in variance for the altimeter corrections—range, geophysical, and mean surface—compared to the baseline. We also evaluated the performance of two coastal retrackers, ALES (empirical) and SAMOSA++ (fully analytical), against the SSHA from the Radar Altimeter Database System (RADS), which uses the standard SAR retracker. Tide corrections caused the largest change in sea level variance, followed by wet tropospheric corrections and sea state bias. Most non-standard altimeter corrections failed to reduce the sea level variance and performed markedly worse closer to the coast. Coastal retrackers showed a higher deviation from the standard SSHA closer to the coast, especially when the backscatter coefficient was high and the significant wave height was low. We conclude that further development of coastal corrections is needed. Contrary to our prior expectation, we found that standard altimetry corrections appear to perform as well as alternative more advanced/tailored corrections.

1. Introduction

From global to local scales, satellite radar altimeters (SRAs) provide high-precision measurements to estimate sea level, one of the most important essential climate variables defined by the World Meteorological Organization. While SRAs are accurate to the order of 1 cm [1], various atmospheric and surface processes add unwanted noise that is, in general, larger than the signal being measured [2]. Corrections for these processes need to be applied, therefore, to extract useful climate trends from SRA sea surface height anomalies (SSHA). These can be split into SRA range corrections arising from atmospheric attenuation and sea state effects and geophysical corrections related to short-term variability in SSHA due to, for example, pressure, wind, and tide-induced effects on local sea level, especially signal aliasing in SRAs with long return periods [3].
To remove the effects of those background processes, we can apply dedicated altimeter corrections. However, coastal zones, which host the most in-situ sea level measurements, pose additional challenges. Firstly, altimeter waveforms from areas close to the coast often contain artifacts, mainly due to land contamination of the off-nadir satellite altimeter footprint [4] and the lower surface roughness of calm seas [5], which distort the altimeter waveform shape and cause unreliable retrievals of geophysical parameters [6]. Secondly, the corrections are less likely to capture the enhanced variability of the processes mentioned above over the coastal shelf [7]; some types of corrections (in particular, radiometer- or altimeter-based) degrade due to the presence of land in the instrument footprint [3].
Land contamination and distortion of the waveform shape can be addressed by employing specially developed coastal retrackers and algorithms that can accommodate the distortions to the waveform mentioned above [8]. Another solution to avoid the downsides of the conventional altimeter footprint is to use a synthetic aperture radar (SAR) altimeter. Unlike conventional, pulse-limited SRAs, SAR altimeters emit a burst of pulses at a higher repetition frequency, which means that successive pulses are coherent. As a result, more echoes are reflected from the same surface [9,10], which decreases the noise, thus improving the signal-to-noise ratio. The pulse coherence enables Delay/Doppler processing, which allows the signal’s along-track and cross-track dimensions to be separated and the backscatter field to be transformed into constant-length cells in the along-track direction [9]. Therefore, the footprint in the along-track direction is smaller and independent of the significant wave height (SWH), while the footprint is unchanged in the cross-track direction [10]. In addition, the altimeter noise dependency on SWH for SAR altimeters is lower than for pulse-limited altimeters [11]. Currently, only the Sentinel-3A/B and Sentinel-6 Michael Freilich missions provide the SAR mode over the global oceans (CryoSat-2 does have a SAR mode, but with limited coverage over ocean surfaces). Out of these, Sentinel-3A has the longest record in the whole of the Northwest Atlantic, which we selected as the region of interest due to the region’s relatively high oceanographic complexity [12] and societal importance.
Altimeter corrections in the coastal zone was the focus of this study. The performance of altimeter corrections in coastal regions strongly depends on local conditions; therefore, it is necessary to study the impact of those corrections in specific regions to inform the coastal altimetry community of user needs. Considering that SAR altimetry has lower range errors than conventional pulse-limited altimetry [2,11], the relative impact of altimeter corrections becomes more significant for improving the signal-to-noise ratio in the observations. Determining the best altimeter corrections can also improve the processing of regional altimetry products by reducing the bias and increasing the precision of geophysical parameter estimates. This study is one of the few to evaluate altimeter corrections in the coastal zone of the Northwest Atlantic [13] and the impacts of those corrections for SAR mode altimetry [14], as well as testing the performance of different retrackers in this region. Thus, it provides an update to previous research by encompassing the advances in SRA and altimetry corrections for the Northwest Atlantic coastal zone. This study aims: (i) to identify the corrections that contribute to the largest variance reduction in SSHA; (ii) to determine which corrections are the most effective in the coastal zone of the Northwest Atlantic; and (iii) to evaluate the variance of two retrackers optimised for the coastal zone: ALES and SAMOSA++.

2. Materials and Methods

2.1. Data

The study region was the coastal zone of the Northwest Atlantic (Figure 1). We only used Sentinel-3A SAR altimeter (S3A-SRAL) along-track data, limiting the selected passes to those that were within 250 km of in-situ measurements of SSHA, namely tide gauges, which we compared to the altimetry. In this study, however, we did not present a validation against the tide gauges. The distance (250 km) was selected to ensure the shelf is covered around all selected locations and reaches the transition between the coastal and open oceans. The selected altimeter passes in the region of interest alongside bathymetry, as shown in Figure 1.

2.1.1. Altimeter Products

Table 1 shows the products and orbital cycles used for analysis. Radar Altimeter Database System (RADS) is a database that holds data from most satellite altimetry missions, providing reference height offsets between the missions alongside extensive geophysical data records (GDR) (different corrections) and auxiliary data fields [15]. The RADS database is excellent for the analysis of different altimeter corrections. For analysis of the range and the geophysical corrections, we extracted the L2 (along-track) data from RADS, using cycles 1–50.
To assess the impact of retracker performance, we used two different state-of-the-art coastal retrackers: ALES [16] and SAMOSA++ [10]. These retrackers provided improved retrievals of geophysical parameters, including the range, in addition to the significant wave height (SWH) and the backscatter coefficient (σ0). We chose these retrackers because they represent two contrasting approaches while simultaneously providing good results for both coastal (quasi-specular or multi-peak [17]) and open ocean (diffusive) waveforms.
The ALES retracker is a subwaveform retracker [16], i.e., the one that only makes use of a part of the waveform [17]. The rationale was to avoid the parts of the waveform that do not conform to the Brown-Hayne model of an ocean return [18,19] (for SAR altimetry, ALES used a simplified form [20] as in this case the waveform was peakier than the conventional). The main challenge with this approach was selecting the intact part of the waveform. In the case of ALES, the subwaveform was selected in a two-step process. Initially, a window excluding the trailing edge was selected and retracked to retrieve the first-guess of geophysical parameters. In the second step, the width of the subwaveform was refined by applying an empirical linear function of the first-guess epoch and significant wave height. The resulting subwaveform was used to derive the final geophysical parameters (epoch, significant wave height, backscatter coefficient) [16,20]. This retracker was initially developed for conventional SRA but is now also available for SAR altimetry. We obtained the ALES (version 55) dataset from DGFI-TUM openADB [21], which only starts from cycle 25; therefore, we used cycles 25–50.
The second retracker was SAMOSA++, a fully analytical retracker [10], designed for SAR altimetry, and the latest version of the SAMOSA family of retrackers [22,23]. This retracker created a new waveform from the integration of Doppler beams in the direction of the range. The Doppler beams were stacked, steered towards the same ground cell, and range-aligned [10]. Once integrated, it described the backscattering state. The model has a property to automatically adapt to the surface (whether it is diffusive or specular), so only one step was needed rather than two as with ALES. Following the standard steps of earlier SAMOSA versions [22,24], the final estimation gave SWH, epoch, Pu (amplitude), yaw and roll angles, and sea surface mean square slope. Comparison studies have indicated that SAMOSA++ was the best-performing retracker for SAR in the coastal zone [25].
We created the SAMOSA++ dataset with the online processor SARvatore for Sentinel-3, hosted on the ESA G-POD (currently discontinued); the current method to obtain the same data is to access the processor on the EarthConsole [26]. We used the standard coastal processing scheme (double radar receiving window size, Hamming window in the coastal zone, and FFT zero-padding). For SAMOSA++, we retrieved data for cycles 5–50.
For completeness, we used two other geophysical parameters derived from the altimeter retracking: the significant wave height (SWH) and backscatter coefficient (σ0). We used RADS to retrieve these parameters; therefore, any reference to SWH or σ0 in this work refers to these parameters from the standard retracker. We did not consider the impact of instrument corrections (like the center-of-mass distance correction, ultra-stable oscillator drift correction, internal path delay correction, etc.).
All altimetry products used in this study were at a 1 Hz sampling rate, which ensured consistency between RADS, which was only available as a 1 Hz dataset, and coastally retracked datasets. Another reason to use a 1 Hz dataset was that most corrections were originally provided at 1 Hz sampling and were then interpolated for higher sampling rates [27,28]. However, a lower sampling rate also meant that the along-track resolution was reduced from ~300 m [29] to >6 km.
When comparing different retrackers, we only used the common period for all three retrackers for better consistency. This corresponds to cycles 25 to 50.

2.1.2. Sea Surface Height Anomaly Time Series

The satellite nadir projection collinearly shifts around the nominal ground pass with each cycle. Because this study aims to quantify the effect of differing corrections on the SSHA variance proportionally to the signal, we did not want this spatial variability where the altimeter was sampling to contribute to our assessment. This is particularly important where corrections were large or had strong gradients, such as in MSS. Therefore, we interpolated each measurement onto points along a constant track. These points were called comparison points (CP). We constructed CPs on the nominal ground track, with a total of 6024 CP for the whole study area. The first CP for each track was the point of closest approach (PCA)—a point with the smallest distance to the nearest tide gauge of choice. On both of the PCAs, we added additional points at intervals of 6 km along the whole selected track section.
We calculated the sea surface height anomaly (SSHA) using Equation (1):
η = h R + Δ R
where η was the SSHA (m), h was the satellite altitude (m), R was the range (m), Δ R were the altimeter corrections (m). We calculated the SSHA at the CP from the variables interpolated to the location of the CP.
We calculated SSHA with the standard corrections replaced with alternative corrections (correction replacement) and with the corrections muted (correction removal). Further into this study, these SSHA versions were called the test SSHA.
Table 2 shows the altimeter corrections ( Δ R ) and selectable versions of each correction. Correction products marked with an asterisk are the standard corrections for both the RADS and SAMOSA++ datasets.
The dry tropospheric correction (DTC), also known as zenith hydrostatic delay, accounts for the variable microwave path length delay caused by changes in dry atmospheric density. It only depends on the surface pressure and latitude of the measurement; therefore, it can be calculated from numerical weather prediction or reanalysis (here called “models”) using the Saastamoinen formula [45]. The standard correction was from the ECMWF. The resolutions (spatial and temporal) of the models used for providing DTC and wet tropospheric correction (WTC) are provided in Table 3.
The WTC, also known as zenith wet delay, accounts for the path delay due to (mainly) the water vapour content of the troposphere. As the effect was nondispersive for frequencies under 20 GHz, both Ku-band and C-band altimeter signals experienced the same path delay. Over the open ocean, it can be calculated from radiometer brightness temperatures provided by the on-board microwave radiometer (MWR) that was designed for precisely this purpose. The operational radiometer WTC was derived by a neural network from either three parameters (two channel MWR brightness temperatures and altimeter Ku-band σ0) or five parameters (the same, in addition to the sea surface temperature and the climatological lapse rate) of global training samples [50]. As radiometer WTC is not suitable for the coastal zone, model WTC can be used instead. For model-based WTC, the correction depends on specific humidity, temperatures of the vertical profile, and latitude. RADS also offered a composite measure to keep the benefits of radiometer WTC and increase data availability. It used radiometer correction for the open ocean, model correction for the coastal ocean (closer than 50 km from land), and filled larger gaps (>200 km) in the radiometer WTC with detrended model WTC to ensure a smooth transition [51]. We did not select this version as the standard because it has shown poor performance [52].
The ionospheric correction accounts for path delay due to charged particles present in the atmosphere. The effect was highly dispersive; therefore, each altimeter frequency had a different path delay. This relationship was used to derive the correction; it is proportional to the total electron content (TEC) in the column and inversely proportional to the square of the altimeter frequency. To calculate the dual-frequency ionospheric correction, all that was required was knowledge of the C- and Ku-band ranges and frequencies [30,53,54]. A version of this correction, the smoothed dual-altimeter correction, was created by applying a boxcar filter (with a length of approximately 200 km along the track) to the raw dual-altimeter correction [30]. This was applied to tackle the instrument noise, which partly arises due to the propagation time difference between the two altimeter bands and radar frequency fluctuations during the pulse [53]. The alternative ionospheric correction was JPL GIM (Global Ionosphere Maps) [31,55,56], which provided bihourly ionospheric maps of TEC from GPS receivers that tracked the transmissions of GPS satellites. Another, inferior solution was to use the climatologies of TEC, for instance, NIC09, which was based on the coefficients derived from the linear relationship between GIM and global TEC for month, hour of the day, latitude, and longitude [30].
The sea state bias (SSB) corrects for errors in the altimeter range due to wave conditions on the altimeter-impinged sea surface. It has three components: electromagnetic (EM) bias, skewness bias, and tracker bias. EM biases relate to the higher reflectivity of troughs than crests, which causes the mean reflective surface measured to be biassed towards the trough’s level [57]. Thus, it overestimates the range, providing a lower mean reflecting surface than the mean sea level [58]. Skewness bias causes further estimated sea level depression due to non-Gaussian height distribution, which means the measured median surface height is not the same as the mean surface height [58]. Tracker bias includes both the retracker-introduced bias and the imprecise tracking of the midpoint or leading-edge location gate by the tracker [58]. Nonparametric SSB was calculated from the kernel smoothing based on either colinear (along-track) SSH differences or crossover SSH differences [33,59]. We applied nonparametric SSB supplied by RADS and provided in GDR with the SAMOSA++ product, based on Jason-2 data [32,33]. As an alternative, we prepared a simple parametric solution of 3% SWH, which has previously been used by other researchers [24,60,61]. To the first order, it was similar to the more sophisticated BM4 model [62]. We chose the coefficient of 3% by selecting the highest positive variance difference with the SSHA without SSB correction at 1% increments.
To minimise the aliasing of the sea level response to wind and atmospheric pressure, we applied the dynamic atmosphere correction (DAC). DAC was derived from the barotropic ocean response to high-frequency wind and pressure forcing and a slowly varying (20-day period cut-off) inverse barometer correction [63]. The inverse barometer (IB) correction accounts for sea surface depression due to changing atmospheric loading (expressed as surface pressure changes) [64]. A finite element, free surface, nonlinear barotropic model, MOG2D [34], was used to calculate the barotropic response, forced by ECMWF atmospheric reanalysis fields [65]. This correction worked well in the coastal zones due to the use of shallow water continuity and momentum conservation equations and an adaptable resolution with the mesh size as fine as 20 km for shallow shelf areas [34].
Geocentric tides refer to the sum of an elastic ocean tide and a load tide. In this study, this was always presented as a single variable. Due to the short Sentinel-3A record and the long return period, de-aliasing was better conducted by the tidal models. We used FES2014b as the standard tidal model. FES2014b included 34 tidal components (18 linear, 9 nonlinear, and 7 long-period components), which was the only global model to include so many tidal constituents [36]. The model was based on the Toulouse Unstructured Grid Model (T-UGMo), augmented by coupling to the spectral ensemble for optimal interpolation of altimeter data. Load tide correction accounted for ocean bottom deformation due to the mass redistribution by the tides, mostly assuming a perfectly elastic response [37]. Most ocean tide databases provided a load tide correction as the additional variable. The alternative geocentric tide corrections were GOT4.10 (available for RADS), EOT11 (applied to ALES), or TPXO9 (available for SAMOSA++), in addition to earlier versions of FES and those tidal atlases. GOT4.10 (evolved from GOT99.2) estimated tides from the harmonic analysis of altimeter data, with Topex/Posseidon used in the legacy version [37]. EOT11 was an empirical ocean tide model that assimilated multi-mission data [39]. TPXO9 was a generalised inversion scheme for data fusion to obtain tidal heights based on both the altimeter and the hydrodynamic model data [38].
The solid Earth tide corrects for terrestrial deformation due to lunar and solar gravitational forces (the impact of other celestial bodies is ignored). We used the most common Cartwright-Tayler-Edden solid Earth tide model, which included 386 second-order and 99 third-order waves [40,41]. The solution was proportional to the harmonic constituent decomposition of the tidal gravitational potential of celestial bodies. Pole tide was caused by the oscillations of the Earth’s rotation axis (known as the polar motion), which caused deformation of the earth [42], for which we corrected the altimeter SSHA. The main components of this motion were Chandler wobble, annual oscillation, and linear drift [66].
The mean sea surface (MSS) provides the reference sea surface topography, so anomalies can be expressed as a deviation from this. MSS averages multi-mission SSH, statistically dealing with small-scale variability [44]. We selected the latest MSS product, DTU18, which assimilated the most altimeter data. To compare with DTU18, we can also access CNES-CLS15, which uses an optimal interpolation of multi-mission altimeter sea level measurements and corrects for long-wavelength errors [67].
For ALES, the SSHA was directly provided by openADB without explicit corrections for most variables. We replaced the two corrections—tidal correction and mean sea surface—from EOT11a and DTU15 to FES2014b and DTU18, respectively. The only corrections that appeared to differ from RADS and SAMOSA++ SSHA were sea state bias and ionospheric correction. ALES used a parametric SSB. To obtain SSB, they used SWH and wind speed values (ALES-retracked) and interpolated a look-up table (also called the sea state bias table) [68]. The ionospheric correction was NIC09 instead of GIM [69].

2.1.3. Quality Control

Both the recalculated (test) SSHA (with the replaced corrections) and the baseline version were quality-controlled with threshold filters. Any variable (SSHA, range, radiometer WTC, dual-altimeter ionospheric correction, DAC, SSB) that exceeded the recommended interval was masked. For SSHA, this was a deviation larger than 2 m (absolute value). Other physical plausibility limits were provided by the theoretical baseline processing definition handbook [51].
All the recalculated and baseline SSHA were also quality controlled by the 3.5 median absolute difference along-track filter, which removed any values that exceeded this threshold. We selected this threshold based on Chauvenet’s criterion [70], with similar values used for X-TRACK processing of ionospheric correction and close to the three-sigma filter applied to SSHA globally [27,28].
No quality control was applied to SSHA in the correction removal experiments. It was also not applied to the baseline in these experiments.

2.2. Analysis Methods

The primary analysis approach for this study was sea level variance analysis, which is commonly used to evaluate altimeter and correction performance [14,34,71,72,73]. Due to the irregular track segment selection, we did not provide gridded analysis (unlike some other studies [71,74]); thus, we also did not present the spatial patterns as part of the main results section (these are provided as the Supplementary Materials). For variance analysis, we calculated temporal variances per each CP using Equation (2):
Var η = 1 n i = 1 n η i 1 n i = 1 n η i 2
where η was the SSHA and n was the length of the time series vector with valid SSHA values. SSHA was always converted to cm for the variance difference to be expressed in cm2.
From variances, we further calculated variance differences between the baseline (SSHA from RADS with all standard corrections applied) and the test (SSHA with an alternative correction or without the correction, or SSHA from ALES or SAMOSA++). To avoid a differential sample size, in both time series we masked values that were invalid. For easier comparison, we provided the scaled variance difference, the so-called percentage of noise reduction (PNR). It can be calculated using Equation (3):
P N R = 100 % × Var η b Var η t Var η b
where η b was the SSHA of the baseline and η t —the SSHA of the test.
The convention we used throughout this study was that a positive variance difference, or a positive PNR, meant a reduction in the variance of the SSHA when the particular correction was used.
For all histograms, we determined the bin width by the Freedman-Diaconis rule [75]. Where multiple histograms in the same plot had the same width, the smallest bin width was chosen for all histograms.

3. Results

3.1. Range and Geophysical Corrections

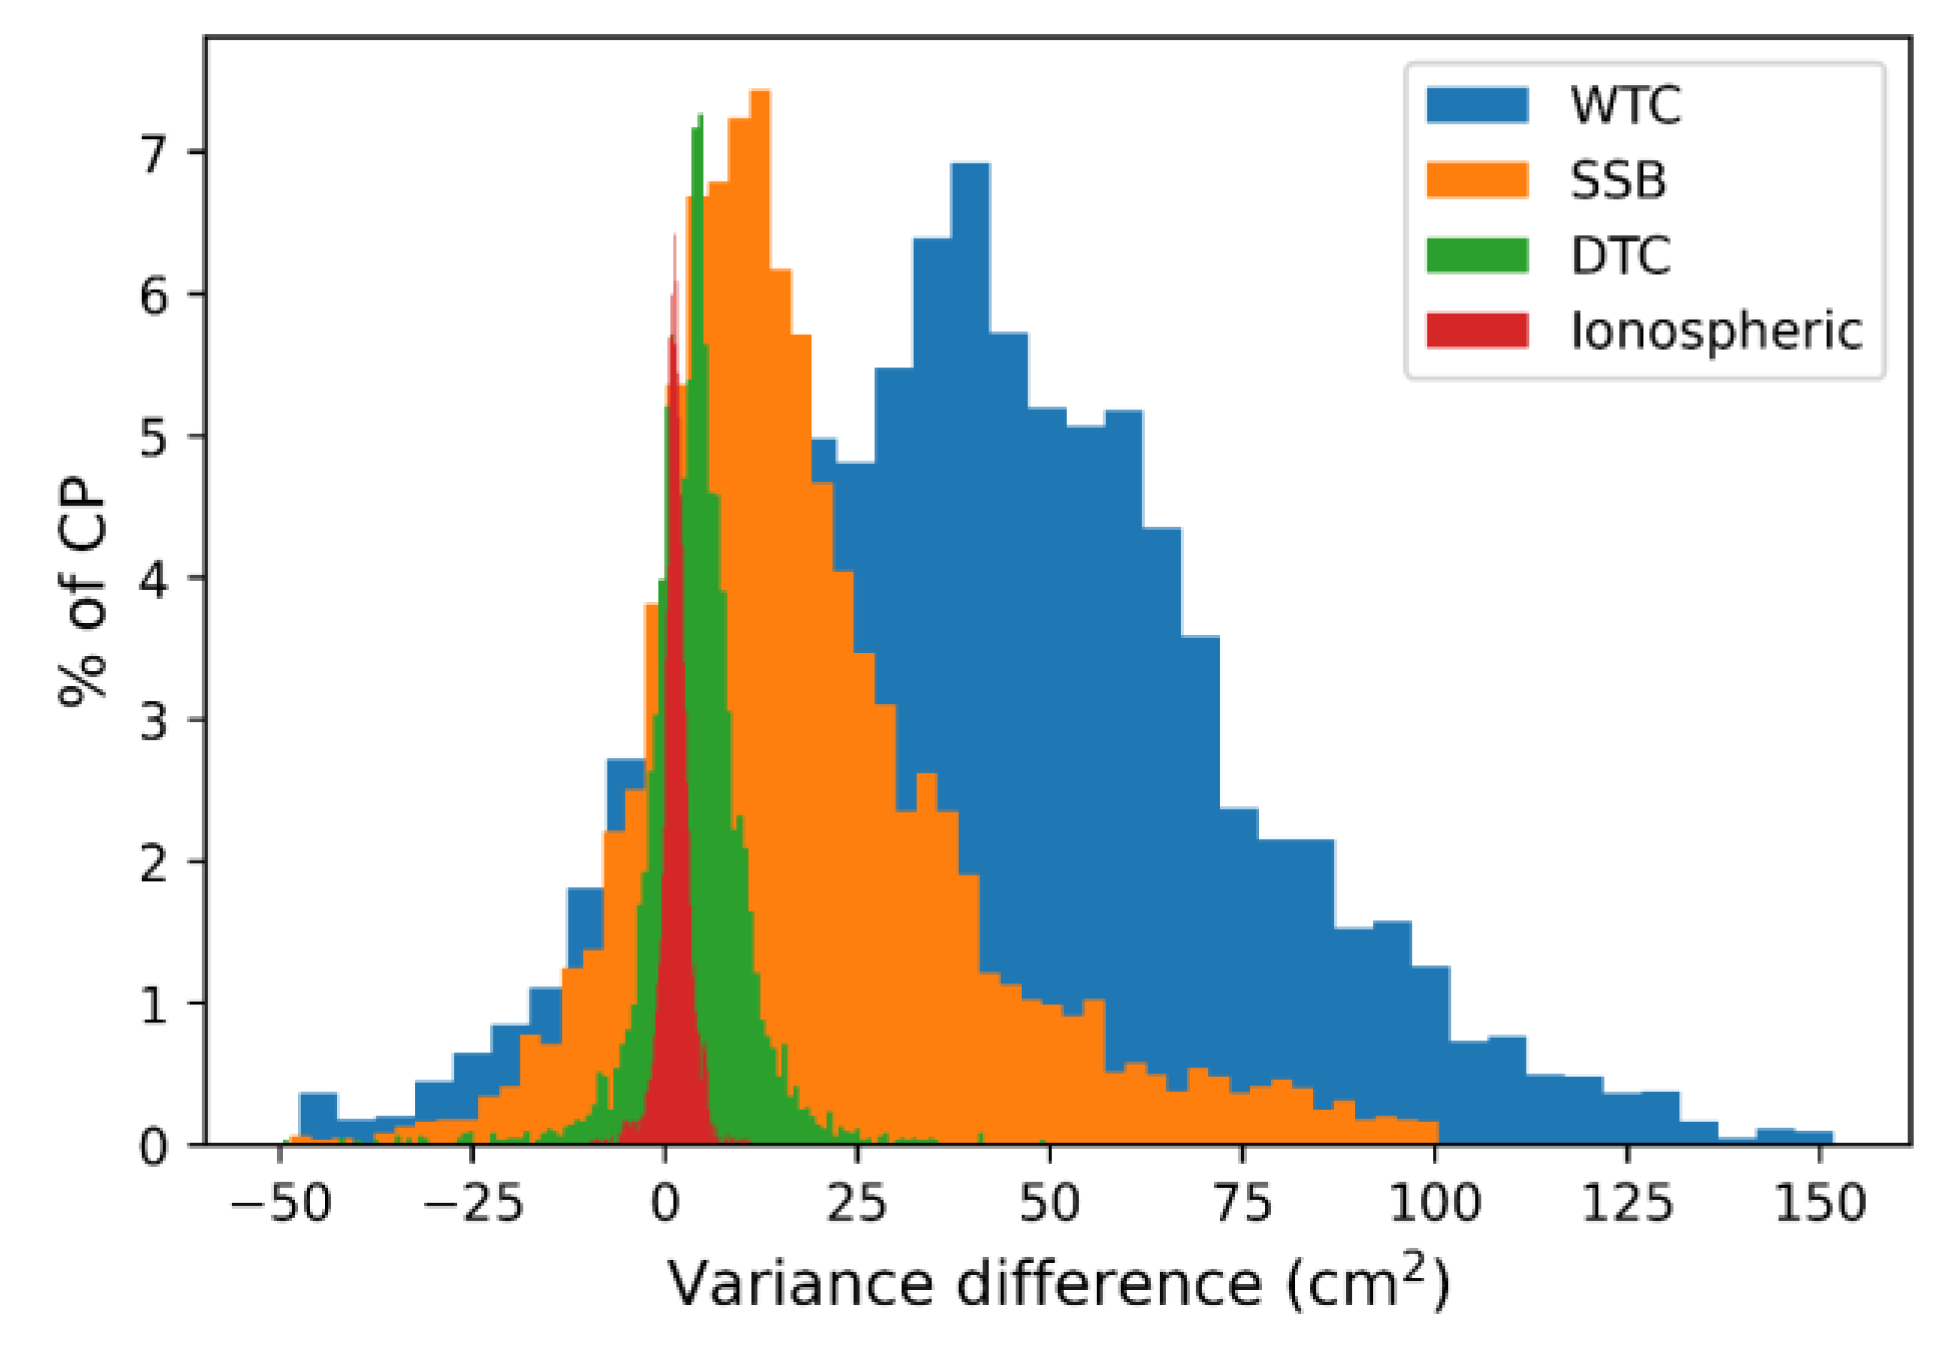
First, we evaluated the effect of each correction on the SSHA variance. This enabled us to determine which corrections had the most impact. Figure 2 shows the histograms of variance difference: the variance of SSHA without the particular altimeter correction minus the variance of SSHA with the standard corrections applied (the baseline). We also produced the same metric for all other variables, but in this plot, we show only the range corrections. The rest of the values are summarised in Table 4. As one can see, the geophysical correction variance differences are much higher (up to 20 times the highest range correction); therefore, these values were not plotted to retain the ability to see the corrections that cause less SSHA variance. The smallest of those corrections was the ionospheric correction (Figure 2), which had a median variance difference of 1 cm2. The distribution appeared to be close to normal and has a scale of about 3 cm2 on both sides. The second weakest effect was caused by the DTC (median of 4 cm2). Similar to ionospheric correction, the DTC distribution was close to normal, with a scale of about 10 cm2. Further towards higher variance is SSB (median of 13 cm2), which appeared to exhibit a weak positive skew (the negative tail dissipates quicker than the positive) and had a scale of roughly 30 cm2. The highest variance was for the WTC (median of 37 cm2), which also displayed some positive skew and a scale of approximately 50 cm2.
Variables not shown in Figure 2 were mostly larger than the ones shown, except the pole tide and the MSS. The MSS was approximately normally distributed around the 1 cm2 mean and median with a 2 cm2 scale (standard deviation). The highest effect of those variables was for the geocentric (elastic) tide correction, followed by the solid Earth tide correction and the IB/DAC, which had an almost 1.5 times stronger effect on SSHA variance than the WTC.
Table 4 also shows the percentage of CPs with a negative variance difference (Δvar < 0). This statistic signifies the magnitude of poor corrections for each correction within the study area. The highest percentages are for those corrections that have the smallest variance differences, like the polar tide correction and the MSS. Therefore, the poor performance is less significant than for other corrections. A significant proportion of poor corrections are for DTC and SSB, thus demonstrating the underperformance of these corrections in certain locations.
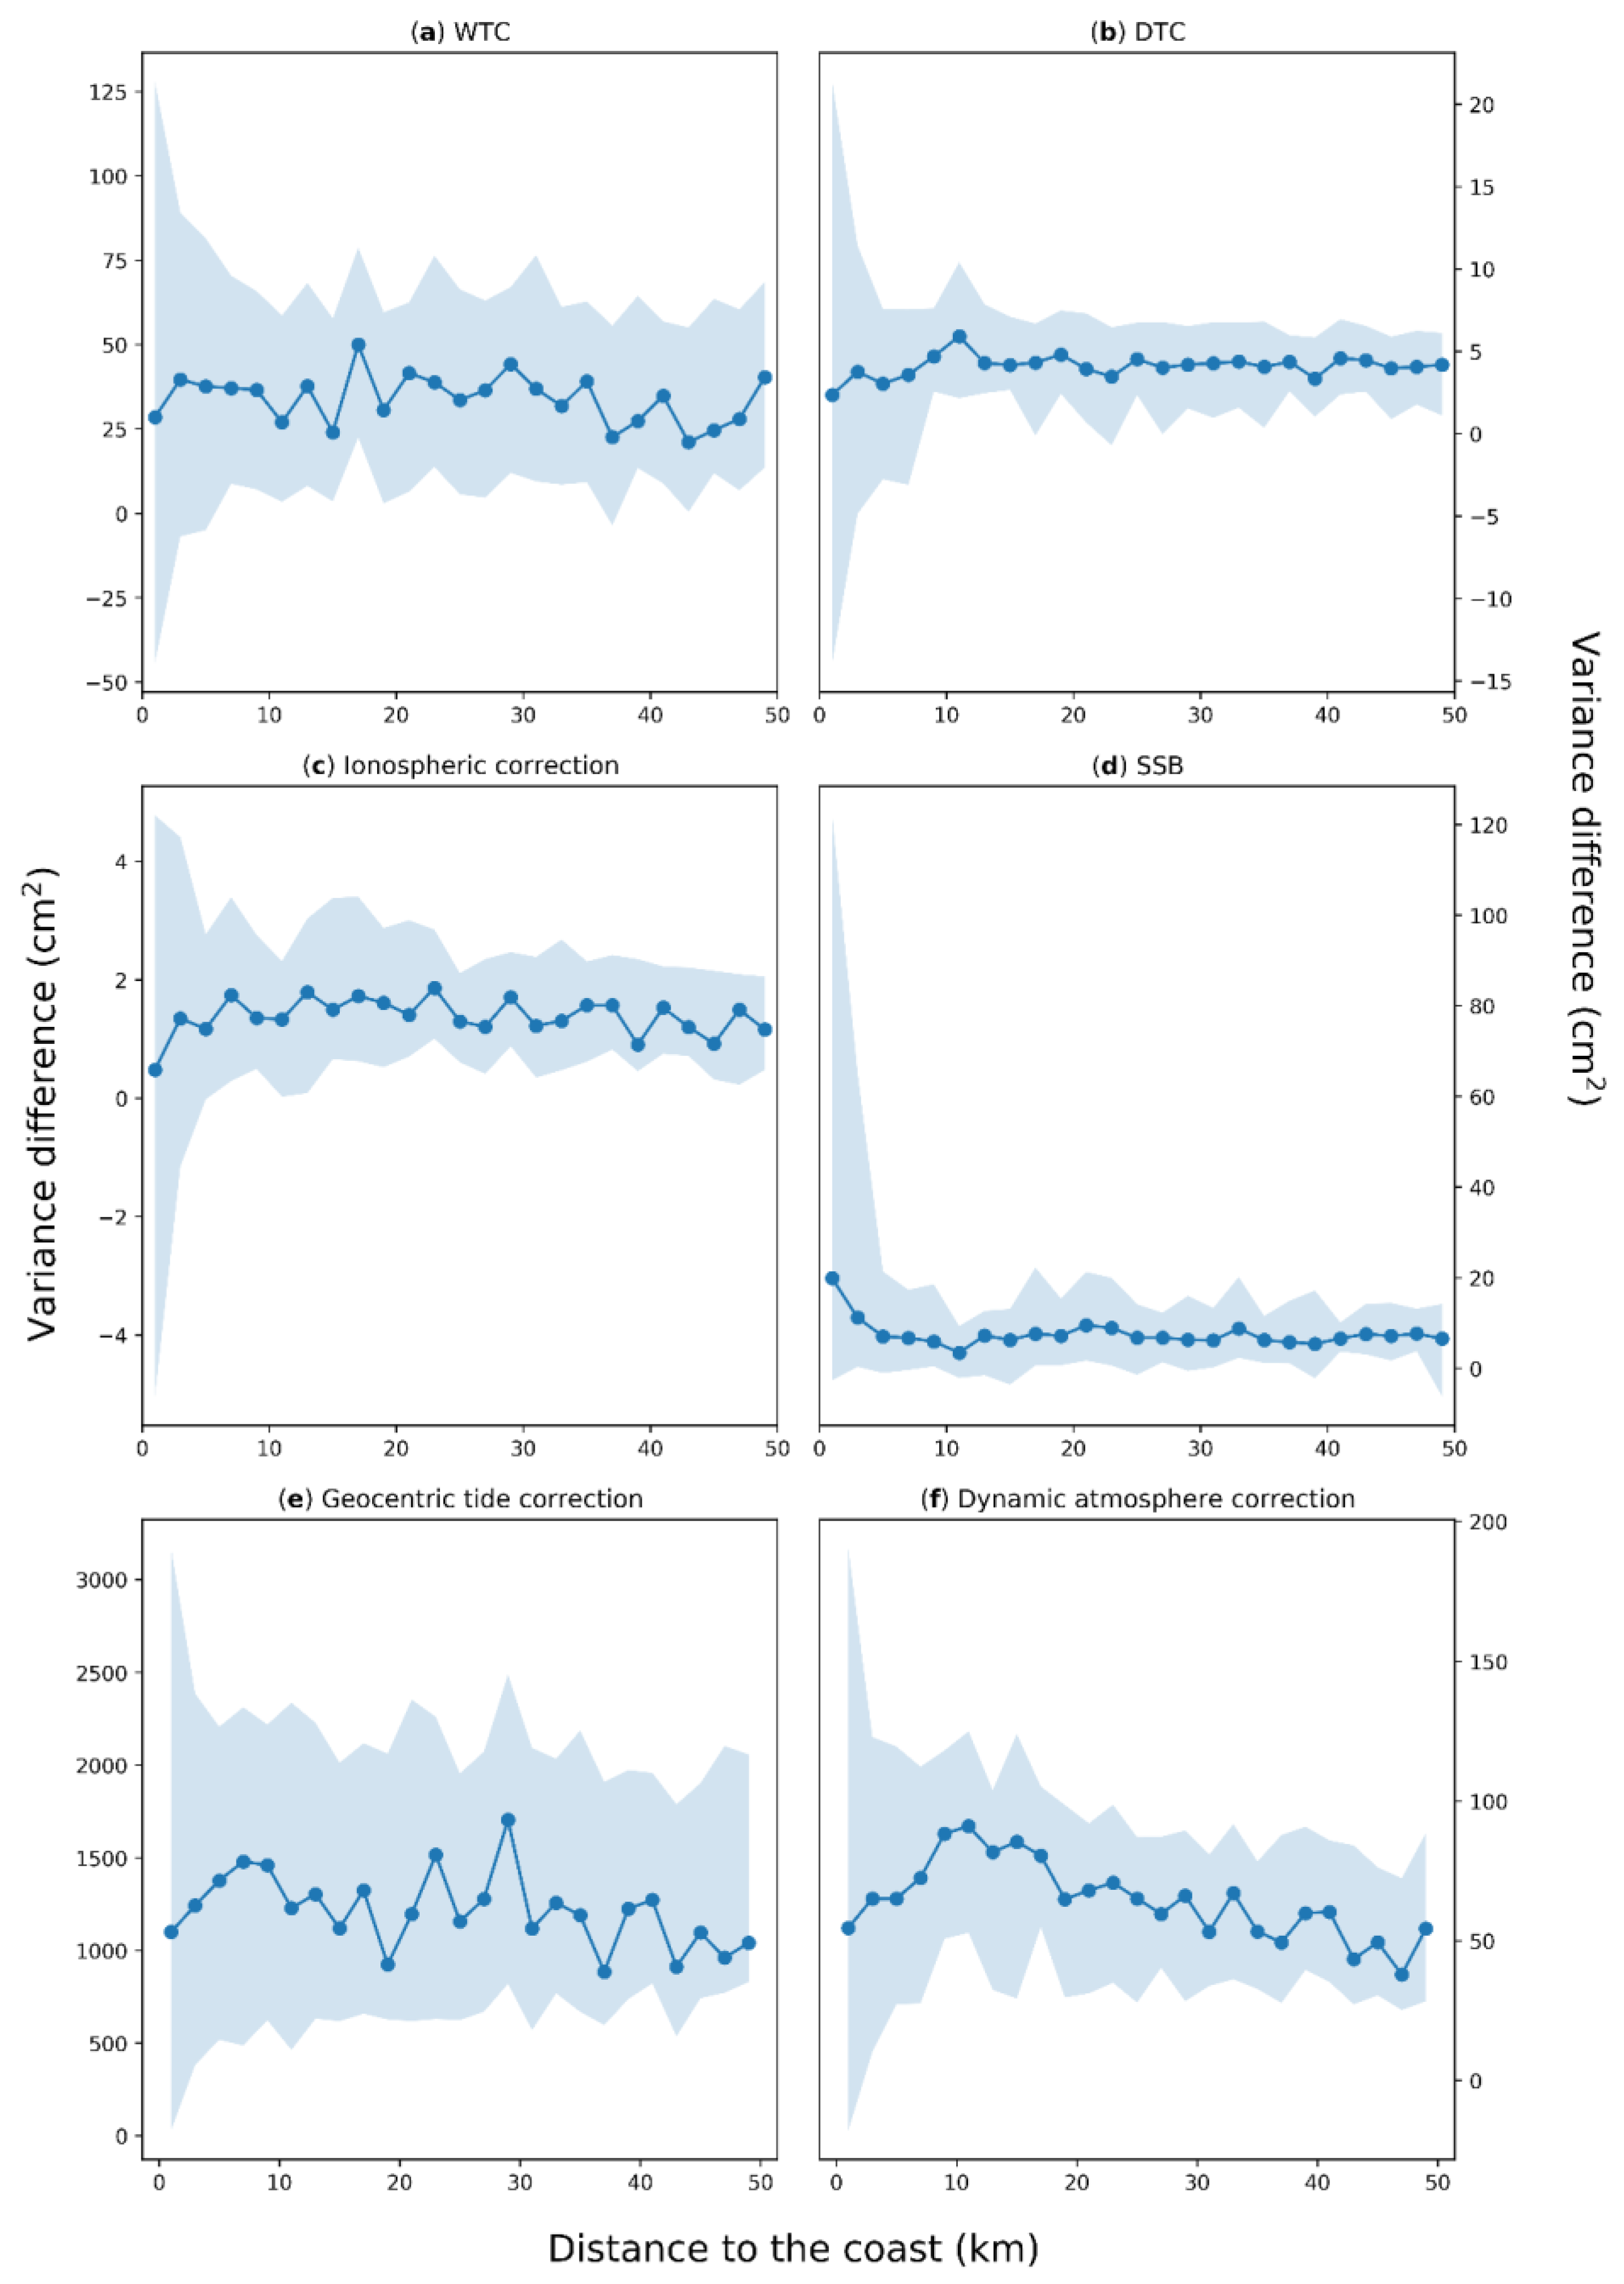
An important consideration in coastal altimetry is the relationship of these variances to the coastal distance. We show this relationship in Figure 3 (excluding MSS, solid earth, and pole tides). The plot shows the median variance difference (variance of SSHA uncorrected by the variable minus corrected SSHA variance) with IQR (shading).
For all variables, the initial 5 km had a significantly higher variance difference, asymptotically reaching almost constant uncertainties towards the open ocean. For some corrections, the median values fluctuated around the mean, including at the coastal band (<10 km). This applied to WTC (40 ± 30 cm2), DTC (4 ± 2 cm2), ionospheric correction (1 ± 1 cm2), and tidal correction (1300 ± 500 cm2) where the initial decrease was within the fluctuation amplitude. This pattern can be explained by the lack of skill in altimeter SSHA when the coastal retrackers were not applied. Due to the footprint differences depending on the direction [60], the magnitude of this problem depends on the track geometry with respect to the coast. When the coast was sufficiently far away, the variance differences diminished. A different pattern was observable for the sea state bias (8 ± 4 cm2), which showed an increase in variance (with a positive uncertainty interval) in the first 6 km. Lastly, DAC had a slight declining trend in median variance differences from 15 km onward and a similar decline towards the coast. The initial trend was 3 cm2 per km, and the backwards trend had a slope of −1 cm2 per km (with an average of 60 ± 20 cm2). This might indicate the peak in performance before the coastal band, where the errors of the DAC model due to bathymetry uncertainties [36] compete with the increased variability of barotropic waves propagating and dissipating in the shallow water.
The spatial distribution of PNR for each alternative correction is provided in the Supplementary Materials for completeness.
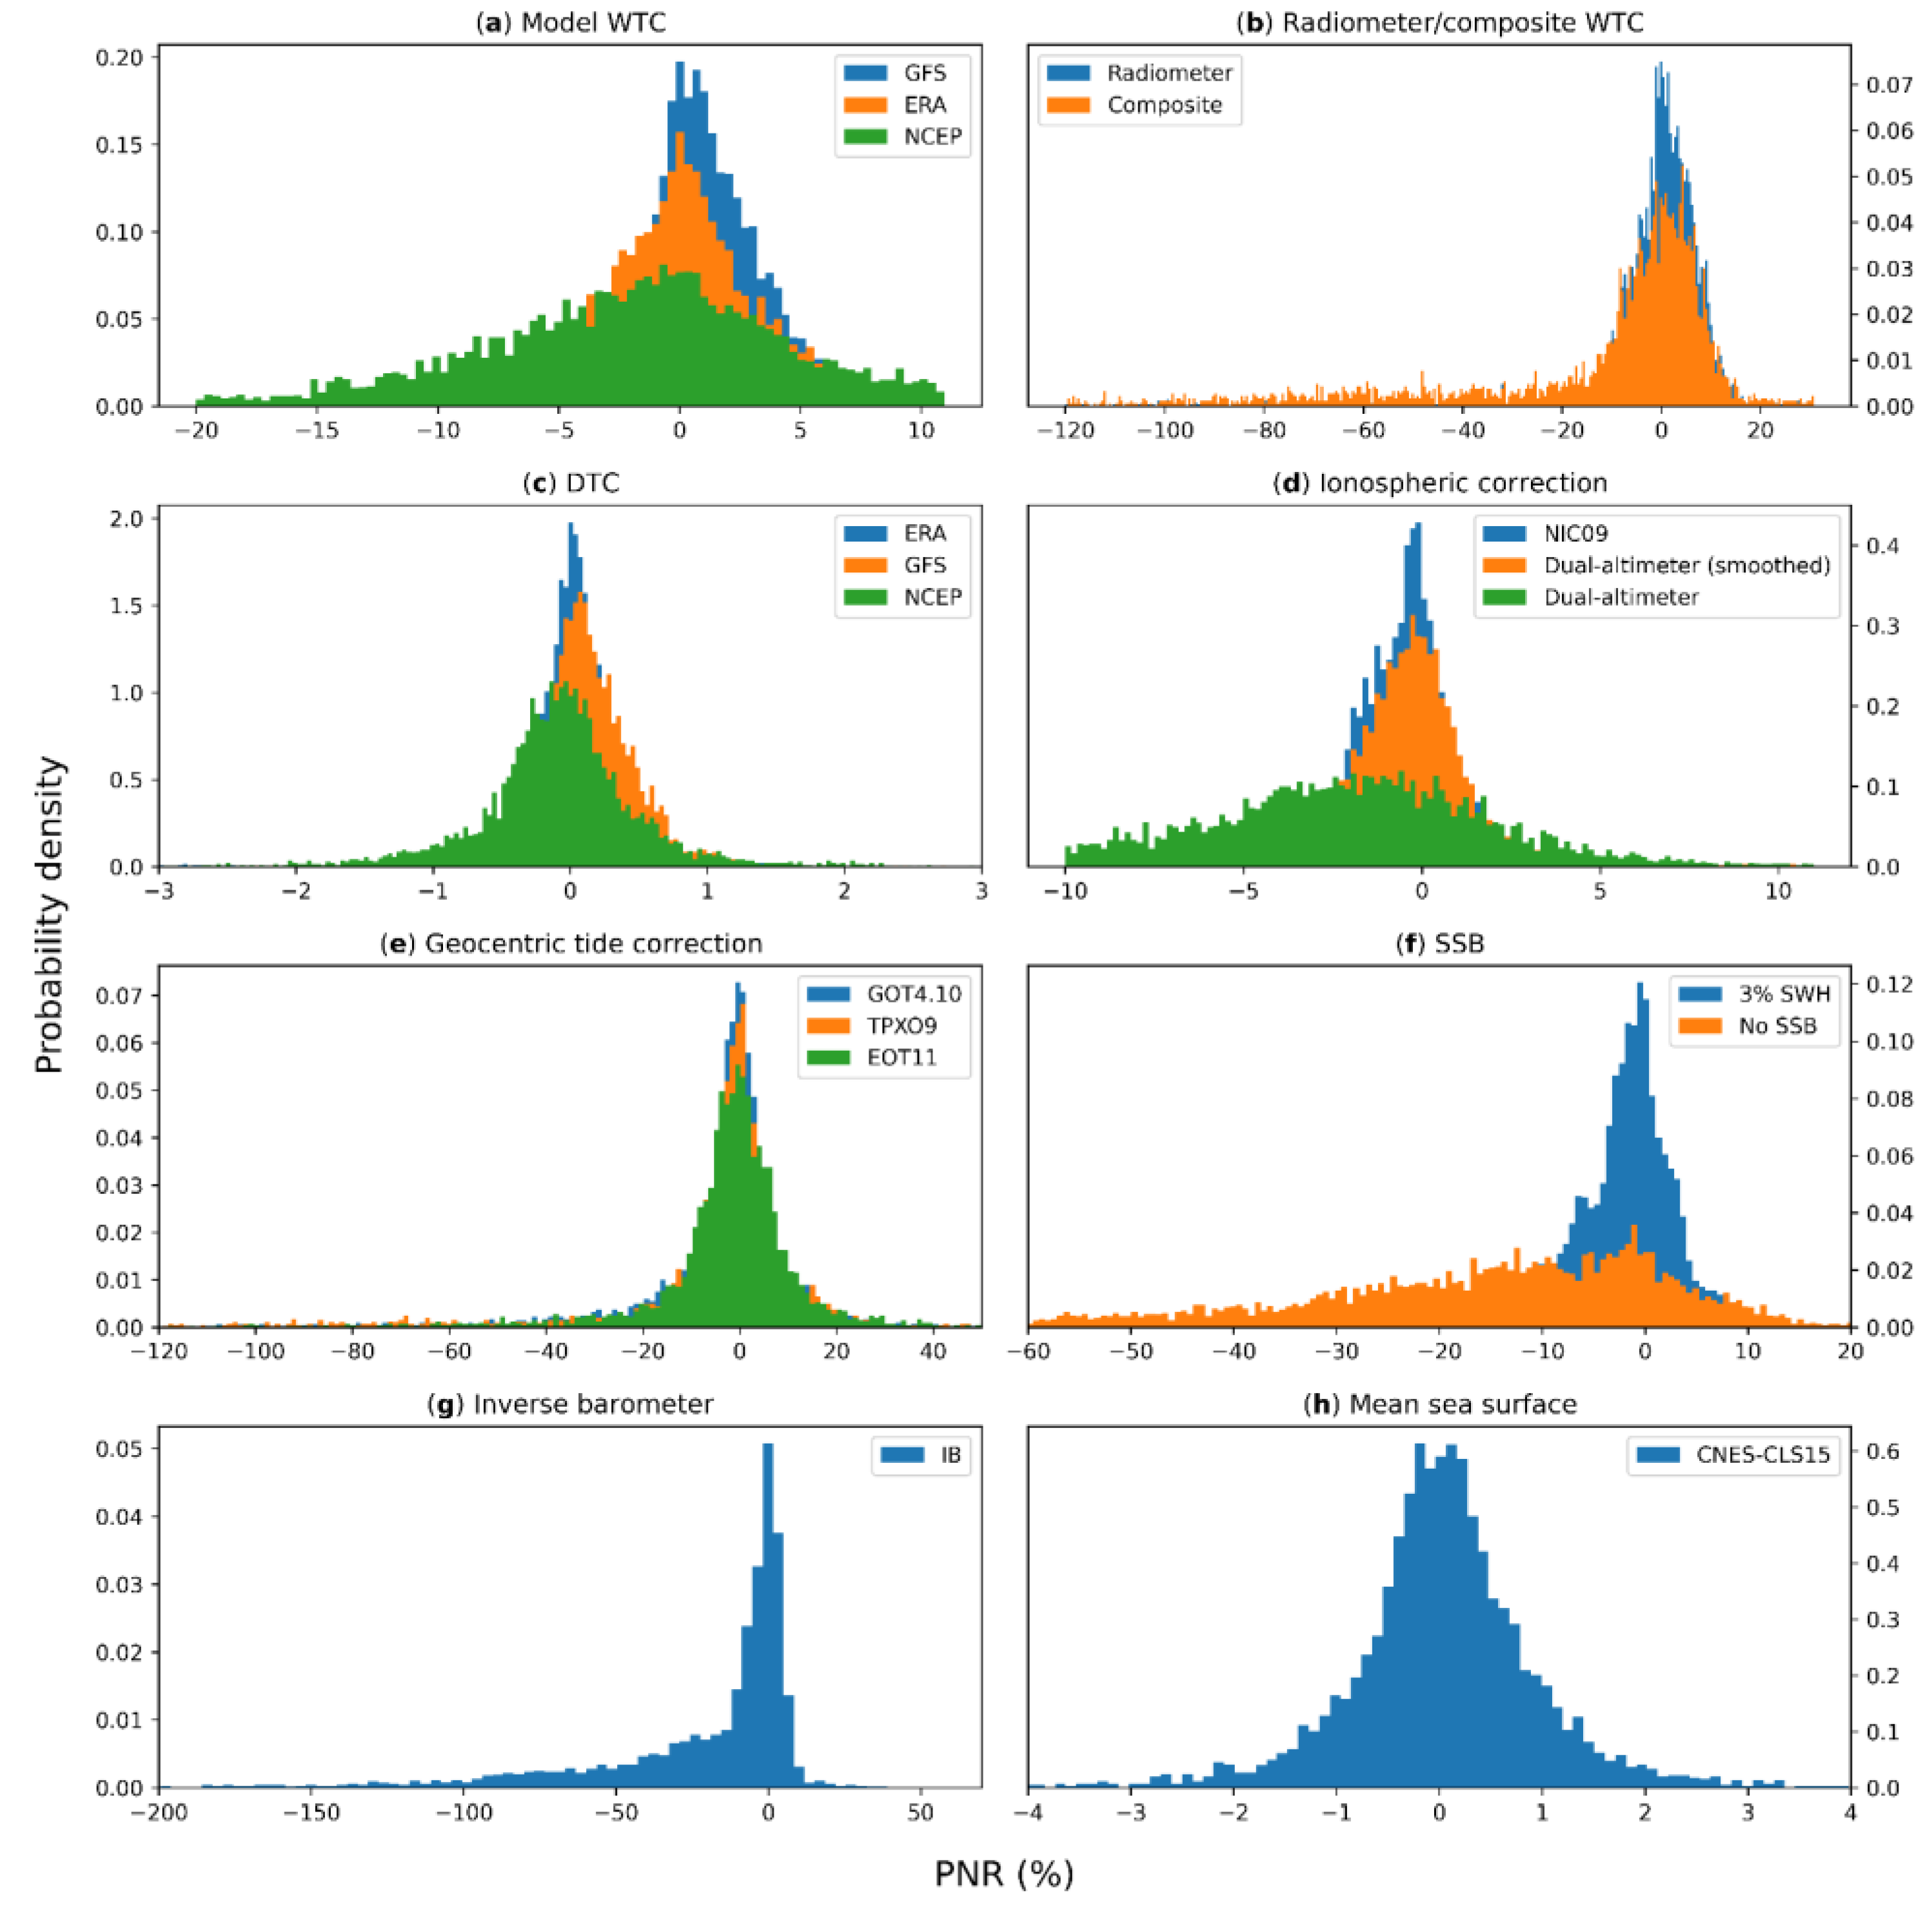
Figure 4 shows the histograms of normalised variance differences, the standard correction variance minus the variance of a different version of the correction, denoted the PNR. By this definition, a positive PNR means the alternative correction gives an SSHA with a smaller variance, implying an improvement.
For WTC, we tested five corrections (three on panel a, two on panel b). The highest mean and the lowest scale were for SSHA variance from GFS WTC (1 ± 2%), followed by ERA-Interim (0 ± 3%), NCEP (−1 ± 7%), radiometer WTC (1 ± 8%), and composite WTC (1 ± 10%). NCEP showed some negative skew, just like the radiometer WTC and composite WTC. ERA-Interim and GFS both had a positive but weak skew. The poor performance of the radiometer WTC was unexpected; however, this study only considered the coastal zone with limited coverage of the open ocean, where we expected the radiometer-derived correction to perform best.
The DTC showed similar results to the model WTC, but an even narrower spread and difference from the standard (ECMWF) solution. The best performing DTC was from GFS (0.1 ± 0.3%), followed by ERA-Interim (0 ± 0.2%), and NCEP (−0.2 ± 0.4%). Unlike the WTC, all three corrections were normally distributed, having no significant skew.
For the ionospheric correction, both the NIC09 climatology and smoothed dual-altimeter correction had similar means and scales (−1 ± 3%) but the smoothed dual-altimeter correction had a stronger negative skew. By far, the worst performing was raw dual-altimeter correction, which had a mean of −4% and a scale of 5%. These results also prove the suggestion that spatial scales under 100 km were filtered out [53].
The tidal correction had similar results for all three additional tidal corrections, with approximately the same mean of −2% and a scale of 10%. The SSB correction with 3% SWH performs similarly to the standard correction (−2 ± 5%); however, removal of the correction caused a strong increase in SSHA variance (−15 ± 20%). On the other hand, some CP appeared to have lower variance without the application of SSB.
The most divergent pattern appeared for the IB correction. The distribution (−5 ± 25%) was highly negatively skewed, with hardly any positive values appearing. It appeared that the IB correction without a barotropic ocean response was not sufficient to suppress the observed variance [76]. The MSS variance differences had an almost normal shape, with a mean of 0% and a scale of <1%. Both MSS products appeared to be performing similarly in this region.

3.2. Retrackers

Although retrackers are formally not considered an altimetry correction, we presented the differences in SSHA and its variance, just as we did for the range and the geophysical corrections. The spatial distribution of PNR for each alternative retracker is provided in the Supplementary Materials.

3.2.1. Comparison of Retracked Sea Surface Height Anomalies

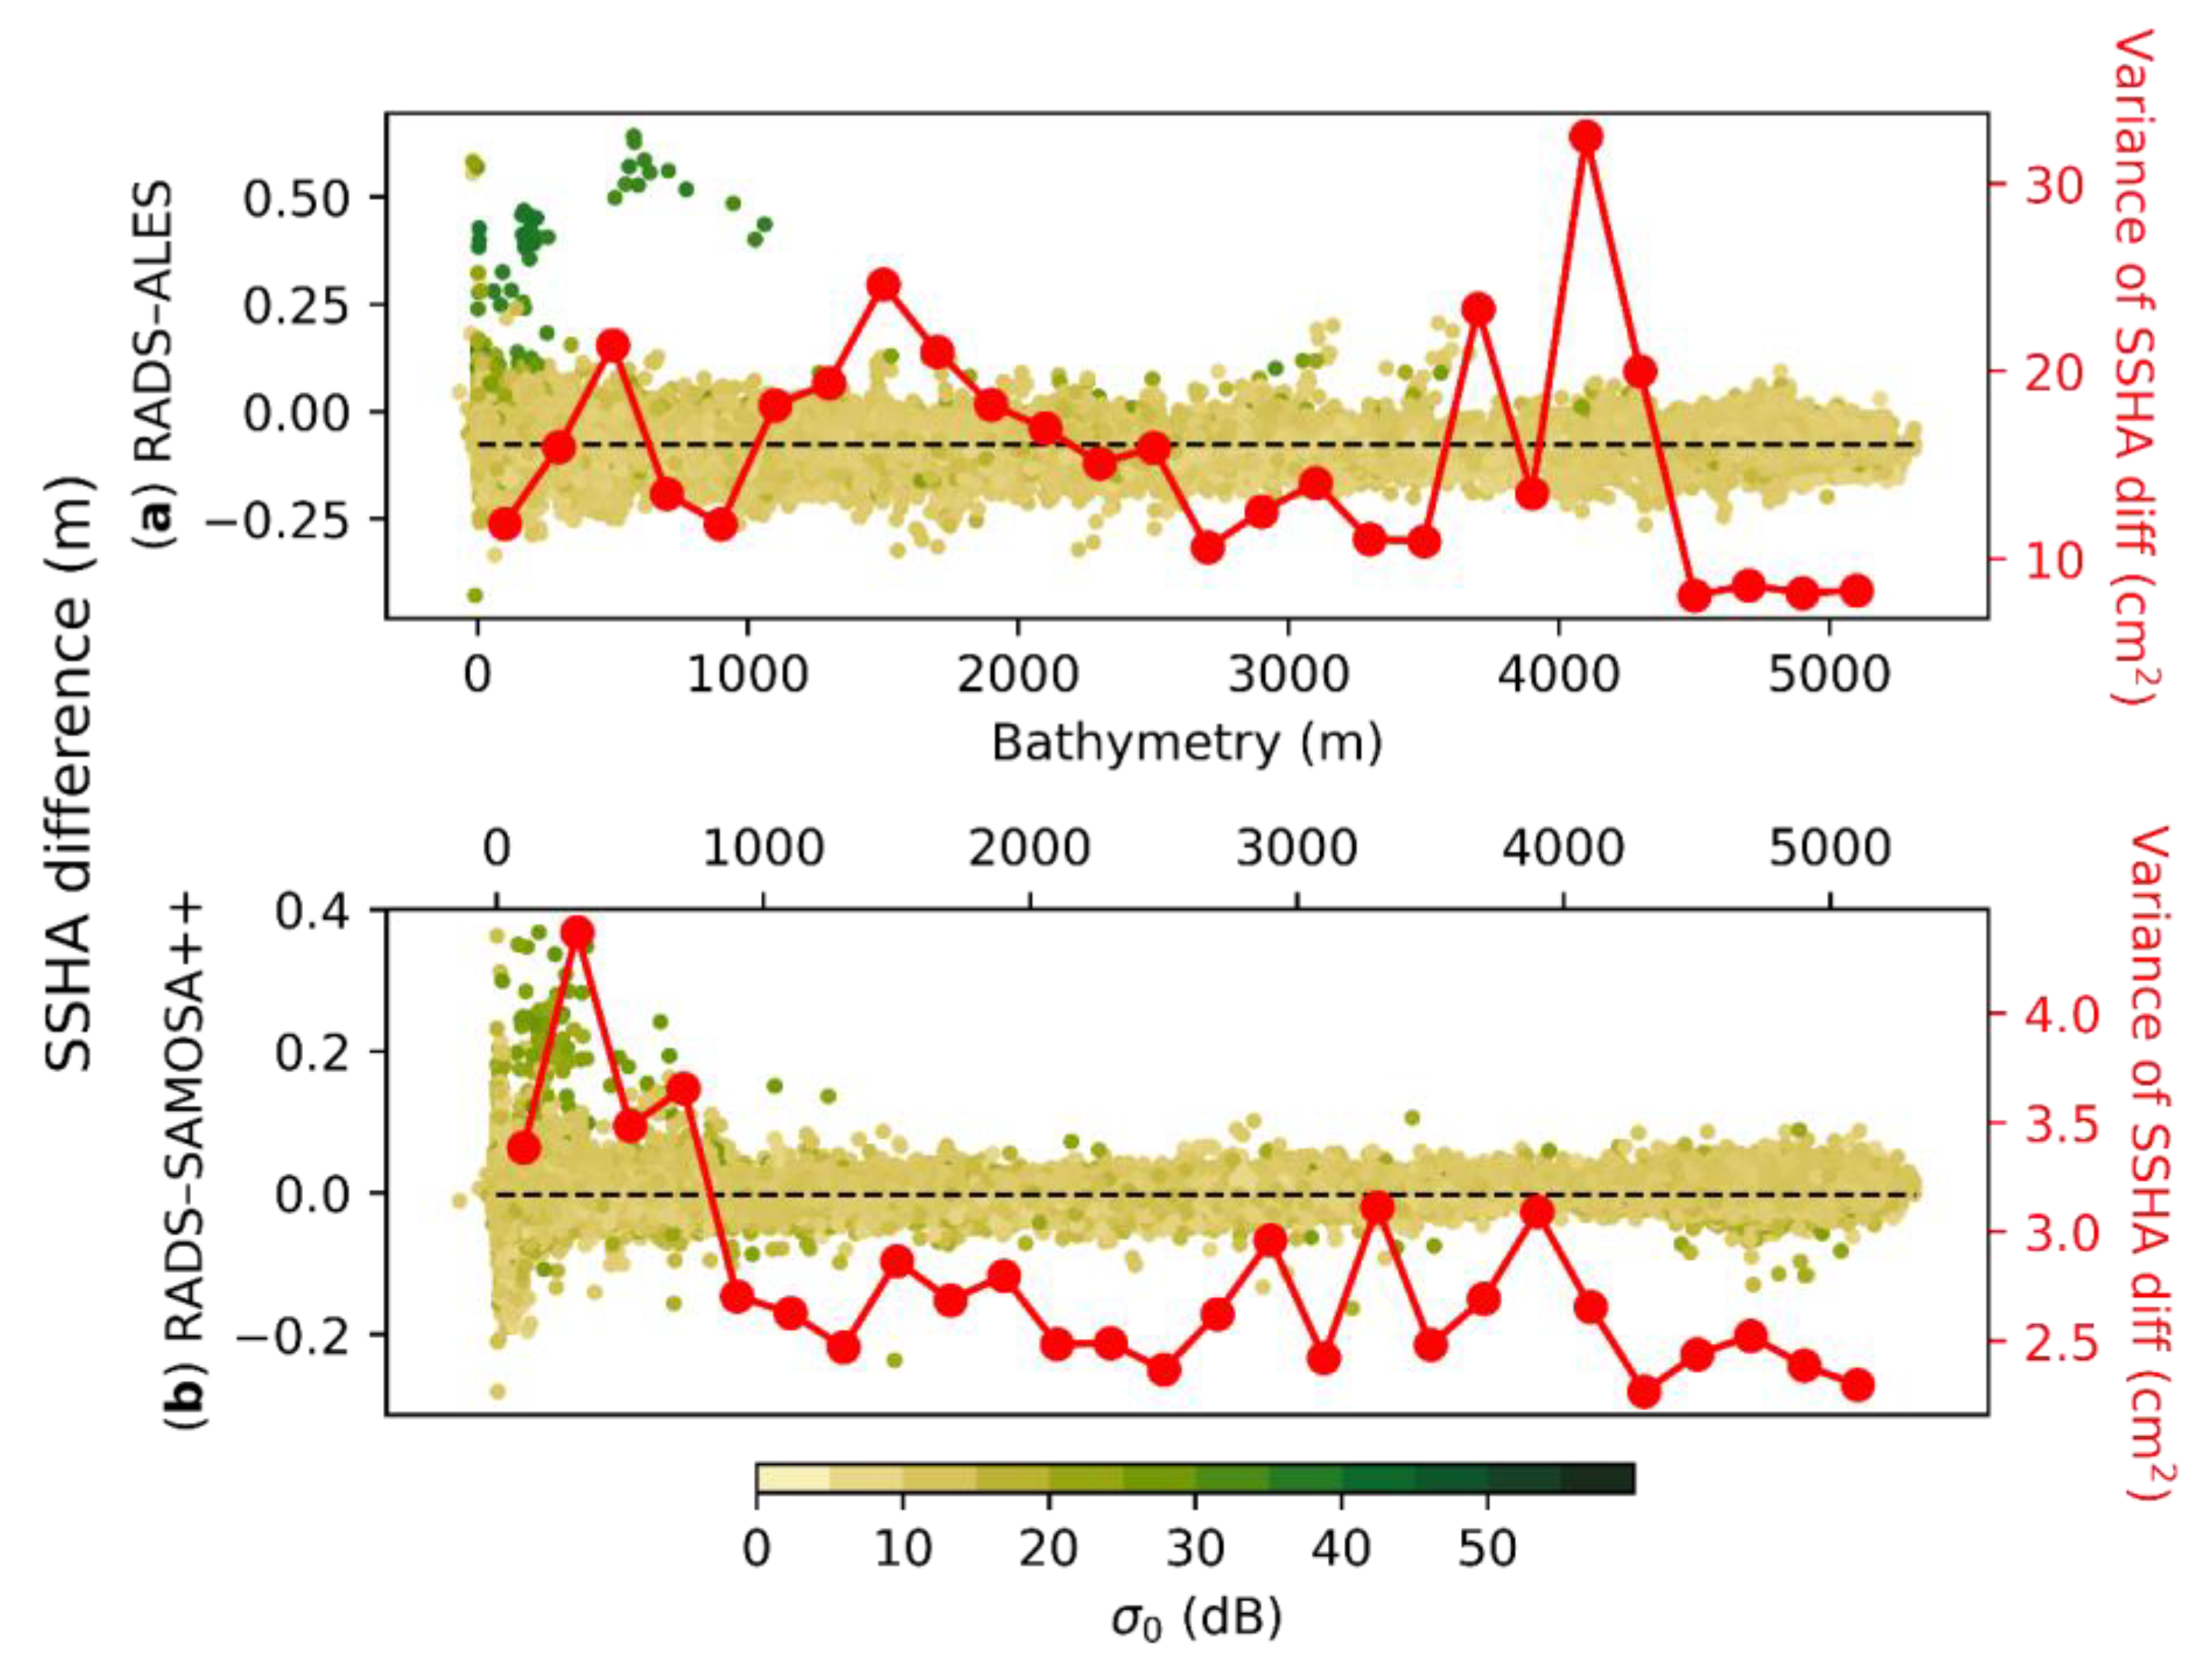
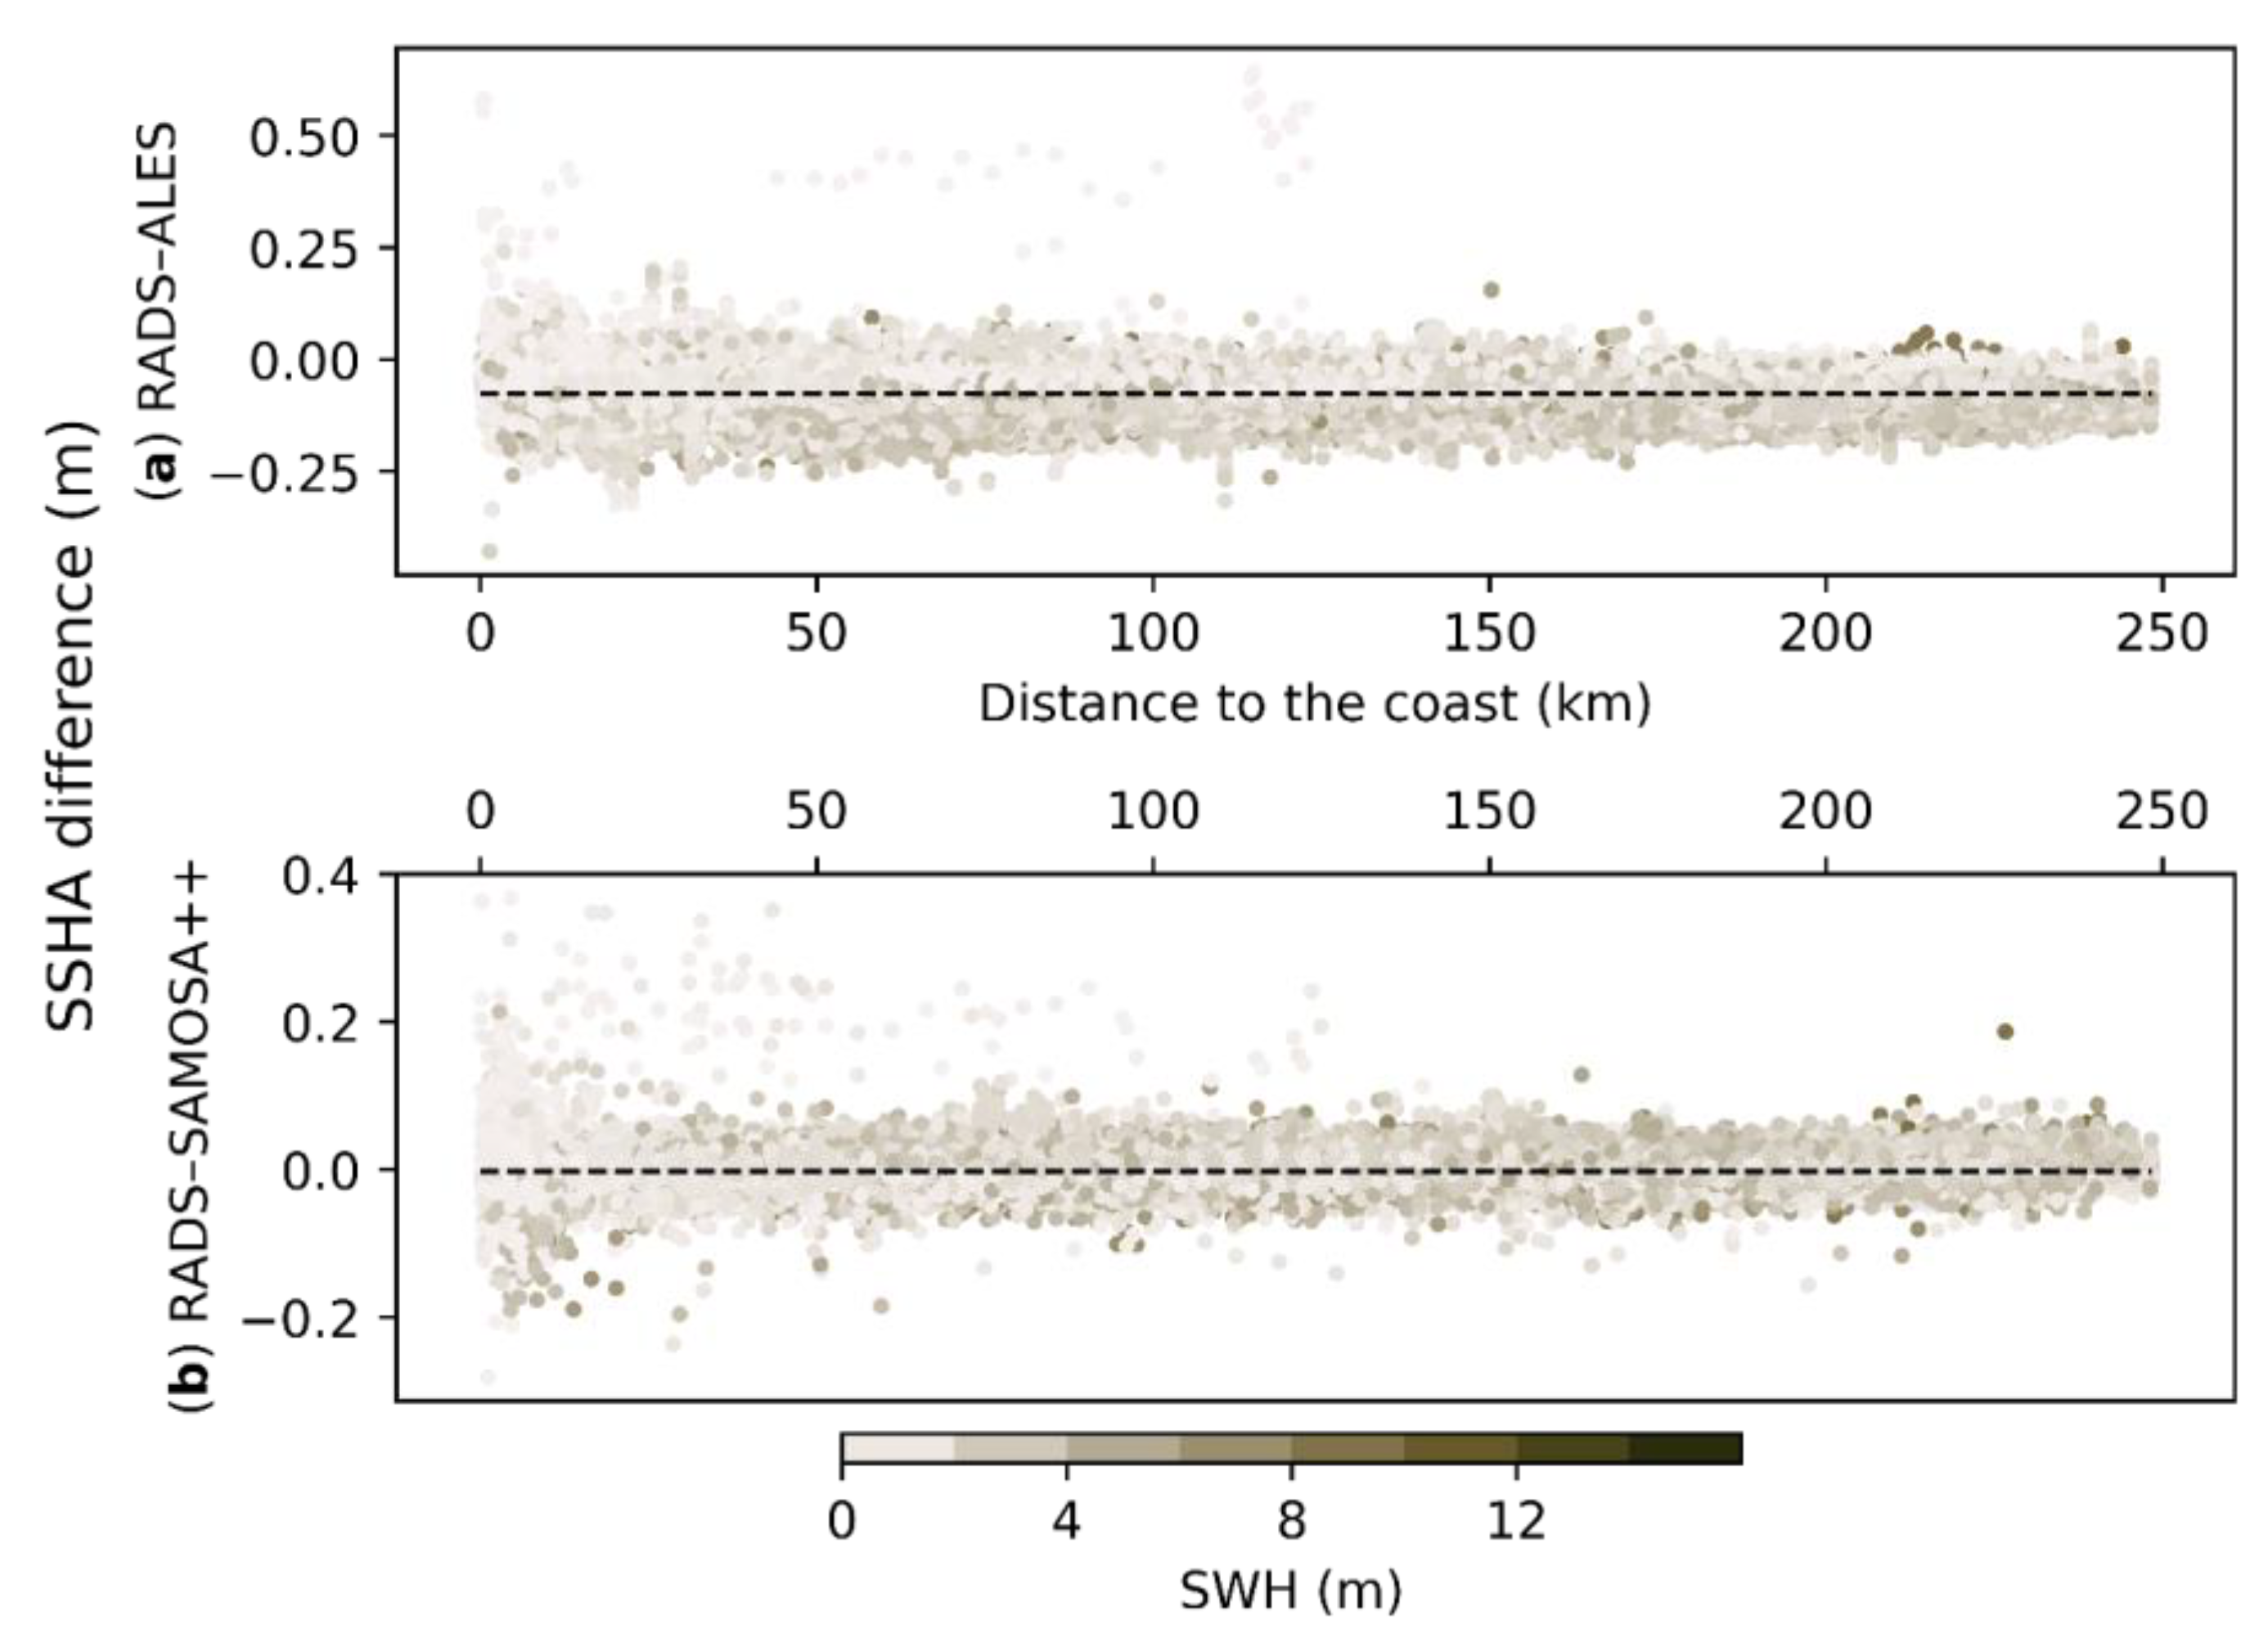
We compared the difference in SSHA from the baseline RADS, ALES, and SAMOSA++ retrackers with the bathymetry (Figure 5) or the distance to the coast (Figure 6). The colormap provided is the backscatter coefficient and significant wave height (SWH), respectively. The differences are shown between RADS and either ALES or SAMOSA++ SSHA.
The differences in Figure 5 show that the spread of the values was smaller for SAMOSA++ than ALES, just as indicated by the mean of the differences. This is confirmed by Table 5, which contains the statistics of those differences. The mean was negative for both, meaning that the SSHA values these retrackers retrieved were larger than those from RADS. The larger mean value magnitude for ALES can also be caused by the correction for bias versus other SRAs applied to ALES data. The variance of each 200-m isobath bin showed that the mean variances of ALES were almost 5-fold the values of SAMOSA++. The plot also showed that most points that can be considered outliers had an anomalously high backscatter coefficient in both SAMOSA++ and ALES. The same can be observed in Figure 6, where outliers have very low SWH.
Viewing the distribution of those differences in Figure 5, the largest spread happened around the coast (the variance for those bins exceeds 4 cm2 for SAMOSA++). For ALES, the spread was less concentrated in that region.
Clearly, the majority of points did not exhibit a relationship between the SSHA differences and SWH/σ0, but some outliers were clearly visible and disproportionally located in the shallow water. The fact that these points are outliers is a positive. The coastal retrackers are designed to tackle the speckle “noise”, so a higher-than-usual deviation from RADS suggests that the procedure is working. The sign for those deviations was normally positive, which meant that the coastal retracker SSHA was lower than the RADS SSHA.
To conclude, SSHA differences showed good performance for both ALES and SAMOSA++, but ALES exhibited a higher spread of values.

3.2.2. Variance of Sea Surface Height Anomalies

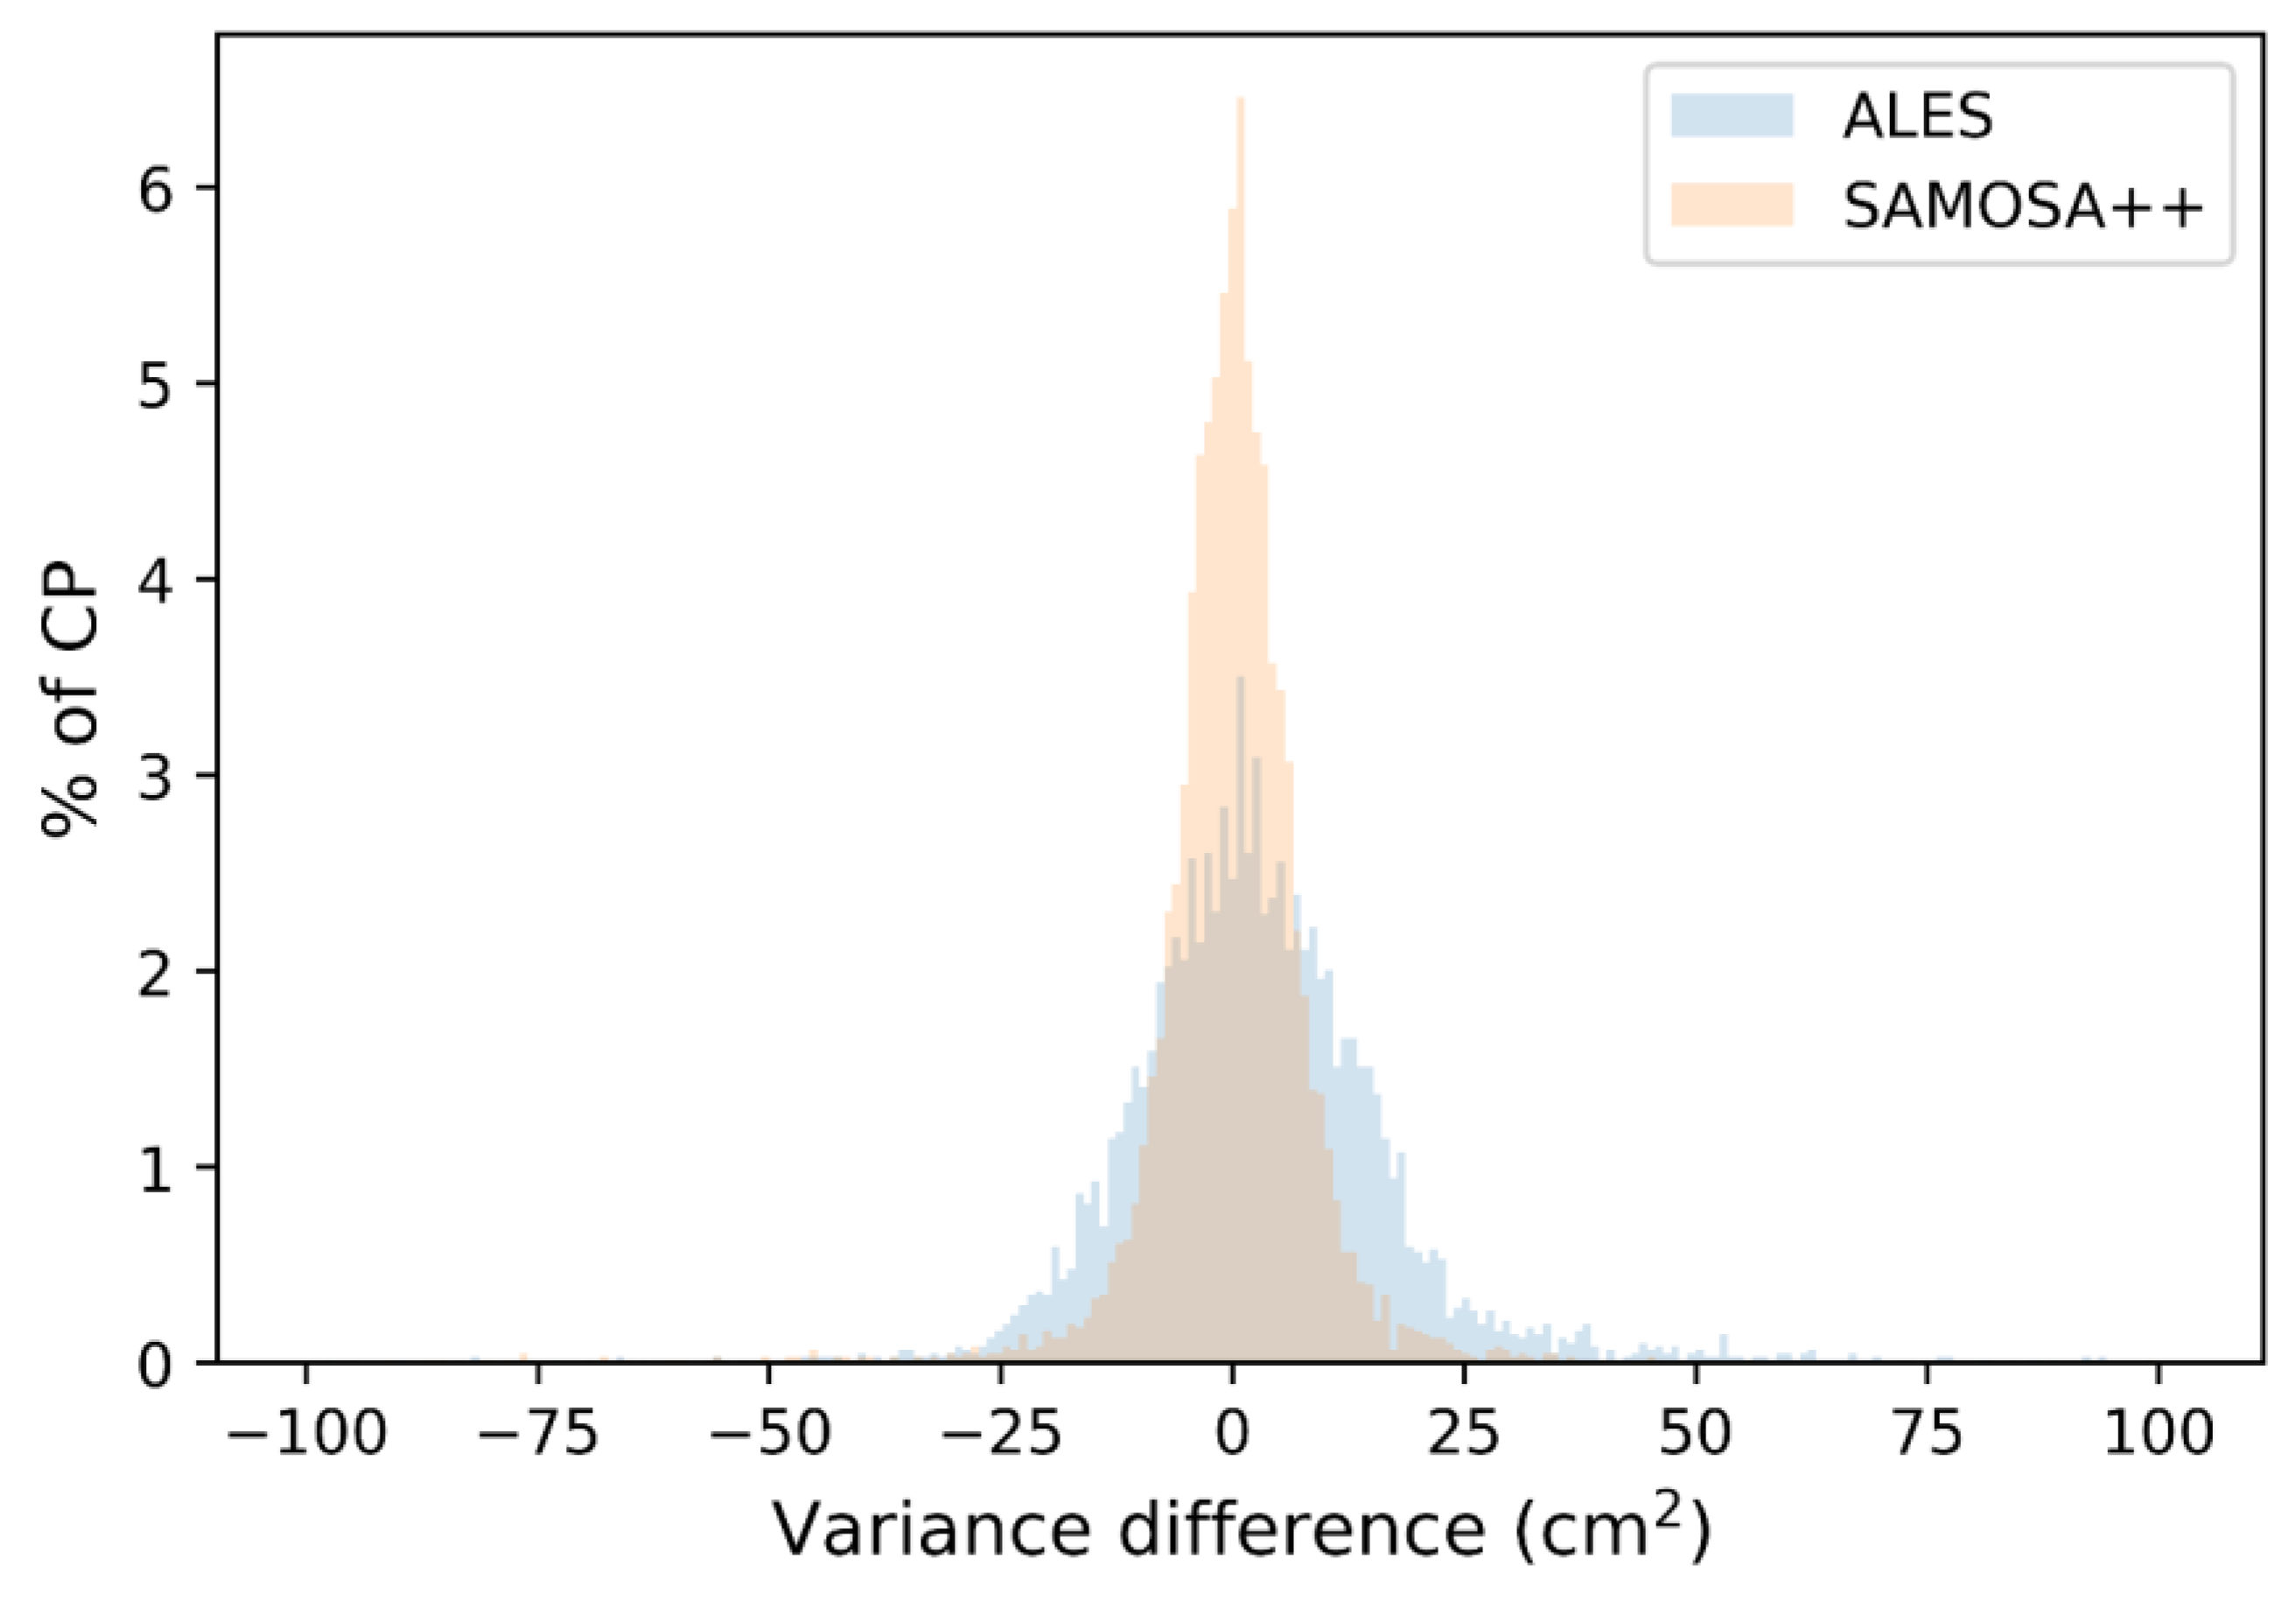
The observed variance differences between RADS and ALES and RADS and SAMOSA++ were similar (Figure 7). The mean value of these histograms was close to 0 cm2 for both, but SAMOSA++ had a lower spread (a scale of 12 cm2) than ALES (a scale of 20 cm2), indicating more consistent results. ALES also displayed higher kurtosis (tailedness). This meant that there were outliers that either strongly underperformed or were superior. It is possible that the performance was highly regional and might have depended on other local conditions of the sea, for instance, the presence of sea ice (which happens during the winter north of Newfoundland).
To better understand the performance as a function of distance from the coast, we plotted the variance difference between the three pairs of retrackers—the standard and SAMOSA++ (orange curve), the standard and ALES (green curve), and between ALES and SAMOSA++ (blue curve), as shown in Figure 8. The shaded intervals are the interquartile ranges (IQR), but the markers show median values. ALES had a negative median difference, while SAMOSA++ had almost neutral values (>−2 cm2). The negative variance differences ranged between 0 and −8 cm2. The uncertainty intervals spanned both positive and negative sides; therefore, it was not clear if any improvement was tangible. There was a clear difference between ALES and SAMOSA++, where SAMOSA++ performed better than ALES. Their difference was almost zero in the first 4 km from the coast, which meant that ALES was performing similarly well to SAMOSA++.

4. Discussion

Unreliable altimeter corrections are a hindrance to obtaining climate-quality coastal sea level data. The results suggest that all range and geophysical corrections tend to have a higher level of uncertainty in the coastal zone of land–ocean interaction (within 5 km of the coast), which was difficult to reach before the advances in conventional altimeter reprocessing with coastal retrackers and the availability of SAR altimetry. Nevertheless, the standard corrections appeared to improve the sea level signal, even if marginally. A higher spread near the coast also suggests a discrepancy between different coastal areas. This has often not been reported in previous research as the results are usually presented just for the central tendency statistic (mean or median).
We found that the standard corrections, typically used for L2 Sentinel-3A sea-level products, were mostly as good as other corrections available from RADS. The DTC was one of the least affected by the change in the correction product. However, the product choice will affect the results as each product was based on a model with different temporal and spatial sampling [49,77]. Moreover, coastal zones might still be affected by digital elevation model (orography) errors due to surface height if the gradients are steep [77], which was also illustrated by a high proportion of negative variance differences for DAC correction. As the pressure field change had a longer length and time scale, DTC was less affected than DAC and WTC. Unlike DTC, WTC caused the strongest variance reduction of all range corrections. The correlation length scales of the WTC were 80 km in space and 1 h in time [78]. Unlike some other missions (e.g., CryoSat-2), Sentinel-3A carried a two-channel MWR, which can provide localised and more accurate estimates of the water vapour content of the troposphere [47]. In the coastal zone, MWR was affected by land contamination and has a footprint of up to 23 km [79]. Fernandes et al. (2018) [52] found that land and ice contamination affected the first 20–25 km, which was similar to the footprint but dissimilar to our findings and some earlier studies [46,76]. One of the reasons was their inclusion of radiometer quality flags, which caused the deletion of MWR WTC in the nearshore zone. Model-based WTC showed better performance than radiometer- and composite-based WTC. Composite WTC had been marked as unreliable in previous studies, with a significant fraction of data missing, the presence of offsets, and a lack of spatial variability [47]. For both DTC and WTC, we found that the GFS provided the best reduction in SSHA variance. This could be attributed to the higher resolution of GFS compared to reanalysis-based products provided by RADS, as well as assimilation procedure differences [47]. We found no other studies that included GFS in their assessments. Increased temporal resolution below 3 h (available for ERA-5) was unnecessary due to the lack of smaller-scale processes observed in the currently available reanalysis [49]. Overall, the use of reanalysis for tropospheric corrections was unnecessary for Sentinel-3A due to the shortness of the record [46,54]. The findings in favour of its use often covered periods before 2010, when ECMWF operational analysis became available at a higher resolution [77].
The ionospheric correction had the lowest impact on SSHA variance. The dual-altimeter-provided correction was available on Sentinel-3A (unlike CryoSat-2 and AltiKa); however, the results were worse than with GIM, especially in the coastal zone. The range measurements used in the derivation were retracked with standard retrackers, which explains the loss of data (not shown in this study) during higher sea ice concentrations over high latitude seas and close to the coast. Some of the issues were rectified by smoothing (a 200 km cut-off) [30,53], but it can also propagate near-coast land contamination-caused errors to a larger area [80]. GIM should not be affected by the presence of land [81]; however, we see from Figure 3 that the first 6 km had a lower variance difference than the rest of the record. This can be a result of the increasingly unreliable range (used to calculate the SSHA) provided by the standard retracker. Scaling GIM data to the altimeter altitude was necessary to avoid the inclusion of total electron content above the satellite [80,82]. The scaling was applied to RADS data [82], and our study should reflect that. However, the application of a single scaling factor might be insufficient to remove the plasmaspheric effects [83]. As the record length is short, the effect of the solar (sunspot) cycle on this scale is not significant [80].
The IB correction had a high impact on SSHA variance, especially in the coastal zone. The replacement with static IB caused a strong deterioration in noise suppression, which indicates that a high-frequency instantaneous barotropic response component was required [34]. Improvements were more limited within 10 km from the coast. The fairly coarse resolution of the DAC gridded product (0.25° × 0.25°) and coarse forcing (reprojected onto a 1-degree grid at a 6 h resolution [34]) provided by the ECMWF analysis was one of the reasons for the correction to underperform [76] close to the coast. Using ERA-Interim for the forcing can improve the results [65,84]. However, this product was not available through RADS or AVISO+.
The geocentric tide correction (ocean and loading tides) contributed to the largest variance reduction of the SSHA. The performance of FES2014b and other products was good, with a small decrease in variance reduction closer to the coast. A significant issue for tidal modelling was bathymetry; FES2014b implements regional bathymetry databases that are superior to global bathymetry like GEBCO. There are still bathymetry accuracy issues in very shallow waters, coastward of a 20-m isobath, which can affect the bottom friction budget [36]. FES2014, just like the other corrections, assimilates conventional (low-resolution) SRAs that are provided without the coastal retracking. This poses a risk of introducing errors in the coastal zone, but previous research has found that assimilative models overall perform better than purely hydrodynamic models [85]. Compared to other tidal corrections, we found that EOT11a had the best results (but is variable depending on the place and overall underperforms versus FES2014b), while TPXO9v2 had the least improvement and the most CP with a decreased PNR. This was in disagreement with Lyard et al. [36]; however, they used global solutions rather than regional ones. The results considering GOT4.10 were similar (a steep underperformance close to the coast). They also found that in the coastal region, EOT11a had almost as large tidal component differences to tide gauges as the previous generation tidal corrections (FES2004 and DTU10). The tidal correction did not include internal (baroclinic) tides, which have been suppressed by low-pass filtering of assimilated along-track data [36]. We decided not to analyse solid Earth and pole tides; pole tide has a very small effect on the variance (but might affect trends [84]), while solid Earth tide is well-established [40,41]. A new solution for pole tide takes into account more parameters and removes the mean pole drift [84,86].
The weakest link in this study was the SSB correction. The Jason-2-based product was likely to be unsuitable for a SAR altimeter, but it seemed to work equally well as the simple parametric model. Overall, since SSB correction was designed for the open ocean, it was not surprising that coastal areas might underperform [3,58]. As Jason-2 is a Ku-band altimeter, the electromagnetic and skewness bias should be the same for Sentinel-3A (minus the issues with heterogeneities in a larger footprint) [87]. However, there were also tracker and retracker biases that appeared due to imprecise midpoint location on the leading edge and retracker errors [58], which were altimeter- and retracker-specific. The retracker can cause correlated errors (also called intra-1Hz covariant errors [88]) in both SSH and SWH parameters [89], which can be removed by estimating a simple linear relationship between SWH and SSH, similar to our simple parametric model. The improved SSB models appeared to not significantly reduce the variance in SSHA as shown by Peng and Deng [14]; therefore, we most likely need a SAR-specific SSB.
Analyzing the comparison between RADS (the standard SAMOSA2 [90] retracker) and coastal retrackers, the results suggest that, at least for 1 Hz, the coastal retrackers do not show a significant benefit in variance reduction. We noted that the coastal retrackers were developed primarily to improve conventional, pulse-limited altimetry precision, and so this result could be taken as advocacy for using standard SAR altimetry near the coast. As expected, the deviations between RADS and coastal retrackers were small further from the coast. However, ALES performs worse with these as well, showing a larger spread in values. This was expected, as the retracker only uses a part of the waveform, whereas it could use the whole waveform in the case of an oceanic waveform [16]. Comparing SAMOSA++ with ALES, SAMOSA++ performed better in all cases (although minimally between 2 and 6 km from the coast). The lack of reliability within the first 6 km can be seen in RADS, which means it also affected similarly performing coastal retrackers. This was also observed for the Australian coasts, where Peng and Deng [90] found a significant loss of quality within 5 km of the coast for the 20 Hz version of SAMOSA2-retracked Sentinel-3A SSH. However, a comparison to 1 Hz was inexact due to the measurements being shifted up to 3 km from their tagged location.
A limitation of this study was the comparatively large area of evaluation. Due to the different coastal morphology, the shelf geometry, and the dynamic length scales, the obtained results varied sub-regionally and increased the spread of variances. A solution could also be to split the study area into subregions and report the results separately. A robust split would have a similar length across the shelf and comparable time and length scales of ocean dynamics. Another limitation we found was the lack of next-generation corrections applied in this study. For WTC, it would have been useful to test GPD+ [73], which showed a further variance reduction [52] and skillfully integrated the mission’s radiometer data. For DTC, ERA5 has been recommended [77]. We could also test T-UGO- and ERA5-based DAC-ERA5, which also benefits from improved bathymetry and could provide superior results in the coastal zone [91]. For tidal correction, we could test EOT20 [92], as EOT11 is more outdated than the other two options. The selected alternative MSS is also relatively outdated compared to DTU18, which should be compared to CNES-CLS18 [93] or even CNES-CLS22 instead [94]. The SSB we used was simplistic and rather unsuitable for SAR altimetry. In the future, the BM4 parametric model [14,74,95] or ALES+-based regional model should be studied [33,96].
A useful addition to this study would be to evaluate 20 Hz data in addition to 1 Hz data. The performance of the corrections at 20 Hz was believed to be insufficient, especially for corrections with higher variability [77].

5. Conclusions

The largest contributors to variance reduction in the SAR altimetry-retrieved sea level signal, in descending order from largest, are tides, dynamic atmosphere correction, wet tropospheric correction, and sea state bias. Geophysical corrections overall have a stronger effect than range corrections; however, these corrections are part of sea level variability and are normally removed to avoid aliasing. Of range corrections, wet tropospheric correction contributed the most towards variance reduction; therefore, the community’s recent focus on improving WTC was wholly substantiated. The near-coast band (<5 km from the coast) displayed decreased noise reduction in SSHA corrected with standard corrections for all variables, indicative of standard correction underperformance in the coastal zone.
For our study site, we found that the default/standard corrections were not inferior to the alternative corrections. Most corrections underperformed—displaying higher SSHA variability—closer to the coast while also not significantly improving variance reduction elsewhere.
Coastal retrackers provided similar results to RADS in the majority of areas. The largest deviation from RADS SSHA occurred in shallow water (<300 m isobath) and in areas with high backscatter and low SWH. SAMOSA++ outperformed ALES in the coastal strip (<10 km from the coast). Nevertheless, RADS provided similar variances to both coastal retrackers.

Supplementary Materials

The following supporting information can be downloaded at: https://www.mdpi.com/article/10.3390/rs15041132/s1, Figures displaying the spatial distribution of PNR for each retracker and correction.

Author Contributions

Conceptualization, A.A., S.R., and J.B.; methodology, A.A. and S.R.; software, A.A. and S.R.; validation, A.A. and S.R.; formal analysis, A.A.; investigation, A.A.; resources, A.A. and S.R.; data curation, A.A.; writing—original draft preparation, A.A.; writing—review and editing, A.A., J.B., and S.R.; visualization, A.A.; supervision, J.B. and S.R.; project administration, A.A.; funding acquisition, J.B. All authors have read and agreed to the published version of the manuscript.

Funding

This research was funded by the European Research Council (ERC) under the European Union’s Horizon 2020 Research and Innovation Programme grant agreement No. 694188 (GlobalMass) and the Natural Environmental Research Council (NERC) GW4+ Doctoral Training Partnership studentship, grant number NE/L002434/1.

Data Availability Statement

RADS data can be accessed through the RADS software, which is downloadable from the GitHub repository (https://github.com/remkos/rads, accessed on 10 January 2023). SAMOSA++ L2 datasets can be generated with preset coastal processing parameters using the SARvatore for Sentinel-3 service of the European Space Agency’s Altimetry Virtual Lab (ESA AVL) on EarthConsole (https://earthconsole.eu/altimetry-virtual-lab/, accessed on 10 January 2023). The ALES dataset can be downloaded from openADB (https://openadb.dgfi.tum.de/, accessed on 10 January 2023). Both AVL and openADB require registration to access their respective services.

Conflicts of Interest

The authors declare no conflict of interest. The funders had no role in the design of the study, in the collection, analysis, or interpretation of data, in the writing of the manuscript; or in the decision to publish the results.

References

  1. Cazenave, A.; Palanisamy, H.; Ablain, M. Contemporary sea level changes from satellite altimetry: What have we learned? What are the new challenges? Adv. Space Res. 2018, 62, 1639–1653. [Google Scholar] [CrossRef]
  2. Fletcher, K. Sentinel-3 ESA’s Global Land and Ocean Mission for GMeS Operational Services (ESA SP-1322/3, October 2012); European Space Agency: Noordwijk, the Netherlands, 2012. [Google Scholar]
  3. Vignudelli, S.; Birol, F.; Benveniste, J.; Fu, L.-L.; Picot, N.; Raynal, M.; Roinard, H. Satellite Altimetry Measurements of Sea Level in the Coastal Zone. Surv. Geophys. 2019, 40, 1319–1349. [Google Scholar] [CrossRef]
  4. Dufau, C.; Martin-Puig, C.; Moreno, L. User Requirements in the Coastal Ocean for Satellite Altimetry. In Coastal Altimetry; Springer: Berlin, Germany, 2011; pp. 51–60. [Google Scholar] [CrossRef]
  5. Scozzari, A.; Gómez-Enri, J.; Vignudelli, S.; Soldovieri, F. Understanding target-like signals in coastal altimetry: Experimentation of a tomographic imaging technique. Geophys. Res. Lett. 2012, 39. [Google Scholar] [CrossRef]
  6. Roesler, C.J.; Emery, W.J.; Kim, S.Y. Evaluating the use of high-frequency radar coastal currents to correct satellite altimetry. J. Geophys. Res. Oceans 2013, 118, 3240–3259. [Google Scholar] [CrossRef] [Green Version]
  7. Andersen, O.B.; Scharroo, R. Range and Geophysical Corrections in Coastal Regions: And Implications for Mean Sea Surface Determination. In Coastal Altimetry; Springer: Berlin, Germany, 2010; pp. 103–145. [Google Scholar] [CrossRef]
  8. Gommenginger, C.; Thibaut, P.; Fenoglio-Marc, L.; Quartly, G.; Deng, X.; Gómez-Enri, J.; Challenor, P.; Gao, Y. Retracking Altimeter Waveforms near the Coasts a Review of Retracking Methods and Some Applications to Coastal Waveforms. In Coastal Altimetry; Springer: Berlin, Germany, 2011; pp. 61–101. [Google Scholar] [CrossRef]
  9. Raney, R. The delay/Doppler radar altimeter. IEEE Trans. Geosci. Remote Sens. 1998, 36, 1578–1588. [Google Scholar] [CrossRef]
  10. Dinardo, S.; Fenoglio-Marc, L.; Becker, M.; Scharroo, R.; Fernandes, M.J.; Staneva, J.; Grayek, S.; Benveniste, J. A RIP-based SAR retracker and its application in North East Atlantic with Sentinel-3. Adv. Space Res. 2021, 68, 892–929. [Google Scholar] [CrossRef]
  11. Gommenginger, C.; Martin-Puig, C.; Amarouche, L.; Raney, R.K. Review of State of Knowledge for SAR Altimetry over Ocean; University of Southampton: Southampton, UK, 2014. [Google Scholar]
  12. Han, W.; Stammer, D.; Thompson, P.; Ezer, T.; Palanisamy, H.; Zhang, X.; Domingues, C.M.; Zhang, L.; Yuan, D. Impacts of Basin-Scale Climate Modes on Coastal Sea Level: A Review. Surv. Geophys. 2019, 40, 1493–1541. [Google Scholar] [CrossRef] [Green Version]
  13. Feng, H.; VanDeMark, D. Altimeter Data Evaluation in the Coastal Gulf of Maine and Mid-Atlantic Bight Regions. Mar. Geodesy 2011, 34, 340–363. [Google Scholar] [CrossRef]
  14. Peng, F.; Deng, X. Improving precision of high-rate altimeter sea level anomalies by removing the sea state bias and intra-1-Hz covariant error. Remote Sens. Environ. 2020, 251, 112081. [Google Scholar] [CrossRef]
  15. Scharroo, R.; Leuliette, E.; Lillibridge, J.; Byrne, D.; Naeije, M.; Mitchum, G. RADS: Consistent Multi-Mission Products. In Proceedings of the Symposium on 20 Years of Progress in Radar Altimetry, Venice, Italy, 24–29 September 2012. [Google Scholar]
  16. Passaro, M.; Cipollini, P.; Vignudelli, S.; Quartly, G.D.; Snaith, H.M. ALES: A multi-mission adaptive subwaveform retracker for coastal and open ocean altimetry. Remote Sens. Environ. 2014, 145, 173–189. [Google Scholar] [CrossRef] [Green Version]
  17. Idris, N.H.; Deng, X. The Retracking Technique on Multi-Peak and Quasi-Specular Waveforms for Jason-1 and Jason-2 Missions near the Coast. Mar. Geod. 2012, 35, 217–237. [Google Scholar] [CrossRef]
  18. Brown, G. The average impulse response of a rough surface and its applications. IEEE Trans. Antennas Propag. 1977, 25, 67–74. [Google Scholar] [CrossRef]
  19. Hayne, G. Radar altimeter mean return waveforms from near-normal-incidence ocean surface scattering. IEEE Trans. Antennas Propag. 1980, 28, 687–692. [Google Scholar] [CrossRef] [Green Version]
  20. Passaro, M.; Rose, S.K.; Andersen, O.B.; Boergens, E.; Calafat, F.M.; Dettmering, D.; Benveniste, J. ALES+: Adapting a homogenous ocean retracker for satellite altimetry to sea ice leads, coastal and inland waters. Remote Sens. Environ. 2018, 211, 456–471. [Google Scholar] [CrossRef] [Green Version]
  21. Schwatke, C.; Bosch, W.; Savcenko, R.; Dettmering, D. OpenADB—An Open Database for Multi-Mission Altimetry. In Proceedings of the EGU2010, Vienna, Austria, 2–7 May 2010; Available online: https://ui.adsabs.harvard.edu/abs/2010EGUGA..1212077S/abstract (accessed on 10 January 2023).
  22. Ray, C.; Martin-Puig, C.; Clarizia, M.P.; Ruffini, G.; Dinardo, S.; Gommenginger, C.; Benveniste, J. SAR Altimeter Backscattered Waveform Model. IEEE Trans. Geosci. Remote Sens. 2015, 53, 911–919. [Google Scholar] [CrossRef]
  23. Cipollini, P.; Makhoul-Varona, E.; Fernandes, J. SCOOP SAR Altimetry Scientific Review. 2017. Available online: https://www.satoc.eu/projects/SCOOP/docs/SCOOP_ESA_D1.1_110_clean.pdf (accessed on 10 January 2023).
  24. Dinardo, S.; Fenoglio-Marc, L.; Buchhaupt, C.; Becker, M.; Scharroo, R.; Fernandes, M.J.; Benveniste, J. Coastal SAR and PLRM altimetry in German Bight and West Baltic Sea. Adv. Space Res. 2018, 62, 1371–1404. [Google Scholar] [CrossRef]
  25. Fenoglio, L.; Dinardo, S.; Uebbing, B.; Buchhaupt, C.; Gärtner, M.; Staneva, J.; Becker, M.; Klos, A.; Kusche, J. Advances in NE-Atlantic coastal sea level change monitoring by Delay Doppler altimetry. Adv. Space Res. 2021, 68, 571–592. [Google Scholar] [CrossRef]
  26. Benveniste, J.; Dinardo, S.; Buchhaupt, C.; Scagliola, M.; Passaro, M.; Fenoglio-Marc, L.; Sabatino, G.; Restano, M.; Ambrózio, A.; Abis, B.; et al. High-Resolution (SAR) Altimetry Processing on Demand for Cryosat-2 and Sentinel-3 at ESA’s Altimetry Virtual Lab. In Proceedings of the IAHS2022, Copernicus Meetings, Montpellier, France, 23 March 2022. [Google Scholar]
  27. Birol, F.; Léger, F.; Passaro, M.; Cazenave, A.; Niño, F.; Calafat, F.M.; Shaw, A.; Legeais, J.-F.; Gouzenes, Y.; Schwatke, C.; et al. The X-TRACK/ALES multi-mission processing system: New advances in altimetry towards the coast. Adv. Space Res. 2021, 67, 2398–2415. [Google Scholar] [CrossRef]
  28. Birol, F.; Fuller, N.; Lyard, F.; Cancet, M.; Niño, F.; Delebecque, C.; Fleury, S.; Toublanc, F.; Melet, A.; Saraceno, M.; et al. Coastal applications from nadir altimetry: Example of the X-TRACK regional products. Adv. Space Res. 2017, 59, 936–953. [Google Scholar] [CrossRef]
  29. Donlon, C.; Berruti, B.; Buongiorno, A.; Ferreira, M.-H.; Féménias, P.; Frerick, J.; Goryl, P.; Klein, U.; Laur, H.; Mavrocordatos, C.; et al. The Global Monitoring for Environment and Security (GMES) Sentinel-3 mission. Remote Sens. Environ. 2012, 120, 37–57. [Google Scholar] [CrossRef]
  30. Scharroo, R.; Smith, W.H.F. A global positioning system-based climatology for the total electron content in the ionosphere. J. Geophys. Res. Space Phys. 2010, 115, 10318. [Google Scholar] [CrossRef] [Green Version]
  31. Hernández-Pajares, M.; Juan, J.M.; Sanz, J.; Orus, R.; Garcia-Rigo, A.; Feltens, J.; Komjathy, A.; Schaer, S.C.; Krankowski, A. The IGS VTEC maps: A reliable source of ionospheric information since 1998. J. Geod. 2009, 83, 263–275. [Google Scholar] [CrossRef]
  32. Tran, N.; Philipps, S.; Poisson, J.-C.; Urien, S.; Bronner, E.; Picot, N. Instrument Processing Impact of GDR_D Standards on SSB Corrections. In Proceedings of the Ocean Surface Topography Science Team Meeting (OSTST), Venice, Italy, 22 September–28 September 2012; Available online: https://www.aviso.altimetry.fr/fileadmin/documents/OSTST/2012/oral/02_friday_28/01_instr_processing_I/01_IP1_Tran.pdf (accessed on 10 January 2023).
  33. Gaspar, P.; Labroue, S.; Ogor, F.; Lafitte, G.; Marchal, L.; Rafanel, M. Improving Nonparametric Estimates of the Sea State Bias in Radar Altimeter Measurements of Sea Level. J. Atmos. Ocean. Technol. 2002, 19, 1690–1707. [Google Scholar] [CrossRef]
  34. Carrère, L.; Lyard, F. Modeling the barotropic response of the global ocean to atmospheric wind and pressure forcing—comparisons with observations. Geophys. Res. Lett. 2003, 30. [Google Scholar] [CrossRef] [Green Version]
  35. Scharroo, R. RADS Data Manual 2022. Available online: https://raw.githubusercontent.com/remkos/rads/master/doc/manuals/rads4_data_manual.pdf (accessed on 10 January 2023).
  36. Lyard, F.H.; Allain, D.J.; Cancet, M.; Carrère, L.; Picot, N. FES2014 global ocean tide atlas: Design and performance. Ocean Sci. 2021, 17, 615–649. [Google Scholar] [CrossRef]
  37. Ray, R.D. A Global Ocean Tide Model From TOPEX/POSEIDON Altimetry: GOT99.2; National Aeronautics and Space Administration, Goddard Space Flight Center: Greenbelt, MD, USA, 1999. [Google Scholar]
  38. Egbert, G.D.; Erofeeva, S.Y. Efficient Inverse Modeling of Barotropic Ocean Tides. J. Atmos. Ocean Technol. 2002, 19, 183–204. [Google Scholar] [CrossRef]
  39. Savcenko, R.; Bosch, W. EOT11a-Empirical Ocean Tide Model from Multi-Mission Satellite Altimetry; Deutsches Geodätisches Forschungsinstitut (DGFI): Munich, Germany, 2012. [Google Scholar]
  40. Cartwright, D.E.; Edden, A.C. Corrected Tables of Tidal Harmonics. Geophys. J. Int. 1973, 33, 253–264. [Google Scholar] [CrossRef] [Green Version]
  41. Cartwright, D.E.; Tayler, R.J. New Computations of the Tide-generating Potential. Geophys. J. Int. 1971, 23, 45–73. [Google Scholar] [CrossRef] [Green Version]
  42. Wahr, J.M. Deformation induced by polar motion. J. Geophys. Res. Solid Earth 1985, 90, 9363–9368. [Google Scholar] [CrossRef]
  43. Andersen, O.; Knudsen, P.; Stenseng, L. A New DTU18 MSS Mean Sea Surface—Improvement from SAR Altimetry. In 25 Years of Progress in Radar Altimetry Symposium; Elsevier: Amsterdam, The Netherlands, 2021. [Google Scholar]
  44. Pujol, M.-I.; Schaeffer, P.; Faugère, Y.; Raynal, M.; Dibarboure, G.; Picot, N. Gauging the Improvement of Recent Mean Sea Surface Models: A New Approach for Identifying and Quantifying Their Errors. J. Geophys. Res. Oceans 2018, 123, 5889–5911. [Google Scholar] [CrossRef]
  45. Saastamoinen, J. Atmospheric Correction for the Troposphere and Stratosphere in Radio Ranging Satellites. In The Use of Artificial Satellites for Geodesy; American Geophysical Union (AGU): Washington, DC, USA, 1972; Volume 15, pp. 247–251. [Google Scholar]
  46. Fernandes, M.J.; Pires, N.; Lázaro, C.; Nunes, A.L. Tropospheric delays from GNSS for application in coastal altimetry. Adv. Space Res. 2013, 51, 1352–1368. [Google Scholar] [CrossRef]
  47. Legeais, J.-F.; Ablain, M.; Thao, S. Evaluation of wet troposphere path delays from atmospheric reanalyses and radiometers and their impact on the altimeter sea level. Ocean Sci. 2014, 10, 893–905. [Google Scholar] [CrossRef] [Green Version]
  48. National Centers for Environmental Prediction; National Weather Service; NOAA; U.S. Department of Commerce. NCEP GFS 0.25 Degree Global Forecast Grids Historical Archive, Research Data Archive at the National Center for Atmospheric Research, Computational and Information Systems Laboratory. 2015. Available online: https://rda.ucar.edu/datasets/ds084.1/ (accessed on 10 January 2023).
  49. Vieira, T.; Fernandes, M.J.; Lazaro, C. Impact of the New ERA5 Reanalysis in the Computation of Radar Altimeter Wet Path Delays. IEEE Trans. Geosci. Remote Sens. 2019, 57, 9849–9857. [Google Scholar] [CrossRef]
  50. Obligis, E.; Rahmani, A.; Eymard, L.; Labroue, S.; Bronner, E. An Improved Retrieval Algorithm for Water Vapor Retrieval: Application to the Envisat Microwave Radiometer. IEEE Trans. Geosci. Remote Sens. 2009, 47, 3057–3064. [Google Scholar] [CrossRef]
  51. CLS/CNES/UCL MSSL. Sentinel-3 Level 2 SRAL MWR Algorithm Theoretical Baseline Definition. 2019. Available online: https://sentinels.copernicus.eu/documents/247904/351187/ALT_Level-2_ADAS.pdf/9df1c53c-8059-4ca2-b6d7-2e1661403eca?t=1562153078000 (accessed on 10 January 2023).
  52. Fernandes, M.J.; Lázaro, C. Independent Assessment of Sentinel-3A Wet Tropospheric Correction over the Open and Coastal Ocean. Remote Sens. 2018, 10, 484. [Google Scholar] [CrossRef] [Green Version]
  53. Imel, D. Evaluation of the TOPEX/POSEIDON dual-frequency ionosphere correction. J. Geophys. Res. 1994, 99, 24895–24906. [Google Scholar] [CrossRef]
  54. Fernandes, M.J.; Lázaro, C.; Nunes, A.L.; Scharroo, R. Atmospheric Corrections for Altimetry Studies over Inland Water. Remote Sens. 2014, 6, 4952–4997. [Google Scholar] [CrossRef] [Green Version]
  55. Mannucci, A.J.; Wilson, B.D.; Yuan, D.N.; Ho, C.H.; Lindqwister, U.J.; Runge, T.F. A global mapping technique for GPS-derived ionospheric total electron content measurements. Radio Sci. 1998, 33, 565–582. [Google Scholar] [CrossRef]
  56. Komjathy, A.; Sparks, L.; Wilson, B.D.; Mannucci, A.J. Automated daily processing of more than 1000 ground-based GPS receivers for studying intense ionospheric storms. Radio Sci. 2005, 40. [Google Scholar] [CrossRef] [Green Version]
  57. Melville, W.K.; Stewart, R.H.; Keller, W.C.; Kong, J.A.; Arnold, D.V.; Jessup, A.T.; Loewen, M.R.; Slinn, A.M. Measurements of electromagnetic bias in radar altimetry. J. Geophys. Res. 1991, 96, 4915–4924. [Google Scholar] [CrossRef]
  58. Pires, N.; Fernandes, M.J.; Gommenginger, C.; Scharroo, R. Improved Sea State Bias Estimation for Altimeter Reference Missions With Altimeter-Only Three-Parameter Models. IEEE Trans. Geosci. Remote Sens. 2019, 57, 1448–1462. [Google Scholar] [CrossRef]
  59. Tran, N.; Labroue, S.; Philipps, S.; Bronner, E.; Picot, N. Overview and Update of the Sea State Bias Corrections for the Jason-2, Jason-1 and TOPEX Missions. Mar. Geodesy 2010, 33, 348–362. [Google Scholar] [CrossRef]
  60. Gómez-Enri, J.; Vignudelli, S.; Cipollini, P.; Coca, J.; González, C. Validation of CryoSat-2 SIRAL sea level data in the eastern continental shelf of the Gulf of Cadiz (Spain). Adv. Space Res. 2018, 62, 1405–1420. [Google Scholar] [CrossRef] [Green Version]
  61. Aldarias, A.; Gomez-Enri, J.; Laiz, I.; Tejedor, B.; Vignudelli, S.; Cipollini, P. Validation of Sentinel-3A SRAL Coastal Sea Level Data at High Posting Rate: 80 Hz. IEEE Trans. Geosci. Remote Sens. 2020, 58, 3809–3821. [Google Scholar] [CrossRef]
  62. Scharroo, R.; Lillibridge, J. Non-Parametric Sea-State Bias Models and Their Relevance to Sea Level Change Studies. Available online: https://www.researchgate.net/publication/255574815_Non-Parametric_Sea-state_Bias_Models_and_Their_Relevance_to_Sea_Level_Change_Studies (accessed on 22 December 2022).
  63. Wunsch, C.; Stammer, D. Atmospheric loading and the oceanic “inverted barometer” effect. Rev. Geophys. 1997, 35, 79–107. [Google Scholar] [CrossRef]
  64. Ponte, R. Low-Frequency Sea Level Variability and the Inverted Barometer Effect. J. Atmos. Ocean. Technol. 2006, 23, 619–629. [Google Scholar] [CrossRef]
  65. Carrere, L.; Faugère, Y.; Ablain, M. Major improvement of altimetry sea level estimations using pressure-derived corrections based on ERA-Interim atmospheric reanalysis. Ocean Sci. 2016, 12, 825–842. [Google Scholar] [CrossRef] [Green Version]
  66. Adhikari, S.; Ivins, E.R. Climate-driven polar motion: 2003–2015. Sci. Adv. 2016, 2, e1501693. [Google Scholar] [CrossRef] [Green Version]
  67. Schaeffer, P.; Faugere, Y.; Pujol, M.-I.; Guillot, C.A.; Picot, N. MSS_CNES_CLS_2015 Assessment. In Proceedings of the ESA Living Planet Symposium, Prague, Czech Republic, 9–13 May 2016. [Google Scholar]
  68. Gomez-Enri, J.; Cipollini, P.; Passaro, M.; Vignudelli, S.; Tejedor, B.; Coca, J. Coastal Altimetry Products in the Strait of Gibraltar. IEEE Trans. Geosci. Remote Sens. 2016, 54, 5455–5466. [Google Scholar] [CrossRef]
  69. Passaro, M. COSTA v.1.0: DGFI-TUM Along Track Sea Level Product for ERS-2 and Envisat in the Mediterranean Sea and in the North Sea; Deutsches Geodätisches Forschungsinstitut der Technischen Universität München (DGFI-TUM): Munich, Germany, 2017. [Google Scholar]
  70. Xu, X.-Y.; Birol, F.; Cazenave, A. Evaluation of Coastal Sea Level Offshore Hong Kong from Jason-2 Altimetry. Remote Sens. 2018, 10, 282. [Google Scholar] [CrossRef] [Green Version]
  71. Passaro, M.; Rautiainen, L.; Dettmering, D.; Restano, M.; Hart-Davis, M.G.; Schlembach, F.; Särkkä, J.; Müller, F.L.; Schwatke, C.; Benveniste, J. Validation of an Empirical Subwaveform Retracking Strategy for SAR Altimetry. Remote Sens. 2022, 14, 4122. [Google Scholar] [CrossRef]
  72. Pascual, A.; Marcos, M.; Gomis, D. Comparing the sea level response to pressure and wind forcing of two barotropic models: Validation with tide gauge and altimetry data. J. Geophys. Res. Oceans 2008, 113, 7011. [Google Scholar] [CrossRef] [Green Version]
  73. Fernandes, M.J.; Lázaro, C.; Ablain, M.; Pires, N. Improved wet path delays for all ESA and reference altimetric missions. Remote Sens. Environ. 2015, 169, 50–74. [Google Scholar] [CrossRef] [Green Version]
  74. Handoko, E.Y.; Fernandes, M.J.; Lázaro, C.; Kudela, R.M.; Li, X.; Thenkabail, P.S. Assessment of Altimetric Range and Geophysical Corrections and Mean Sea Surface Models—Impacts on Sea Level Variability around the Indonesian Seas. Remote Sens. 2017, 9, 102. [Google Scholar] [CrossRef] [Green Version]
  75. Freedman, D.; Diaconis, P. On the Histogram as a Density Estimator:L2 Theory. Z. Wahrscheinlichkeitstheorie Verwandte Geb. 1981, 57, 453–476. [Google Scholar] [CrossRef] [Green Version]
  76. Passaro, M.; Cipollini, P.; Benveniste, J. Annual sea level variability of the coastal ocean: The Baltic Sea-North Sea transition zone. J. Geophys. Res. Oceans 2015, 120, 3061–3078. [Google Scholar] [CrossRef] [Green Version]
  77. Fernandes, M.J.; Lázaro, C.; Vieira, T. On the role of the troposphere in satellite altimetry. Remote Sens. Environ. 2021, 252, 112149. [Google Scholar] [CrossRef]
  78. Stum, J.; Sicard, P.; Carrere, L.; Lambin, J. Using Objective Analysis of Scanning Radiometer Measurements to Compute the Water Vapor Path Delay for Altimetry. IEEE Trans. Geosci. Remote Sens. 2011, 49, 3211–3224. [Google Scholar] [CrossRef]
  79. Frery, M.-L.; Siméon, M.; Goldstein, C.; Féménias, P.; Borde, F.; Houpert, A.; Garcia, A.O. Sentinel-3 Microwave Radiometers: Instrument Description, Calibration and Geophysical Products Performances. Remote Sens. 2020, 12, 2590. [Google Scholar] [CrossRef]
  80. Dettmering, D.; Schwatke, C. Ionospheric Corrections for Satellite Altimetry - Impact on Global Mean Sea Level Trends. Earth Space Sci. 2022, 9, e2021EA002098. [Google Scholar] [CrossRef]
  81. Scharroo, R. Ionospheric Correction: Experiences with Different Measurements and Models. In Proceedings of the 2nd Coastal Altimetry Workshop, Pisa, Italy, 6–7 November 2008. [Google Scholar]
  82. Ray, R.D. Daily harmonics of ionospheric total electron content from satellite altimetry. J. Atmos. Sol.-Terr. Phys. 2020, 209, 105423. [Google Scholar] [CrossRef]
  83. Shim, J.S.; Jee, G.; Scherliess, L. Climatology of plasmaspheric total electron content obtained from Jason 1 satellite. J. Geophys. Res. Space Phys. 2017, 122, 1611–1623. [Google Scholar] [CrossRef] [Green Version]
  84. Quartly, G.D.; Legeais, J.-F.; Ablain, M.; Zawadzki, L.; Fernandes, M.J.; Rudenko, S.; Carrère, L.; García, P.N.; Cipollini, P.; Andersen, O.B.; et al. A new phase in the production of quality-controlled sea level data. Earth Syst. Sci. Data 2017, 9, 557–572. [Google Scholar] [CrossRef] [Green Version]
  85. Stammer, D.; Ray, R.D.; Andersen, O.B.; Arbic, B.K.; Bosch, W.; Carrère, L.; Cheng, Y.; Chinn, D.S.; Dushaw, B.D.; Egbert, G.D.; et al. Accuracy assessment of global barotropic ocean tide models. Rev. Geophys. 2014, 52, 243–282. [Google Scholar] [CrossRef] [Green Version]
  86. Desai, S.; Wahr, J.; Beckley, B. Revisiting the pole tide for and from satellite altimetry. J. Geod. 2015, 89, 1233–1243. [Google Scholar] [CrossRef]
  87. Tran, N.; Vandemark, D.; Zaron, E.; Thibaut, P.; Dibarboure, G.; Picot, N. Assessing the effects of sea-state related errors on the precision of high-rate Jason-3 altimeter sea level data. Adv. Space Res. 2021, 68, 963–977. [Google Scholar] [CrossRef]
  88. Quartly, G.D.; Smith, W.H.F.; Passaro, M. Removing Intra-1-Hz Covariant Error to Improve Altimetric Profiles of Σ0 and Sea Surface Height. IEEE Trans. Geosci. Remote Sens. 2019, 57, 3741–3752. [Google Scholar] [CrossRef]
  89. Zaron, E.D.; Decarvalho, R. Identification and Reduction of Retracker-Related Noise in Altimeter-Derived Sea Surface Height Measurements. J. Atmos. Ocean. Technol. 2016, 33, 201–210. [Google Scholar] [CrossRef] [Green Version]
  90. Peng, F.; Deng, X. Validation of Sentinel-3A SAR mode sea level anomalies around the Australian coastal region. Remote Sens. Environ. 2020, 237, 111548. [Google Scholar] [CrossRef]
  91. Carrere, L.; Faugere, Y.; Lyard, F.; Allain, D.; Dibarboure, G.; Picot, N. Last TUGO Model Simulations and Perspectives of Evolution of the Dynamic Atmospheric Correction for Altimetry. In Proceedings of the Ocean Surface Topography Science Team Meeting (OSTST), Chicago, IL, USA, 21–25 October 2019. [Google Scholar]
  92. Hart-Davis, M.G.; Piccioni, G.; Dettmering, D.; Schwatke, C.; Passaro, M.; Seitz, F. EOT20: A global ocean tide model from multi-mission satellite altimetry. Earth Syst. Sci. Data 2021, 13, 3869–3884. [Google Scholar] [CrossRef]
  93. Mulet, S.; Etienne, H.; Ballarotta, M.; Faugere, Y.; Rio, M.; Dibarboure, G.; Picot, N. Synergy between surface drifters and altimetry to increase the accuracy of sea level anomaly and geostrophic current maps in the Gulf of Mexico. Adv. Space Res. 2021, 68, 420–431. [Google Scholar] [CrossRef]
  94. Jousset, S.; Mulet, S.; Wilkin, J.; Greiner, E.; Dibarboure, G.; Picot, N. New Global Mean Dynamic Topography CNES-CLS-22 Combining Drifters, Hydrological Profiles and High Frequency Radar Data. In Proceedings of the Ocean Surface Topography meeting (OSTST), Venice, Italy, 31 October–4 November 2022. [Google Scholar]
  95. Gaspar, P.; Ogor, F.; Le Traon, P.-Y.; Zanife, O.-Z. Estimating the sea state bias of the TOPEX and POSEIDON altimeters from crossover differences. J. Geophys. Res. Oceans 1994, 99, 24981–24994. [Google Scholar] [CrossRef]
  96. Passaro, M.; Nadzir, Z.A.; Quartly, G.D. Improving the precision of sea level data from satellite altimetry with high-frequency and regional sea state bias corrections. Remote Sens. Environ. 2018, 218, 245–254. [Google Scholar] [CrossRef] [Green Version]
Figure 1. Map of the study area with altimeter ground tracks shown in red.
Remotesensing 15 01132 g001
Figure 2. Histograms of variance difference between the non-corrected and standard corrected versions of the SSHA (non-corrected minus corrected) for all CP.
Remotesensing 15 01132 g002
Figure 3. Variance differences between noncorrected and corrected (standard) SSHA versus distance to the coast (solid line) and interquartile range (shading): (a) wet tropospheric correction (standard: ECMWF-derived WTC); (b) dry tropospheric correction (standard: ECMWF-derived DTC); (c) ionospheric correction (standard: GIM); (d) sea state bias correction (standard: Jason 2-based nonparametric SSB); (e) geocentric tide correction, a sum of ocean and load tide (standard: FES2014b); (f) dynamic atmosphere correction (standard: MOG2D dynamic atmosphere correction). The bin size is 2 km.
Remotesensing 15 01132 g003
Figure 4. Histograms of PNR for each version of the correction versus the standard correction: (a) model-based wet tropospheric correction (standard: ECMWF-derived WTC); (b) radiometer and composite wet tropospheric correction; (c) dry tropospheric correction (standard: ECMWF-derived DTC); (d) ionospheric correction (standard: GIM); (e) geocentric tide correction, a sum of ocean and load tide (standard: FES2014b); (f) sea state bias correction (standard: Jason 2-based nonparametric SSB); (g) inverse barometer correction (standard: MOG2D dynamic atmosphere correction); (h) mean sea surface (standard: DTU18). All histograms show the number of comparison points associated with each PNR bin. Note that the scales are different for each panel.
Remotesensing 15 01132 g004
Figure 5. Sea surface height anomaly differences between coastally-retracked versions and RADS by bathymetry with backscatter coefficient (σ0) as the colormap: (a) RADS–ALES; (b) RADS–SAMOSA++. The red line shows the variance of these differences per 200 m isobath bin.
Remotesensing 15 01132 g005
Figure 6. Same as Figure 5, but with distance to the coast as the independent variable and with significant wave height (SWH) as the color map.
Remotesensing 15 01132 g006
Figure 7. Histogram of SSHA variance differences for all comparison points between the retracked version and RADS for ALES (light blue) and SAMOSA++ (orange).
Remotesensing 15 01132 g007
Figure 8. Variance differences as a function of distance to the coast for ALES–SAMOSA++ (blue), RADS–SAMOSA++ (orange), and RADS–ALES (green). The dots show the median of all comparison points, with the IQR as the uncertainty. Each dot corresponds to a 2 km bin.
Remotesensing 15 01132 g008
Table 1. Altimetry products and periods.
ProductSourceCyclesPeriod StartsPeriod Ends
RADSRADS1–501 March 201626 October 2019
ALESDGFI-TUM openADB25–5024 November 201726 October 2019
SAMOSA++SARvatore for S35–5015 June 201626 October 2019
Table 2. Available altimeter corrections (an asterisk denotes the default correction).
CorrectionCorrection ProductComments
Dry tropospheric correction (DTC)ECMWF *
ERA-InterimOnly available until 1 August 2019
GFS
NCEP
Wet tropospheric correction (WTC)ECMWF *
ERA-InterimOnly available until 1 August 2019
GFS
NCEP
Radiometer
Radiometer (5-comp)
Composite
Ionospheric correctionDual-altimeter
Dual-altimeter (smoothed)
NIC09 [30]
GIM * [31]
Sea state bias (SSB)CLS Jason-2-based nonparametric * [32,33]
3% SWH
Dynamic atmosphere correction (DAC)MOG2D * [34]
Static IB [35]
Geocentric tide correction (ocean + load)FES2014b * [36]
GOT4.10 [37]
TPXO9v2 [38]
EOT11a [39]
Solid Earth tideCartwright-Tayler-Edden * [40,41]
Pole tideWahr * [42]
MSSDTU18 * [43]
CNES-CLS15 [44]
Table 3. Resolution of operational and reanalysis models.
ProductSpatial ResolutionTemporal ResolutionSource
ECMWF operational analysis0.125° × 0.125°6 h[46]
ERA-Interim1.5° × 1.5° (Gaussian grid 79 km [35])6 h[46]
NCEP/NCAR2.5° × 2.5°6 h[47]
GFS0.25° × 0.25°6 h[48]
ERA-5 10.25° × 0.25°1 h[49]
1 Not used in this study.
Table 4. Statistics of variance differences between the non-corrected and corrected standard versions of the sea surface height anomaly.
CorrectionMedian, cm2Q1, cm2Q3, cm2IQR, cm2Δvar < 0, %
Geocentric tide (ocean + load)1026669180511362
Solid Earth tide8760124643
Pole tide0.4−12342
Dynamic atmosphere52291371084
Wet troposphere3714594513
Sea state bias133282517
Dry troposphere407725
Mean sea surface1−13437
Ionospheric102219
Table 5. SSHA difference statistics.
DifferenceMean, cmStandard Deviation, cmMedian, cm
RADS–SAMOSA++−0.21.8−0.3
RADS–ALES−7.63.6−7.6
Disclaimer/Publisher’s Note: The statements, opinions and data contained in all publications are solely those of the individual author(s) and contributor(s) and not of MDPI and/or the editor(s). MDPI and/or the editor(s) disclaim responsibility for any injury to people or property resulting from any ideas, methods, instructions or products referred to in the content.