Article

Integration of Remote-Sensing Techniques for the Preventive Conservation of Paleolithic Cave Art in the Karst of the Altamira Cave

1
GIM Geomatics, S.L. C/Conde Torreanaz 8, 39300 Torrelavega, Spain
2
Polytechnic School, Universidad Europea del Atlántico, Parque Científico y Tecnológico de Cantabria, C/Isabel Torres 21, 39011 Santander, Spain
3
Museo Nacional y Centro de Investigación de Altamira, Marcelino Sanz de Sautuola, S/N, 39330 Santillana del Mar, Spain
4
Department of Cartographic Engineering, Geodesy and Photogrammetry, Universitat Politècnica de València, Camino de Vera, s/n, 46022 Valencia, Spain
5
Department of Geographic Engineering and Techniques of Graphical Expression, University of Cantabria, Avda. de los Castros, s/n, 39005 Santander, Spain
*
Author to whom correspondence should be addressed.
Remote Sens. 2023, 15(4), 1087; https://doi.org/10.3390/rs15041087
Submission received: 7 January 2023 / Revised: 9 February 2023 / Accepted: 13 February 2023 / Published: 16 February 2023
(This article belongs to the Special Issue Application of Remote Sensing in Cultural Heritage Research)

Abstract

:
Rock art offers traces of our most remote past and was made with mineral and organic substances in shelters, walls, or the ceilings of caves. As it is notably fragile, it is fortunate that some instances remain intact—but a variety of natural and anthropogenic factors can lead to its disappearance. Therefore, as a valuable cultural heritage, rock art requires special conservation and protection measures. Geomatic remote-sensing technologies such as 3D terrestrial laser scanning (3DTLS), drone flight, and ground-penetrating radar (GPR) allow us to generate exhaustive documentation of caves and their environment in 2D, 2.5D, and 3D. However, only its combined use with 3D geographic information systems (GIS) lets us generate new cave maps with details such as overlying layer thickness, sinkholes, fractures, joints, and detachments that also more precisely reveal interior–exterior interconnections and gaseous exchange; i.e., the state of senescence of the karst that houses the cave. Information of this kind is of great value for the research, management, conservation, monitoring, and dissemination of cave art.

1. Introduction

Recently, remote-sensing techniques have been used for underground cultural heritage sites to improve traditional documentation such as terrestrial photogrammetry [1,2,3,4], to create orthoimages series and virtual reality scenarios [5,6,7,8,9], and in the case of hyperspectral remote-sensing, to recover rock-art paintings invisible to the naked eye or covered by calcite, dirt, or soot [10,11,12,13,14,15,16], which are themselves helpful for understanding the stratigraphy of the rock art panel [17,18,19,20].
From a remote-sensing viewpoint, caves are characterized by particular conditions, such as complex access, confined spaces, high humidity, constant temperature, absence of natural light, a potential relationship between the interior and the exterior, etc. [4,21].
Separately, photogrammetric unmanned aerial vehicle (UAV) flights can provide accurate terrain models [22,23], 3D terrestrial laser scanner (3DTLS) surveys provide detailed and correct cave models, while ground-penetrating radar (GPR) provides information on the particularities of the rock mass under investigation.
It is the combined use of these tools that enables the generation of new cartographic information on the features of cave karst complexes, such as rock thickness, fractures, joints, sinkholes, cave seepage, water dripping, stability analysis, and gaseous exchanges, which are valuable for conservation studies of the cave.
The Altamira Cave is an exceptional cultural heritage site that is internationally recognized as a masterpiece of History of Art, being added to the UNESCO World Heritage List in 1985. It is in Santillana del Mar (Cantabria) and is 296 m long, widening in some areas, such as the Polychrome Hall. It is the first cave in which the existence of rock art from the Palaeolithic period was identified (Figure 1).
The cave was discovered in 1868, while the cave art was discovered in 1879 by Marcelino Sanz de Sautuola and his daughter María. The authenticity of the cave paintings was accepted by the scientific community in 1902 [24,25]. It has paintings and engravings that were made from over 35,000 years ago to 14,000 years ago, among which the set of polychrome bison stands out.
Since its discovery, it has been the object of special conservational attention and care. It is in the upper part of an ancient karst (Figure 2a) that has a tendency to disappear by collapse and subsidence: due to the tabular structure of the limestone and the steep slope of the fracture planes, the geological evolution of Altamira is more marked by a series of gravitational collapses of the limestone rock layers than by the circulation of water [26].
The first writings in the local and national press reported the existence of collapses throughout the cave. Faced with this structural instability in some parts of the cave at the beginning of the 20th century, important transformations were proposed, such as the raising, in the vestibular area, of a large stone wall to act as a support for the strata of the ceiling, which was threatening to collapse. This intervention, which definitively isolated the Polychrome room from the rest of the cavity, has generated some of the micro-environmental conservation problems that continue to this day. Subsequent interventions focused on trying to reverse the infiltration of rainwater through the network of fissures and fractures in the cave, which is the main problem for the conservation of the paintings. Artificial walls were built inside the cave (Figure 2a), some cracks were filled with hydraulic mortar, and a layer of Portland cement was spread over the exterior surface [27].
The current state of conservation of Altamira results from structural geological problems due to the accumulation over time of multiple transformations and micro-environmental disturbances. Refurbishment works, changes in the external and internal soils, archaeological excavations, mass visits, and other activities have generated conservation conditions different from those that the cave had before its discovery, where its substantial conservation was caused by its low water infiltration rate and its stable microclimatic conditions, the latter being caused by its natural closure [28].
The most worrying factors in the conservation of the Altamira cave concern deterioration processes related to geological structural stability and infiltration water, as well as biodeterioration and human presence. To understand their dynamics and to minimize the alterations generated by them, it is necessary to develop effective conservation strategies aimed at controlling the different agents of deterioration. The water that enters the cave through the network of fissures and fractures in the overlying layer plays an important role in the processes of dissolution and dragging of the supporting rock. The processes of microcorrosion, loss of adhesion, cracking, washing, and loss of support are worrying and are still active today.
Knowing and studying the underlying dynamics of these processes hypothetically associated with the destruction of paint at Altamira is essential to design strategies to control each alteration agent and the interactions between them.
The aim of this research was to improve the understanding of the karst system surrounding Altamira Cave by combining remote-sensing technologies for its preventive conservation, thus contributing to decision-making for its management.
An exhaustive and combined study of remote-sensing techniques was carried out, after which we performed 3D cartography to integrate the exterior, the inner topography of the cave, and the main discontinuities and karst features detected around. As we will show, this 3D integrated mapping is a crucial tool for monitoring the main fluid flows into the cave and other conservation purposes.
In the paper, Section 2 shows the data sources integrated to carry out the study, i.e., GNSS in different operational modes, 3DTLS for the geometrical characterization of the cave, a UAV flight to model the terrain, and GPR for the overlying layer. Each subsection describes the accuracies achieved with each method. Section 3 shows the results obtained from integrating two or more techniques and how to visualize them. Finally, Section 4 contains the discussion.

2. Materials and Methods

Caves with rock art are formed by the dissolution of limestone rock by slightly acidic water, which may involve processes of chemical and geological activity, tectonic forces, and atmospheric influences. They are irregular in shape and variable in extent, so it is necessary to integrate different georeferenced remote-sensing techniques to derive new cartographies and generate new information on the cultural heritage element [29].
The flowchart that follows first required the creation of a reference frame, which was observed using the static mode of GNSS, obtaining an average error of 1.7 cm at the vertices. This reference frame was observed and adjusted as a microgeodetic network, obtaining an average accuracy of 1.1 cm in the determination of vertex coordinates.
The UAV flight was georeferenced by GNSS in RTK mode. Fifty-two control points were taken throughout the area and 40 points were taken to validate the model. The result of the validation points was an error of 2.1 cm in planimetry and 2.8 cm in elevation.
The GPR grids were staked using GNSS in RTK mode. To keep the direction constant, a canvas was attached to each grid. From these efforts, the three models were generated and then integrated to be analyzed as a whole (Figure 3).

2.1. Global Navigation Satellite System (GNSS)

GNSS (Global Navigation Satellite System) refers to the set of satellite navigation system technologies that provide geospatial positioning with autonomous global coverage.
The origins of GNSS date to the 1970s with the development of the US military GPS (Global Positioning System), which, through a network of satellites, a GNSS receiver can determine its position in four dimensions (longitude, latitude, altitude, and time) [30].
In September 2013, a network of points was created using three TOPCON Hyper II [31] receivers simultaneously, 2 of which were moved to other vertices after 1 h of observation to create the reference frame, which was the beginning of the traverse of the cave. The geodetic reference system used to create the reference frame was the European Terrestrial Reference System 1989 (ETRS89).
The software Topcon Tools [32] was used to calculate observed phase changes to form the differencing observation equations, perform the least-squares adjustment, and output the adjusted baseline vector components. The mean accuracy of the reference frame was 1.7 cm.
GPR grids were staked out by using the Real Time Kinematic (RTK) mode. The RTK positioning technique is based on the carrier solution of the signals transmitted by the global navigation satellite systems GPS; in our case, Glonass and Navstar. A reference station provides instantaneous corrections for mobile stations, which brings the obtained accuracy to the centimeter level. The base station retransmits the phase of the carrier it measured, and the mobile units compare their own phase measurements with that received from the reference station. This lets the mobile stations calculate their relative positions with millimeter accuracy, with their absolute relative positions being related to the base station coordinates. This technique requires the availability of at least one reference station with known coordinates that has a GNSS receiver and a radio transmitter modem. The station generates and transmits differential corrections for the stations, which use the data to precisely determine their positions [33,34].

2.2. 3D Terrestrial Laser Scanning

Having an accurate cartographic model of a cave is important when knowledge-based prediction models need to be estimated from georeferenced parameters such as microbiological, climatic, hydrochemical, geomorphological, etc. that are highly correlated either between them or with what happens in the exterior [18].
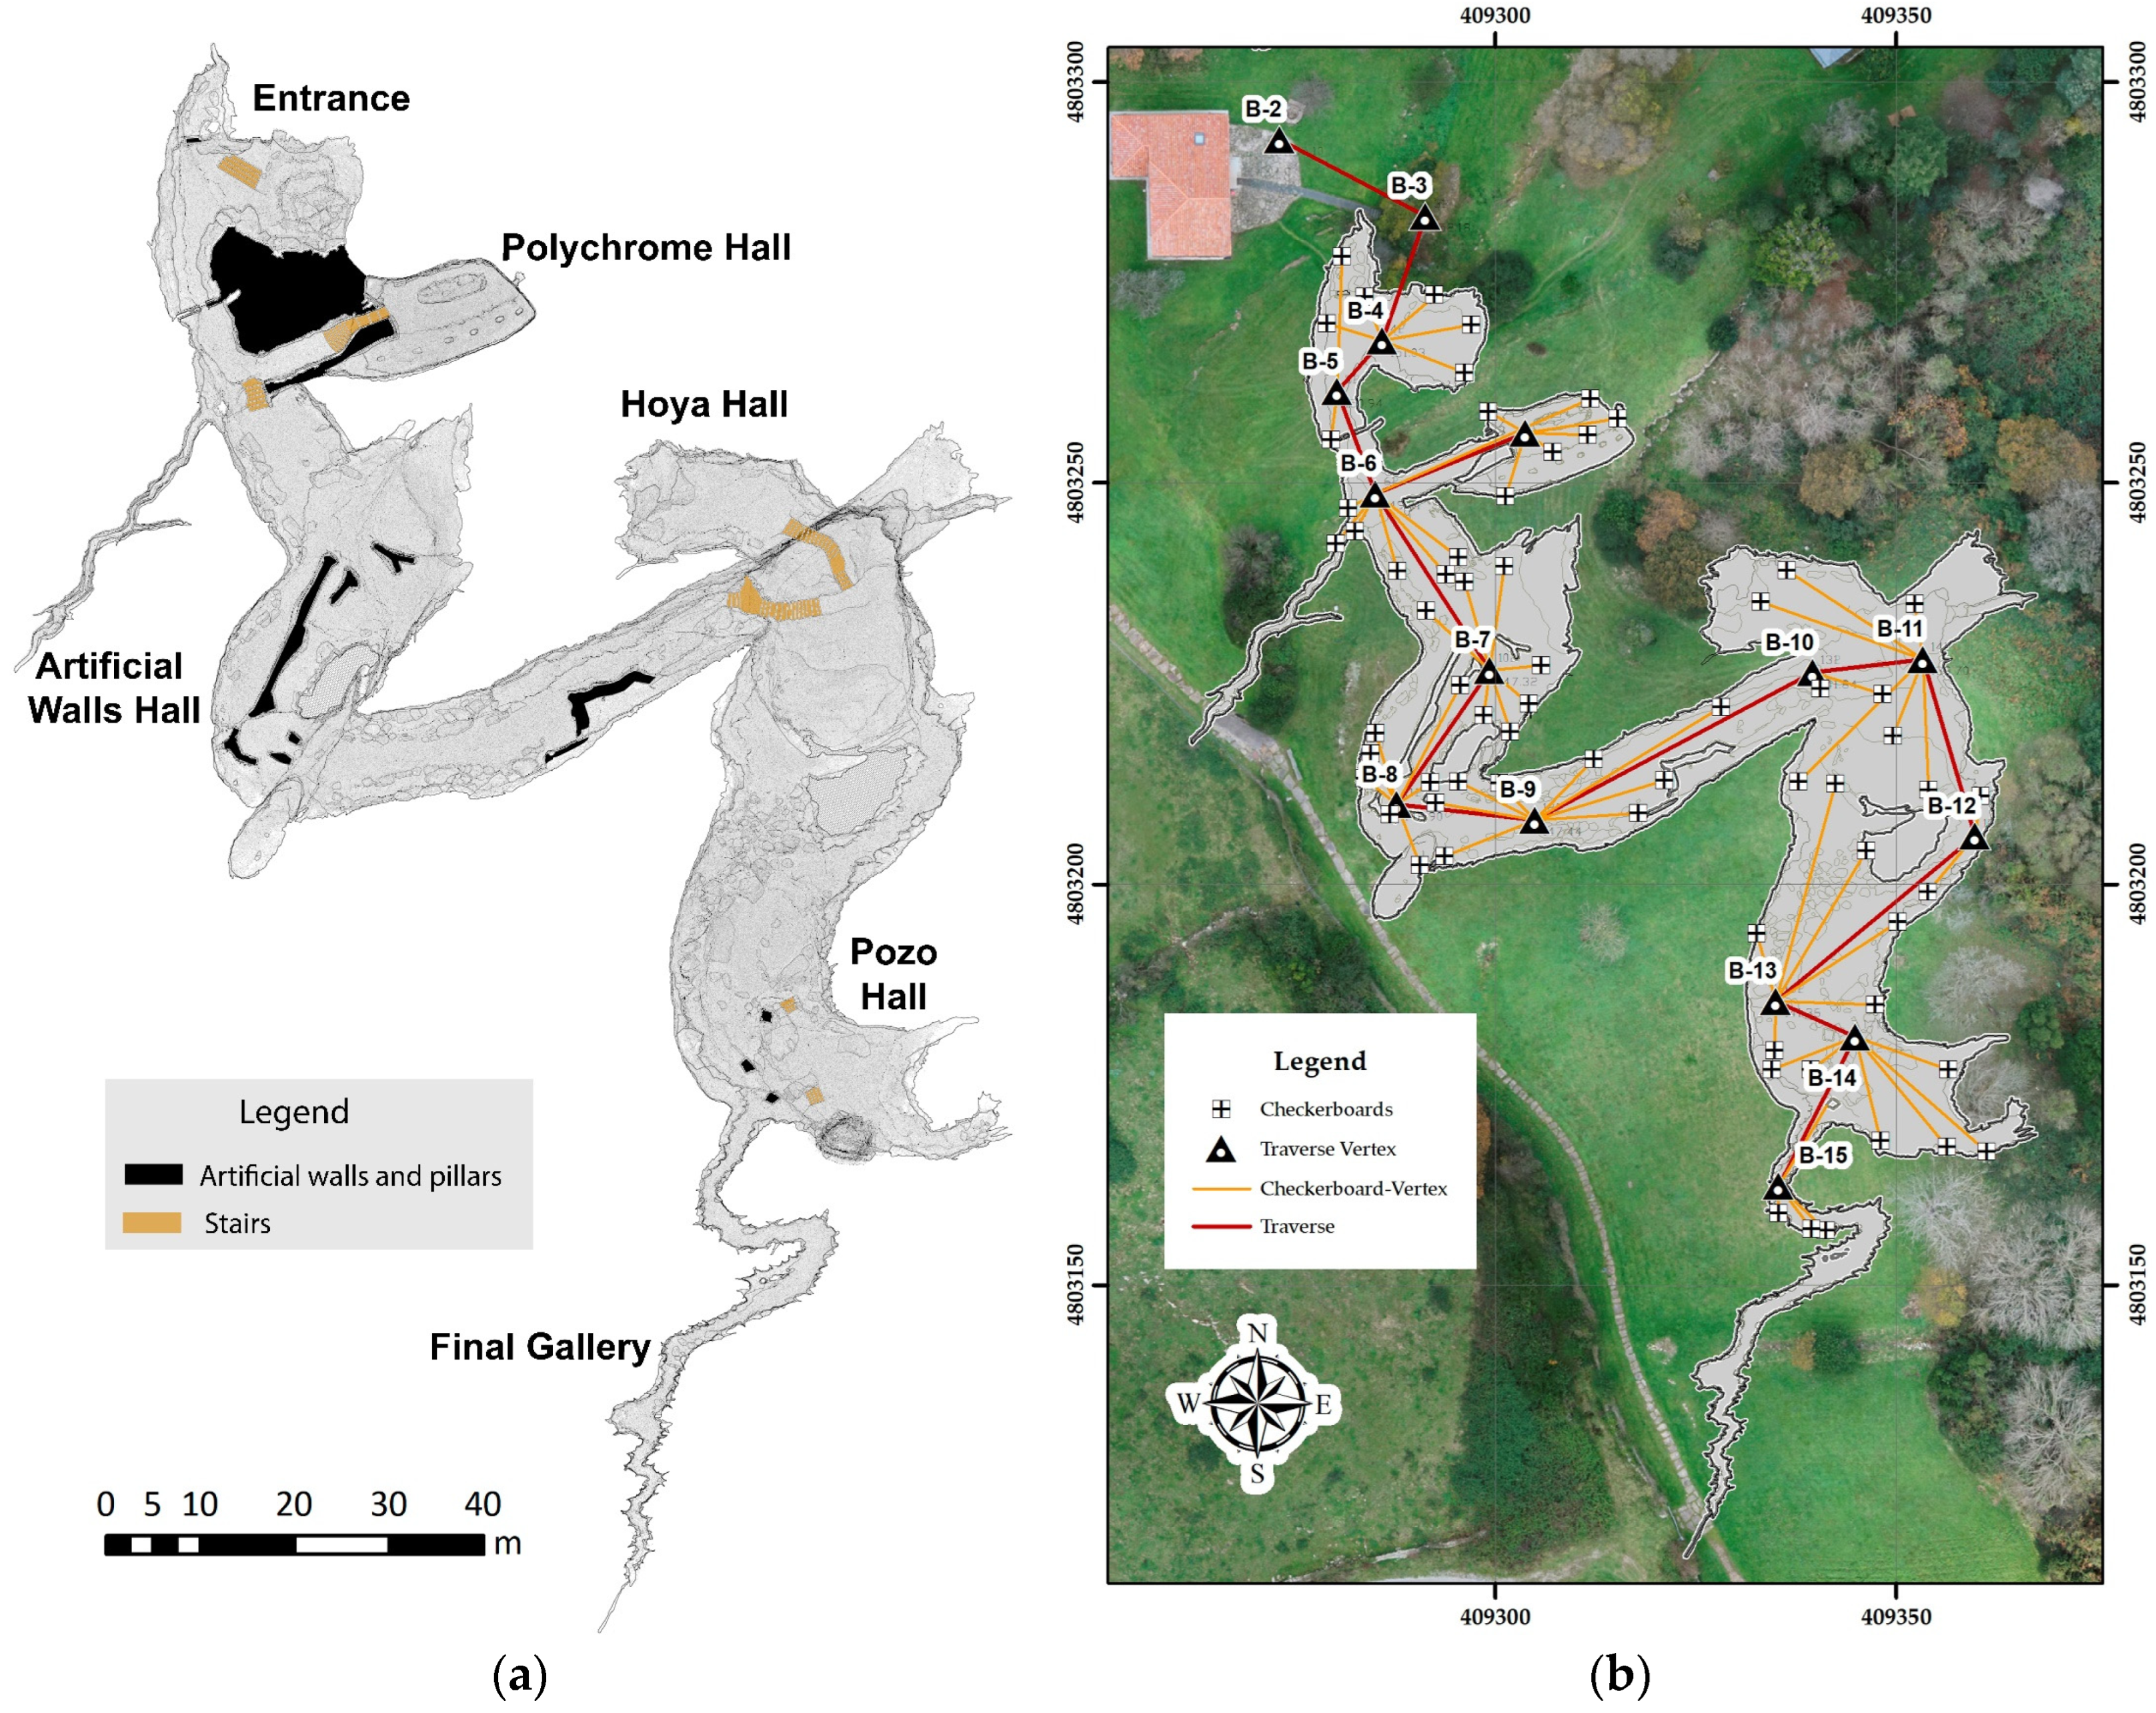
Starting from a vertex of the reference frame “b-2” (Figure 2b), a closed traverse back-and-forth was made that was adjusted and compensated through the cave using a TOPCON GPT-7503 total station [35]. Sixteen traverse stations were needed, and the total length was 430 m. The angular closure error was 0.0218g, and the linear closure error was X = −0.001 m, Y = −0.005 m, Z = 0.
A total of 66 checkerboards distributed around the cave were radiated from the vertices of the traverse; these are the reference system of the 3D laser scanner, on which the scans are georeferenced. (Figure 2b).
The field campaign was carried out in December 2013; a FARO FOCUS X-130 [36] was used, and 300 scans were required. Calibrated spheres were used as tie points and the traverse checkerboards as references, which were adjusted with an accuracy of 2.7 mm for 95% of the points (Figure 2a) [37].
This new model updated the traditional values of the Altamira cave, which are as follows:
  • Length: 296.5 m (20 longer)
  • Area: 11,390.9 m2
  • Volume: 9372.7 m3
The 3D model enabled us to obtain, apart from the classical cartographies of plant and section planes, other cartographies such as the height of roofs, floors, and galleries.

2.3. Unmanned Aerial Vehicle

Currently, the use of drones for surveying and mapping work is widespread. Drones allow surveys of large areas to be carried out with high reliability in a shorter time than using traditional techniques such as Topographic Total Stations (TTS) and GNSS. UAVs make it possible to obtain something fundamental for our model, which is to have continuous, sufficiently precise information of the entire work area, including places that are difficult to access: in our case, the sinkholes [38,39,40].
The platform selected for the execution of the photogrammetric flights was a TOPCON Intel Falcon 8+ Drone [41], on which a Sony A7 R Mark ii full-frame camera [42] was mounted with a Sony Sonnar T* FE 35 mm F/2.8 lens. The flights were carried out with the flight-planning system in a simple and fast way.
To reach a ground sample distance (GSD) of 2 cm, the flight-planning system was used to obtain measurements throughout the entire cave environment (40 Ha). More than 4800 pictures were taken, 52 Ground Control Points (GCP) were measured with RTK-GNSS to reference the flight, and another 40 points were measured for quality control. The mean error of the control points was 1.76 cm.
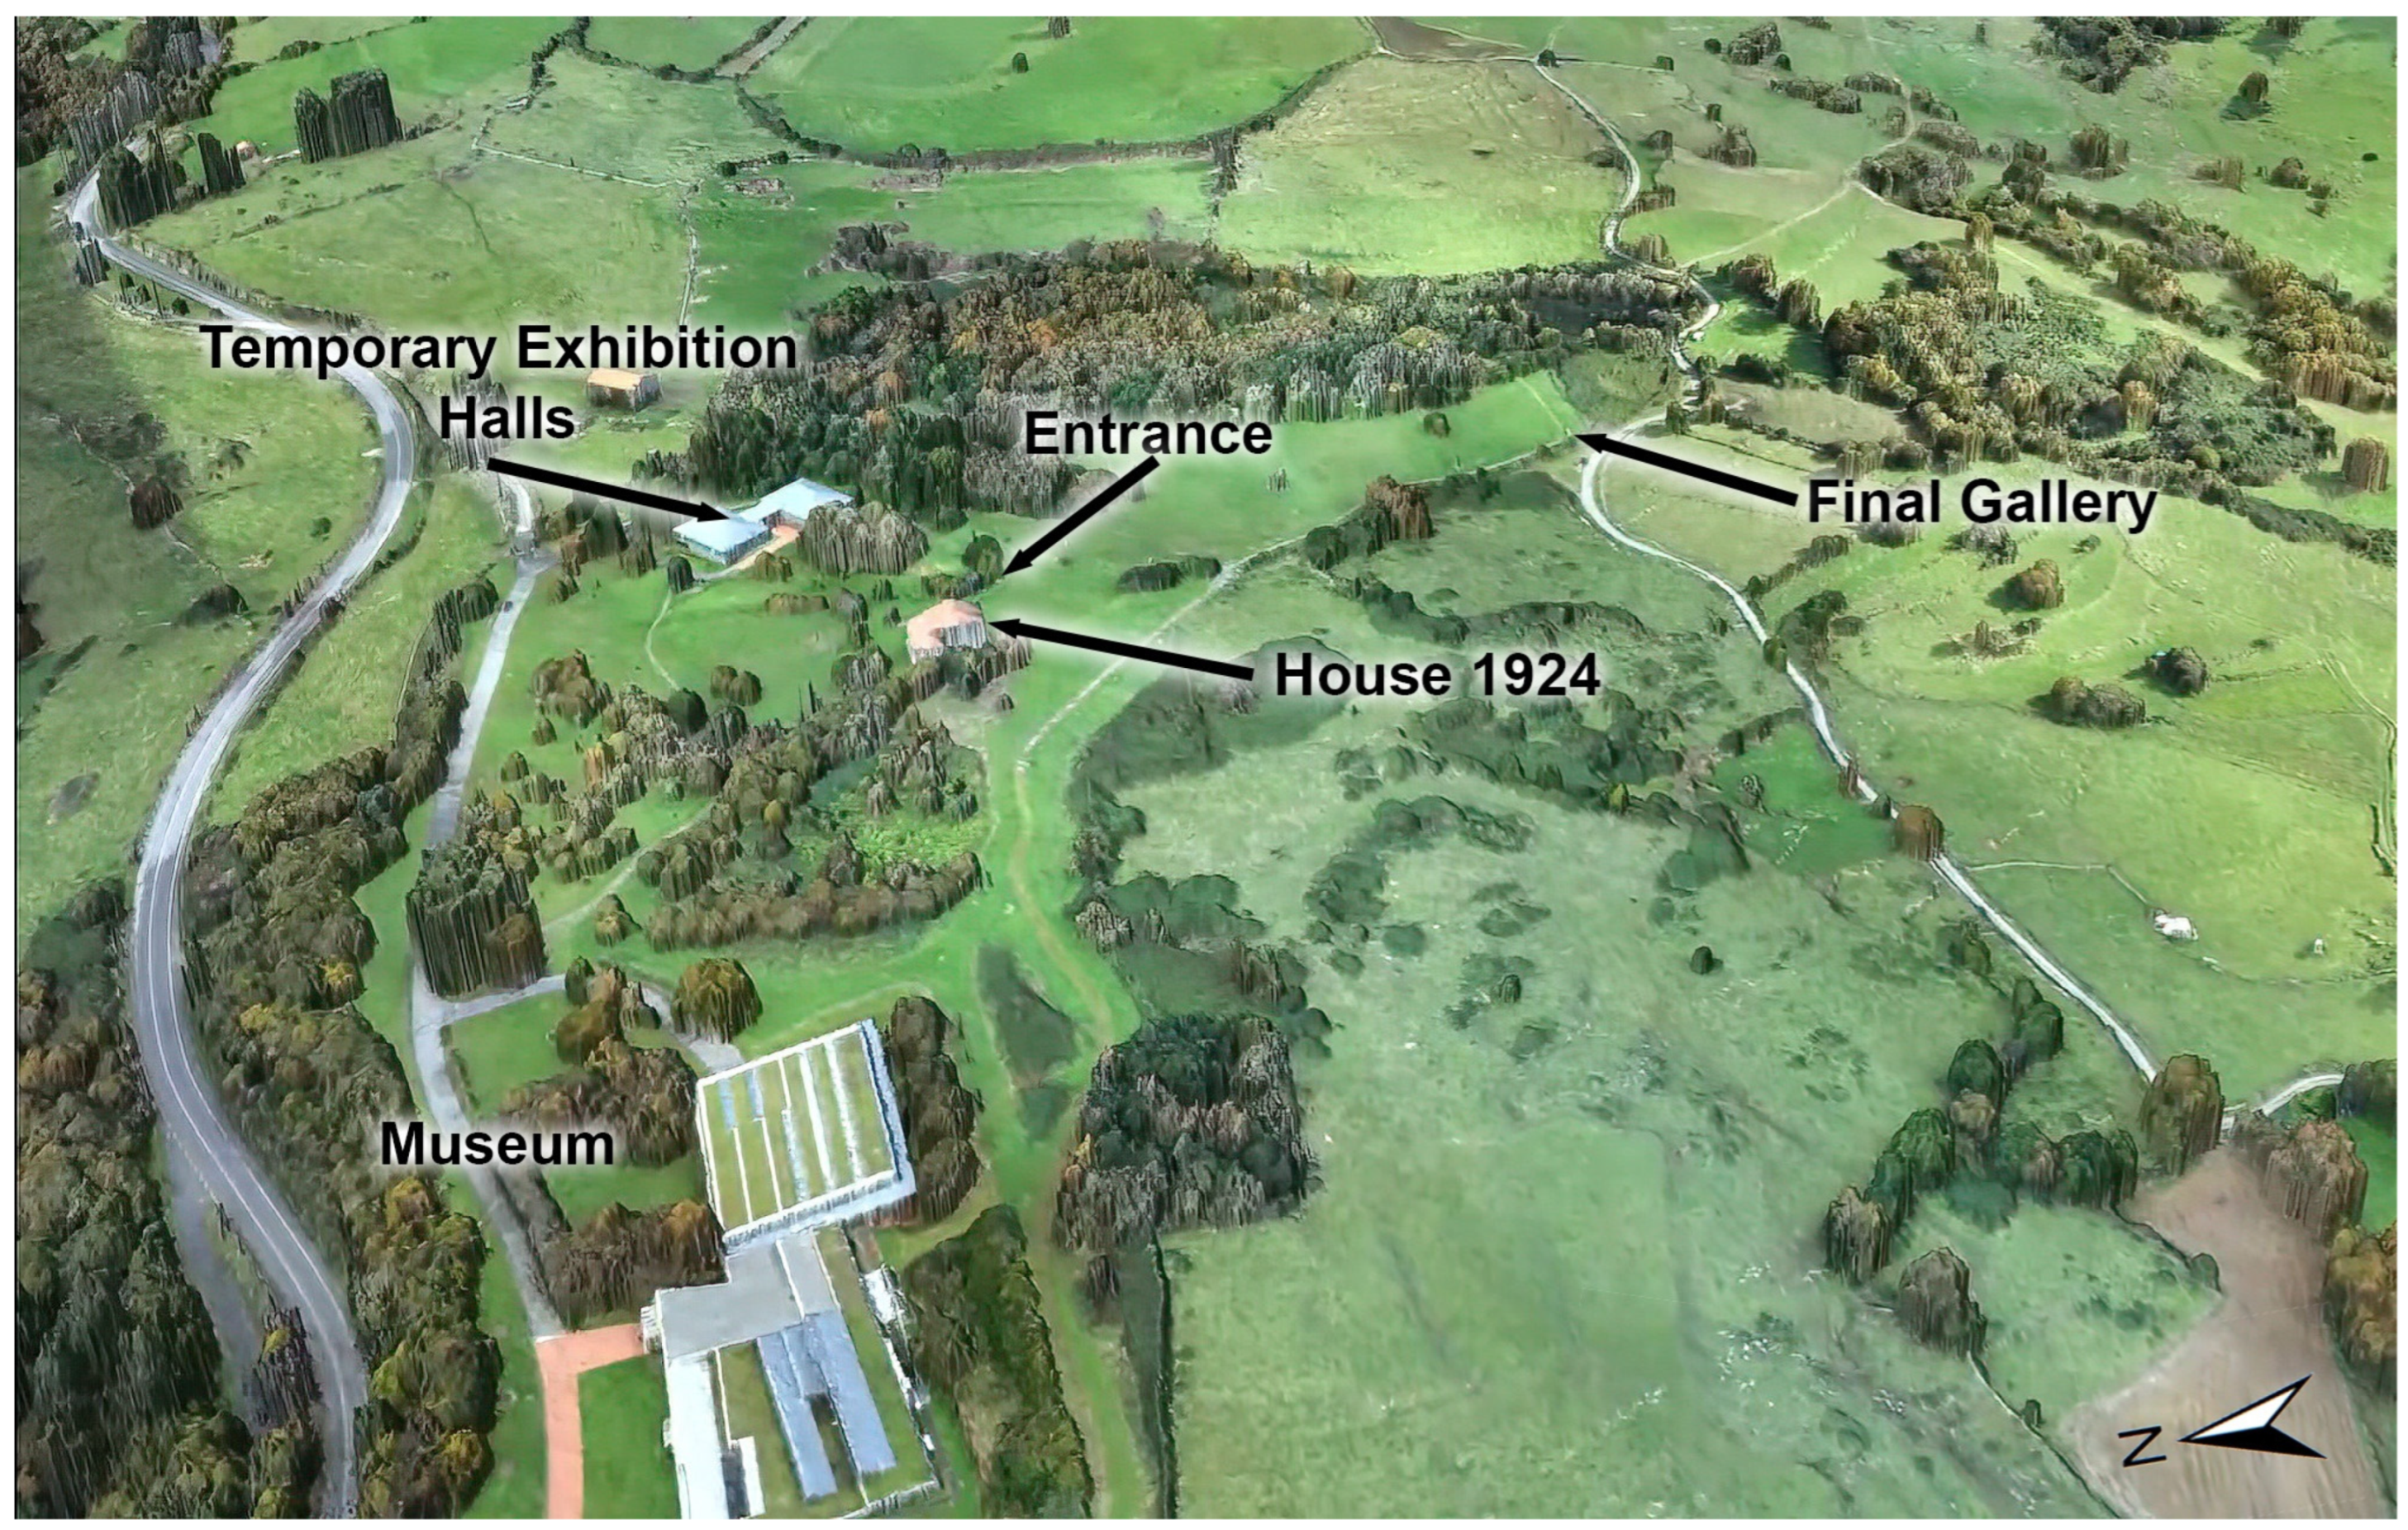
This allowed us to obtain 2D information such as orthoimages, 2.5D information such as a Digital Surface Model, which was filtered to remove trees to obtain a Digital Elevation Model (DEM), and 3D information such as point clouds and a 3D model of the whole area. The 3D model of the cave environment (40 Ha) was created at a definition of 12 million triangles textured with 8 textures of 8192 × 8192 pixels (Figure 4), while the model of the area next to the cave (4 Ha) was created with 4 million polygons and 4 textures of 8192 × 8192 pixels, which is the model we used for integrating the rest of the data. Both models were exported to .Obj, a geometry definition file format, to be integrated with other data.

2.4. Ground-Penetrating Radar

Ground-Penetrating Radar (GPR) is commonly used in the investigation of the internal structure of rock masses, which are generally defined as mechanically discontinuous, anisotropic and heterogeneous environments [43,44,45]. GPR provides continuous, high-resolution information on the internal structure of a rock mass and its physical properties in both vertical and lateral directions [46,47,48,49]. The data recorded with the GPR (radargrams) depend on the transmission of the electromagnetic wave in the medium and the amount of energy reflected, diffracted, or critically refracted by the medium. Therefore, the propagation of a wave depends on the electromagnetic properties (magnetic permittivity, electrical conductivity, and dielectric permittivity) of the medium through which it is transmitted and the contrast of these electromagnetic properties with those of other media.
In a rock-mass survey, GPR is used to map discontinuities, mainly fractures, joints, cavities, detachments, and bedding planes [50,51,52,53,54]. To study the features of a karstic system, the GPR technique is useful for mapping and assessing rock discontinuities [55,56,57,58,59,60].

2.4.1. Field Data Acquisition

It was necessary to collect data from the whole site of the Altamira Cave and its surroundings. A three-dimensional (3D) GPR methodology was carried out to pinpoint and define the existence and geometry of the main discontinuities and fractures in the karst system where the cave is located. One feature of GPR surveying is the inevitable decrease in resolution with depth. The frequency of the antenna is a crucial choice. Different resolutions and penetration depths can be achieved using antennas with different nominal center frequencies: higher resolution and shallower penetration depths are typically obtained with higher frequency antennas, while deeper penetrations and lower resolution are achieved with lower frequency antennas [61,62]. A commercial GPR equipment SIR-3000 (GSSI) was used for the study. In this study, we present the results of three GPR grids.
-
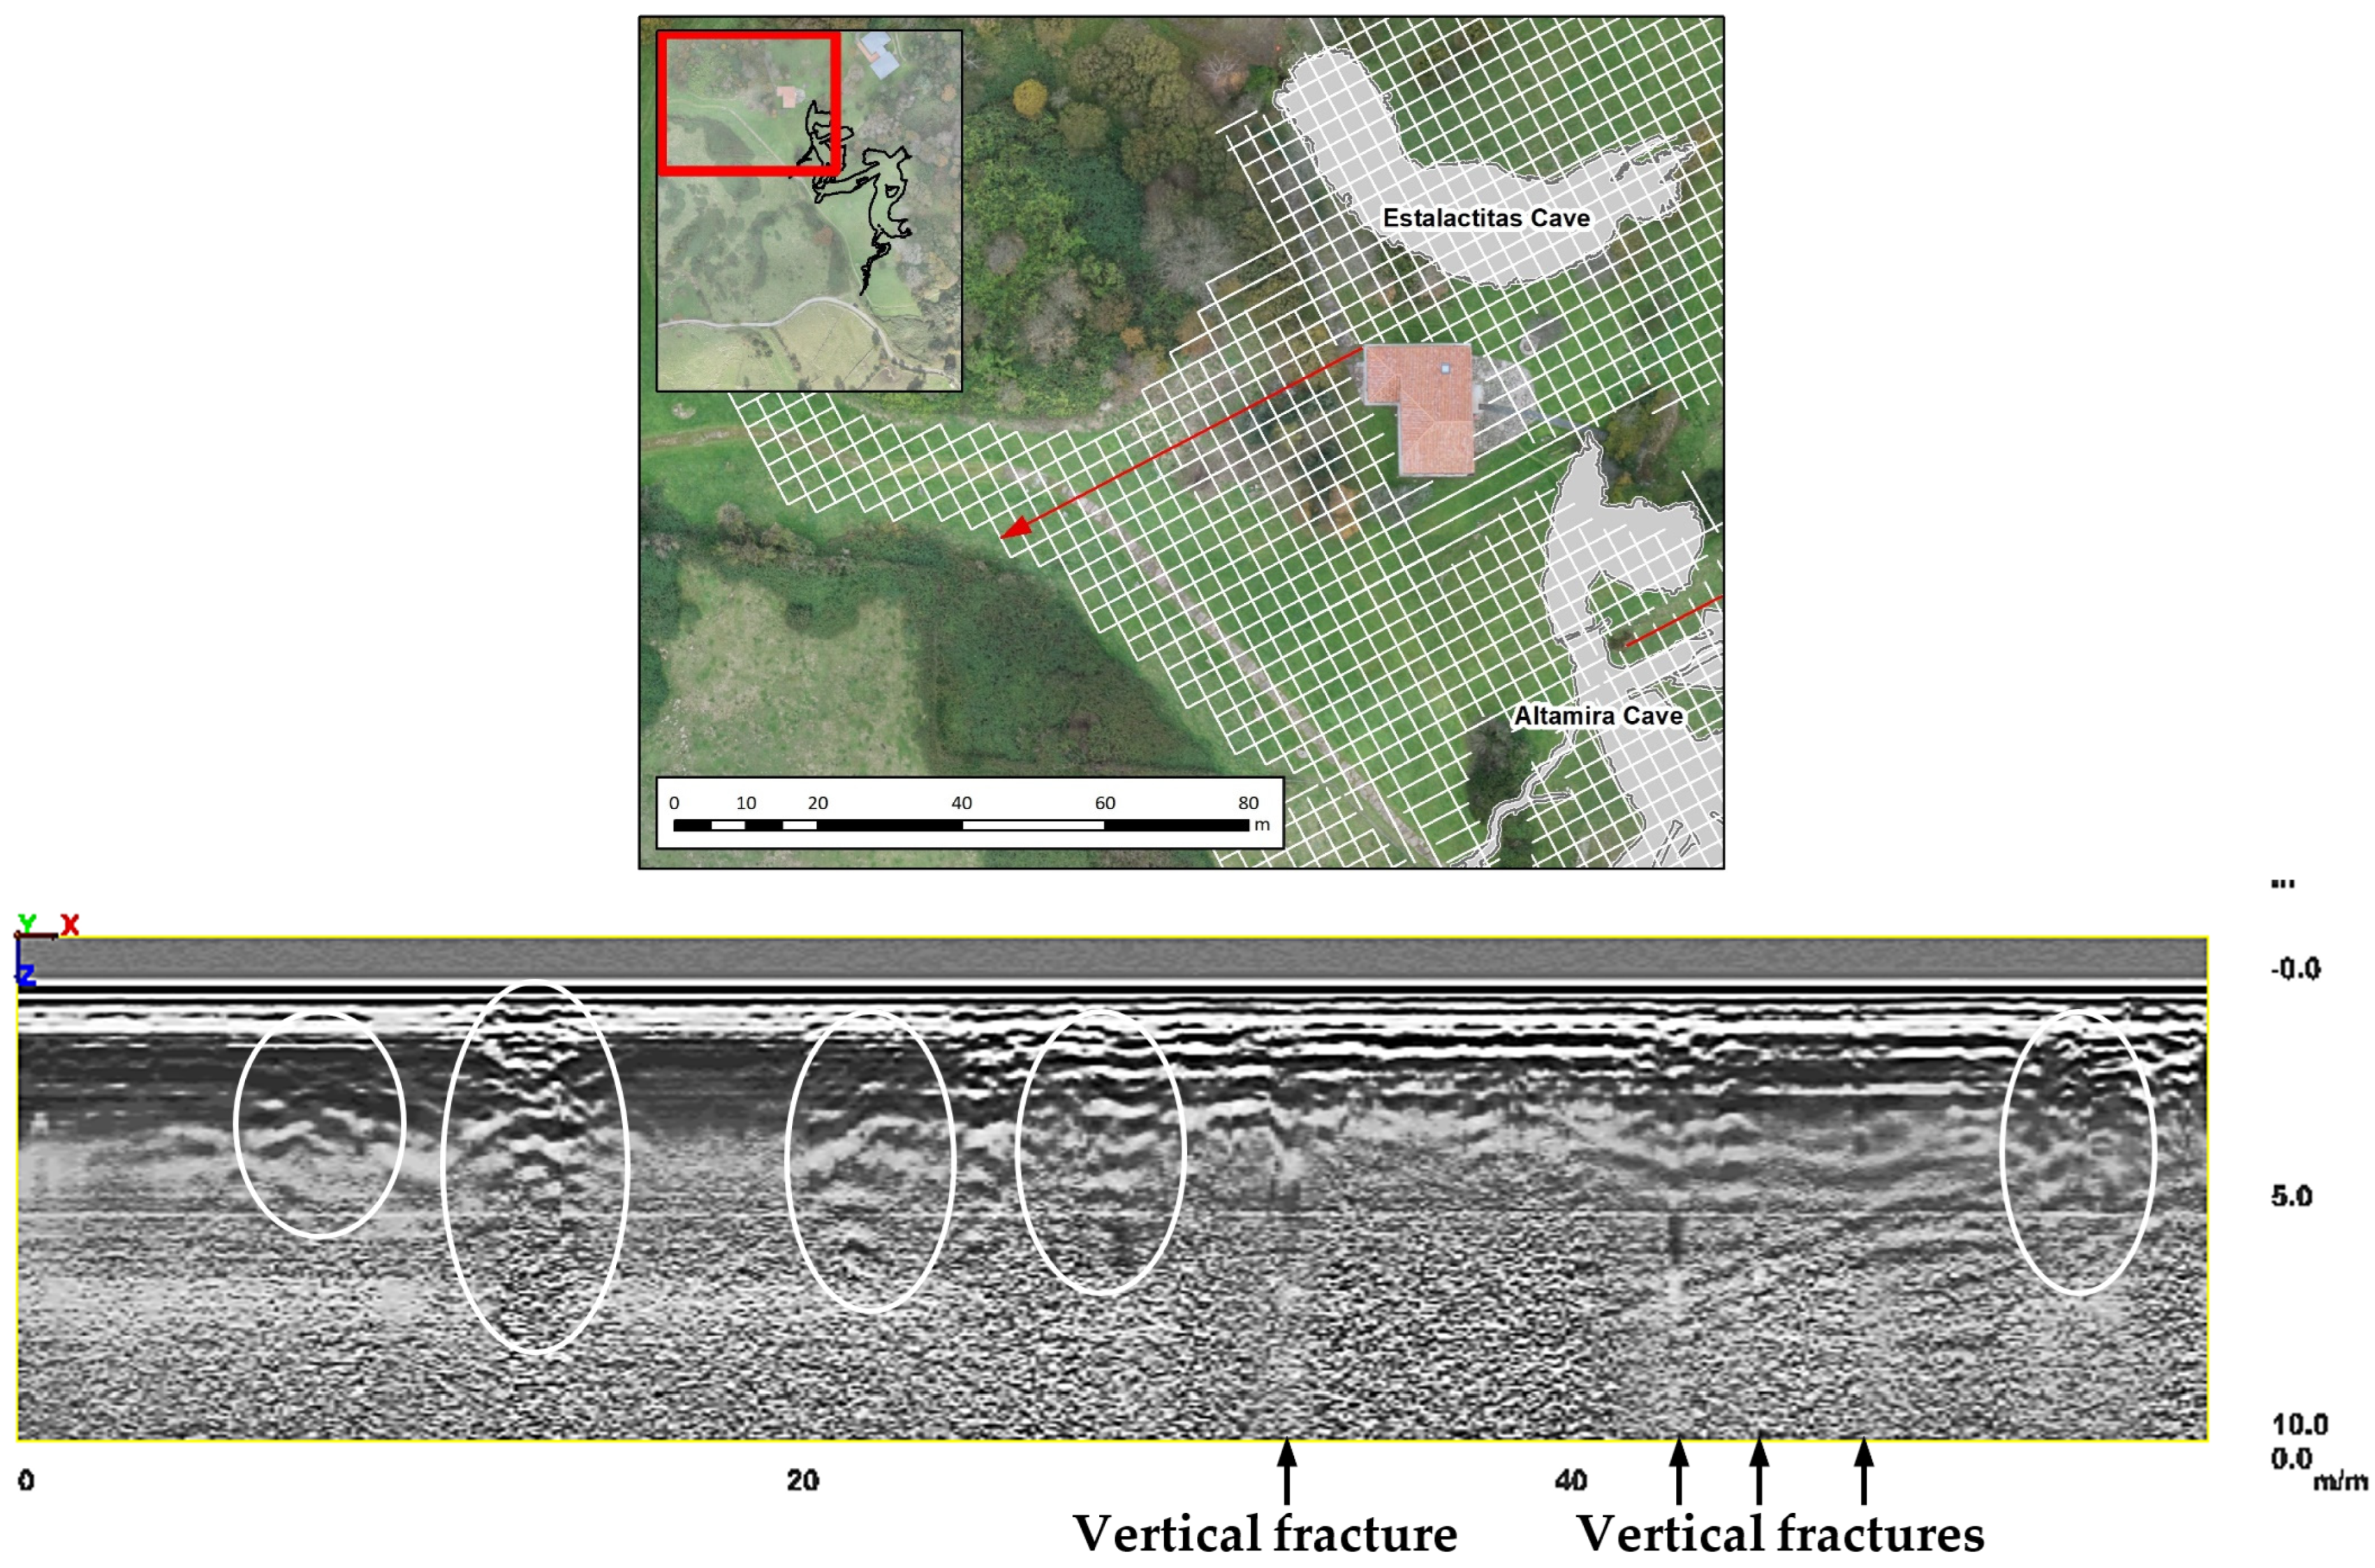
In order to pinpoint discontinuities and karst structures in deep layers, a 100 MHz nominal center frequency antenna was used for the area in and around Altamira Cave. The 100 MHz antenna was able to penetrate to depths of about 10 m in the study area, and a centimeter resolution could be achieved [63,64]. The design of the GPR profile grid mainly took into account the dimensions and directionalities of a series of karst structures and faults, in some cases extending over more than half a kilometer, mapped in previous studies in the Altamira Cave area [65,66]. Therefore, a profile grid for GPR data acquisition was designed with equidistant 2D orthogonal lines, spaced every 3 m, with respect to a longitudinal axis that was, in turn, perpendicular to the main fracture directions in the Altamira Cave area, as described in these previous studies. Every 2D profile line was topographically georeferenced by GNSS (Figure 5 and Figure 6).
-
Due to the importance of the cave paintings on the Polychrome Hall ceiling for the Cave of Altamira, it was considered necessary to study the first meters of its overlying rock strata and its lapiés area in greater detail and at a higher resolution. Two GPR profile grids were planned in the Polychrome Hall area:
A profile grid for the study of its strata in the first meters using a 400 MHz nominal center frequency antenna to identify discontinuities and karst structures. The 400 MHz antenna was able to penetrate to depths of about 4 m in the study area, with centimeter resolution [67].
A profile grid for the study of its lapiés zone using a 900 MHz nominal center frequency antenna to define the lapiés groove system. The 900 MHz antenna was able to penetrate to depths of about 1.5 m in the study area with a centimeter resolution [68].
These two grids were designed according to the extensive system of lineaments in the exterior and interior of Altamira Cave, mainly in the form of joints and with predominant directions N45, N68, N110, N168, and N-S [69]. Accordingly, both profile grids for GPR data acquisition were designed with equidistant 2D orthogonal lines, spaced every 1 m, with respect to a longitudinal axis that was, in turn, perpendicular to the main joints directions in the Polychrome Hall area, as described in the aforementioned previous study. Every 2D profile line was topographically georeferenced by GNSS (Figure 7 and Figure 8).
In the field campaign, 454 profiles were recorded: 329 profiles totalling 20,850 m2 were surveyed with the 100 MHz antenna, 76 profiles totalling 850 m2 with the 400 MHz antenna, and 49 profiles totalling 550 m2 with the 900 MHz antenna.

2.4.2. Data Processing

Velocity Estimation

The GPR reflection data was acquired in the same week under very similar weather conditions with no rainfall. Thus, the subsurface moisture conditions in this investigated area could be considered almost constant for the investigated depth during the acquisition of the GPR field data. This velocity estimation assumption was made for the velocity-to-depth conversions, considering that possible changes in subsurface conditions could cause velocity variations that would affect these velocity-to-depth conversions [61,69].
The average velocity of the GPR wave was determined by the hyperbola fitting method on a set of hyperbolas recorded in different profiles, obtaining an average velocity value of 11.17 cm/ns. The dielectric permittivity (ɛ) was calculated to be 7.2, according to the following equation for low-loss media [61,62]:
ε = c v 2
where v is the electromagnetic wave velocity and c is the velocity of light in free space (c ≈ 29.97 cm/ns).
This value was applied for the calculation of the processed depths in the investigated site of Altamira Cave.

Selected Processing Flow

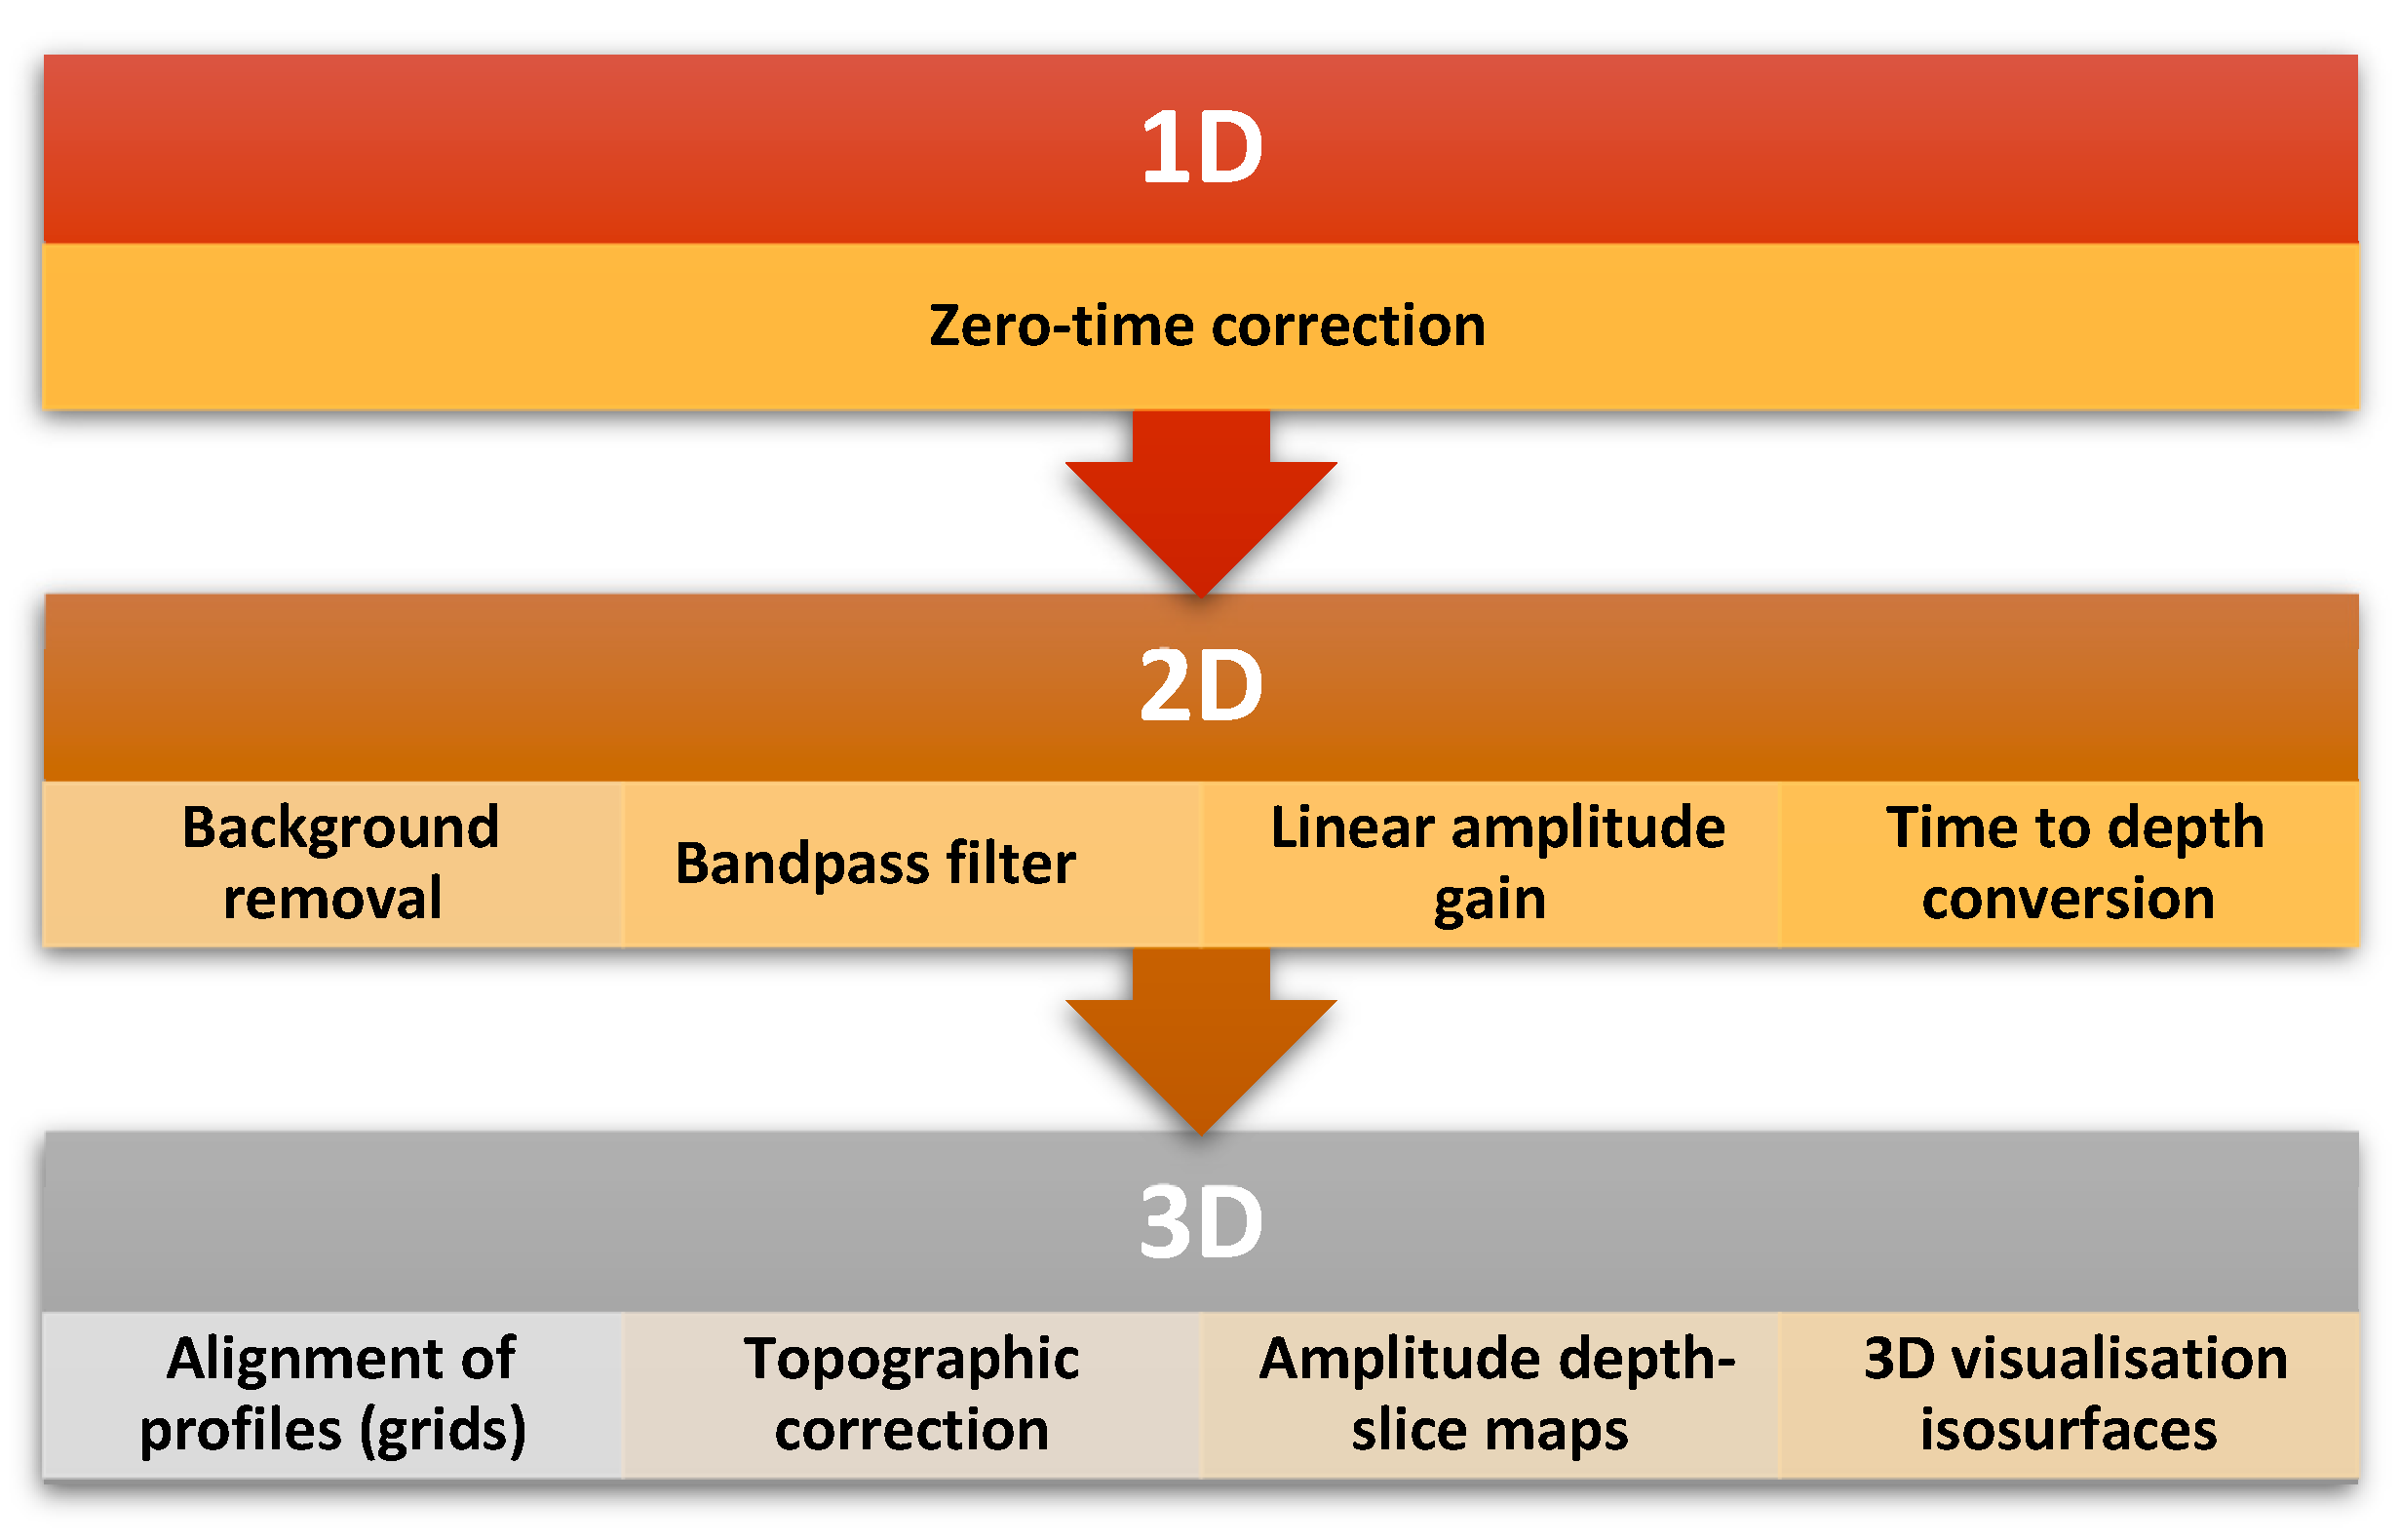
Post-acquisition processing procedures were applied to the raw field GPR data sets to produce amplitude maps and rendered 3D images with all reflection profiles in the grids [61,62,69]. In this study, a data-processing procedure was applied to the raw data sets using RADAN 7.6 software (Geophysical Survey Systems, Inc., GSSI). The main processing steps are shown in Figure 9. The first step was a 1D processing consisting of zero-time correction (time-zero adjustment). After this, the 2D processing was applied to the reflection profiles according to these steps: (i) background removal; (ii) bandpass filters; (iii) linear amplitude gains; (iv) a time-to-depth conversion based on the calculated velocity average for the overlying rock strata. Next, each processed reflector profile was aligned within the grids described, with corresponding topographic corrections, to produce 3D horizontal amplitude maps and isosurface images (isoamplitude surface rendering).

3. Results

3.1. Integration of UAV and 3DTLS

First, the UAV terrain model was integrated with the 3DTLS model of the cave because all information is georeferenced. From this, the surface position of the galleries and the proximity of the ceiling to the exterior terrain could be analyzed (Figure 10).
A cartography was created with the overlying layer thickness of the cave (Figure 11) [29]. These maps consist of a raster with a resolution of 1 × 1 cm2, in which each pixel has the minimum distance between the ceiling of the cave and the ground recorded by the UAV flight for each pair of XY coordinates [70].

3.2. Intregration of UAV and GPR

After processing the data recorded with the three central frequency antennas (100 MHz, 400 MHz and 900 MHz), we obtained 3D isosurface models with significant discontinuities in the overlying layer of the Altamira Cave bed and with higher resolution in the layer overlying the Polychrome Hall.

3.2.1. Results from the Overlying Layer of the Altamira Cave Site Derived from the 100 MHz Antenna

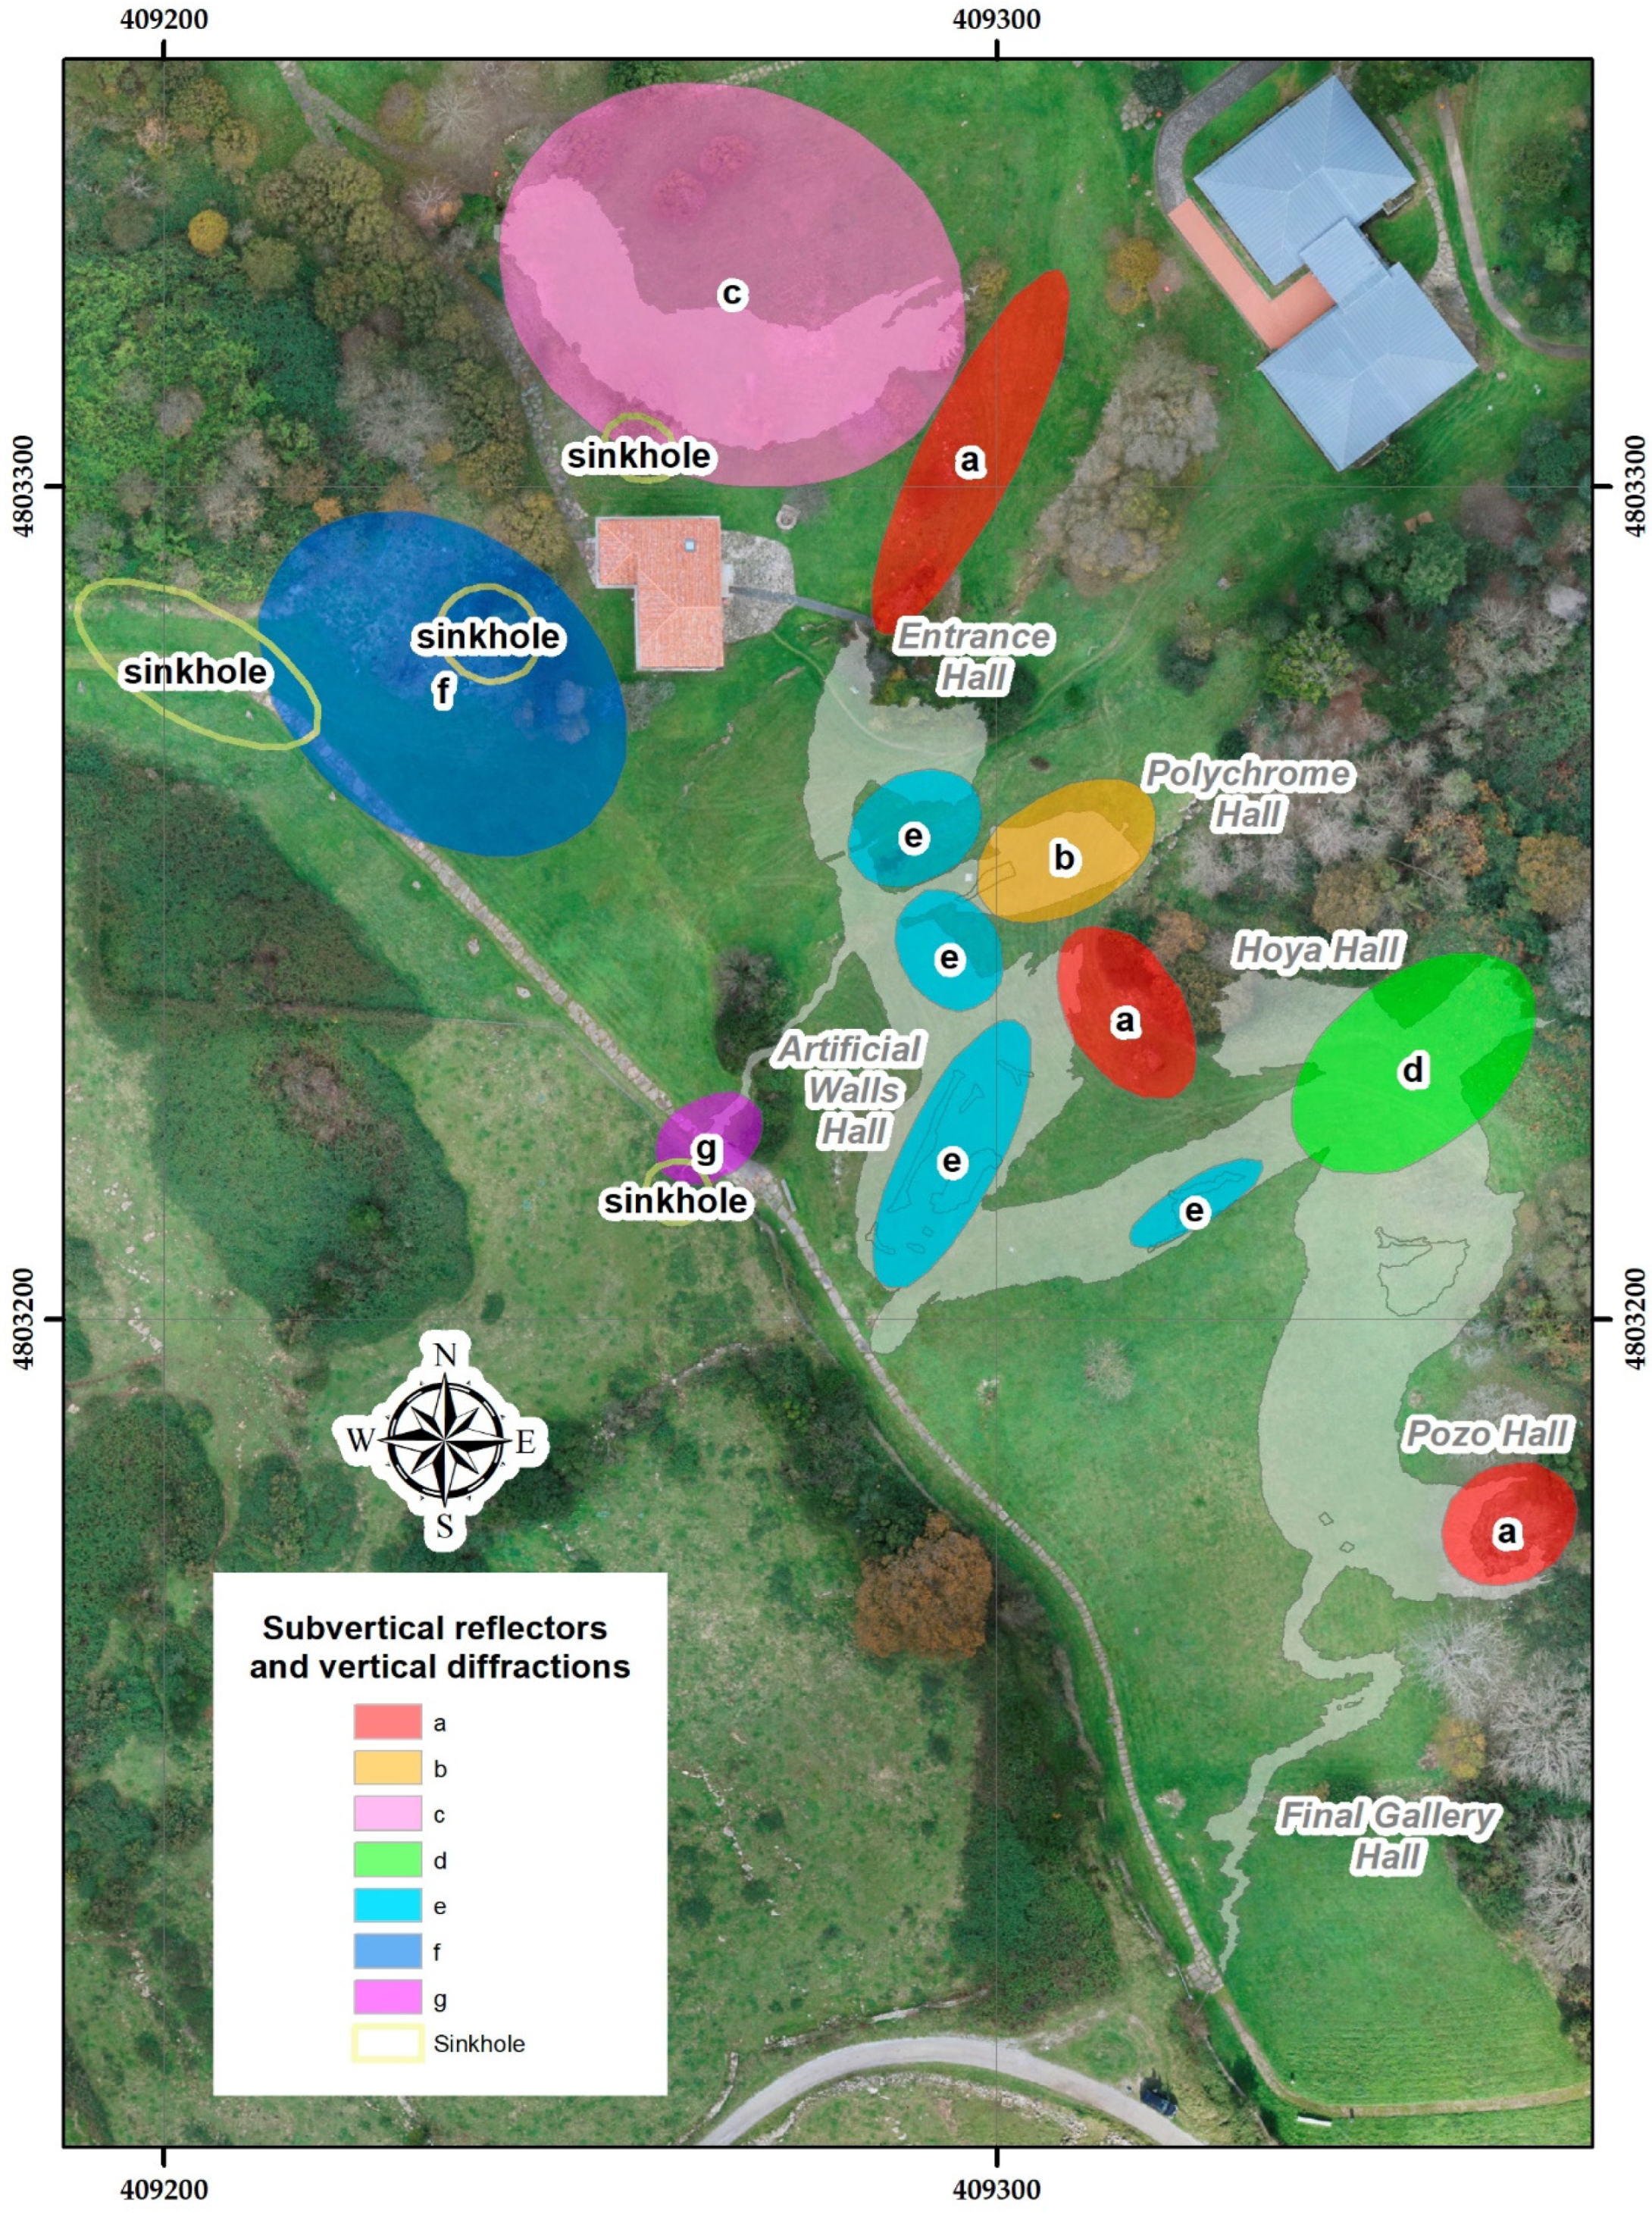
Subvertical reflectors and vertical diffractions were mapped and recorded in the GPR profiles that correspond to internal discontinuities in the rock mass (fractures, joints, detachments, bedding planes, etc.). Some of the vertical/subvertical discontinuities, with great in-depth development, were only a few meters from the surface. These vertical/subvertical discontinuities represent important accesses/pathways for the exchange processes between the interior of the cave and the exterior. Mainly, these vertical/subvertical discontinuities were detected in the following areas (Figure 12):
  • The surrounding sinkholes (cave entrance, areas of Hoya Hall and El Pozo).
  • The Polychrome Hall.
  • The Stalactites Cave.
  • The Hoya Hall.
  • The artificial walls.
  • An area to the NW where a house and a cowshed with its dunghill were located.
  • The end zone of the westernmost branch line.
In addition, this GPR survey pinpointed several sinkholes in two areas (Figure 12):
  • To the northwest of the Altamira Cave, specifically on the road to the south of the Museum building and where buildings and constructions demolished (house, bar, stable, and a dunghill) were located.
  • In the end zone of the westernmost branch line of Altamira Cave.
The existence of vertical/subvertical discontinuities (fractures) detected in the Hoya Hall area would justify the construction of the artificial walls at the beginning of the 20th century.
This mapping has revealed discontinuities in specific areas of the Cave de Altamira that suggest that in past times, the extension of the Cave was greater than it is today and that it had several entrances/accesses.

3.2.2. Results from the Overlying Layer of the Polychrome Hall Derived from the 400 MHz and 900 MHz Antennae

The 3D model from the data recorded with the 400 MHz center frequency antenna indicated two levels containing a large number of high amplitude reflectors and vertical diffractions in the first few meters of depth of the overlying layer (Figure 13):
  • A first level from the surface to a depth of about 1.20 m, which corresponds to the lapiés zone.
  • A second level located in a variable interval between 1.70 m and 2.80 m depth, which may correspond mainly to the existence of fractures, joints, and an extended zone of detachments.
A presence of a number of vertical/subvertical discontinuities (fractures) connecting these two levels and extending in depth (>3.80 m depth) was also detected. These mapped discontinuities represent significant access/pathways for the exchange processes between the interior of the Polychrome Hall and its external environment.
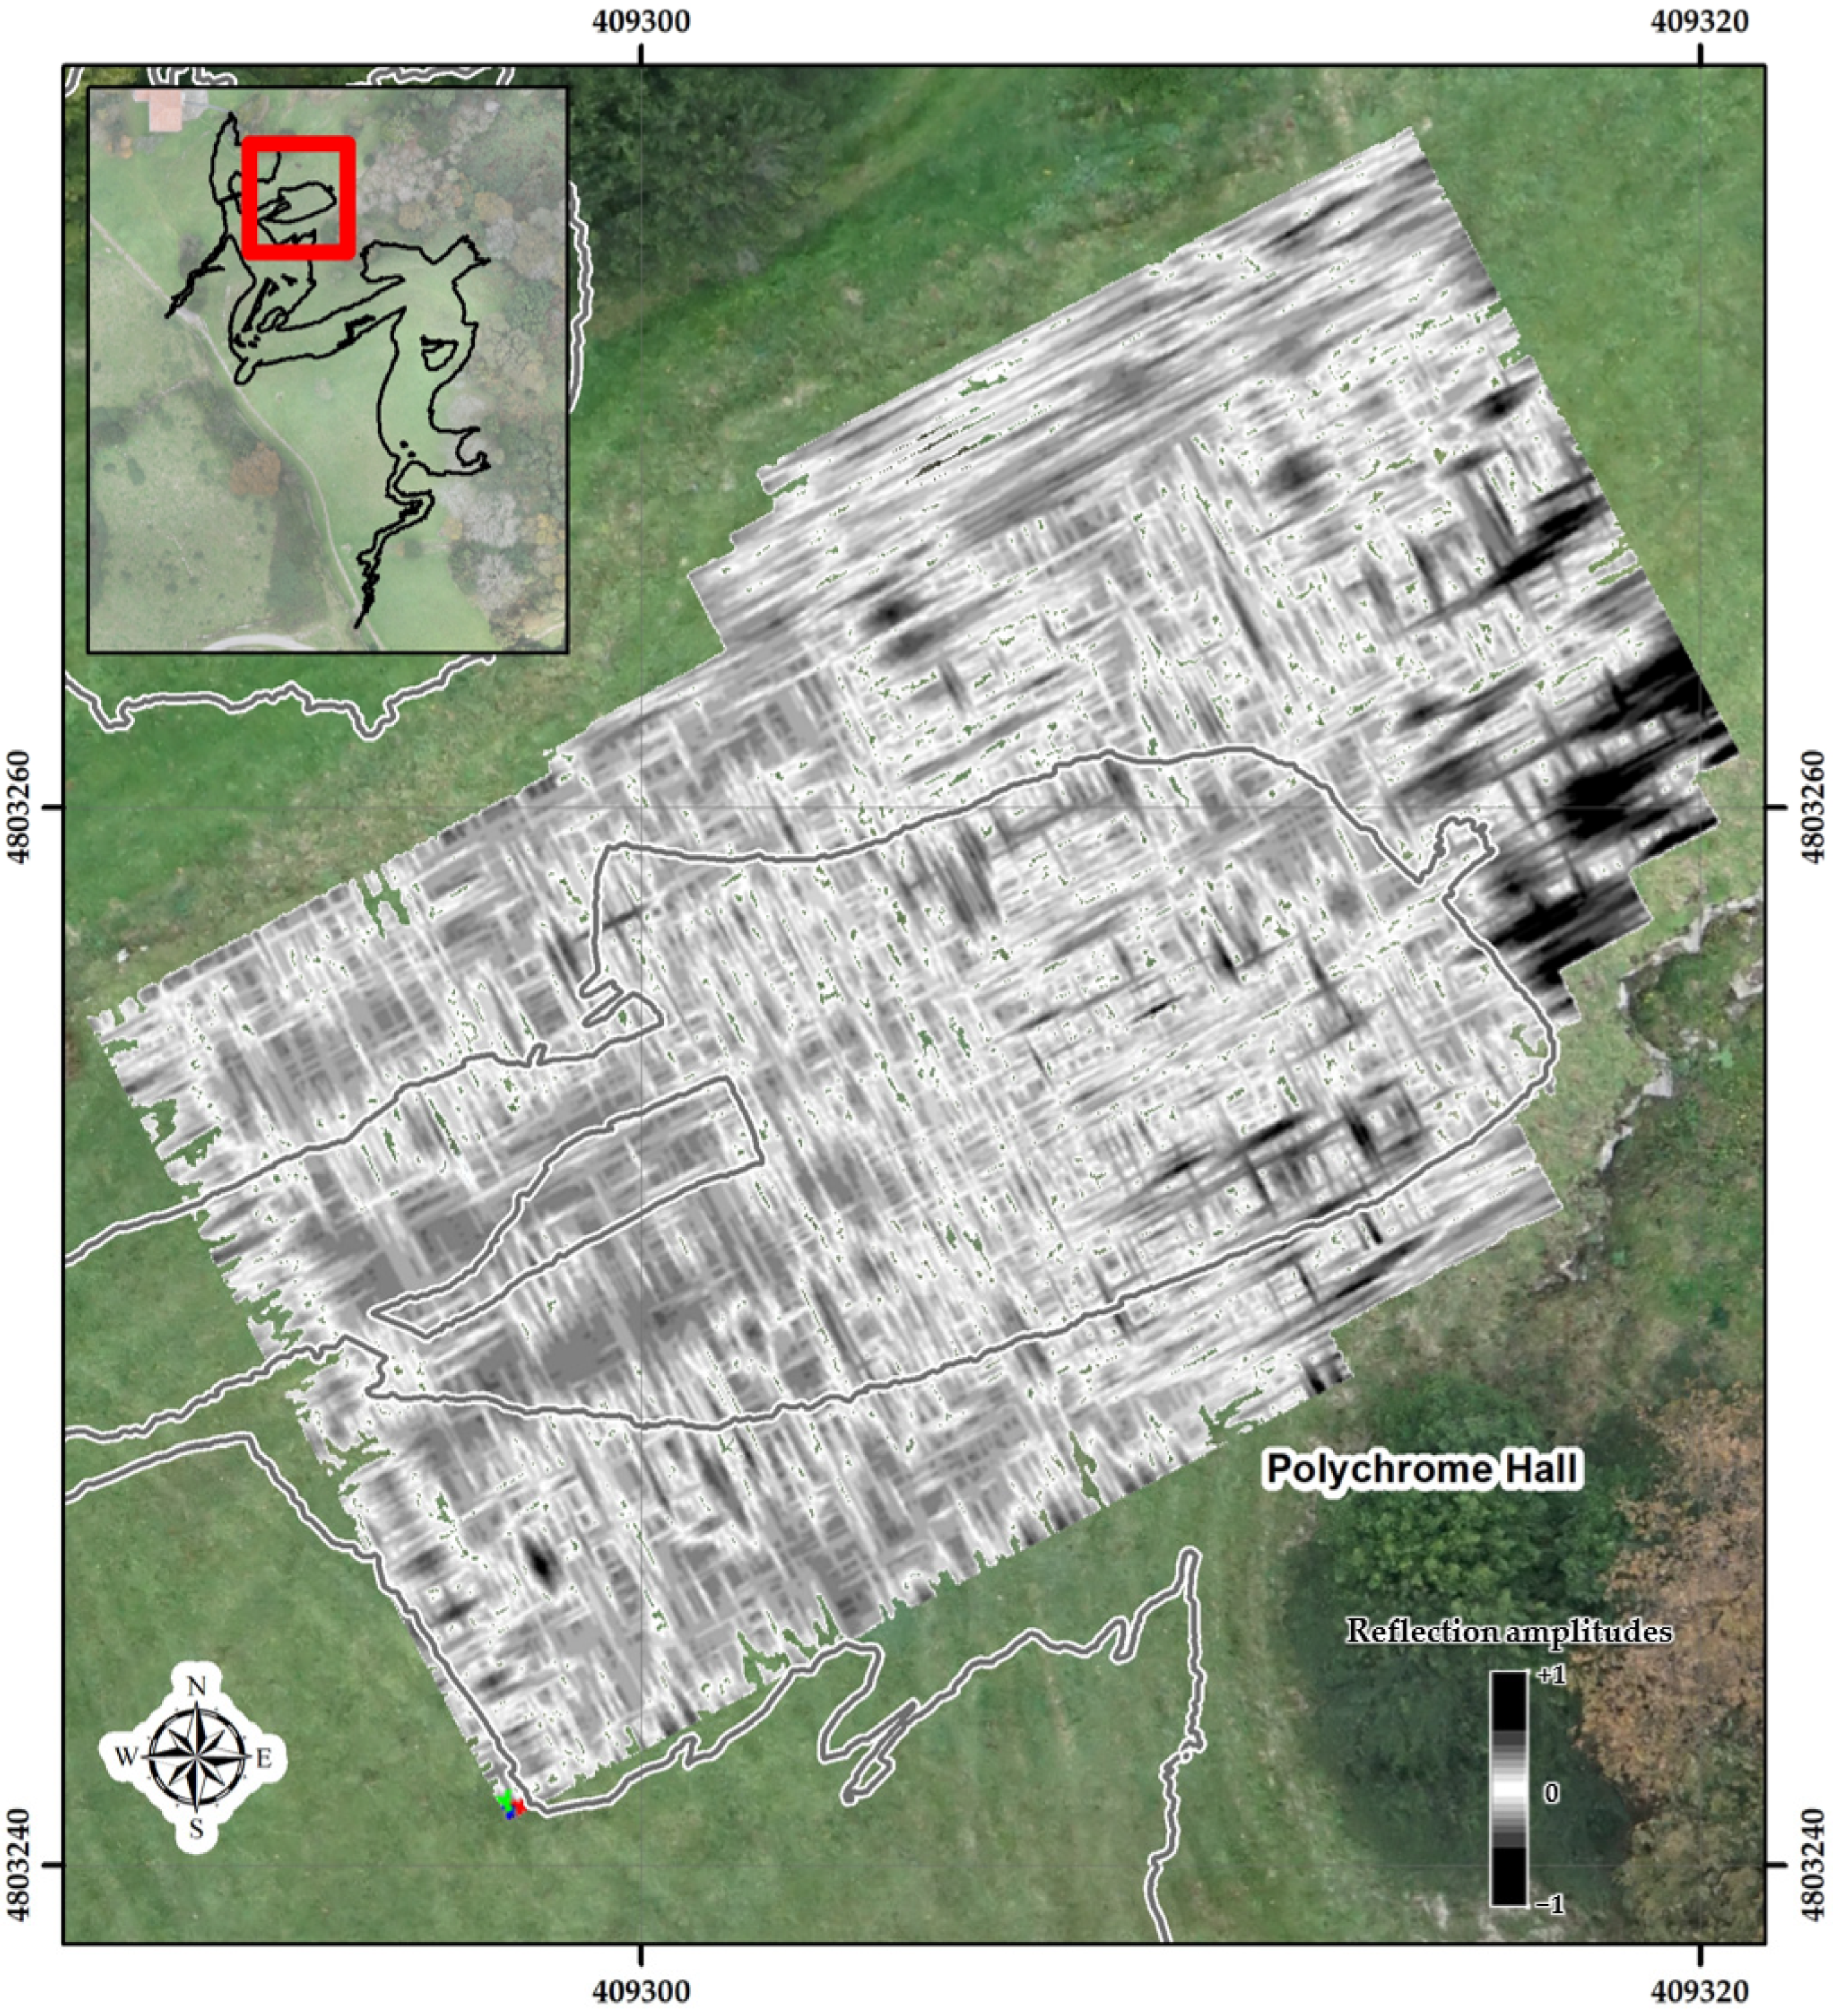
The second level was detected only to the north and east of the projection of the Polychrome Hall (Figure 14). This level could represent an area of water load located at a higher level than the ceiling of the Polychrome Hall, i.e., there is a probability of a local and temporary generation of a hanging aquifer where water from the surrounding area would build up on possible impermeable levels at its base. It is also necessary to consider the possibility that in times of high exterior–interior exchange, many particles deposited there may end up inside the Polychrome Hall.
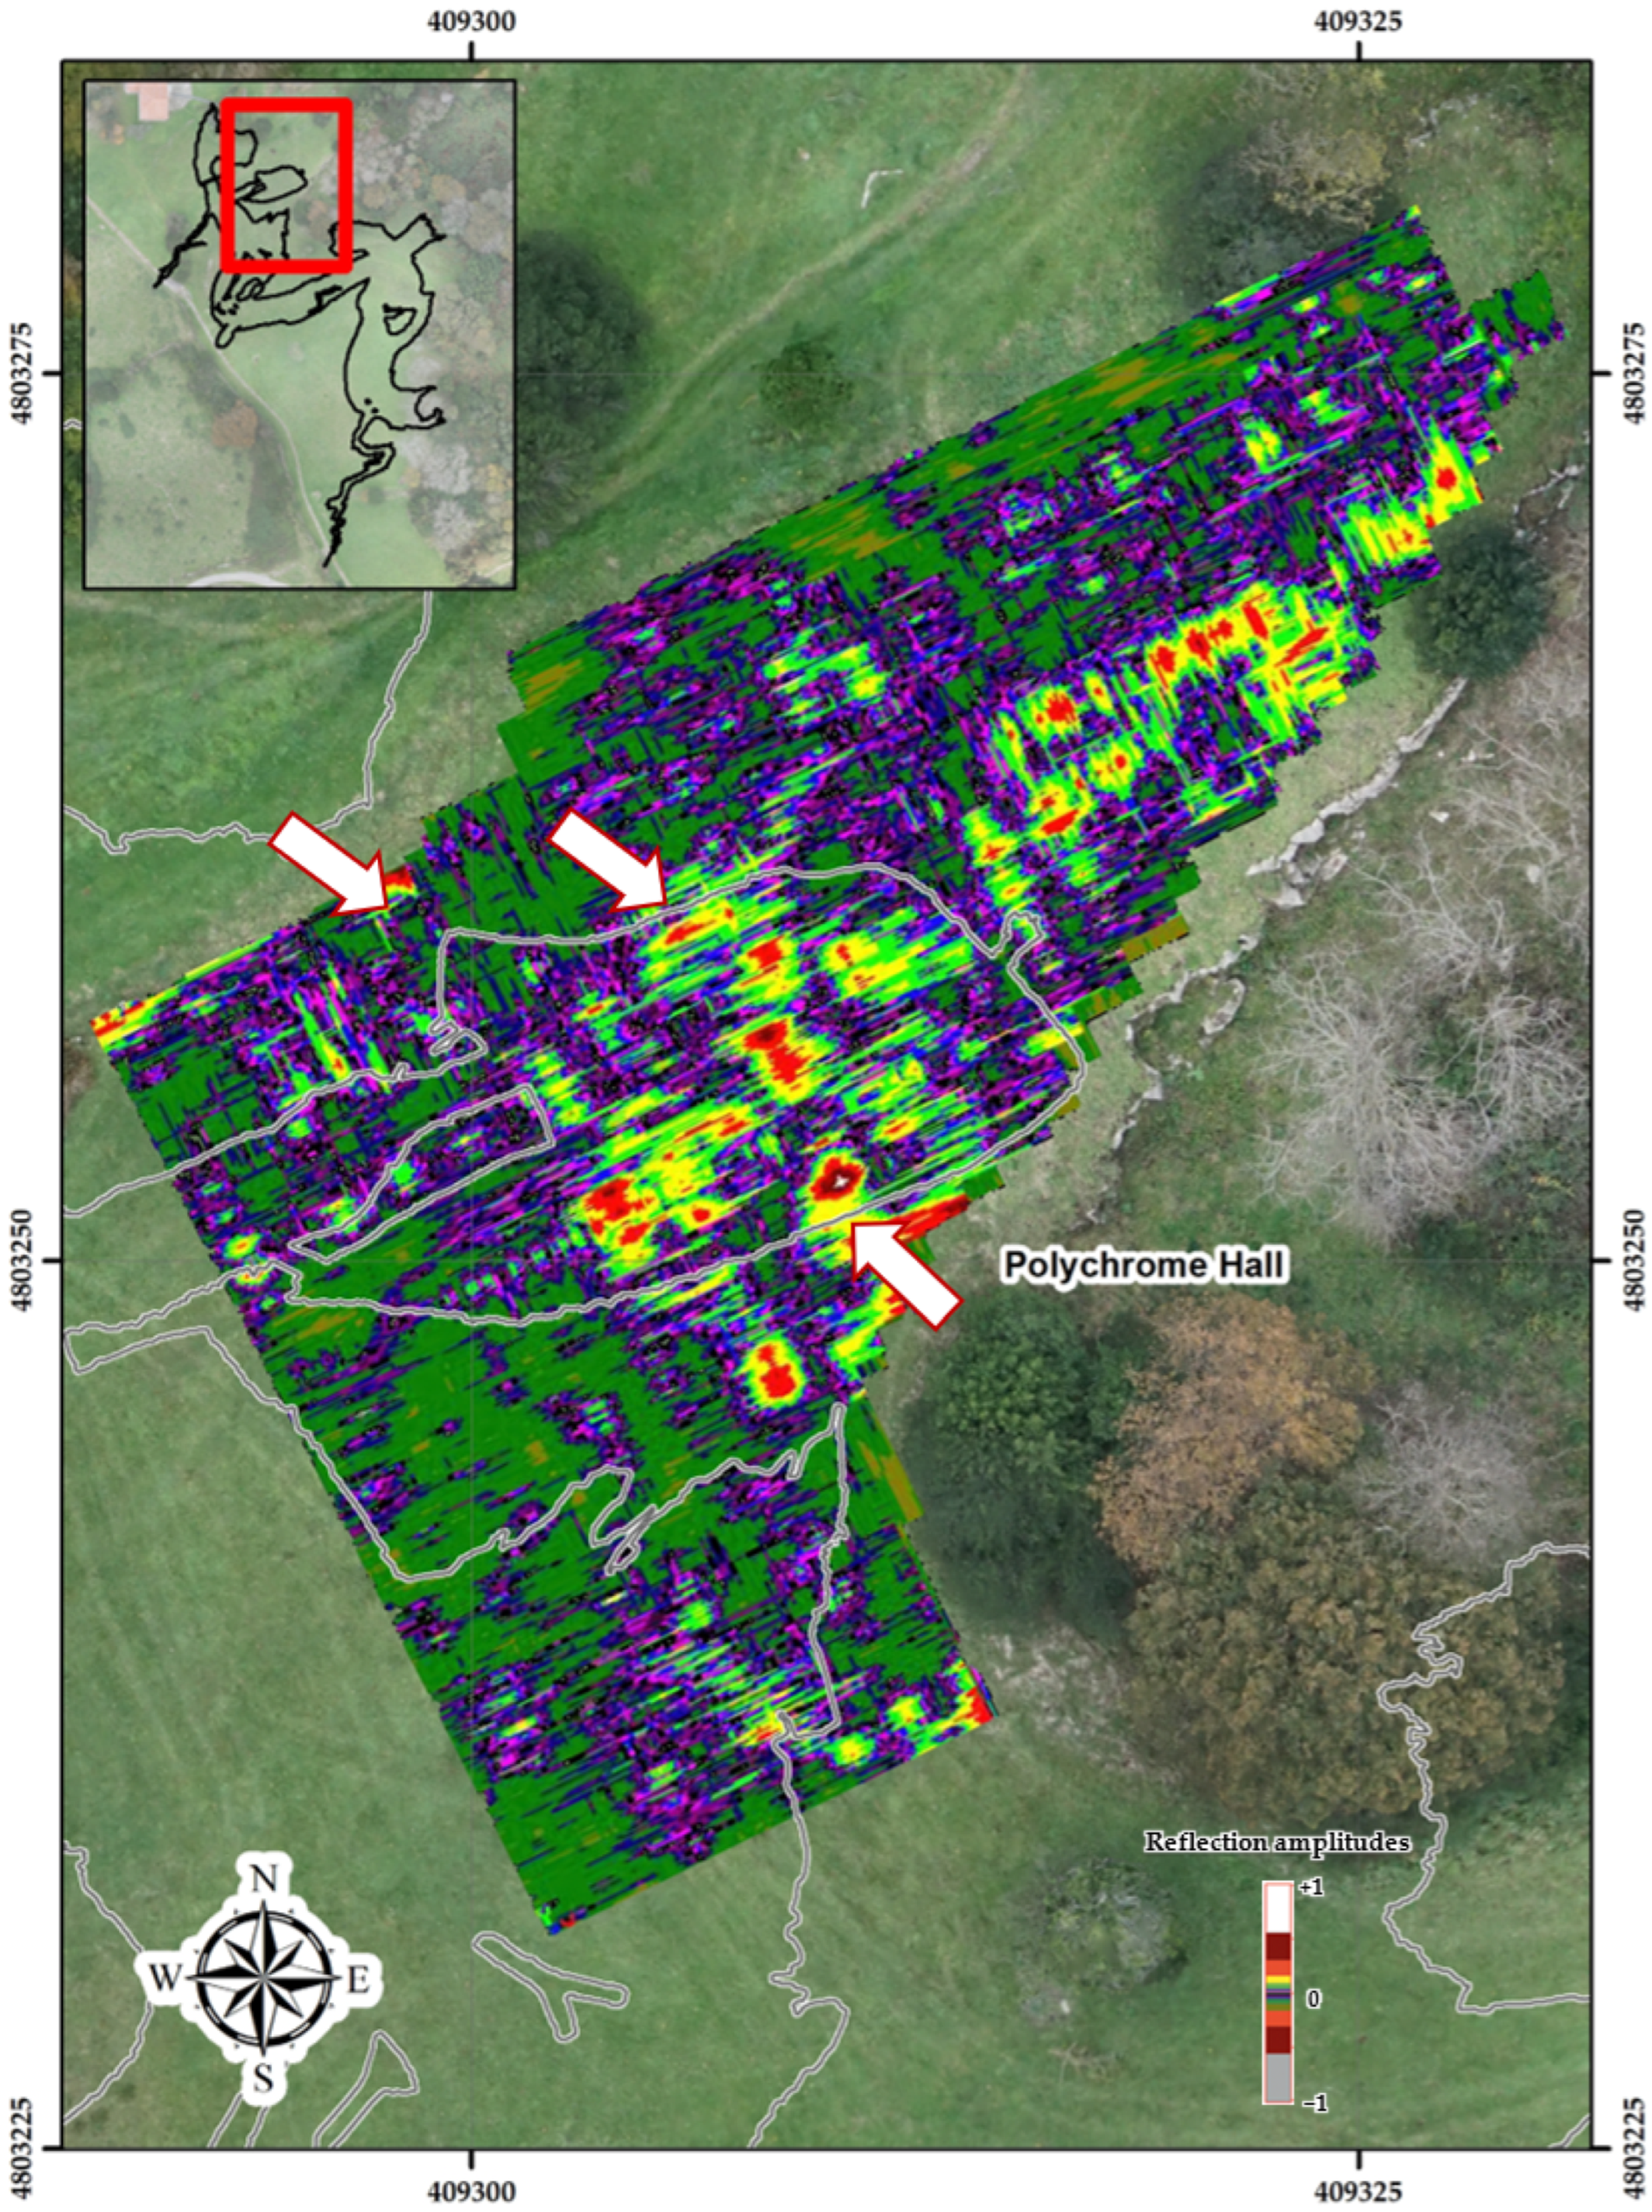
In addition, this second level could contribute to the direct and lateral infiltration (impluvium) of water into the horizons that make up the geological structure of the overlying layer of Polychrome Hall. This is the case in three of the vertical fracture zones observed and coincides with the temporary contributions of water in the walls of the Polychrome Hall, with two of them being located in its north wall and one of them in its south wall, as shown in Figure 15.
In addition, the existence of this detachment level (level of high-amplitude reflectors), which borders the Polychrome Hall to the north and east, could be related to
the decision at the beginning of the 20th century to construct the artificial walls to the north and east of the Polychrome Hall, or
the current topography of the surface above Polychrome Hall, reflecting a change in orientation and slope that tilts towards the NE on the surface, which coincides with the surface projection of this detected level of high amplitude reflectors (Figure 16), or
the distensive processes caused by the collapse of the sinkholes surrounding the north and southeast of the Polychrome Hall [65,66,67,68,71].
In summary, we observed that the overlayer of Polychrome Hall is more affected by fracturing in its northern and eastern areas. Similarly, its fracturing increases from west to east.
The 900 MHz center frequency antenna was used for the 3D study of the lapiés area of the Polychrome Hall. In this study, a large number of high-amplitude reflectors were recorded and mapped from the surface to about 1.20 m depth. These high-amplitude reflectors correspond to the rugged water-modeled limestone surface, consisting of rock pinnacles separated by grooves. The lineaments of this groove complex in the lapiés derived from 3D mapping agree with the predominant directions of the joint system (N45, N68, and N168) mapped in the Polychrome Hall rock outcrops [68]. (Figure 17). This lapiés area represents a permeable soil system that allows both runoff and infiltration of water, as well as the flow of gases.

3.3. Visualization of the Integration of UAV, 3DTLS, and GPR

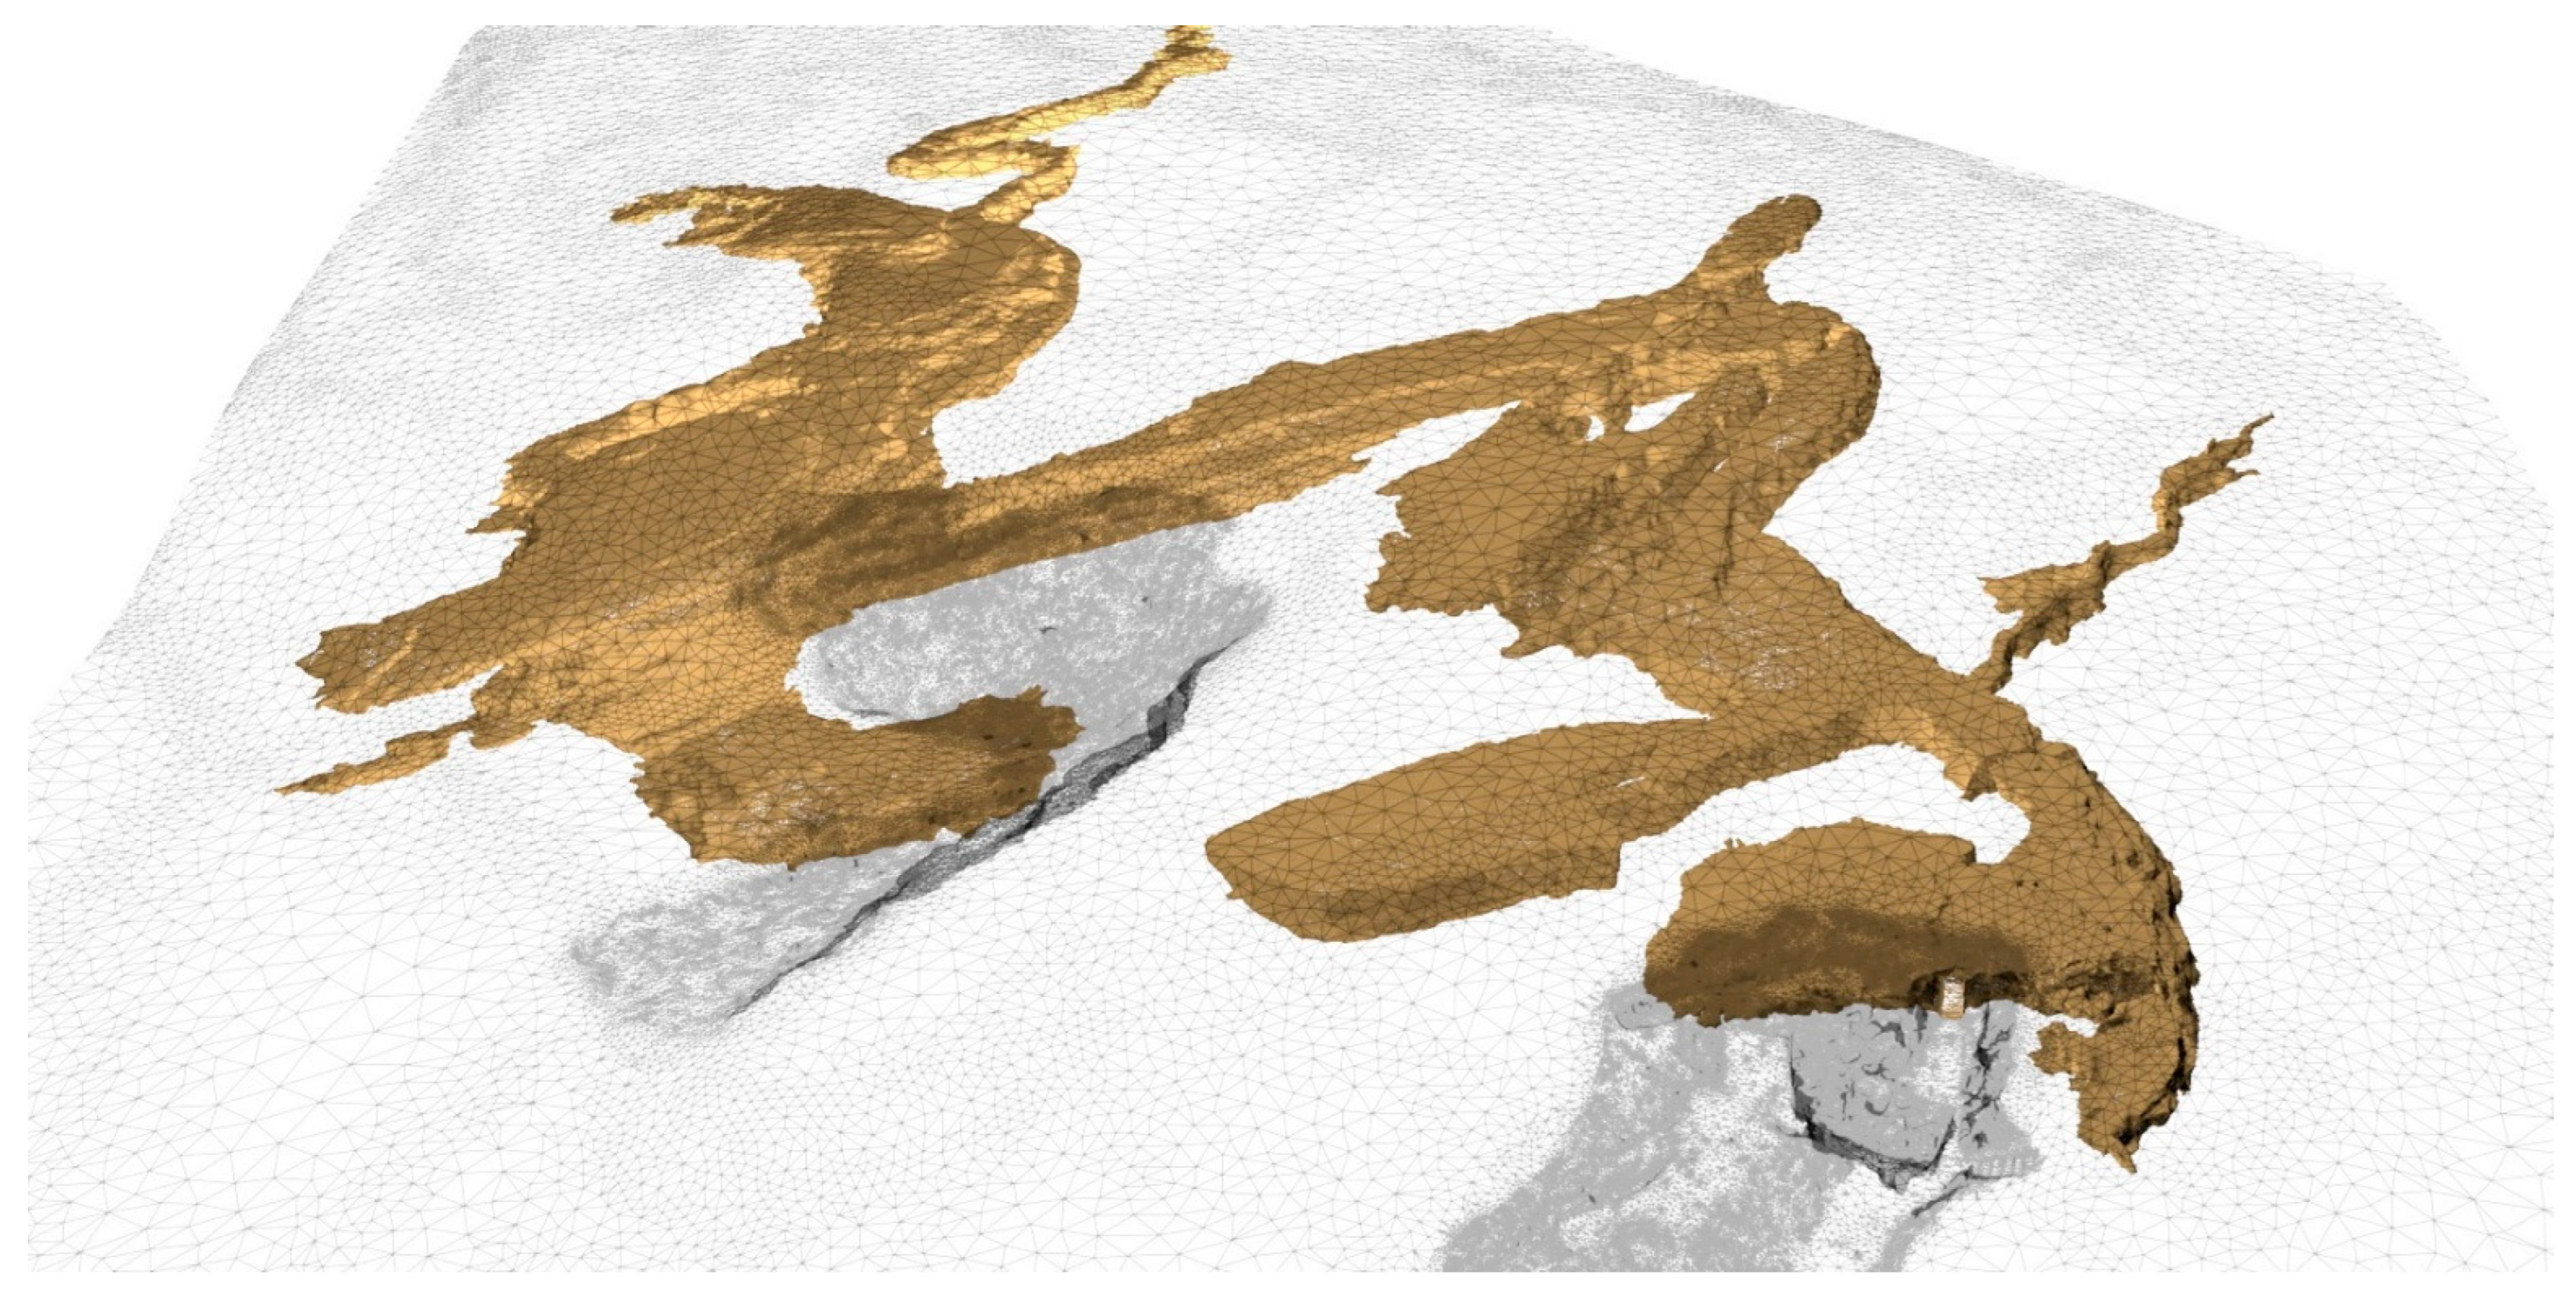
The 3D GPR model derived from the 100 MHz antenna recordings provides information about the most important discontinuities in the Altamira Cave karst system up to a depth of about 8 m (Figure 18).
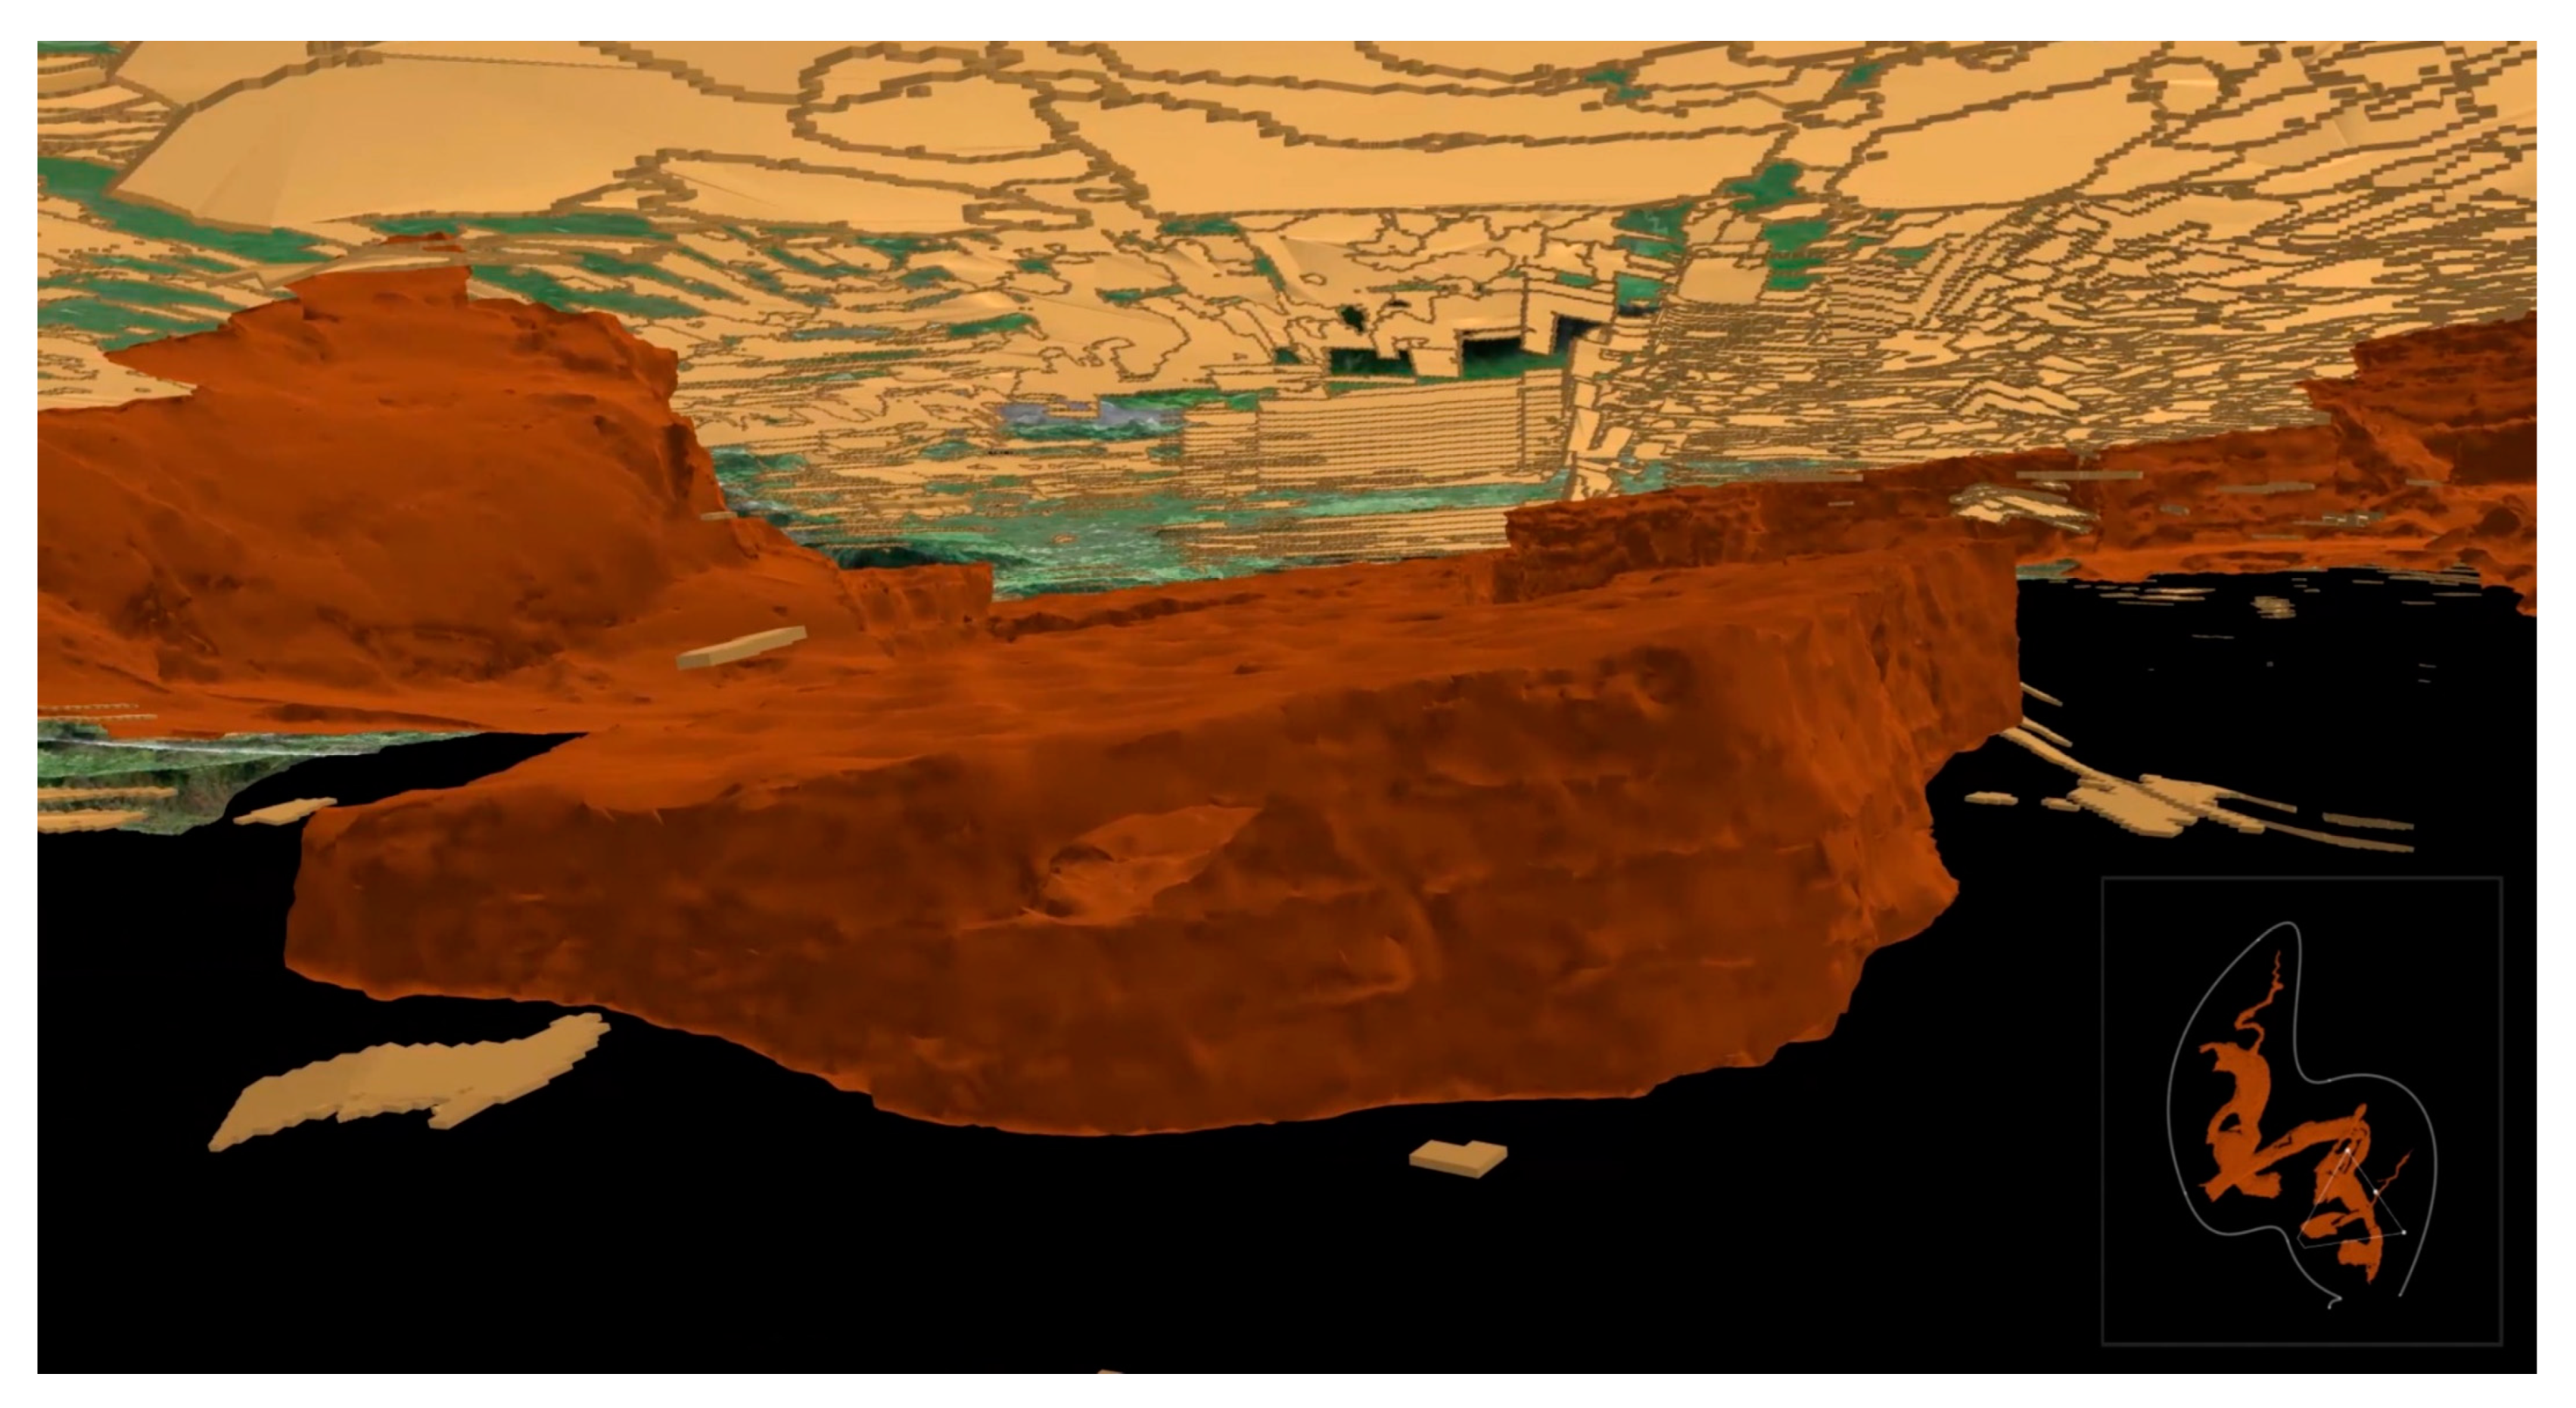
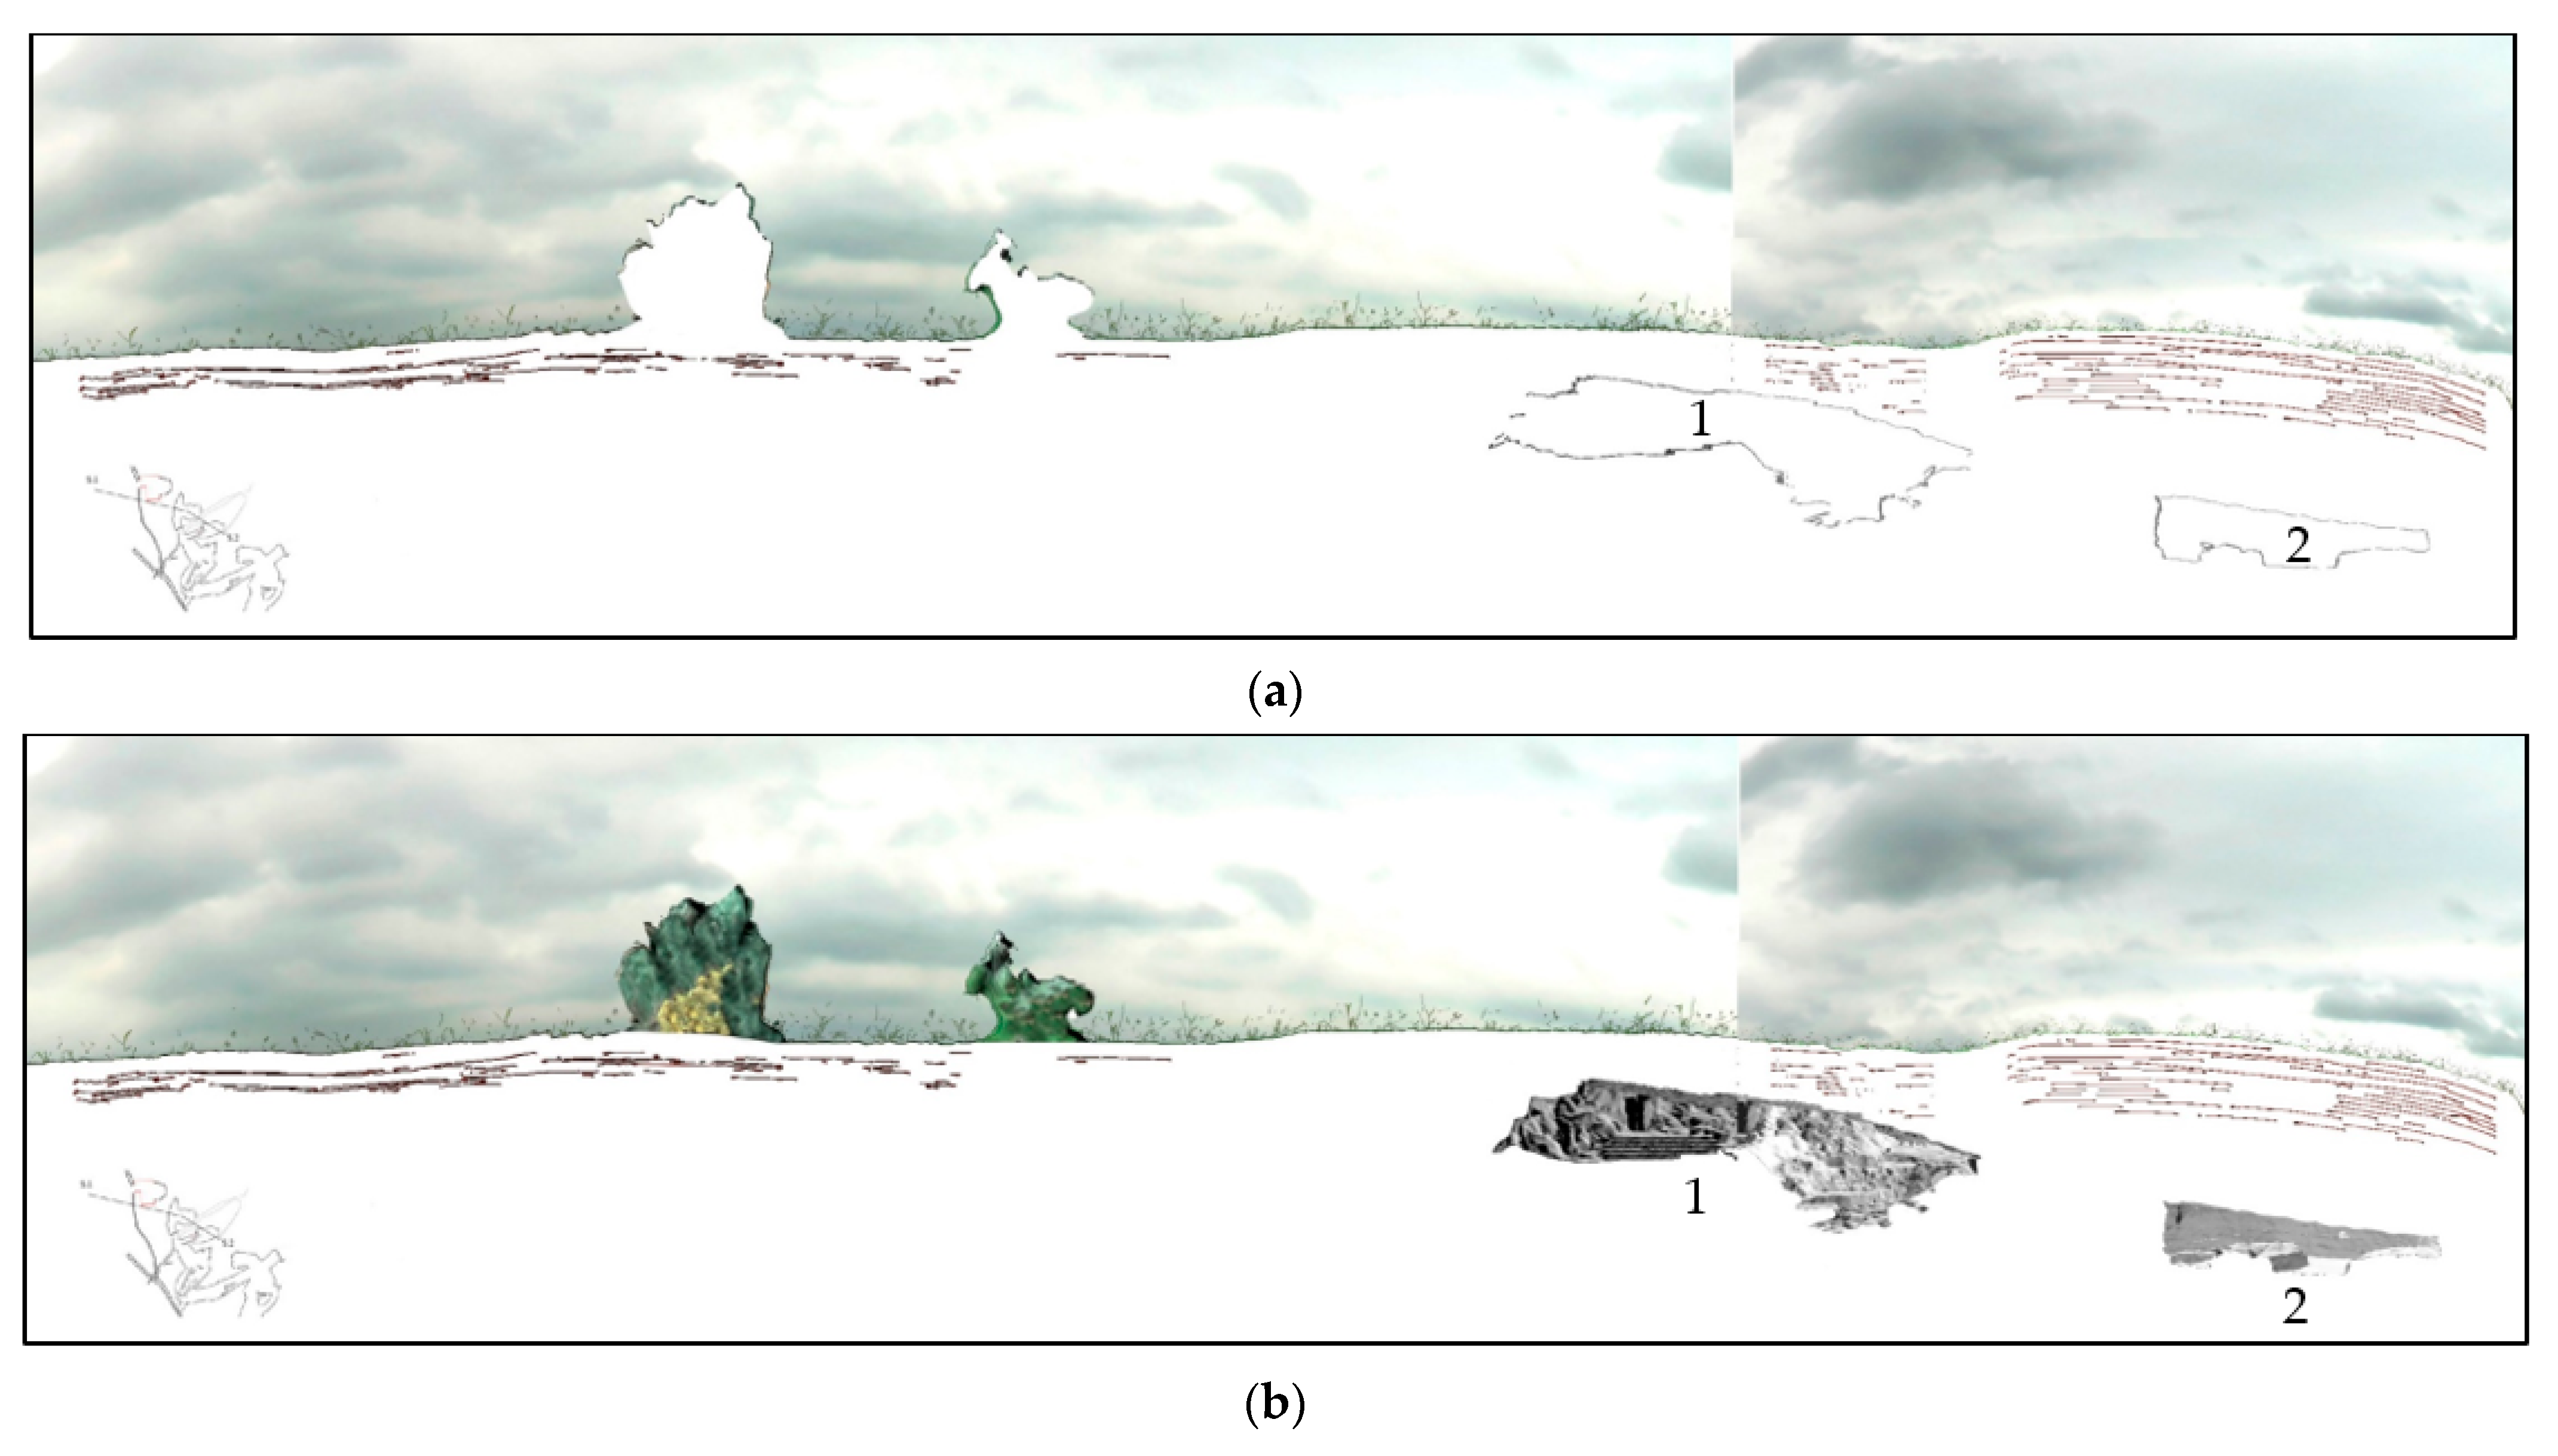
This model, showing the 3D amplitude isosurfaces, has been integrated with the UAV and 3DTLS models in Blender, an open-source 3D computer graphics software [72], to manage data and determine the spatial relationships between them by measuring or making sections (Figure 19) with variable thickness.
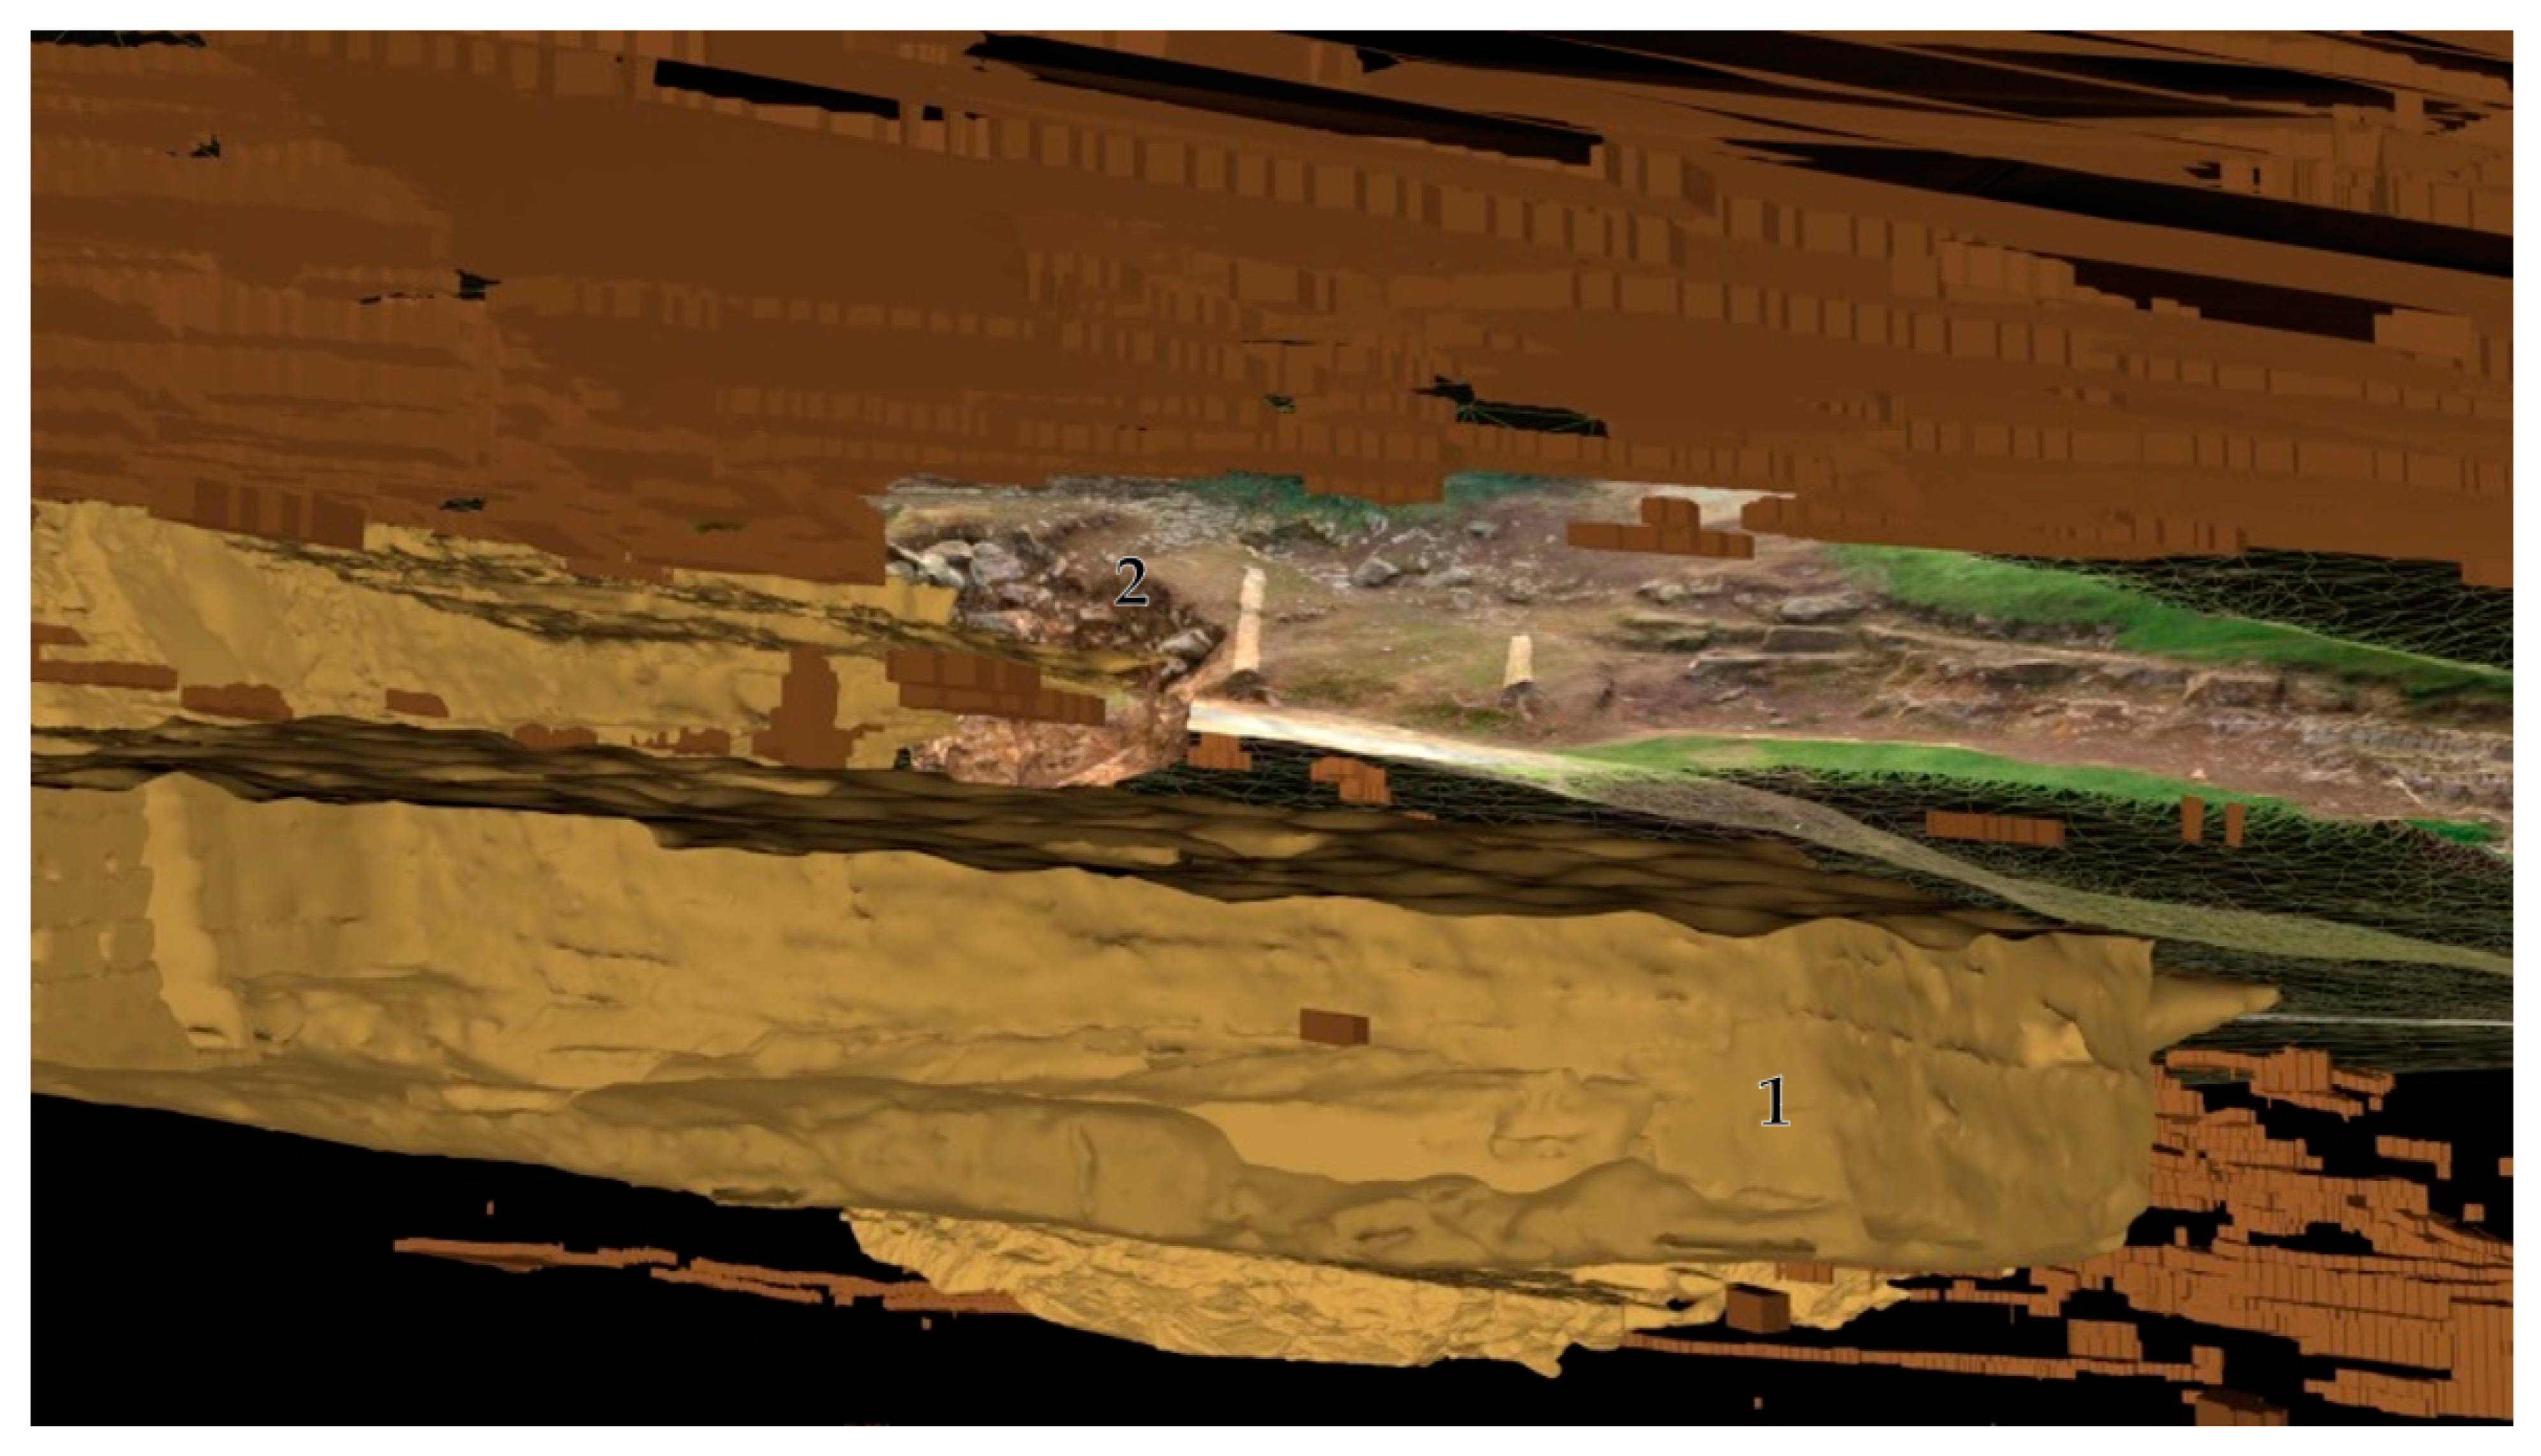
A video (Figure 20) showing the remarkable discontinuities recorded during the geophysical campaign in the karstic formation of the Altamira Cave was also rendered.

4. Discussion

Geologically speaking, Altamira Cave is in a senile state with a clear tendency to disappear through natural evolution, given that the processes of destruction are more important than those of sedimentation [26]. The existence of an important network of fissures, fractures, joints, and displacements present from the top of the cave to the cave ceilings themselves affects cave stability and conditions important changes in the circulation of infiltration water, generating relevant alterations on the painting such as flaking, washing/erosion, and the concretion of carbonates [73,74].
The criteria used for the management and custody of Altamira Cave have led to the application of measures aimed at protecting the cave, its paintings, and its surroundings to guarantee their correct conservation. The research and conservation work in the cave, within the framework of its Preventive Conservation Plan, is aimed at gaining a better understanding of the active deterioration processes to establish a detailed diagnostic procedure that facilitates indirect conservation actions.
Accurate georeferencing is key for integrating remote-sensing techniques in order to derive useful information from the cultural heritage, since it allows us to see the relationships between different parts of the cave with the exterior and how the soil is preserved. The study carried out on the mountain where Altamira Cave itself is located posed a research challenge of great relevance for the cave’s conservation: to determine the exact access routes and the trajectories of the infiltration water which, through the lines of fractures, fissures, and joints, access the different parts of the cave, especially the Polychrome Hall.
Integrating GNSS, 3DTLS, UAV photogrammetry and GPR permits a rapid, accurate, and reliable recording of complex features such as caves or cavities [18]. This information can be used to derive cartography such as floor plans, contour lines, longitudinal and cross sections, and three-dimensional analysis such as the height or thickness of galleries, or analyze and map the system of fractures from the exterior to almost the cave ceiling. Very significant vertical and subvertical fractures were detected, as well as the connections between these fractures and joints, establishing the access routes for infiltration water and relating them to the drip points located on the ceilings of the cave. All this information on moisture that is directly or indirectly associated with the main fractures and fissures mapped has been linked to many of the drip points involved in processes of erosion, flaking, disintegration, and washing away by dissolution of some of the mineral components present in the cave ceilings [75].
This model integration supports the decision-making of cave managers by enabling them to engage with advanced predictive models and simulations within a knowledge-based system.

Author Contributions

Conceptualization, V.B., F.G. and A.P.; methodology, V.B., F.G. and A.P.; software, V.B. and F.G.; validation, C.D.L.H., F.G. and A.P.; formal analysis, V.B., F.G. and A.P.; investigation, V.B., F.G. and A.P.; resources, V.B., C.D.L.H. and P.F.; data curation, V.B., F.G. and L.M.D.-G.; writing—original draft preparation, V.B., F.G. and A.P.; writing—review and editing, V.B., F.G. and A.P.; visualization, V.B., F.G. and A.P.; supervision, V.B., C.D.L.H. and P.F.; project administration, V.B., C.D.L.H. and P.F.; funding acquisition, V.B., E.C. and P.F. All authors have read and agreed to the published version of the manuscript.

Funding

This research was funded by the Department of Innovation, Industry, Tourism and Trade of the Regional Government of Cantabria in the context of aid to encourage industrial research and innovation in companies, project “SImulador Climático del Karst de cuevas de especial valor. (SICLIKA),” grant number 2016/INN/25.

Data Availability Statement

The research data supporting this publication are not publicly available. The data was collected by GIM Geomatics as part of the research and conservation studies of the Cave. These data are kept in the Museo Nacional y Centro de Investigación de Altamira. A video showing the results of this study is available in: https://youtu.be/YGU2mE8-rNg.

Acknowledgments

The authors of this work would like to thank the GIM Geomatics company for its support of the project and, especially, J. Herrera.

Conflicts of Interest

The authors declare no conflict of interest.

References

  1. Cabrelles, M.; Lerma, J.L.; Villaverde, V. Macro Photogrammetry & Surface Features Extraction for Paleolithic Portable Art Documentation. Appl. Sci. 2020, 10, 6908. [Google Scholar] [CrossRef]
  2. Porter, S.T.; Huber, N.; Hoyer, C.; Floss, H. Portable and low-cost solutions to the imaging of Paleolithic art objects: A comparison of photogrammetry and reflectance transformation imaging. J. Archaeol. Sci. Rep. 2016, 10, 859–863. [Google Scholar] [CrossRef]
  3. Díaz-Guardamino, M.; García, L.; Wheatley, D.; Rodríguez, V. RTI and the study of engraved rock art: A re-examination of the Iberian south-western stelae of Setefilla and Almadén de la Plata 2 (Seville, Spain). Digit. Appl.Archaeol. Cult. Herit. 2015, 2, 41–54. [Google Scholar] [CrossRef]
  4. Ontañón, R.; Bayarri, V.; Castillo, E.; Montes, R.; Morlote, J.M.; Muñoz, E.; Palacio, E. New discoveries of pre-Magdalenian cave art in the central area of the Cantabrian region (Spain). J. Archaeol. Sci. Rep. 2019, 28, 102020. [Google Scholar] [CrossRef]
  5. Mendoza, M.A.D.; De La Hoz Franco, E.; Gómez, J.E.G. Technologies for the Preservation of Cultural Heritage—A Systematic Review of the Literature. Sustainability 2023, 15, 1059. [Google Scholar] [CrossRef]
  6. Cecotti, H. Cultural Heritage in Fully Immersive Virtual Reality. Virtual Worlds 2022, 1, 82–102. [Google Scholar] [CrossRef]
  7. Zhang, X.; Yang, D.; Yow, C.H.; Huang, L.; Wu, X.; Huang, X.; Guo, J.; Zhou, S.; Cai, Y. Metaverse for Cultural Heritages. Electronics 2022, 11, 3730. [Google Scholar] [CrossRef]
  8. Boutsi, A.-M.; Ioannidis, C.; Soile, S. Interactive online visualization of complex 3D geometries. Int. Arch. Photogramm. Remote Sens. Spat. Inf. Sci. 2019, XLII-2/W9, 173–180. [Google Scholar] [CrossRef] [Green Version]
  9. Barrera, S.; Otaola, A.; Bayarri-Cayón, V. Explotación Turística no Intrusita de la Cueva de Santimamiñe (Vizcaya) Mediante Realidad Virtual. In II Congreso Español de Cuevas Turísticas; Asociación de Cuevas Turísticas Española: Madrid, Spain, 2009; pp. 359–371. [Google Scholar]
  10. Domingo, I.; Chieli, A. Characterizing the pigments and paints of prehistoric artists. Archaeol. Anthropol. Sci. 2021, 13, 196. [Google Scholar] [CrossRef]
  11. Bayarri, V.; Sebastián, M.A.; Ripoll, S. Hyperspectral Imaging Techniques for the Study, Conservation and Management of Rock Art. Appl. Sci. 2019, 9, 5011. [Google Scholar] [CrossRef] [Green Version]
  12. Bayarri, V.; Castillo, E.; Ripoll, S.; Sebastián, M.A. Improved Application of Hyperspectral Analysis to Rock Art Panels from El Castillo Cave (Spain). Appl. Sci. 2021, 11, 1292. [Google Scholar] [CrossRef]
  13. Rahkonen, S.; Lind, L.; Raita-Hakola, A.-M.; Kiiskinen, S.; Pölönen, I. Reflectance Measurement Method Based on Sensor Fusion of Frame-Based Hyperspectral Imager and Time-of-Flight Depth Camera. Sensors 2022, 22, 8668. [Google Scholar] [CrossRef] [PubMed]
  14. Groom, K.M. 3.25-Field Assessment in Rock Art and Cultural Stone Decay. In Treatise on Geomorphology, 2nd ed.; Academic Press: Cambridge, MA, USA, 2022; pp. 480–511. ISBN 9780128182352. [Google Scholar] [CrossRef]
  15. Bayarri, V.; Latova, J.; Castillo, E.; Lasheras, J.A.; De Las Heras, C.; Prada, A. Nueva documentación y estudio del arte empleando técnicas hiperespectrales en la Cueva de Altamira. ARKEOS | perspectivas em diálogo, nº 37. In XIX Interna-tional Rock Art Conference IFRAO 2015. Symbols in the Landscape: Rock Art and Its Context. Conference Proceedings; Instituto Terra e Memória: Tomar, Portugal, 2015; ISBN 978-84-9852-463-. [Google Scholar]
  16. Ripoll, S.; Bayarri, V.; Muñoz, F.J.; Ortega, R.; Castillo, E.; Latova, J.; Herrera, J.; Moreno-Salinas, D.; Martín, I. Hands Stencils in El Castillo Cave (Puente Viesgo, Cantabria, Spain). An Interdisciplinary Study. In Proceedings of the Prehistoric Society; Cambridge University Press: Cambridge, UK, 2021; pp. 1–21. [Google Scholar]
  17. Lafon-Pham, D.; Konik, S.; Monney, J. On-site spectroradiometric analysis of Palaeolithic cave art: Investigating colour variability in the red rock art of Points cave (France). J. Archaeol. Sci. Rep. 2022, 42, 103384. [Google Scholar] [CrossRef]
  18. Bayarri, V. Algoritmos de Análisis de Imágenes Multiespectrales e Hiperespectrales para la Documentación e Interpretación del Arte Rupestre. Ph.D Thesis, Universidad Nacional de Educación a Distancia, Madrid, Spain, May 2020. Available online: http://e-spacio.uned.es/fez/view/tesisuned:ED-Pg-TecInd-Vbayarri (accessed on 25 January 2021).
  19. Ripoll, S.; Bayarri, V.; Muñoz, F.J.; Latova, J.; Gutiérrez, R.; Pecci, H. El arte rupestre de la cueva de El Castillo (Puente Viesgo, Cantabria): Unas reflexiones metodológicas y una propuesta cronológica. In Capítulo en Libro Cien Años de Arte Rupestre Paleolítico Centenario del Descubrimiento de la Cueva de la Peña de Candamo (1914–2014); Ediciones Universidad de Salamanca: Salamanca, Spain, 2014; ISBN 978-84-9012-480-2. [Google Scholar]
  20. Sciuto, C.; Cantini, F.; Chapoulie, R.; Cou, C.; De la Codre, H.; Gattiglia, G.; Granier, X.; Mounier, A.; Palleschi, V.; Sorrentino, G.; et al. What Lies Beyond Sight? Applications of Ultraportable Hyperspectral Imaging (VIS-NIR) for Archaeological Fieldwork. J. Field Archaeol. 2022, 47, 522–535. [Google Scholar] [CrossRef]
  21. Ontañon, R.; Bayarri, V.; Herrera, J.; Gutierrez, R. The conservation of prehistoric caves in Cantabria, Spain. In The Con-servation of Subterranean Cultural Heritage; CRC Press/Balkema: Boca Raton, FL, USA; Taylor & Francis Group: London, UK, 2014; ISBN1 978-1-138-02694-0 (Hbk). ISBN2 978-1-315-73997-7. [Google Scholar]
  22. Martín-Béjar, S.; Claver, J.; Sebastián, M.A.; Sevilla, L. Graphic Applications of Unmanned Aerial Vehicles (UAVs) in the Study of Industrial Heritage Assets. Appl. Sci. 2020, 10, 8821. [Google Scholar] [CrossRef]
  23. Raimundo, J.; Lopez-Cuervo Medina, S.; Prieto, J.F.; Aguirre de Mata, J. Super Resolution Infrared Thermal Imaging Using Pansharpening Algorithms: Quantitative Assessment and Application to UAV Thermal Imaging. Sensors 2021, 21, 1265. [Google Scholar] [CrossRef]
  24. Cartailhac, É. Les cavernes ornées de dessins: La grotte d’Altamira, Espagne. "Mea culpa" d’un sceptique. L’Anthropologie 1902, 13, 348–354. [Google Scholar]
  25. Cartailhac, É.; Breuil, H. La Caverne d´Altamira á Santillane près Santander (Espagne); Imprimerie de Mónaco: Monaco, Mónaco, 1906. [Google Scholar]
  26. Hoyos, M. Procesos de alteración de soporte y pintura en diferentes cuevas con arte rupestre del norte de España: Santi-mamiñe, Arenaza, Altamira y Llonín. In La Protección y Conservación del Arte Rupestre Paleolítico; Mesa redonda hispano-francesa [Colombres-Asturias: 3 a 6 de junio de 1991]; Consejería de Educación, Cultura, Deportes y Juventud del Principado de Asturias: Asturias, Spain, 1992; pp. 51–74. [Google Scholar]
  27. Lasheras, J.A.; De La Heras, C.; Prada, A.; Dohijo, E. Altamira y su futuro. In The Conservation of Subterranean Cultural Her-itage; CRC Press/Balkema: Boca Raton, FL, USA; Taylor & Francis Group: London, UK, 2014; ISBN1 978-1-138-02694-0 (Hbk). ISBN2 ISBN 978-1-315-73997-7. [Google Scholar]
  28. Sánchez-Moral, S. Estudio integral del estado de conservación de la Cueva de Altamira y su arte paleolítico (2007–2009). Perspectivas futuras de conservación. In Monografías del Museo Nacional y Centro de Investigación de Altamira, no. 24; Ministerio de Educación, Cultura y Deporte: Madrid, Spain, 2014. [Google Scholar]
  29. Bayarri-Cayón, V.; Castillo, E. Caracterización geométrica de elementos complejos mediante la integración de diferentes técnicas geomáticas. Resultados obtenidos en diferentes cuevas de la Cornisa Cantábrica. In Proceedings of the VIII Semana Geomática Internacional, Barcelona, Spain, 3–5 March 2009. [Google Scholar]
  30. Strang, G.; Kai, B. Linear Algebra, Geodesy and GPS; Wellesley Cambridge Press: Wellesley, MA, USA, 1997. [Google Scholar]
  31. TOPCON. Topcon Hyper II GNSS Receiver Specifications. Available online: https://topconcare.com/en/hardware/gnss-receivers/hiper-ii/specifications/ (accessed on 7 February 2023).
  32. TOPCON. Topcon Tools 8. Technical Datasheet. Available online: https://topconcare.com/en/software/office-applications/topcon-tools-8/ (accessed on 7 February 2023).
  33. Leick, A.; Rapoport, L.; Tatarnikov, D. GPS Satellite Surveying, 4th ed.; John Wiley & Sons: New York, NY, USA, 2015. [Google Scholar]
  34. Teunissen, P.; Khodabandeh, A. Review and principles of PPP-RTK methods. J. Geod. 2015, 89, 217–240. [Google Scholar] [CrossRef]
  35. TOPCON. Topcon GPT. Available online: https://topconcare.com/en/hardware/optical/gpt-series-total-stations/ (accessed on 7 February 2023).
  36. FARO. FARO Laser Scanner Focus 3D X 130 Technical Datasheet. Available online: https://downloads.faro.com/index.php/s/XYSMR89BwyD5fqg?dir=undefined&openfile=41913 (accessed on 8 February 2023).
  37. Bayarri, V.; Castillo, E.; Ripoll, S.; Sebastián, M.A. Control of Laser Scanner Trilateration Networks for Accurate Georef-erencing of Caves: Application to El Castillo Cave (Spain). Sustainability 2021, 13, 13526. [Google Scholar] [CrossRef]
  38. Mancini, F.; Dubbini, M.; Gattelli, M.; Stecchi, F.; Fabbri, S.; Gabbianelli, G. Using Unmanned Aerial Vehicles (UAV) for High-Resolution Reconstruction of Topography: The Structure from Motion Approach on Coastal Environments. Remote Sens. 2013, 5, 6880–6898. [Google Scholar] [CrossRef] [Green Version]
  39. Kyriou, A.; Nikolakopoulos, K.G.; Koukouvelas, I.K. Timely and Low-Cost Remote Sensing Practices for the Assessment of Landslide Activity in the Service of Hazard Management. Remote Sens. 2022, 14, 4745. [Google Scholar] [CrossRef]
  40. Kovanič, Ľ.; Blistan, P.; Štroner, M.; Urban, R.; Blistanova, M. Suitability of Aerial Photogrammetry for Dump Documentation and Volume Determination in Large Areas. Appl. Sci. 2021, 11, 6564. [Google Scholar] [CrossRef]
  41. TOPCON. TOPCON Intel Falcon 8+ Drone. Technical Datasheet. Available online: https://www.topconpositioning.com/sites/default/files/product_files/falcon_8_plus_datasheet_7010_2243_reva_sm_4.pdf (accessed on 9 December 2022).
  42. SONY. Sony A7 R Mark ii. Available online: https://www.sony.com/electronics/support/res/manuals/W000/W0005150M.pdf (accessed on 9 December 2022).
  43. Neal, A. Ground-penetrating radar and its use in sedimentology: Principles, problems and progress. Earth Sci. Rev. 2004, 66, 261–330. [Google Scholar] [CrossRef]
  44. Theune, U.; Rokosh, D.; Sacchi, M.; Schmitt, D. Mapping fractures with GPR: A case study from Turtle Mountain. Geophysics 2006, 71, B139–B150. [Google Scholar] [CrossRef] [Green Version]
  45. Rashed, M.; Kawamura, D.; Nemoto, H.; Miyata, T.; Nakagawa, K. Ground penetrating radar investigations across the Uemachi fault, Osaka, Japan. J. Appl. Geophys. 2003, 53, 63–75. [Google Scholar] [CrossRef]
  46. Davis, J.; Annan, A. Ground-penetrating radar for high-resolution mapping of soil and rock stratigraphy. Geophys. Prospect. 1989, 37, 531–551. [Google Scholar] [CrossRef]
  47. Ferrero, A.; Godio, A.; Sambuelli, L. Geophysical and Geomechanical Investigations Applied to the Rock Mass Charac-terisation for Distinct Element Modelling. Rock Mech. Rock Eng. 2007, 40, 603–622. [Google Scholar] [CrossRef]
  48. Uriarte, J.A.; Damas Molla, L.; Sagarna, M.; Aranburu, A.; García, F.; Antiguedad, I.; Morales, T. Characterization of complex groundwater flows in the environment of singular buildings by combining hydrogeological and non-destructive geophysical (ground-penetrating radar) techniques: Punta Begona Galleries (Getxo, Spain). Hydrol. Process. 2020, 34, 1004–1015. [Google Scholar] [CrossRef]
  49. Lunt, I.A.; Hubbard, S.S.; Rubin, Y. Soil moisture content estimation using ground-penetrating radar reflection data. J. Hydrol. 2005, 307, 254–269. [Google Scholar] [CrossRef]
  50. Longoni, L.; Arosio, D.; Scaioni, M.; Papini, M.; Zanzi, L.; Roncella, R.; Brambilla, D. Surface and subsurface non-invasive investigations to improve the characterization of a fractured rock mass. J. Geophys. Eng. 2012, 9, 461–472. [Google Scholar] [CrossRef]
  51. Grodner, M. Delination of rockburst fractures with ground penetrating radar in the Witwatersrand Basin, South Africa. Int. J. Rock Mech. 2001, 38, 885–891. [Google Scholar] [CrossRef] [Green Version]
  52. Pipan, M.; Baradello, L.; Forte, E.; Prizzon, A. GPR study of bedding planes, fractures and cavities in limestone. In Proceedings of the 8th International Conference on Ground Penetrating Radar, Gold Coast, Australia, 23–26 May 2000. [Google Scholar] [CrossRef]
  53. Neal, A.; Grasmueck, M.; McNeill, D.F.; Viggiano, D.A.; Eberli, G.P. Full-Resolution 3D Radar Stratigraphy of Complex Oolitic Sedimentary Architecture: Miami Limestone, Florida, U.S.A. J. Sediment. Res. 2008, 78, 638–653. [Google Scholar] [CrossRef]
  54. Jeannin, M.; Garambois, S.; Grégoire, C.; Jongmans, D. Multiconfiguration GPR measurements for geometric fracture characterization in limestone cliffs (Alps). Geophysics 2006, 71, B85–B92. [Google Scholar] [CrossRef] [Green Version]
  55. Chalikakis, K.; Plagnes, V.; Guerin, R.; Valois, R.; Bosch, F.P. Contribution of geophysical methods to karst-system ex-ploration: An overview. Hydrogeol. J. 2011, 19, 1169–1180. [Google Scholar] [CrossRef]
  56. Grasmueck, M.; Quintà, M.C.; Pomar, K.; Eberli, G.P. Diffraction imaging of subvertical fractures and karst with full-resolution 3D Ground-Penetrating Radar. Geophys. Prospect. 2013, 61, 907–918. [Google Scholar] [CrossRef]
  57. Fernandes, A.L.; Medeiros, W.E.; Bezerra, F.H.R.; Oliveira, J.G.; Cazarin, C.L. GPR investigation of karst guided by com-parison with outcrop and unmanned aerial vehicle imagery. J. Appl. Geophys. 2015, 112, 268–278. [Google Scholar] [CrossRef]
  58. Pueyo-Anchuela, O.; Casas-Sainz, A.M.; Soriano, M.A.; Pocoví-Juan, A. A geophysical survey routine for the detection of doline areas in the surroundings of Zaragoza (NE Spain). Eng. Geol. 2010, 114, 382–396. [Google Scholar] [CrossRef]
  59. Medeiros, W.E.; Oliveira, J.G.; de Santana, F.; Bezerra, F.; Cazarin, C. Enhancing Stratigraphic and Structural Features in GPR Images of Limestone Karst through Adequate Data Processing. In Proceedings of the 24th European Meeting of Environmental and Engineering Geophysic, Porto, Portugal, 9–12 September 2018. [Google Scholar] [CrossRef]
  60. Bermejo, L.; Ortega, A.I.; Parés, J.M.; Campaña, I.; Bermúdez de Castro, J.M.; Carbonell, E.; Conyers, L.B. Karst features interpretation using ground-penetrating radar: A case study from the Sierra de Atapuerca, Spain. Geomorphology 2020, 367, 107311. [Google Scholar] [CrossRef]
  61. Conyers, L.B. Ground-Penetrating Radar for Archaeology, 3rd ed.; Rowman and Littlefield Publishers: Lanham, MD, USA; Alta Mira Press: Lanham, MD, USA, 2013; p. 241. [Google Scholar]
  62. Daniels, D.J. Ground Penetrating Radar, 2nd ed.; IEE Radar, Sonar and Navigation Series 15 ed. The Institution of Elec-trical Engineers: London, UK, 2004; p. 752. [Google Scholar] [CrossRef] [Green Version]
  63. Jol, H.M. Ground penetrating radar antennae frequencies and transmitter powers compared for penetration depth, resolution and reflection continuity. Geophys. Prospect. 1995, 43, 693–709. [Google Scholar] [CrossRef]
  64. Anchuela, O.; Casas-Sainz, A.; Pocoví, A.; Gil-Garbi, H.; Calvín, P. Characterization of the Karstic Process in an Urban Environment Using GPR Surveys. J. Mater. Civ. Eng. 2014, 26. [Google Scholar] [CrossRef]
  65. Foyo, A.; Tomillo, C.; Sánchez, M.A.; Suarez, J.L. Esquema Geológico del Entorno de la Cueva de Altamira; LAS-HERAS, J.A., Ed.; Redescubrir Altamira, Turner: Madrid, Spain, 2002; pp. 273–286. [Google Scholar]
  66. Hoyos, M.; Bustillo, A.; García, A.; Martin, C.; Ortiz, R.; Suazo, C. Características Geológico-Kársticas de la Cueva de Al-Tamira (Santillana del Mar, Santander); Informe Ministerio de Cultura: Madrid, Spain, 1981; p. 81.
  67. Pérez-Garcia, V.; García, F.; Rodríguez Abad, I. GPR evaluation of the damage found in the reinforced concrete base of a block of flats: A case study. NDT E Int. 2008, 41, 341–353. [Google Scholar] [CrossRef]
  68. Estudio integral del estado de conservación de la Cueva de Altamira y sus representaciones artísticas paleolíticas. In Perspectivas Futuras de Conservación Consejo Superior de Investigaciones Científicas; Ministerio de Ciencia e Innovación: Madrid, Spain, 2009; p. 397.
  69. Benedetto, A.; Tosti, F.; Bianchini Ciampoli, L.; D’Amico, F. An overview of ground-penetrating radar signal processing techniques for road inspections. Signal Process. 2017, 132, 201–209. [Google Scholar] [CrossRef]
  70. Bayarri-Cayón, V.; Latova, J.; Castillo, E.; Lasheras, J.A.; De Las Heras, C.; Prada, A. Nueva ortoimagen verdadera del Techo de Polícromos de la Cueva de Altamira, in: ARKEOS | perspectivas em diálogo, nº 37. In XIX International Rock Art Conference IFRAO 2015. Symbols in the Landscape: Rock Art and Its Context. Conference Proceedings; Instituto Terra e Memória: Tomar, Portugal, 2015; pp. 2308–2320. ISBN 978-84-9852-463-5. [Google Scholar]
  71. Elez, J.; Cuezva, S.; Fernandez-Cortes, A.; Garcia-Anton, E.; Benavente, D.; Cañaveras, J.C.; Sanchez-Moral, S. A GIS-based methodology to quantitatively define an Adjacent Protected Area in a shallow karst cavity: The case of Altamira cave. J. Environ. Manag. 2013, 118, 122–134. [Google Scholar] [CrossRef] [PubMed]
  72. Blender Online Community. Blender—A 3D Modelling and Rendering Package; Blender Foundation, Stichting Blender Foundation: Amsterdam, The Netherlands, 2018. [Google Scholar]
  73. Cendrero, A. Influencia de la composición de la roca soporte en el deterioro de las pinturas de Altamira. In Volumen Con-memorativo Centenario Altamira; Dirección General del Patrimonio: Madrid, Spain, 1981; pp. 579–580. [Google Scholar]
  74. Sánchez-Moral, S.; Cañaveras, J.C.; Soler, V.; Saiz, C.; Bedoya, J.; Lario, J. La Conservación del Monumento. In Redescubrir Altamira; Turner Ediciones: Madrid, Spain, 2002; pp. 245–257. [Google Scholar]
  75. Valle, F.J.; Moya, J.S.; Cendrero, A. Estudio de la roca soporte de las pinturas rupestres de la cueva de Altamira. Zephyrus 1978, 28–29, 5–15. [Google Scholar]
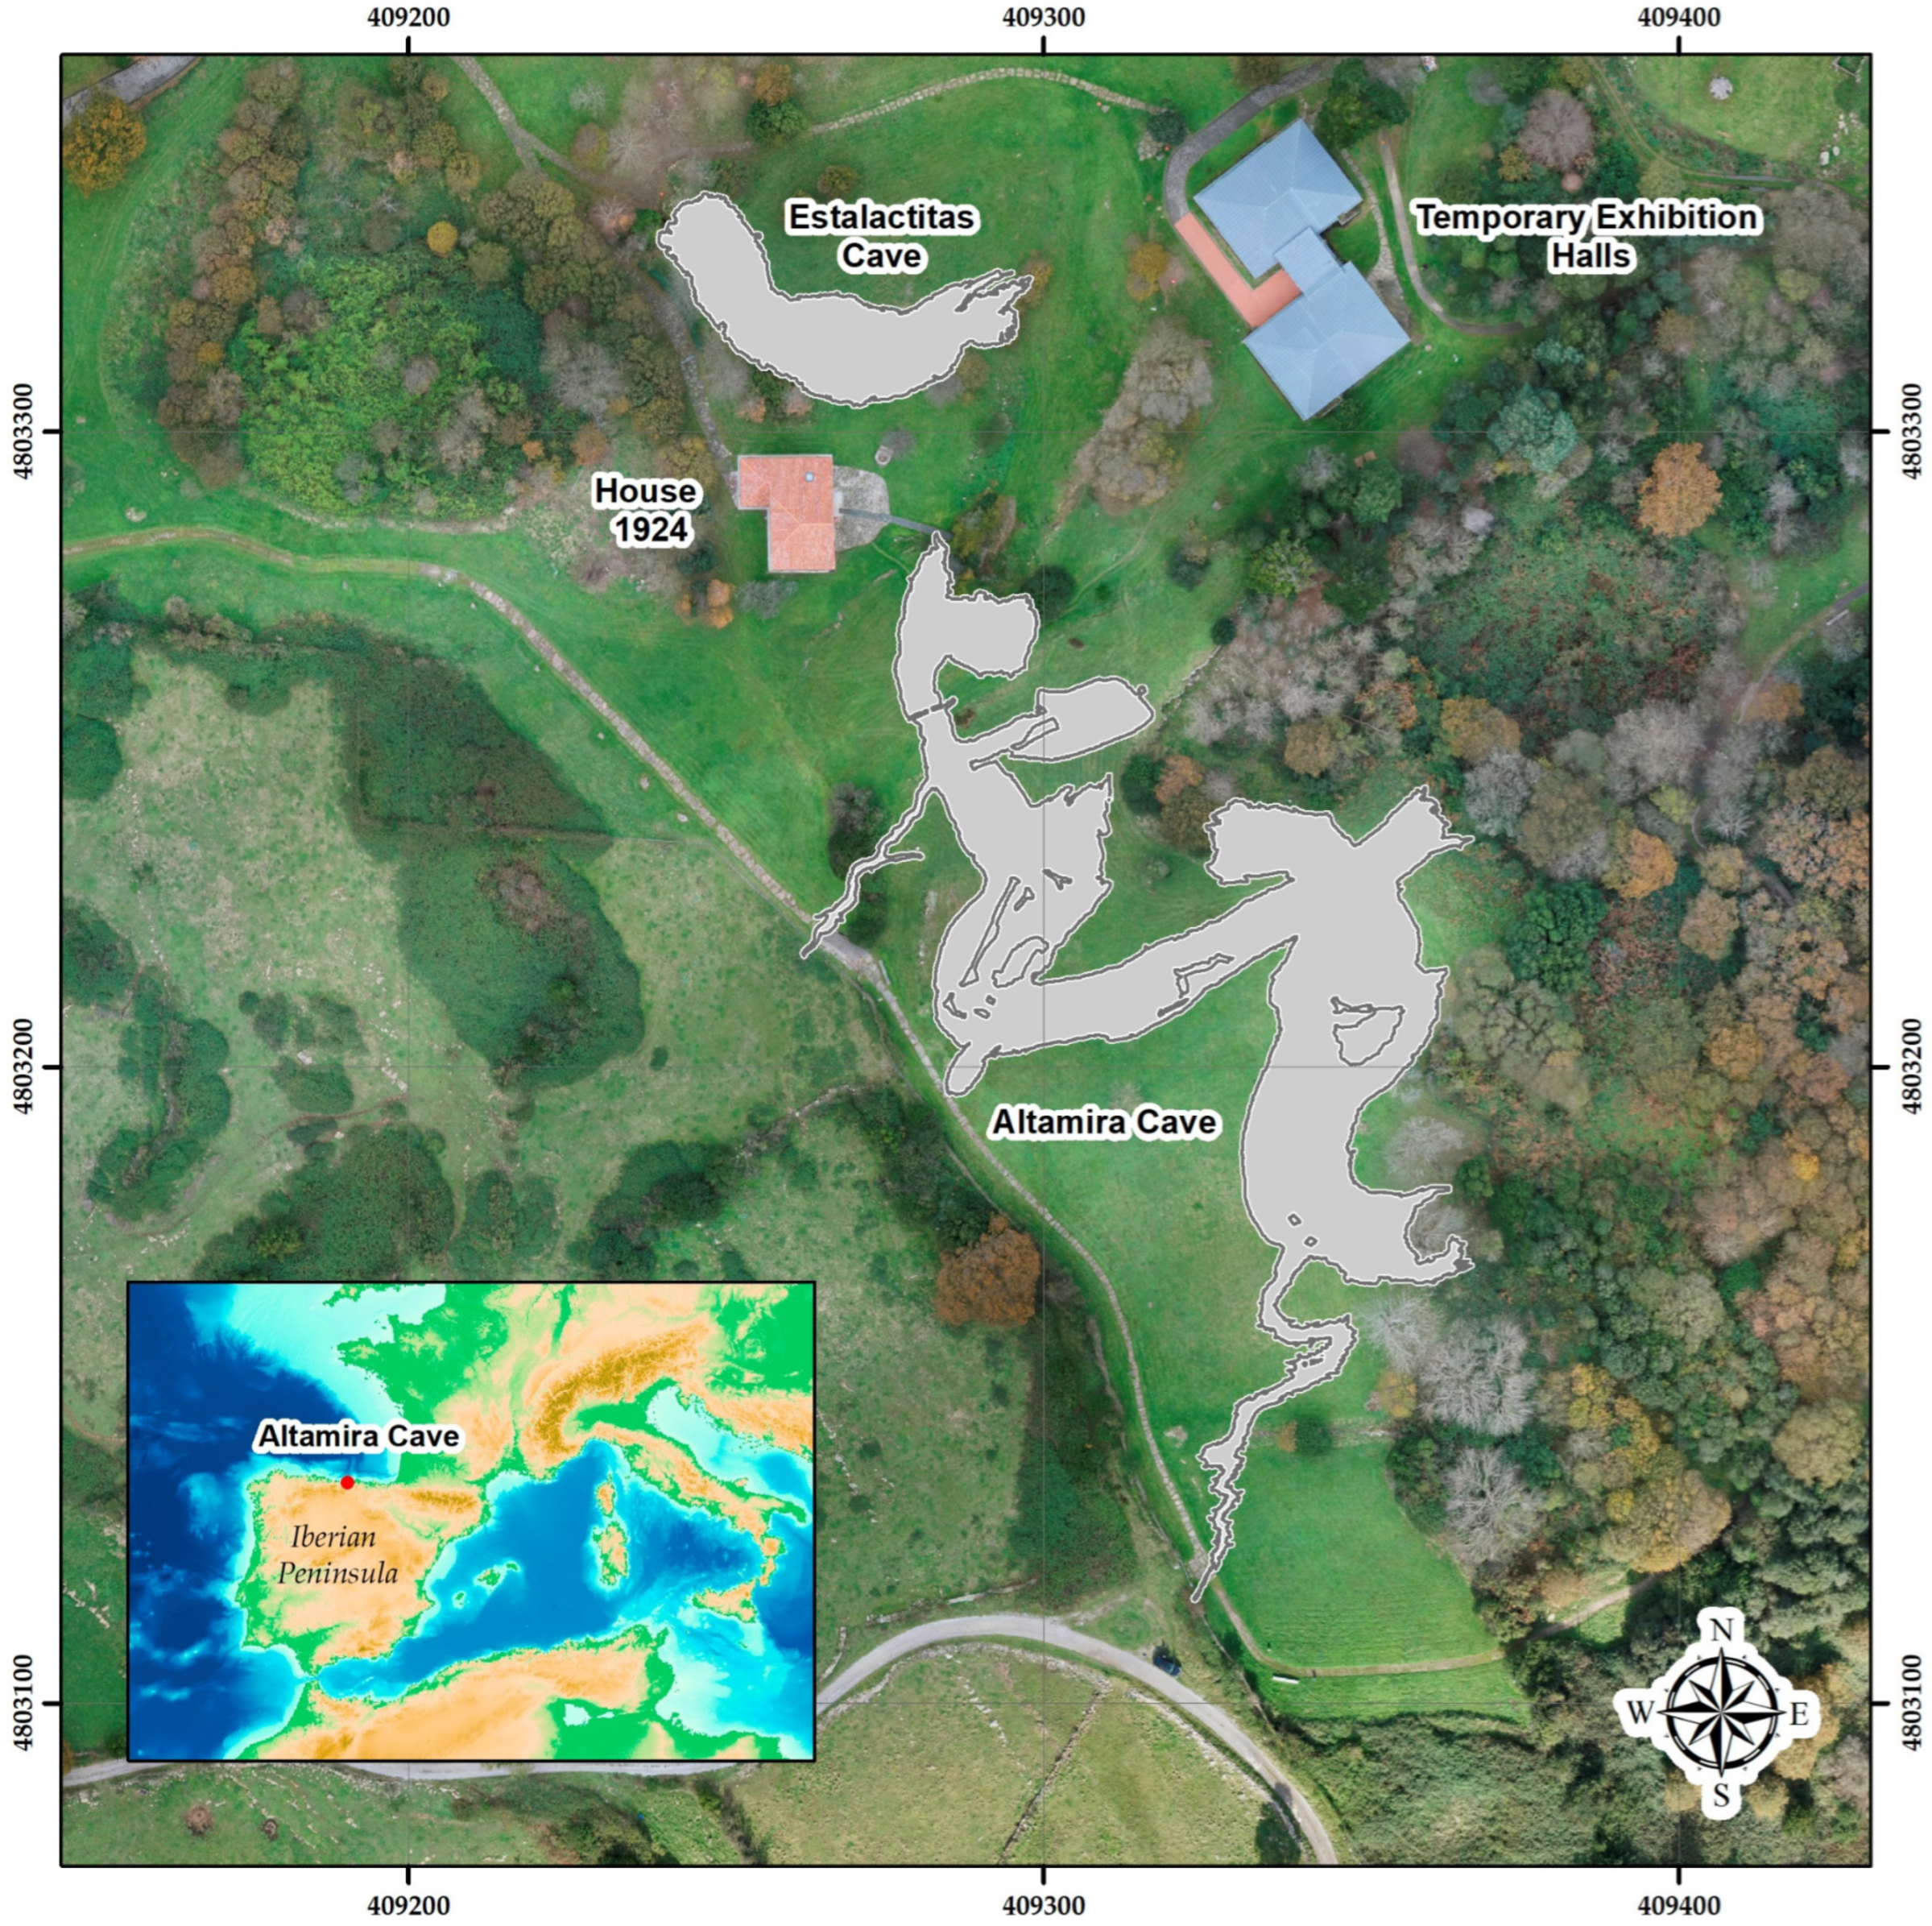
Figure 1. Location map and the surroundings of Altamira Cave. The cave is located in Santillana del Mar, Cantabria, Spain.
Remotesensing 15 01087 g001
Figure 2. (a) Map of the interior of the Cave including gallery names, artificial walls, pillars, and stairs. (b) Map of the traverse and reference checkerboards, including the traverse station from which they radiate.
Remotesensing 15 01087 g002
Figure 3. General workflow scheme followed in this study.
Remotesensing 15 01087 g003
Figure 4. View of the 3D model derived from UAV photogrammetric flight of the surroundings of Altamira Cave.
Remotesensing 15 01087 g004
Figure 5. The location of GPR profile grid (orthogonal 2D profiles spaced every 3 m) in the Altamira Cave site, carried out with the 100 MHz antenna.
Remotesensing 15 01087 g005
Figure 6. Radargram recorded with the 100 MHz antenna. Profile Z2-85 above shows discontinuities in the rock mass: several sinkholes (indicated by white ovals) and vertical fractures. This radargram also shows the attenuation of the electromagnetic wave in the last meters of depth.
Remotesensing 15 01087 g006
Figure 7. The location of GPR profile grids (orthogonal 2D profiles spaced every 1 m) in the overlying rock strata and the lapiés zone of the Polychrome Hall ceiling, carried out with the (a) 400 MHz and (b) 900 MHz antennas.
Remotesensing 15 01087 g007
Figure 8. (a) Location and (b) radargram (profile T-97) recorded with the 400 MHz antenna, in which two levels of discontinuities in the rock mass were detected. The first and more superficial level corresponds to the lapiés (delimited with a black dashed line), and the second corresponds to a zone of fractures, joints, and detachments (delimited with a yellow dashed line). Vertical discontinuities corresponding to vertical fractures were also detected. (c) Radargram (profile T-97) recorded with the 900 MHz antenna, in which discontinuities with better resolution were detected at the lapiés level (delimited with a black dashed line). Vertical discontinuities corresponding to vertical fractures and rock pinnacles separated by grooves were also detected.
Remotesensing 15 01087 g008aRemotesensing 15 01087 g008b
Figure 9. Flowchart of the main processing steps applied to raw reflection data collected by GPR in this study.
Remotesensing 15 01087 g009
Figure 10. Visualization of the 3D model of the cave below a low-detail mesh obtained from UAV model.
Remotesensing 15 01087 g010
Figure 11. Overlying layer thickness model of Altamira Cave.
Remotesensing 15 01087 g011
Figure 12. Zonal distribution map of subvertical reflectors and vertical diffractions (fractures) from GPR profiles in the rock massif of Altamira Cave: (a) the surrounding sinkholes, cave entrance, areas of Hoya Hall and Pozo Hall; (b) the Polychrome Hall; (c) the Cave of the Stalactites; (d) the Hoya Hall; (e) the artificial walls; (f) an area to the NW where a house and a cowshed with its dunghill were located; (g) the end zone of the westernmost branch line. Sinkhole areas pinpointed by GPR in the rock massif of Altamira Cave are indicated by yellow ovals.
Remotesensing 15 01087 g012
Figure 13. 3D amplitude isosurface model of the main discontinuities in the overlying layer of the Polychrome Hall with the 400 MHz antenna, showing the two levels of discontinuities (lapiés zone—fractures, joints, and detachment zone) and the vertical fractures.
Remotesensing 15 01087 g013
Figure 14. Amplitude slice, 2.20 m depth with the 400 MHz antenna, showing the fracture, joint, and detachment zone (marked in white) on the vertical projection of the Polychrome Hall. This zone of discontinuities is located only to the north and east of the Polychrome Hall projection.
Remotesensing 15 01087 g014
Figure 15. Amplitude slice, 3.50 m depth with the 400 MHz antenna, showing with white arrows the locations of the projections of the vertical/subvertical fractures that correspond to the 3 zones of temporary water inflow observed in the interior of the Polychrome Hall. Two of them are on the north wall and one is on the south wall.
Remotesensing 15 01087 g015
Figure 16. Projection of the Polychrome Hall on the topographic map, showing a change of orientation and slope (indicated with black arrow) that tilts to the NE (a), and which also corresponds to the projection of the second level of discontinuities in its amplitude depth slice (2.20 m depth) (b).
Remotesensing 15 01087 g016
Figure 17. Amplitude slice, 0.45 m depth with the 900 MHz antenna, showing the mapped lapiés groove system in the overlying layer of the Polychrome Hall. It can be seen that the lineaments of this system of lapiés grooves, derived from the 3D mapping, agree with the orientations of the main lineaments of the joints (N45, N68, and N168) [67].
Remotesensing 15 01087 g017
Figure 18. Image of integrating the UAV model, 3DTLS and GPR (100 MHz antenna), showing the discontinuities in the Polychrome overlying layer (in light brown) and the backside of the Polychrome Hall (in dark brown).
Remotesensing 15 01087 g018
Figure 19. (a) Section of the integrated model in the Entrance Hall (1) and Polychrome Hall (2) area showing terrain, GPR (brown), and 3DTLS (grey) models. (b) Section with 6 m far plane of the integrated model in the Entrance Hall (1) and Polychrome Hall (2) area showing terrain, GPR (brown), and 3DTLS (grey) models.
Remotesensing 15 01087 g019
Figure 20. Video capture of integrating the UAV model, 3DTLS, and GPR (100 MHz antenna), showing discontinuities in the Polychrome Hall (1) and the exterior excavation (2).
Remotesensing 15 01087 g020
Disclaimer/Publisher’s Note: The statements, opinions and data contained in all publications are solely those of the individual author(s) and contributor(s) and not of MDPI and/or the editor(s). MDPI and/or the editor(s) disclaim responsibility for any injury to people or property resulting from any ideas, methods, instructions or products referred to in the content.