Abstract
Accurate and continuous rainfall monitoring is essential for effective water resources management, especially in arid and semi-arid regions such as the United Arab Emirates (UAE). Significant spatio-temporal precipitation variation in the UAE necessitates the use of the latest techniques to measure rainfall intensity accurately. This study investigates the consistency and applicability of four satellite precipitation products, namely PERSIANN, PERSIANN-CCS, PERSIANN-CDR, and PDIR-Now, over the UAE. Daily time series data from 2011 to 2020 were analyzed using various statistical measures and climate indices to develop the belief in the products and for their inter-comparison. The analysis revealed that the average probability of detection (POD) for PDIR and CDR was the highest, with values ranging from 0.7–0.9 and 0.6–0.9, respectively. Similarly, CDR has a better Heidke Skill Score (HSS) with an average value of 0.26. CDR outperformed its counterparts with an average correlation coefficient value of 0.70 vs. 0.65, 0.40, and 0.34 for PDIR, CCS, and PERSIANN, respectively. Precipitation indices analysis revealed that all the products overestimated the number of consecutive wet days by 15–20%, while underestimating consecutive dry days by 5–10%. The quantitative estimations indicate that all the products were matching with the gauge values during the wet months (January–April), while they showed significant overestimation during the dry months. CDR and PDIR were in close agreement with the gauge data in terms of maximum daily rainfall with an error of less than 10% for both products. As compared to others, PERSIANN-CDR provided better estimates, particularly in terms of capturing extreme rainfall events and spatial distribution of rainfall. This study provides the first comprehensive evaluation of four PERSIANN family products based on recent daily rainfall data of UAE. The findings can provide future insights into the applicability and improvement of PERSIANN products in arid and semi-arid regions.
1. Introduction
Precipitation, which connects the planet’s water and energy cycles, represents a vital element of the hydrological cycle [1,2]. The accuracy and dependability of hydrological applications, such as flood risk assessment, water resource management, drought surveillance, and the impact of climate change are influenced by the quality and accessibility of precipitation predictions [3,4]. Moreover, the spatial distribution, duration, and concentration of the precipitation have a substantial impact on hydrological cycles and energy distributions [5,6]. The most popular methods for estimating precipitation are rain gauges, weather radars, and remote sensing technologies, such as satellite sensors and precipitation products [7,8,9,10]. Rain gauges are considered the true validation data, as they provide direct rainfall readings. However, they are also associated with various uncertainties associated with the underestimation of heavy precipitation due to splashing, observer errors, sensor errors, wind, and evaporation. Furthermore, because gauge data represent point values rather than aerial observations, they cannot adequately describe the spatial changes in precipitation. Contrary to rain gauges, ground-based weather radars monitor a large region in real-time while estimating precipitation at high spatiotemporal resolutions [11,12,13,14,15]. Radar measurements, however, might be impacted by the topography of the area. In addition, radar networks are not widely available due to the relatively high cost and lack of technological expertise. As an alternative to weather radars, satellite-based rainfall products provide the best spatiotemporal coverage of global rainfall [16,17,18,19]. However, the acquisition of rainfall from the precipitation products is usually accomplished after careful quality checks and evaluation of those products [20,21,22,23]. Because of the immense potential of satellite precipitation products, many researchers have conducted in-depth investigations to assess and validate them [1,2,3,20,22,24,25,26,27,28,29,30]. Moreover, many studies have shown the usefulness of these gridded precipitation products as a forcing input for hydrological models [31,32,33]. However, limited research was conducted to assess their efficacy and applicability in dry regions and areas with rough topography [34,35,36].
The United Arab Emirates (UAE) is situated in an arid region with limited rainfall and high temperatures. The renewable freshwater resources of UAE, primarily encountered as groundwater, are extremely scarce, while the water demand is increasing as a result of the demographic and industrial revolutions. Excessive withdrawal for urban and agricultural usage exacerbates the water deficit. With an average annual of around 110 mm, the rainfall in the UAE is scarce, random, and geographically uneven [37]. The use of the most up-to-date and trustworthy data is a prerequisite to updating and improving water resource management in the UAE. Utilizing high-resolution data in both the geographical and temporal domains to analyze the short- and long-term trends of precipitation can yield essential information for controlling and regulating urban and agricultural water consumption. Moreover, due to the infrequent rainfall and the sparse distribution of rain gauges, arid and semi-arid regions often receive less hydrometeorological research than other parts of the world.
Using information from rain gauges, several researchers investigated the rainfall patterns in the UAE [38,39,40,41,42]. With the advent of remote-sensing precipitation products, many studies have tried to assess their applicability in the UAE. More recently, [24] evaluated CMORPH and GPM IMERG precipitation products over the UAE and found their potential for filling the gaps in rainfall observations. Mahmoud et al. (2018) utilized early, late, and final runs of GPM-IMERG over the UAE and Saudi Arabia and found that the final-run product was better in providing a comprehensive understanding of the spatial variability of rainfall. Hussein et al. (2021) analyzed the spatio-temporal statistical trends in the UAE by utilizing CMORPH, IMERG, and PERSIANN products. They concluded that these satellite products were equally good for performing rainfall frequency analysis.
Many organizations and institutes are offering satellite-based datasets that were generated using various techniques: the NASA TRMM Multi-Satellite Precipitation Analysis (TMPA) [43], the NOAA Climate Prediction Center (CPC) morphing technique CMORPH [44], the NASA Integrated Multi-satellitE Retrievals for GPM (IMERG) [25], and the Precipitation Estimation from Remotely Sensed Information using Artificial Neural Network [45]. The Center for Hydrometeorology and Remote Sensing (CHRS), University of California, Irvine, in collaboration with NASA, NOAA, and the UNESCO program for the Global Network on Water and Development Information for Arid Lands developed the PERSIANN suite of precipitation products over the last two decades. Four satellite-based products for estimating precipitation are part of the PERSIANN family: PERSIANN, PERSIANN-CCS, and PERSIANN-CDR, and PDIR-Now. These products are available through a variety of web-based interfaces. Hydrologists, professionals in the area of water resources, and climate researchers regularly employ PERSIANN products for a variety of investigations. These investigations compare PERSIANN products with other satellite-based products, model simulations, and ground observations [3,26,44,45,46,47,48,49,50].
Although some researchers have put effort into exploring the potentialities of satellite precipitation products over arid regions and especially the UAE, the main focus of those studies was limited to the statistical evaluation and consistency analysis of those products. While the UAE usually experiences intense rainfall with a shorter duration that generally triggers flash floods causing severe damage in the urban areas, it becomes vital to understand the precipitation extremes over the area. Apart from checking the statistical correlation between the products and rain gauges and analyzing the storm detection capabilities of the selected products, this study attempts to recognize the rainfall extremes while calculating multiple extreme climate indices. Additionally, considering the importance of maximum rainfall intensity occurrence over the study area, IDF analysis was performed with limited data to explicitly show the relative error between the rain gauge and satellite products.
This study evaluates the performance of PERSIANN, PERSIANN-CCS, PERSIANN-CDR, and PDIR-Now considering the daily rainfall data of UAE. To the best of the authors’ knowledge, PERSIANN, PERSIANN-CCS, and PDIR-Now have not been used to capture rainfall events and their spatial distribution over the UAE. Therefore, the unique aspect of this study is to provide a comprehensive understanding of the similarities, intercomparison, and variations between these products and to finally segregate them based on behavioral and non-behavioral products.
2. Material and Methods
2.1. Study Area
The UAE is located in a semi-arid to arid region and occupies the southeastern part of the Arabian Peninsula (51–57°E, 22–26°N). The country is composed of seven emirates: namely, Abu Dhabi (AD), Dubai, Sharjah, Ajman, Um Al Quwain (UAQ), Ras Al Khaimah (RAK), and Fujairah. Abu Dhabi is the largest emirate and makes up around 87% of the total area of the UAE. Ajman is the smallest emirate covering only around 0.3% of the total area. UAE shares borders with Saudi Arabia and Oman, which are located to the southwest and northeast of the UAE, respectively. Figure 1 represents the location of the study area (UAE) along with the elevation map and gauge locations. The gauges are spread across the whole country.
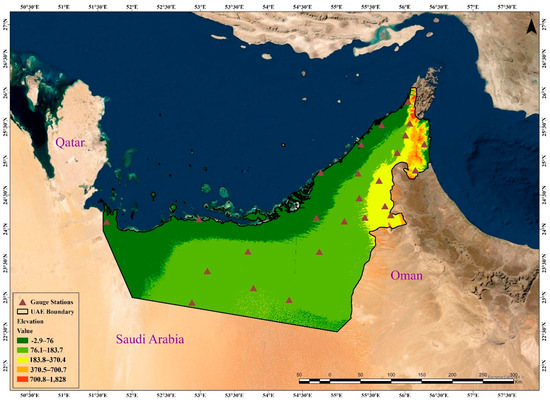
Figure 1.
The geographical location of the United Arab Emirates with elevation map and the gauge locations used in this study.
The country has mild winters and hot summers, with a maximum average monthly temperature of 40.3 °C. During the summer, humid southeasterly winds prevail, resulting in humidity levels as high as 95% [37]. The country’s western regions are mostly flat, whereas the northeast has a mountainous terrain with a maximum elevation of 1800 m above mean sea level (amsl). The higher altitudes in the north of the country have somewhat cooler winters with temperatures that are close to freezing. The country’s land cover is homogeneous, primarily classed as bare land in the west and paved surfaces (in the urban areas), especially in the emirates of Dubai and Abu Dhabi. The water year in the country runs from October to September, with the rainy season lasting from late November to early April.
2.2. Datasets
2.2.1. Rain Gauge Data
Daily rainfall values for 25 rain gauge stations (Figure 1) were acquired from 2011 to 2020, from the National Center of Meteorology (NCM) of UAE. The respective locations of the NCM rain gauges (Figure 1) were obtained from the NCM website http://www.ncm.ae (accessed on 18 September 2022). Almost 95% of the gauge stations used in this study are not among the stations utilized by Global Precipitation Climatology Center (GPCC) for the adjustment of PERSIANN-CDR. Therefore, all the products were assessed independently in this study. The NCM utilizes automatic gauge stations that electronically provide rainfall observations to the central database, and the verification of the data accuracy is also performed by NCM. The selected rain gauges are all inland stations and are adequately dispersed across the country. Since Abu Dhabi is the largest emirate in the UAE, it hosts the maximum number of gauge stations with almost 70% of the stations in Abu Dhabi emirate.
2.2.2. Precipitation Estimation from Remotely Sensed Information Using Artificial Neural Networks (PERSIANN)
The combination of the high-frequency GEO satellite samples and the sporadically sampled data from LEO satellites form the foundation of the PERSIANN algorithm was created in 1997 [47]. Longwave infrared retrievals were initially the main input to the PERSIANN algorithm for GEO imaging. It was later extended to accommodate daylight-visible imagery as well [26]. The model’s parameters are continually adjusted using passive microwave images from LEO satellites. Rainfall estimates are computed using neural network classifiers at 0.25° × 0.25°. When independent rainfall estimates are available, updating the network parameters is made easier by an adaptive training function. The PERSIANN data are publicly available at the CHRS data portal at http://chrsdata.eng.uci.edu, and daily rainfall data were acquired in netcdf format (accessed on 3 July 2022). Table 1 lists the details of the PERSIANN products. The product will be called PERSIANN hereafter.

Table 1.
Attributes of PERSIANN, PERSIANN-CCS, PERSIANN-CDR and PDIR-Now.
2.2.3. PERSIANN-Cloud Classification System (PERSIANN-CCS)
PERISANN-CCS is a real-time high-resolution global product providing precipitation estimates at 0.04° × 0.04° [52]. It classifies the cloud patch features while considering satellite-retrieved data of cloud height, areal expanse, and texture variability. These categories help to determine the amount of precipitation that should be assigned to each cloud’s pixel based on a certain curve that depicts the correlation between the rate of precipitation and brightness temperature. The PERSIANN-CCS daily data were acquired from the CHRS data portal at http://chrsdata.eng.uci.edu in netcdf format (assessed on 3 July 2022). For the sake of simplification, PERSIANN-CCS will be abbreviated as CCS hereafter.
2.2.4. PERSIANN Climate Data Record (PERSIANN-CDR)
PERSIANN-CDR has provided a near-global precipitation dataset for almost 38 years starting from January 1983 [46]. It provides daily rainfall measurement at 0.25° × 0.25° scale. It was developed to cope with the need for a long-term and consistent worldwide precipitation dataset to assist various climate-related studies. It represents a modified version of the PERSIANN algorithm and primarily depends on the GEO satellite’s infrared imagery as the main input to the ANN model. However, contrary to the PERSIANN technique, which employs passive microwave imagery to update the network’s parameters, PERSIANN-CDR instead trains the ANN model using Stage IV hourly precipitation from the National Centers for Environmental Prediction (NCEP). The technique is then used to estimate the historical data while using preset parameters. PERSIANN-CDR is publicly available at the CHRS data portal http://chrsdata.eng.uci.edu (assessed on 7 July 2022) and at the National Centers for Environmental Information (NCEI) of NOAA at https://www.ncdc.noaa.gov/cdr/atmospheric/precipitation-persiann-cdr (accessed on 8 July 2022). PERSIANN-CDR will be abbreviated as CDR hereafter.
2.2.5. PDIR-Now
PERSIANN-Dynamic Infrared Rain Rate near real-time is a high-resolution (0.04° × 0.04°) global precipitation product developed by CHRS [53]. Since PDIR-Now relies on high-frequency sampled IR photography, it has a major advantage over other near-real-time precipitation datasets in that its latency from the moment of rainfall incidence is minimal (15–60 min). The dynamic shifting of (Tb-R) curves using rainfall climatology is one of the strategies used by PDIR-Now to adjust for the errors and uncertainties that arise from the use of IR data. The PDIR-Now dataset is highly suited for near-real-time hydrologic applications such as flood forecasting and creating flood inundation maps because of its low latency. Daily rainfall data were acquired from the CHRS data portal website at http://chrsdata.eng.uci.edu (assessed on 7 July 2022).
2.3. Materials and Methods
To investigate the usefulness and validity of the PERSIANN family products in the UAE, various statistical, contingency, and extreme climate measures were utilized in this study. Moreover, to study the in-depth analysis, annual average rainfall and daily averages of the products were compared with rain gauge data. Finally, the effectiveness of the studied products is shown by developing Intensity Duration Frequency Curves (IDF) while relative differences between the IDF curves of the products and rain gauges are also presented. The implemented measures are presented below. A comprehensive overview of the conducted methodology is presented as a flow chart in Figure 2.
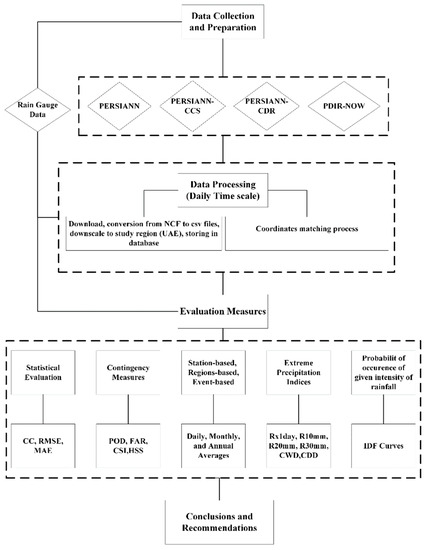
Figure 2.
Flow chart for the data analysis.
2.4. Coordinates Matching Process
The most important stage in ensuring accurate findings is choosing the grid coordinates based on gauge locations. To precisely select the adjacent grid coordinates including the gauge location, the code was developed in MATLAB. The following actions are carried out by the code: (1) choosing the grid containing the gauge and noting the rainfall data for the four nearby grid points; (2) calculating the weighted average of the four closest grid points and contrasting it with the gauge rainfall data. Since four nearby grid points were chosen using the weighted average method, the grid point that is the closest to the gauge site is given the most weight in the average computations.
2.5. Statistical and Contingency Measures
The correlation coefficient (CC) [54] is a useful measure to quantify the agreement between two datasets and is utilized here to find the correlation between satellite products and rain gauge data. To measure the error between the observed and simulated values, root mean square error (RMSE) and mean absolute error (MAE) were calculated.
Contingency measures are important to discover the accuracy of the products in detecting rainfall events. Prominent contingency measures include the probability of detection (POD), false alarm ratio (FAR), Critical Success Index (CSI), and Heidke Skill Score (HSS). Table 2 provides the basis for the formulation of the mentioned measures. Based on this contingency table, the measures are listed in Table 3. POD indicates the fraction of the observed events accurately detected by the satellite precipitation products, while FAR is the fraction of the detected events by satellite products that did not occur in actual. CSI or threat score (TS) considers misses, hits, and false alarms and is sensitive to the climatological frequency of the event. Similarly, HSS [55] is mainly used for multicategory verification. It measures the accuracy of the estimate relative to the random chance and ranges from −1 to 1 (as shown in Table 3). A score of 1 means perfect positive skill while −1 indicates perfect negative skill. HSS awards constant and random forecasts with an expected score of zero and eliminates the forecasts purely caused by random chance and estimates the true forecast fraction [56]. Usually, an HSS value greater than 0.3 represents a significant skill concerning random chance [56,57].

Table 2.
Contingency table to define the criteria for contingency measures.

Table 3.
Statistical and contingency measures and their calculation formulas, ranges, and best values.
2.6. Climate and Extreme Indices
Selected climate indices were calculated to check the extremes in rainfall data both for satellite products and rain gauges. These indices were calculated to show the maximum one-day precipitation in the given period and the number of rainfall events above certain thresholds [58]. The analysis was also performed to quantify the dry and wet spells and consecutive wet and dry days for both sets of data. Table 4 lists the climate indices and their relative formulas.

Table 4.
Definition of climate indicators used in this study (www.climdex.org, accessed on 11 August 2022).
2.7. Intensity Duration Frequency (IDF) Curves
The probability that a certain average rainfall intensity will occur within a specific time is shown graphically by the rainfall intensity–duration–frequency (IDF) curves [59]. The IDF curves allow for the estimation of the return period of an observed rainfall event or, conversely, of the rainfall intensity corresponding to a given return period by providing a mathematical relationship between the rainfall intensity I, the duration D, and the annual frequency of exceedance f. IDF curves have a variety of uses, including evaluating rainfall events, categorizing climatic regimes, calculating design storms, helping to build urban drainage systems, etc. Various studies have shown the effectiveness of satellite remote sensing products in developing the IDF curves as an alternative for data-scarce regions [59,60,61]. Extreme value (EV) (Gumbel Type I) distribution was fit to the observations and rainfall events associated with the given exceedance probabilities. The Gumbel (Type I) distribution can be expressed as:
where µ and β are the location and scale parameters, respectively. Then, the random variable XT for a certain return period, T, can be measured as given in the following expression,
where is the observations mean, and S is the standard deviation. KT is the frequency factor that can be obtained by
Annual maximum rainfall values were calculated, and Equations (1)–(3) were applied to find the rainfall intensities against the durations. The frequency factor was calculated while considering the required return periods using Equation (3). Moreover, for the evaluation of IDF curves, percent relative errors were calculated by using the following formula,
where IDFProd refers to the IDF values calculated from the PERSIANN family satellite products, and IDFGauge is the IDF values measured corresponding to the gauge data. RE (%) is the percent relative error. Since it is normalized and not sensitive to the absolute rainfall values, this performance metric is suitable for the performance evaluation of IDF curves and enables us to evaluate the effectiveness of IDF estimations across the entire spatial domain [61].
3. Results and Discussions
3.1. Daily, Monthly, and Annual Averages Rainfall Spatial Distribution
Figure 3a,b represents the spatial distribution of annual and daily average rainfall for the rain gauge and the PERSIANN family products. It can be inferred that the four products are overestimating the annual and daily averages to some extent. However, the annual spatial plots for CDR and PDIR are relatively in good agreement with the gauge data in terms of rainfall distribution (Figure 3a). On the other hand, PERSIANN and CCS products have shown a complete overestimation throughout the domain with average rainfall values in the range of 80–140 mm, while the gauge annual average ranges from 40 mm in the southwest region of Abu Dhabi to 140 mm in the northern mountains. The daily average plots indicate extremely low values for the gauge data owing to a large number of days with no precipitation (Figure 3b).
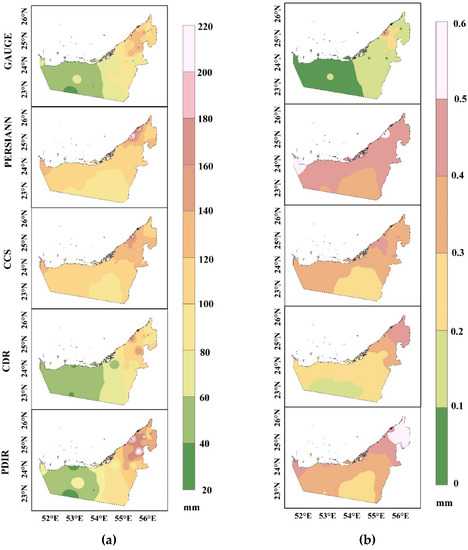
Figure 3.
Annual (a) and daily (b) average rainfall distribution of rain gauge and PERSIANN satellite products across the study region from 2011 to 2020.
The trends in the daily averages, however, were slightly overestimated by almost all the products. This can be associated with the fact that the UAE experiences very few days of rainfall, and most of the days are considered as dry as shown in the CDD analysis. Since satellite products tend to capture atmospheric moisture, and therefore, the daily averages were slightly higher than the gauge values, as the products were still capable of capturing some daily readings. PDIR and CDR showed the highest daily average in the northernmost part of the country. The difference in the average annual and daily values between the gauge and PERSIANN family products was more pronounced for PERSIANN and CCS, while the least difference was displayed by CDR. Absolute difference plots were also developed to show the range of absolute differences between the gauge and PERSIANN product estimations (Figure 4). The CDR product showed the least difference in terms of annual averages (Figure 4a), while CCS and PERSIANN depict more differences, especially in the negative range, which shows that the values were higher than the gauge values. PDIR was second to CDR, showing the least difference in average annual values. A similar trend can be shown in daily average differences (Figure 4b).
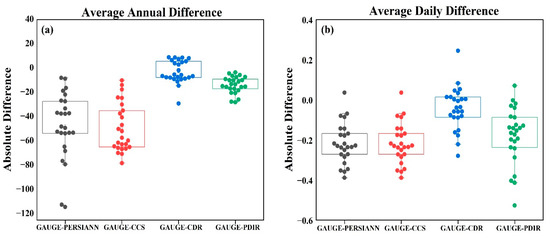
Figure 4.
The absolute difference between average annual (a) and daily (b) values between the gauge and satellite products from 2011 to 2020.
The UAE usually observes rainfall in the winter months, and the summer months are particularly dry. Therefore, a comparison of the monthly average rainfall values is necessary to reveal the accuracy of the selected products. Figure 5 shows the monthly evaluation of the PERSIANN family products in contrast with the gauge values. The figure indicates that the high rainfall months in the UAE are January–April, whereas other months show considerably less rainfall values as shown from the gauge heat bar. May–July are the driest months of the year, which is correctly estimated by CDR and PDIR as well where the average monthly values are less than 3 mm. Almost all the products matched the gauge data in terms of the highest monthly average value in March, except for PERSIANN and CCS, which show the highest rainfall in April. The month of November also reveals considerable rainfall over the UAE during the study period, and both CDR and PDIR show a similar pattern, while the other two products could not capture it. A significant amount of rainfall in August was detected by PERSIANN and CCS (<10 mm), whereas rain gauges and CDR reported an average value of less than 5 mm for that month. Overall, CDR and PDIR are best in terms of mean monthly rainfall as compared to the rain gauge data. PERSIANN and CCS showed a significant overestimation of the monthly rainfall with relatively varying monthly distribution of rainfall.
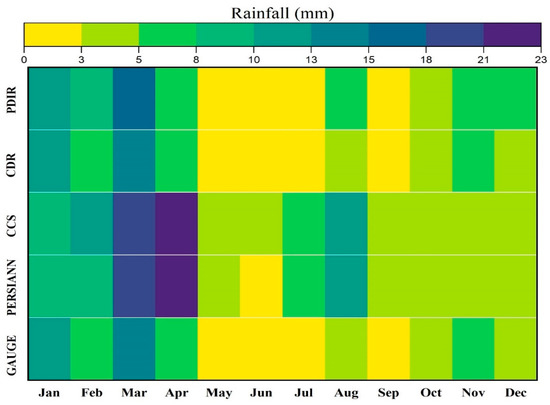
Figure 5.
Comparison of mean monthly rainfall values for rain gauges and PERSIANN family products from 2011 to 2020. Months (January–December) are shown on the x-axis.
3.2. Statistical Performance of Datasets
The consistency of the products was evaluated by calculating the correlation coefficient (CC), root mean square error (RMSE), and mean absolute error (MAE) for both temporal and spatial assessments. Figure 6c reveals that PERSIANN-CDR showed the highest correlation with the gauge observations with the CC value reaching up to 0.86 in the northern region of the UAE. Overall, the spatial assessment revealed that CDR was consistent with the gauge data over the whole study area except for some central stations. PDIR showed moderate to high CC values (Figure 6d). The moderate values were dominant over the western region and some parts of the northern emirates including Dubai and Sharjah. As expected, the lowest CC was reported for PERSIANN and CCS products with less than 0.40 in most of the study region except for some northern stations. A similar pattern was observed for the RMSE spatial plots (Figure 6e–h), where PERSIANN products exhibited the maximum RMSE values across all the regions. For CDR, the RMSE values were mostly less than 2 mm, except in the AlAin region where it was greater than 2 mm. PDIR, however, showed varying behavior (Figure 6h), with RMSE values ranging from 0.5 to 4 mm, spreading from the western to the northern region in ascending order. RMSE values for CCS were never less than 2 mm for the whole spatial domain as shown in Figure 6f.
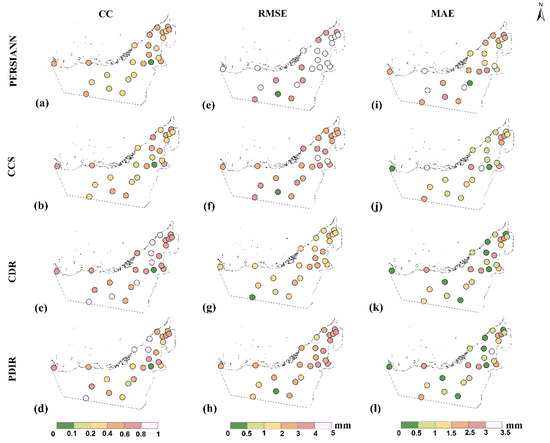
Figure 6.
Stations-based performance of the products based on CC, RMSE, and MAE. Plots (a–d), (e–h), and (i–l) represent CC, RMSE, and MAE respectively for the gauge and satellite products.
CDR, PDIR, and CCS show a comparative spatial distribution in terms of MAE (Figure 6j–l), with an average MAE between 0.5 and 1.5 mm. However, CCS also showed MAE values greater than 3 mm for two stations as shown in Figure 6j. PERSIANN product showed the maximum MAE values in the range of 2.5–3.5 (Figure 6i).
3.3. Contingency Measures of Different Products
As shown in Table 3, POD indicates the fraction of the observed events accurately detected by the satellite precipitation products. It provides an effective tool to detect the accuracy of satellite precipitation products based on ground truths (rain gauges). Figure 7a–d shows the POD spatial distribution for the PERSIANN products used in this study. PDIR product has shown the highest POD (Figure 7d), with the POD values reaching as high as 0.93. The product preceding the PDIR in terms of POD is CDR, which exhibits POD values in the range of 0.6–0.85 throughout the UAE. Next on the list are CCS and PERSIANN (Figure 7a,b), respectively. For some of the western region stations, only PDIR shows very high POD values, while the other three products show relatively lower values. This is consistent with the CC values depicted by PDIR products in the same region, where they show relatively higher CC values than the other products. Overall, it is deduced that CDR and PDIR were successful in detecting the true rainfall events with a relative underestimation exhibited by PERSIANN and CCS products. FAR indicates false rainfall events detected by the satellite precipitation products. For the study duration and the region, all the products have shown very high FAR values, (Figure 7e–h) and the value of FAR was always higher than 0.8 for all products over the UAE. Similarly, CSI provided a similar pattern (Figure 7m–p), and the values were mainly less than 0.3 across the study region with some exceptions in Al-Faqa station where the CSI value was between 0.4–0.5. This was also reported by all the products.
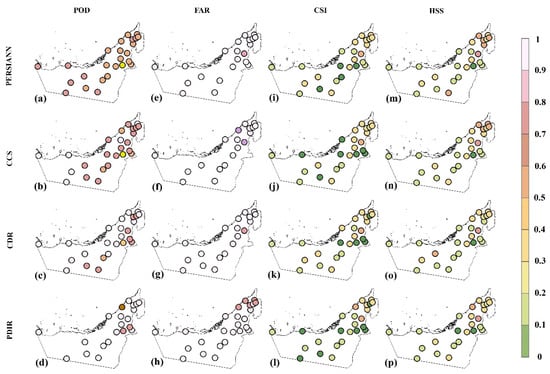
Figure 7.
Detection accuracy of the PERSIANN family products using probability of detection (POD) (a–d), false alarm ratio (FAR) (e–h), Critical Success Index (CSI) (i–l), Heidke Skill Score (HSS) (m–p). Each horizontal row represents one product. The color bar represents all four contingency attributes.
Figure 7m–p represents the HSS values for the four products across UAE. The plots show an HSS value in the range of 0.2–0.5, and no major difference can be observed for all the products. However, PDIR displayed the least HSS score as compared to others. Therefore, it is deduced that all products displayed relatively significant skill except for PDIR.
3.4. Extreme Climate Indices
To evaluate the performance of the PERSIANN family products in capturing the extreme precipitation behavior over the UAE, six extreme indices, namely Rx1day, R10 mm, R20 mm, R30 mm, CWD, and CDD (Table 3), are calculated and compared with the same indices from the rain-gauge-based dataset. All the indices were calculated using daily rainfall data from PERSIANN, CCS, CDR, PDIR, and corresponding gauge data from 2011 to 2020. Figure 6 represents four out of six precipitation indices, while Figure 8 represents the CWD and CDD along with the wet and dry spells. The maximum daily rainfall value (Rx1day) during 2011–2020 is plotted in Figure 8a. It shows that the Rx1day value ranged from 11.6 to 126.6 mm. The visual comparison of the four products revealed that only CDR has shown comparable lowest and highest daily rainfall with the gauge data during the study period. PERSIANN product significantly overestimated the Rx1day values. CCS and PDIR also provided an acceptable performance in comparison with the gauge data except for some stations where they showed relatively higher values. A similar comparison can be observed for R10 mm (Figure 8b), which is the number of days when the rainfall value was greater or equal to 10 mm. PERSIANN, CCS, and PDIR overestimated the number of days as compared to rain gauge data, while CDR provided better estimates for the reference data. A comparison of R20 mm (Figure 8c) depicts an analogous contrast between the gauge and PERSIANN satellite products with the PERSIANN product highly overestimating the number of days when rainfall was equal to or higher than 20 mm. CDR performed better than the other products in this case as well. However, in the case of R30 mm (Figure 8d), the outcomes of all the products were reasonably comparable with the reference data, indicating that the products were accurately defining the high or extreme rainfall events except for some stations.
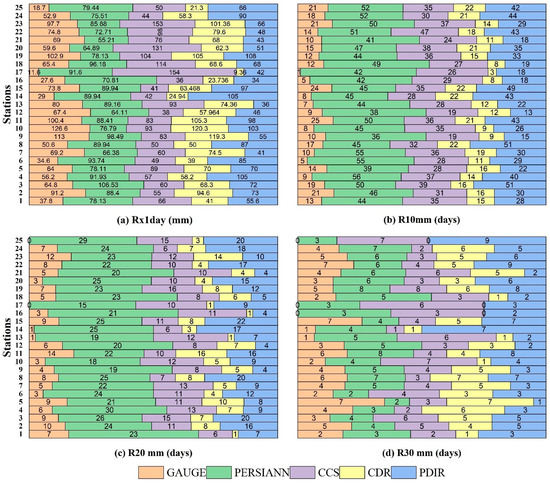
Figure 8.
Climate indices comparison between the rain gauge observations and PERSIANN satellite products. (a) R × 1 day (mm) values for gauge vs. satellite products. (b–d) The same for R10, R20, and R30 mm.
Consecutive dry and wet days (CDD and CWD) are calculated and shown in Figure 9b,d. The minimum threshold was set as 1 mm for the calculation of both indices. To understand the indices, mean, maximum, minimum, and median values are calculated and plotted for gauge and satellite products. In addition, the number of dry and wet spells is calculated and shown in Figure 9a,c. The threshold of 3 consecutive days was set to calculate both. Figure 8b demonstrates that all the products underestimated the mean CDD by a comparable margin, except for the PERSIANN product, which overestimated the mean value by 5–10%. Similarly, the same trend can be seen for minimum and median values. However, for maximum CDD, all the products underestimated the gauge data significantly. This shows that actual gauge data have many dry days as compared to the PERSIANN family products, which showed fewer number of CDDs. However, in terms of dry spells, all the products overestimated the minimum, mean and median dry spells. For maximum values, they were in good comparison with the gauge data. In contrast, the CWDs analysis (Figure 9d) has shown the opposite trend with the gauge data showing comparatively lower CWD than the satellite products, while all the PERSIANN family products significantly overestimated the consecutive wet days. For instance, the mean CWD values were calculated as 4 for the gauge data for the whole period, while the satellite products gave the mean days in the range of 8–12. The display trend of wet spells was not very different than the CWD plots as shown in Figure 9c.
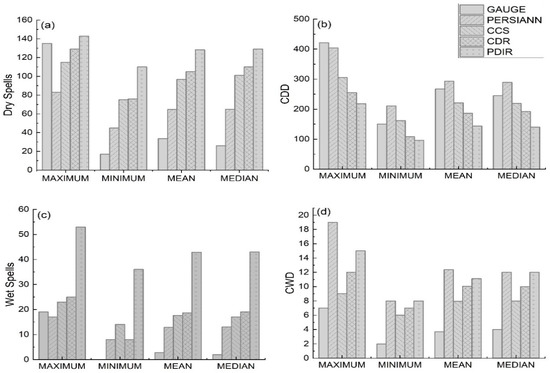
Figure 9.
Representation of maximum, minimum, mean and median values of dry spells (a), wet spells (c), consecutive dry days (CDD) (b) and consecutive wet days (CWD) (d). CDD and CWD were calculated based on the threshold of 1 mm rainfall, while dry and wet spells were calculated by selecting 3 days of rainfall.
3.5. Event-Based Analysis
Four major events that occurred during the study period, were selected. These rainfall events occurred in January 2015, January 2016, March 2017, and January 2020. Maximum daily rainfall values were considered to develop the spatial distribution of the events throughout the UAE. March 2017 and January 2020 rainfall events caused substantial floods and damage across the country, and therefore, the importance of accurately predicting such events becomes paramount. Figure 10 displays the spatial maps for the four events based on the gauge observations and the four PERSIANN family products for comparison. Plots a–e, f–j, k–o, and p–t on vertical direction represent the events while plots a–p, b–q, c–r, d–s, and e–t represent the gauge, PERSIANN, CCS, CDR, and PDIR, respectively. The March 2017 and January 2020 events were more severe than the other two events, as the maximum rainfall value approached 95 and 148 mm, respectively.
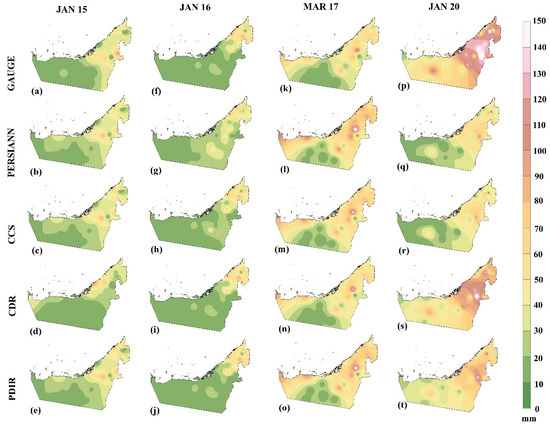
Figure 10.
Comparison of satellite precipitation products with rain gauge observations for four selected rainfall events over the study area during the study period (2011–2020). Plots (a–e), (f–j), (k–o), and (p–t) represent the four events against each gauge and satellite products. The spatial plots were developed based on the maximum daily rainfall values from rain gauges.
Figure 10 clearly shows that almost all the products were successful in replicating the spatial distribution of rainfall events at par with the gauge data. While January 2015 and January 2016 events mainly occurred over the northern emirates, March 2017 and January 2020 events were relatively widespread, with the main severity in northeastern regions. CCS and PDIR were successful in capturing the rainfall events during January 2015, January 2016, and March 2017. However, the extreme event of January 2020 was somehow underestimated by all of them, while CDR showed the best agreement for this extreme event as shown in Figure 10s. The performance of the PERSIANN family products is further detailed by calculating statistical and contingency measures and is presented in Table 5. The table lists the POD, FAR, CSI, and HSS measures for the rainfall detection accuracy and CC, RMSE, and MSE for the correlation and error measures. CDR and PDIR were relatively efficient in detecting the rainfall accuracy for almost all the events, and the CC values were also higher for them as compared to their counterparts.

Table 5.
Statistical and contingency measures for the four selected rainfall events and corresponding satellite products. Mean values are shown for POD, FAR, CSI, HSS, CC, RMSE, and MAE.
3.6. Intensity Duration Frequency (IDF) Curve Analysis
To further check the robustness of the PERSIANN family products, IDF curves were prepared and compared with the gauge data. The IDF curve development procedure has been explained in Section 2.7 in detail. The intensity of rainfall was determined for various return periods for 24 h duration (Appendix A, Figure A1). Figure 11 displays the relative error of IDF curves across the whole spatial domain for the selected duration and the return periods of 2, 10, 25, 50, 75, 100, 500, and 1000 years. While the errors are considerable for PERSIANN and CCS products, they are less significant for CDR and PDIR. For PERSIANN product, the error ranges from 17% to 25%, while for CCS, it ranges from −14% to −24%. For CDR and PDIR, the error ranges from 4% to −15% and from 6% to −14%, respectively. Additionally, errors are more obvious in high-return periods, which can be attributed to the shorter records of the rainfall data used for the analysis. The IDF values calculated with PERSIANN product always overestimated the gauge IDF values by more than 15%, while for CCS, there was a considerable underestimation by more than −14%. CDR and PDIR overestimated the 2-year return period, and the error was the least for the 25-year return period for both products. For higher return periods, the IDF values were mostly underestimated with the maximum error up to −14%. The error margin would be less pronounced with a longer duration of the data used for the calculation of IDF curves.
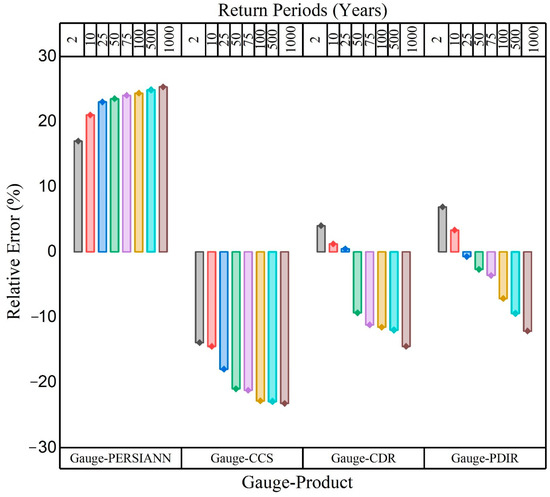
Figure 11.
Percent relative difference plots for intensity duration frequency (IDF) curves between gauge and PERSIANN family products. Return periods of 2, 10, 25, 50, 75, 100, 500, and 1000 years were used as indicated on the top axis for each combination.
4. Discussions
Four IR-based satellite precipitation products were utilized for their inter-comparison and to analyze the advantages and limitations of these products over each other. Since all the products have varying spatial resolutions, station-based analysis was conducted after incorporating proper coordinate matching processes to accurately acquire the precipitation estimates against the desired station coordinates. PERSIANN product primarily serves as the basis of its successors; however, these four products are different in a sense that the inference methodology for the processing of these products varies. For instance, PERSIANN-CCS enables the cloud features categorization including varying texture, cloud height, and areal extent. It also utilizes variable thresholds in contrast to the more traditional constant thresholds for the identification of individual cloud patches. This robust classification enables a better understanding of the relationship between precipitation rate and brightness temperature. On the other hand, PERSIANN-CDR provides long-term continuous rainfall dataset and is adjusted by exploiting the GPCC monthly product. Similarly, PDIR-NOW uses high-frequency IR imagery and provides a very short latency time. This short latency period categorizes this product as more suitable for near-real-time hydrologic applications. Therefore, their inter-comparison on varying geographical regions could significantly shed light on their global effectiveness.
In this kind of comparative analysis, length and quality of the data play an important role in determining the various efficiency measures, and therefore, the efficiency measures utilized in this study primarily represent the values based on the length of the study duration, which is 10 years for our case. Furthermore, due to the limitation of the available data, IDF curves were generated with the 10 years of available data to assess the effectiveness of satellite products to reproduce rainfall intensities as compared to the rain gauge data. The analysis, in its core sense, is just comparative and does not necessarily portray a concrete basis to be reliant on for any of these products (based on current data). For better understanding, more than 20 years of continuous rainfall data should be required to produce IDF curves. Although the study revealed promising results, there is still room for improvement in satellite estimates for arid and semiarid regions. For instance, the biases in the satellite products can be removed by utilizing the topography and other climate parameters for the study area. Moreover, the fusion of various satellite products to develop a reliable precipitation database can be performed after validating by using in situ or radar estimates. These kinds of validation studies for remote sensing precipitation products over varying geographical regions are very important because different regions have unique meteorological and topographical characteristics, which can affect precipitation patterns. Validation helps to determine the accuracy of satellite products in different regions and to identify any biases that need to be corrected. This information is important for various applications such as hydrology, agriculture, and water management, which rely on accurate precipitation data.
5. Conclusions
This paper utilized PERSIANN family precipitation products namely PERSIANN, PERSIANN-CCS, PERSIANN-CDR, and PDIR-Now to test their effectiveness and applicability over the United Arab Emirates (UAE). Daily rainfall data from 2011–2020 were used for ground observations and satellite products. The evaluation was performed using various statistical (CC, RMSE, MAE) and contingency measures (POD, FAR, CSI, HSS). Apart from the annual and daily spatial assessment of the products, event-based analysis was also performed to check the robustness of the selected products in capturing extreme events. Moreover, this study utilized extreme climate indices such as Rx1day, R10 mm, R20 mm, CWD, and CDD to better understand and visualize the extremes in the UAE rainfall pattern. Finally, an additional analysis of IDF curves comparison was conducted by developing IDF curves for different return periods, and the relative error was calculated to demonstrate the optimum product for rainfall analysis over the UAE. The main conclusion of the study is listed as below:
- Station-based analysis for annual average rainfall distribution revealed that PERSIANN and CCS products overestimated the rainfall in the western region of Abu Dhabi, while for the northern regions, they displayed the annual averages with less error margins. CDR and PDIR showed consistent performance in terms of spatial distribution throughout the country. The comparison of monthly average rainfall showed that CDR and PDIR portrayed a similar pattern for the monthly rainfall averages as compared to rain gauges. PERSIANN-CDR showed the best correlation with the gauge data with an average CC value of 0.7 throughout the study area followed by PDIR, which showed 0.65 as the average CC. However, the CC values for CCS and PERSIANN showed similar behavior with an average value of 0.4. CDR showed the best correlation for the northern emirates’ stations of Dubai and Umm ul Quwain, while the least correlation was observed in the western Abu Dhabi region. For CDR, the RMSE was almost consistent (~2 mm) for most of the stations except for a few stations in the eastern Abu Dhabi region. CDR, PDIR, and CCS revealed similar behavior in terms of MAE, and a consistent spatial distribution was shown. The MAE for all three products was in the range of 0.5–3 mm, while PERSIANN showed MAE values greater than 1.5 mm for almost all the stations.
- PDIR showed the highest POD values in the range of 0.7–0.9 for almost all the stations, while for CDR, the POD range was 0.6–0.9 with an average value of 0.85 and 0.78, respectively. PERSIANN showed the least POD values, and the highest detection probability was not more than 0.6. Similarly, CCS showed an average POD value of 0.6. Thus, the detection accuracy of the PDIR and CDR products was the best among all the products, showcasing their ability to accurately detect the actual rainfall events. FAR values were always in the range of 0.8–0.95 for all the products that show their tendency of capturing false events. Most of the products did not show very high HSS scores except for a few stations in the northeastern station of Abu Dhabi (Al-Faqa). Overall, the HSS score was in the range of 0–0.5 with an average value of 0.15–0.24 for all the products.
- Rx1day was found to be in the range of 11.6–127 for gauge observations. Out of the four products, CDR could closely follow the gauge Rx1day values followed by PDIR, CCS, and PERSIANN. A similar trend was observed for R10, R20, and R30 mm. However, the PERSIANN product significantly underperformed and highly exaggerated the number of days when the rainfall was more than 10 mm. All the products underestimated the mean and maximum values of CDD except for PERSIANN, which surpassed the mean values by almost 5%. The PERSIANN products highly overestimated CWD in terms of mean and maximum values. The errors for IDF values were considerable for PERSIANN and CCS products and were less significant for CDR and PDIR. For PERSIANN product, the error ranged from 17% to 25%, while for CCS, it ranged from −14% to −24%. For CDR and PDIR, the error ranged from 4% to −15% and from 6% to −14%, respectively. Additionally, it is deduced that errors are more obvious in high-return periods, which can be attributed to the shorter records of the rainfall data used for the analysis.
Overall, PERSIANN and CCS showed weaknesses in estimating the precipitation for most of the stations, and the error was dominant in the western region stations of Abu Dhabi and the northeastern parts of the country. The terrain of the eastern and northeastern emirates is mainly coastal with mountain chains next to them. This may result in an irregular weather pattern. As a result, the great heterogeneity of the rainfall pattern caused by the significant variability of the lands’ features may be linked to the poor performance of the satellite in these regions. Additionally, out of 25 gauge stations, only 20% were located in that region, which might negatively affect the spatial rainfall variability over the northeastern emirates. PERSIANN-CDR and PDIR-Now outperformed their counterparts in terms of rainfall detection, correlation, and spatial distribution and can be considered possible alternatives to rain gauges. The results revealed that there is a need to remove the biases from satellite products to rectify the error margins, especially in arid and semi-arid regions. For this purpose, satellite products should be corrected by incorporating additional information from the study area, such as topography [62]. Moreover, the capabilities of multiple products can be combined with the gauge data by utilizing artificial intelligence techniques to develop the gridded precipitation product over such regions. In the future, more advanced satellite products based on microwave detection capabilities such as FY-4A and reanalysis products (ERA5) [33,63] should be assessed in the arid regions, as the current products are based on IR-based estimates only.
Author Contributions
Conceptualization, F.B. and M.A.; methodology, F.B.; software, F.B.; validation, M.A., H.C. and M.S.; formal analysis, F.B. and M.A.; investigation, H.C. and F.B.; resources, M.A. and M.S.; data curation, F.B. and M.S.; writing—original draft preparation, F.B., M.A. and M.S.; writing—review and editing, M.S. and H.C.; visualization, F.B. and H.C.; supervision, M.S. and H.C.; funding acquisition, M.S. All authors have read and agreed to the published version of the manuscript.
Funding
This research work has been funded by the National Water and Energy Center of United Arab Emirates University, Al Ain, UAE.
Data Availability Statement
The satellite data used in the research were obtained from respective websites of the satellite products, which are publicly available. The rain gauge observations were obtained from the National Center of Meteorology (NCM) of UAE and cannot be provided publicly.
Acknowledgments
The first author acknowledges the College of Graduate Studies of United Arab Emirates University for providing graduate fellowship to conduct the PhD research.
Conflicts of Interest
The authors declare no conflict of interest.
Appendix A
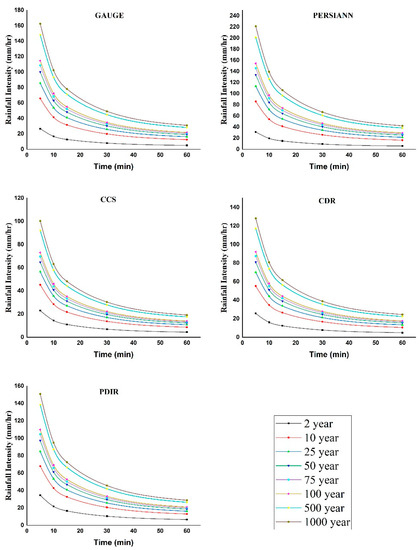
Figure A1.
IDF curves for satellite products vs. rain gauge data based on study duration.
References
- Haile, A.T.; Yan, F.; Habib, E. Accuracy of the CMORPH Satellite-Rainfall Product over Lake Tana Basin in Eastern Africa. Atmos. Res. 2015, 163, 177–187. [Google Scholar] [CrossRef]
- Kim, J.; Han, H. Evaluation of the CMORPH High-Resolution Precipitation Product for Hydrological Applications over South Korea. Atmos. Res. 2021, 258, 105650. [Google Scholar] [CrossRef]
- Eini, M.R.; Rahmati, A.; Piniewski, M. Hydrological Application and Accuracy Evaluation of PERSIANN Satellite-Based Precipitation Estimates over a Humid Continental Climate Catchment. J. Hydrol. Reg. Stud. 2022, 41, 101109. [Google Scholar] [CrossRef]
- Prakash, S. Performance Assessment of CHIRPS, MSWEP, SM2RAIN-CCI, and TMPA Precipitation Products across India. J. Hydrol. 2019, 571, 50–59. [Google Scholar] [CrossRef]
- Hou, A.Y.; Kakar, R.K.; Neeck, S.; Azarbarzin, A.A.; Kummerow, C.D.; Kojima, M.; Oki, R.; Nakamura, K.; Iguchi, T. The Global Precipitation Measurement Mission. Bull. Am. Meteorol. Soc. 2014, 95, 701–722. [Google Scholar] [CrossRef]
- Stagl, J.; Mayr, E.; Koch, H.; Hattermann, F.F.; Huang, S. Effects of Climate Change on the Hydrological Cycle in Central and Eastern Europe. In Managing Protected Areas in Central and Eastern Europe Under Climate Change; Rannow, S., Neubert, M., Eds.; Advances in Global Change Research; Springer Netherlands: Dordrecht, The Netherlands, 2014; pp. 31–43. ISBN 978-94-007-7960-0. [Google Scholar]
- Gragnani, G.L.; Colli, M.; Tavanti, E.; Caviglia, D.D. Advanced Real-Time Monitoring of Rainfall Using Commercial Satellite Broadcasting Service: A Case Study. Sensors 2021, 21, 691. [Google Scholar] [CrossRef]
- Han, L.; Zhang, J.; Chen, H.; Zhang, W.; Yao, S. Toward the Predictability of a Radar-Based Nowcasting System for Different Precipitation Systems. IEEE Geosci. Remote Sens. Lett. 2022, 19, 1005705. [Google Scholar] [CrossRef]
- Huang, H.; Zhao, K.; Fu, P.; Chen, H.; Chen, G.; Zhang, Y. Validation of Precipitation Measurements from the Dual-Frequency Precipitation Radar Onboard the GPM Core Observatory Using a Polarimetric Radar in South China. IEEE Trans. Geosci. Remote Sens. 2022, 60, 4104216. [Google Scholar] [CrossRef]
- Ochoa-Rodriguez, S.; Wang, L.-P.; Willems, P.; Onof, C. A Review of Radar-Rain Gauge Data Merging Methods and Their Potential for Urban Hydrological Applications. Water Resour. Res. 2019, 55, 6356–6391. [Google Scholar] [CrossRef]
- Chen, H.; Chandrasekar, V.; Tan, H.; Cifelli, R. Rainfall Estimation From Ground Radar and TRMM Precipitation Radar Using Hybrid Deep Neural Networks. Geophys. Res. Lett. 2019, 46, 10669–10678. [Google Scholar] [CrossRef]
- Chen, H.; Chandrasekar, V.; Cifelli, R.; Xie, P. A Machine Learning System for Precipitation Estimation Using Satellite and Ground Radar Network Observations. IEEE Trans. Geosci. Remote Sens. 2020, 58, 982–994. [Google Scholar] [CrossRef]
- Han, L.; Zhao, Y.; Chen, H.; Chandrasekar, V. Advancing Radar Nowcasting through Deep Transfer Learning. IEEE Trans. Geosci. Remote Sens. 2022, 60, 4100609. [Google Scholar] [CrossRef]
- Ji, L.; Xu, W.; Chen, H.; Chen, H. Identification of convective precipitation feature observed by trmm/gpm pr using a revised unsupervised clustering proposal. In Proceedings of the 2021 IEEE International Geoscience and Remote Sensing Symposium IGARSS, Brussels, Belgium, 11–16 July 2021; pp. 370–371. [Google Scholar]
- Zhang, J.; Chen, H.; Han, L. An Investigation of a Probabilistic Nowcast System for Dual-Polarization Radar Applications. In Proceedings of the 2020 IEEE International Geoscience and Remote Sensing Symposium IGARSS, Waikoloa, HI, USA, 26 September–2 October 2020; pp. 5294–5297. [Google Scholar]
- Faiz, M.A.; Liu, D.; Fu, Q.; Sun, Q.; Li, M.; Baig, F.; Li, T.; Cui, S. How Accurate Are the Performances of Gridded Precipitation Data Products over Northeast China? Atmos. Res. 2018, 211, 12–20. [Google Scholar] [CrossRef]
- Jiang, S.; Zhou, M.; Ren, L.; Cheng, X.; Zhang, P. Evaluation of Latest TMPA and CMORPH Satellite Precipitation Products over Yellow River Basin. Water Sci. Eng. 2016, 9, 87–96. [Google Scholar] [CrossRef]
- Wang, Q.; Xia, J.; She, D.; Zhang, X.; Liu, J.; Zhang, Y. Assessment of Four Latest Long-Term Satellite-Based Precipitation Products in Capturing the Extreme Precipitation and Streamflow across a Humid Region of Southern China. Atmos. Res. 2021, 257, 105554. [Google Scholar] [CrossRef]
- Wehbe, Y.; Ghebreyesus, D.; Temimi, M.; Milewski, A.; Al Mandous, A. Assessment of the Consistency among Global Precipitation Products over the United Arab Emirates. J. Hydrol. Reg. Stud. 2017, 12, 122–135. [Google Scholar] [CrossRef]
- Cavalcante, R.B.L.; da Silva Ferreira, D.B.; Pontes, P.R.M.; Tedeschi, R.G.; da Costa, C.P.W.; de Souza, E.B. Evaluation of Extreme Rainfall Indices from CHIRPS Precipitation Estimates over the Brazilian Amazonia. Atmos. Res. 2020, 238, 104879. [Google Scholar] [CrossRef]
- Faiz, M.A.; Liu, D.; Fu, Q.; Wrzesiński, D.; Muneer, S.; Khan, M.I.; Li, T.; Cui, S. Assessment of Precipitation Variability and Uncertainty of Stream Flow in the Hindu Kush Himalayan and Karakoram River Basins of Pakistan. Meteorol. Atmos Phys. 2019, 131, 127–136. [Google Scholar] [CrossRef]
- López-Bermeo, C.; Montoya, R.D.; Caro-Lopera, F.J.; Díaz-García, J.A. Validation of the Accuracy of the CHIRPS Precipitation Dataset at Representing Climate Variability in a Tropical Mountainous Region of South America. Phys. Chem. Earth Parts A/B/C 2022, 127, 103184. [Google Scholar] [CrossRef]
- Nawaz, M.; Iqbal, M.F.; Mahmood, I. Validation of CHIRPS Satellite-Based Precipitation Dataset over Pakistan. Atmos. Res. 2021, 248, 105289. [Google Scholar] [CrossRef]
- Alsumaiti, T.S.; Hussein, K.; Ghebreyesus, D.T.; Sharif, H.O. Performance of the CMORPH and GPM IMERG Products over the United Arab Emirates. Remote Sens. 2020, 12, 1426. [Google Scholar] [CrossRef]
- Huffman, G.; Bolvin, D.; Braithwaite, D.; Hsu, K.-L.; Joyce, R.; Kidd, C.; Nelkin, E.J.; Sorooshian, S.; Tan, J.; Xie, P. NASA Global Precipitation Measurement (GPM) Integrated Multi-SatellitE Retrievals for GPM (IMERG); Global Precipitatoin Measurement; NASA: Washington, DC, USA, 2018; pp. 1–29. [Google Scholar]
- Nguyen, P.; Ombadi, M.; Sorooshian, S.; Hsu, K.; AghaKouchak, A.; Braithwaite, D.; Ashouri, H.; Thorstensen, A.R. The PERSIANN Family of Global Satellite Precipitation Data: A Review and Evaluation of Products. Hydrol. Earth Syst. Sci. 2018, 22, 5801–5816. [Google Scholar] [CrossRef]
- Tan, J.; Huffman, G.J.; Bolvin, D.T.; Nelkin, E.J. IMERG V06: Changes to the Morphing Algorithm. J. Atmos. Ocean. Technol. 2019, 36, 2471–2482. [Google Scholar] [CrossRef]
- Xiong, W.; Tang, G.; Wang, T.; Ma, Z.; Wan, W. Evaluation of IMERG and ERA5 Precipitation-Phase Partitioning on the Global Scale. Water 2022, 14, 1122. [Google Scholar] [CrossRef]
- Ma, Z.; Zhu, S.; Yang, J. FY4QPE-MSA: An All-Day Near-Real-Time Quantitative Precipitation Estimation Framework Based on Multispectral Analysis From AGRI Onboard Chinese FY-4 Series Satellites. IEEE Trans. Geosci. Remote Sens. 2022, 60, 4107215. [Google Scholar] [CrossRef]
- Huang, Z.; Zhang, Y.; Xu, J.; Fang, X.; Ma, Z. Can Satellite Precipitation Estimates Capture the Magnitude of Extreme Rainfall Events? Remote Sens. Lett. 2022, 13, 1048–1057. [Google Scholar] [CrossRef]
- Wang, N.; Liu, W.; Sun, F.; Yao, Z.; Wang, H.; Liu, W. Evaluating Satellite-Based and Reanalysis Precipitation Datasets with Gauge-Observed Data and Hydrological Modeling in the Xihe River Basin, China. Atmos. Res. 2020, 234, 104746. [Google Scholar] [CrossRef]
- Ougahi, J.H.; Mahmood, S.A. Evaluation of Satellite-Based and Reanalysis Precipitation Datasets by Hydrologic Simulation in the Chenab River Basin. J. Water Clim. Chang. 2022, 13, 1563–1582. [Google Scholar] [CrossRef]
- Gao, Z.; Huang, B.; Ma, Z.; Chen, X.; Qiu, J.; Liu, D. Comprehensive Comparisons of State-of-the-Art Gridded Precipitation Estimates for Hydrological Applications over Southern China. Remote Sens. 2020, 12, 3997. [Google Scholar] [CrossRef]
- Chen, Y.; Duan, J.; An, J.; Liu, H.; Görsdorf, U.; Berger, F.H. Satellite Estimates and Subpixel Variability of Rainfall in a Semi-Arid Grassland. Atmos. Ocean. Sci. Lett. 2021, 14, 100055. [Google Scholar] [CrossRef]
- Mahmoud, M.T.; Al-Zahrani, M.A.; Sharif, H.O. Assessment of Global Precipitation Measurement Satellite Products over Saudi Arabia. J. Hydrol. 2018, 559, 1–12. [Google Scholar] [CrossRef]
- Rincón-Avalos, P.; Khouakhi, A.; Mendoza-Cano, O.; la Cruz, J.L.-D.; Paredes-Bonilla, K.M. Evaluation of Satellite Precipitation Products over Mexico Using Google Earth Engine. J. Hydroinform. 2022, 24, 711–729. [Google Scholar] [CrossRef]
- Hussein, K.A.; Alsumaiti, T.S.; Ghebreyesus, D.T.; Sharif, H.O.; Abdalati, W. High-Resolution Spatiotemporal Trend Analysis of Precipitation Using Satellite-Based Products over the United Arab Emirates. Water 2021, 13, 2376. [Google Scholar] [CrossRef]
- Donat, M.G.; Peterson, T.C.; Brunet, M.; King, A.D.; Almazroui, M.; Kolli, R.K.; Boucherf, D.; Al-Mulla, A.Y.; Nour, A.Y.; Aly, A.A.; et al. Changes in Extreme Temperature and Precipitation in the Arab Region: Long-Term Trends and Variability Related to ENSO and NAO. Int. J. Climatol. 2014, 34, 581–592. [Google Scholar] [CrossRef]
- Merabtene, T.; Siddique, M.; Shanableh, A. Assessment of Seasonal and Annual Rainfall Trends and Variability in Sharjah City, UAE. Adv. Meteorol. 2016, 2016, 6206238. [Google Scholar] [CrossRef]
- Ouarda, T.B.M.J.; Charron, C.; Niranjan Kumar, K.; Marpu, P.R.; Ghedira, H.; Molini, A.; Khayal, I. Evolution of the Rainfall Regime in the United Arab Emirates. J. Hydrol. 2014, 514, 258–270. [Google Scholar] [CrossRef]
- Sherif, M.; Akram, S.; Shetty, A. Rainfall Analysis for the Northern Wadis of United Arab Emirates: A Case Study. J. Hydrol. Eng. 2009, 14, 535–544. [Google Scholar] [CrossRef]
- Sherif, M.; Almulla, M.; Shetty, A.; Chowdhury, R.K. Analysis of Rainfall, PMP and Drought in the United Arab Emirates. Int. J. Climatol. 2014, 34, 1318–1328. [Google Scholar] [CrossRef]
- Huffman, G.J.; Bolvin, D.T.; Nelkin, E.J.; Wolff, D.B.; Adler, R.F.; Gu, G.; Hong, Y.; Bowman, K.P.; Stocker, E.F. The TRMM Multisatellite Precipitation Analysis (TMPA): Quasi-Global, Multiyear, Combined-Sensor Precipitation Estimates at Fine Scales. J. Hydrometeorol. 2007, 8, 38–55. [Google Scholar] [CrossRef]
- Joyce, R.J.; Janowiak, J.E.; Arkin, P.A.; Xie, P. CMORPH: A Method That Produces Global Precipitation Estimates from Passive Microwave and Infrared Data at High Spatial and Temporal Resolution. J. Hydrometeorol. 2004, 5, 487–503. [Google Scholar] [CrossRef]
- Sorooshian, S.; Hsu, K.-L.; Gao, X.; Gupta, H.V.; Imam, B.; Braithwaite, D. Evaluation of PERSIANN System Satellite-Based Estimates of Tropical Rainfall. Bull. Am. Meteorol. Soc. 2000, 81, 2035–2046. [Google Scholar] [CrossRef]
- Ashouri, H.; Hsu, K.-L.; Sorooshian, S.; Braithwaite, D.K.; Knapp, K.R.; Cecil, L.D.; Nelson, B.R.; Prat, O.P. PERSIANN-CDR: Daily Precipitation Climate Data Record from Multisatellite Observations for Hydrological and Climate Studies. Bull. Am. Meteorol. Soc. 2015, 96, 69–84. [Google Scholar] [CrossRef]
- Hsu, K.; Gao, X.; Sorooshian, S.; Gupta, H.V. Precipitation Estimation from Remotely Sensed Information Using Artificial Neural Networks. J. Appl. Meteorol. Climatol. 1997, 36, 1176–1190. [Google Scholar] [CrossRef]
- Katiraie-Boroujerdy, P.-S.; Rahnamay Naeini, M.; Akbari Asanjan, A.; Chavoshian, A.; Hsu, K.; Sorooshian, S. Bias Correction of Satellite-Based Precipitation Estimations Using Quantile Mapping Approach in Different Climate Regions of Iran. Remote Sens. 2020, 12, 2102. [Google Scholar] [CrossRef]
- Miao, C.; Ashouri, H.; Hsu, K.-L.; Sorooshian, S.; Duan, Q. Evaluation of the PERSIANN-CDR Daily Rainfall Estimates in Capturing the Behavior of Extreme Precipitation Events over China. J. Hydrometeorol. 2015, 16, 1387–1396. [Google Scholar] [CrossRef]
- Yilmaz, K.K.; Hogue, T.S.; Hsu, K.; Sorooshian, S.; Gupta, H.V.; Wagener, T. Intercomparison of Rain Gauge, Radar, and Satellite-Based Precipitation Estimates with Emphasis on Hydrologic Forecasting. J. Hydrometeorol. 2005, 6, 497–517. [Google Scholar] [CrossRef]
- Nguyen, P.; Shearer, E.J.; Tran, H.; Ombadi, M.; Hayatbini, N.; Palacios, T.; Huynh, P.; Braithwaite, D.; Updegraff, G.; Hsu, K.; et al. The CHRS Data Portal, an Easily Accessible Public Repository for PERSIANN Global Satellite Precipitation Data. Sci. Data 2019, 6, 180296. [Google Scholar] [CrossRef] [PubMed]
- Hong, Y.; Hsu, K.-L.; Sorooshian, S.; Gao, X. Precipitation Estimation from Remotely Sensed Imagery Using an Artificial Neural Network Cloud Classification System. J. Appl. Meteorol. Climatol. 2004, 43, 1834–1853. [Google Scholar] [CrossRef]
- Nguyen, P.; Shearer, E.J.; Ombadi, M.; Gorooh, V.A.; Hsu, K.; Sorooshian, S.; Logan, W.S.; Ralph, M. PERSIANN Dynamic Infrared–Rain Rate Model (PDIR) for High-Resolution, Real-Time Satellite Precipitation Estimation. Bull. Am. Meteorol. Soc. 2020, 101, E286–E302. [Google Scholar] [CrossRef]
- Benesty, J.; Chen, J.; Huang, Y.; Cohen, I. Pearson Correlation Coefficient. In Noise Reduction in Speech Processing; Cohen, I., Huang, Y., Chen, J., Benesty, J., Eds.; Springer Topics in Signal Processing; Springer: Berlin/Heidelberg, Germany, 2009; pp. 1–4. ISBN 978-3-642-00296-0. [Google Scholar]
- Heidke, P. Berechnung Des Erfolges Und Der Güte Der Windstärkevorhersagen Im Sturmwarnungsdienst. Geogr. Ann. 1926, 8, 301–349. [Google Scholar] [CrossRef]
- Derin, Y.; Kirstetter, P.-E.; Gourley, J.J. Evaluation of IMERG Satellite Precipitation over the Land–Coast–Ocean Continuum. Part I: Detection. J. Hydrometeorol. 2021, 22, 2843–2859. [Google Scholar] [CrossRef]
- Derin, Y.; Kirstetter, P.-E.; Brauer, N.; Gourley, J.J.; Wang, J. Evaluation of IMERG Satellite Precipitation over the Land–Coast–Ocean Continuum. Part II: Quantification. J. Hydrometeorol. 2022, 23, 1297–1314. [Google Scholar] [CrossRef]
- Faiz, M.A.; Liu, D.; Fu, Q.; Wrzesiński, D.; Baig, F.; Nabi, G.; Khan, M.I.; Li, T.; Cui, S. Extreme Precipitation and Drought Monitoring in Northeastern China Using General Circulation Models and Pan Evaporation-Based Drought Indices. Clim. Res. 2018, 74, 231–250. [Google Scholar] [CrossRef]
- Sun, Y.; Wendi, D.; Kim, D.E.; Liong, S.-Y. Deriving Intensity–Duration–Frequency (IDF) Curves Using Downscaled in Situ Rainfall Assimilated with Remote Sensing Data. Geosci. Lett. 2019, 6, 17. [Google Scholar] [CrossRef]
- Kyaw, A.K.; Shahid, S.; Wang, X. Remote Sensing for Development of Rainfall Intensity–Duration–Frequency Curves at Ungauged Locations of Yangon, Myanmar. Water 2022, 14, 1699. [Google Scholar] [CrossRef]
- Ombadi, M.; Nguyen, P.; Sorooshian, S.; Hsu, K. Developing Intensity-Duration-Frequency (IDF) Curves From Satellite-Based Precipitation: Methodology and Evaluation. Water Resour. Res. 2018, 54, 7752–7766. [Google Scholar] [CrossRef]
- Chen, H.; Sun, L.; Cifelli, R.; Xie, P. Deep Learning for Bias Correction of Satellite Retrievals of Orographic Precipitation. IEEE Trans. Geosci. Remote Sens. 2021, 60, 4104611. [Google Scholar] [CrossRef]
- Xu, J.; Ma, Z.; Yan, S.; Peng, J. Do ERA5 and ERA5-Land Precipitation Estimates Outperform Satellite-Based Precipitation Products? A Comprehensive Comparison between State-of-the-Art Model-Based and Satellite-Based Precipitation Products over Mainland China. J. Hydrol. 2022, 605, 127353. [Google Scholar] [CrossRef]
Disclaimer/Publisher’s Note: The statements, opinions and data contained in all publications are solely those of the individual author(s) and contributor(s) and not of MDPI and/or the editor(s). MDPI and/or the editor(s) disclaim responsibility for any injury to people or property resulting from any ideas, methods, instructions or products referred to in the content. |
© 2023 by the authors. Licensee MDPI, Basel, Switzerland. This article is an open access article distributed under the terms and conditions of the Creative Commons Attribution (CC BY) license (https://creativecommons.org/licenses/by/4.0/).