Article

Comparison of Cloud Properties between SGLI Aboard GCOM-C Satellite and MODIS Aboard Terra Satellite

Center for Atmospheric and Oceanic Studies, Graduate School of Science, Tohoku University, Sendai City 980-8578, Japan
*
Author to whom correspondence should be addressed.
Remote Sens. 2023, 15(4), 1075; https://doi.org/10.3390/rs15041075
Submission received: 14 December 2022 / Revised: 3 February 2023 / Accepted: 14 February 2023 / Published: 16 February 2023
(This article belongs to the Section Atmospheric Remote Sensing)

Abstract

:
This study presents a comprehensive comparison of Level 2.0 cloud properties between a Second-generation Global Imager (SGLI) aboard the GCOM-C satellite and a Moderate Resolution Imaging Spectroradiometer (MODIS) aboard the Terra satellite, to better understand the qualities of cloud properties obtained from SGLI/GCOM-C launched on 23 December 2017. The cloud pixels identified as water phase by both satellite sensors are highly consistent to each other by more than 90%, although the consistency is only ~60% for ice phase cloud pixels. A comparison of cloud properties—cloud optical thickness (COT) and cloud particle effective radius (CER)—between these two satellite sensors reveals that water and ice cloud properties can have different degrees of agreement depending on underlying surface. The relative difference (RD) values of 22% (18%) and 37% (24%) for water cloud COT (CER) comparison over ocean and land surfaces and respective values of 35% (42%) and 35% (62%) for comparisons of ice cloud properties, and also other comparison metrics, suggest better agreements for water cloud properties than for ice cloud properties, and for ocean surface than for land surface. Though cloud properties differences between MODIS and SGLI can arise from inherent features of cloud retrieval algorithms, such as differences in ancillary data, surface reflectance, cloud droplet size distribution function, model for ice particle habit, etc., this study further identifies the important roles of cloud thickness and Sun and satellite positions for differences in cloud properties between SGLI and MODIS: the differences in cloud properties are found to increase for thinner clouds, higher solar zenith angle, and higher differences in viewing zenith and azimuth angles between these satellite sensors, and such differences are more distinct for water cloud properties than for ice cloud properties.

1. Introduction

Clouds are known to have profound impacts on the atmospheric heat budget, Earth’s climate system, and the hydrological cycle [1,2]. Clouds have very strong spatial and temporal variations [3], and they have complex interactions with aerosols and meteorological factors [2,4]. Therefore, clouds are recognized to have large uncertainties in the studies of climate systems and water and heat budgets of the Earth [5,6,7]. Given their importance, they have been studied from different perspectives and using different methods, including remote sensing from space. A Television InfraRed Observational Satellite (TIROS), launched on 1 April 1960, is the first satellite to successfully capture the cloud picture from space. Since then, space-based cloud remote sensing technology has seen great advancement. Currently, clouds are observed from space by various active and passive sensors aboard various polar-orbiting and geostationary satellites [5,6,7], and data from them are being widely used for diverse purposes [8,9,10]. Along with such wide and diverse applications, the quality assessment of space-based cloud products has become an important aspect of research in the cloud remote sensing field. It is because the same satellite sensor monitors the whole Earth or a large part of it for a long time, and physical quantities from such satellite observations are generally derived by relying on certain physical models with certain assumptions. Therefore, cross-checking of such products using data from independent sources is vital to increase confidence in applications of these products in scientific research, policy-making, and so on [11]. Additionally, such quality-assessment further helps to figure out the shortcomings of present technology and then to develop future strategies to overcome them.
Among a number of Earth-observing satellites, the Global Change Observation Mission-Climate (GCOM-C) satellite (“Shikisai” in Japanese) is the one belonging to the Japan Aerospace Exploration Agency (JAXA). It was launched on 23 December 2017, to better understand global climate change by observing the surface and atmosphere of the Earth. Onboard is the Second-Generation Global Imager (SGLI) to collect data related to clouds, aerosols, ocean color, vegetation, snow, and ice. Among various geophysical products obtained from SGLI observations, this study focuses on understanding the qualities of cloud products. As the operation only started relatively recently, our knowledge regarding the qualities of SGLI cloud products is limited. Damiani et al. [12] compared cloud optical thickness (COT) values obtained from observations at the surface using a sky radiometer and a pyranometer, with those obtained from SGLI observations for an intensive campaign period of 16 days over Chiba, Japan. Their study showed reasonably good agreement between SGLI and surface observation-based values. Khatri et al. [11] used cloud optical properties—COT and cloud particle effective radius (CER)—retrieved from sky radiometers [13,14] at multiple SKYNET [15,16,17] sites to understand the qualities of SGLI cloud properties for both water and ice clouds. They found good agreement between SGLI- and sky radiometer-observed COTs, although the agreement was better for water clouds than for ice clouds, while the SGLI-observed CER exhibited poorer agreement than the COT. They further suggested that solar and satellite viewing angles could have important effects on the comparison of cloud properties obtained from space and surface observations.
Ground-based observations are important to validate cloud properties obtained from space observations [14,18,19], including observations from SGLI aboard GCOM-C [11,12]; however, such ground-based observations are limited in temporal and spatial coverages. Therefore, the abovementioned ground-based observations are not enough to understand the qualities of SGLI-observed cloud properties. Along with ground-based observation data, data from other independent observations need to be used. This demands the need for comparing SGLI cloud properties with other standard cloud properties, such as those obtained from a Moderate Resolution Imaging Spectroradiometer (MODIS). It is worth mentioning that MODIS has a long history of observation, and MODIS cloud products have been updated a number of times, helping to better understand the qualities of SGLI cloud products by comparing them with MODIS cloud products. A literature review shows that Nakajima et al. [20] compared SGLI cloud properties with MODIS cloud properties. However, their comparisons were limited to only coarse-grid cloud properties of 1° × 1° spatial resolution. Considering that cloud properties of fine spatial resolution, such as Level 2.0 cloud products, have broader scientific applications than coarse-grid cloud properties, this study is designed to understand the qualities of Level 2.0 SGLI cloud properties of nearly 1 km × 1 km spatial resolution. For this purpose, we compared Level 2.0 SGLI cloud properties with Level 2.0 MODIS cloud properties of nearly the same spatial resolution.
This paper is organized as follow. Section 2 describes the data and study method. Section 3 and Section 4 describe the results and discussion. Finally, the major findings are summarized in Section 5.

2. Data and Study Method

2.1. Data

This study uses cloud products obtained from observations made from space by MODIS and SGLI sensors. A detail of these cloud products is given below by summarizing their important features in Table 1.
MODIS aboard Terra and Aqua satellites has been one of the most successful sensors for monitoring the surface and atmosphere of the Earth for more than two decades. Terra (Aqua) is timed to cross the equator from north to south at approximately 10:30 AM (1:30 PM) local time. MODIS has 36 spectral bands ranging from 0.4 to 14.2 μm to observe the changes in the Earth’s atmosphere and the processes occurring in ocean and land surfaces. The operational algorithms and data products for MODIS observations are being continuously updated, and the current product is collection 6.1 [5]. This study used Level 2.0 (collection 6.1) cloud products with a spatial resolution of 1 km × 1 km (at nadir). More specifically, we used data for COT, CER, cloud phase, solar zenith angle (SZA), solar azimuth angle (SAZ), sensor zenith angle (VZA), sensor azimuth angle (VAZ), and land/sea mask in this study. In the MODIS cloud retrieval algorithm, COT and CER are derived from the combination of observed and forward model-generated reflectance data of two different wavelengths having different amounts of cloud particle absorption [21]. In brief, cloud top reflectance are calculated for six wavelengths—non-absorbing 0.66, 0.86, and 1.24 μm, which are mainly sensitive to COT, and absorbing 1.6, 2.1, and 3.7 μm, which are sensitive to CER—to generate a look up table (LUT) for any single pair for absorbing and non-absorbing wavelengths. The non-absorbing wavelengths of 0.66, 0.86, and 1.24 μm are chosen to retrieve properties for clouds lying over land, ocean, and ice surfaces, respectively. Similarly, the absorbing wavelengths of 1.6, 2.1, and 3.7 μm are chosen to retrieve three different CERs as the effective vertical weighting functions of these wavelengths are different [22]. In other words, in-cloud penetration depth increases with the decrease of wavelength. Therefore, 3.7 μm provides information for upper cloud layers; whereas, other wavelengths provide information for relatively deeper cloud layers. By assuming gamma particle size distribution, Mie calculation is used to characterize single-scattering properties for water cloud droplets; whereas the ice crystal habit of severely roughened aggregated columns [23] is used to generate such data for ice cloud particles. Though COT and CER data are available for different pairs of absorbing and non-absorbing wavelengths, this study uses standard products, which are obtained by combining an absorbing 2.1 μm wavelength with non-absorbing 0.66 μm (land) and 0.86 μm (ocean) wavelengths. Similarly, cloud phase (water, ice, mixed, undetermined, cloud free) data used in this study are derived using three wavelength pairs of the infrared region, which are 7.3 and 11 μm, 8.5 and 11 μm, and 11 and 12 μm [24]. The remaining data—SZA, SAZ, VZA, VAZ, and land/sea mask—are generated by combining spacecraft attitude and orbit, the instrument telemetry, and digital model (https://modis.gsfc.nasa.gov/data/dataprod/mod03.php, accessed on 15 February 2023). As SGLI only crosses the equator in the morning at around 10:30 AM, this study uses data collected by the MODIS sensor aboard the Terra satellite.
SGLI aboard GCOM-C has 16 channels covering the spectrum from 0.38 to 12.0 μm. Similar to the MODIS cloud retrieval algorithm, the SGLI cloud retrieval algorithm retrieves COT and CER by using a combination of absorbing and non-absorbing wavelengths; but, the used wavelengths are different. Though SGLI has non-absorbing channels of 0.67, 0.87, and 1.05 μm wavelengths and absorbing channels of 1.63 and 2.21 μm wavelengths, currently available cloud products are generated by using a combination of non-absorbing 1.05 and absorbing 2.21 μm wavelengths in the framework of the Comprehensive Analysis Program for Cloud Optical Measurement (CAPCOM) package [20]. Though CAPCOM also relies on the principle of using LUT of reflectance data for absorbing and non-absorbing wavelengths for priorly defined COT and CER values and solar and satellite geometries [21], some major differences remain. First, unlike gamma size distributions in the MODIS cloud retrieval algorithm, cloud particles are characterized by log-normal size distribution in CAPCOM. Second, non-spherical Voronoi particles [25] are considered to generate single-scattering properties for ice particles in CAPCOM, though the MODIS cloud retrieval algorithm uses severely roughened aggregated columns. Except for these, the sources of meteorological and surface reflectance data and radiative transfer models used to generate LUT differ between the CAPCOM and MODIS cloud retrieval algorithm [5,20]. Additionally, there appears to be a major difference between cloud phase detection methods of SGLI and MODIS. Unlike the MODIS algorithm, the SGLI algorithm uses a combination of only 10.8 and 12.0 μm to detect cloud phase, because SGLI has fewer channels than MODIS in the infrared region [20]. Along with cloud properties (COT and CER) and cloud phase data, geolocation field data (SZA, SAZ, VZA, VAZ) are also available for SGLI observations, which were also used in this study.

2.2. Study Method

Level-2 SGLI cloud products are available at approximately 1 km × 1 km spatial resolution with sinusoidal projection. Each tile has an area of approximately 1200 km × 1200 km. This study selects six tiles (T0527, T0528, T0529, T0627, T0628, and T0629), which cover regions bounded by 20°–40°N and 106°–131°E, for an observation period from 1 June to 31 August 2020. MODIS Level-2 cloud products of same region and period were extracted to compare with SGLI cloud products. Data from both MODIS and SGLI cloud products were valid for the comparison if the pixel centers of each were closer to each other by less than 1 km and the observation times of them were within less than 5 min time difference. Before comparing the cloud properties (COT and CER) between them, we first studied how well cloud phases detected by them were consistent with each other. For this purpose, phases of MODIS cloud pixels for SGLI-detected water and ice cloud pixels were detected and counted to derive distributions of MODIS cloud phases for SGLI-detected water and ice cloud phases. While comparing the cloud properties, analyses were separately performed for land and ocean surfaces by detecting the surface type by using land/sea mask data of MODIS. We quantified the agreement levels between MODIS and SGLI cloud properties by using the comparison metrics given below,
MBE = 1 n i = 1 n ( M i S i ) ,
RMSE = i = 1 n ( M i S i ) 2 n ,
r = n ( i = 1 n M i S i ) i = 1 n M i i = 1 n S i [ n i n M i 2 ( i = 1 n M i ) 2 ] [ n i n S i 2 ( i = 1 n S i ) 2 ] ,
RD = 1 n i = 1 n | S i M i M i |
where M and S are cloud properties (COT or CER) for MODIS and SGLI observations, respectively, and n the total sample count. MBE, RMSE, r, and RD represent mean bias error, root mean square error, correlation coefficient, and relative difference, respectively. In order to understand the factors for differences in cloud properties between MODIS and SGLI, we performed analyses by grouping data into different bins of COT and SZA, as well as the different groups mentioned below.
  • Group I: Both MODIS and SGLI sensors exist in forward scattering direction.
  • Group II: Both MODIS and SGLI sensors exist in backward scattering direction.
  • Group III: MODIS (SGLI) exists in forward (backward) scattering direction.
  • Group IV: MODIS (SGLI) exists in backward (forward) scattering direction.
The forward or backward scattering direction is determined based on the relative azimuth angle (RAZ) of the satellite sensor with respect to the azimuth angle of the Sun. RAZ for each satellite sensor is calculated as
RAZ = | VAZ SAZ |
The satellite sensor is considered to exist in the forward scattering direction if RAZ > 90°, and vice versa.

3. Results

3.1. Comparison of Cloud Phase

Table 2 summarizes distributions (in percentage) of MODIS-detected cloud phases for total counts (100%) of SGLI-detected water and ice cloud phases. Table 2 reveals that water cloud pixels detected by SGLI and MODIS are consistent with each other by more than 90%. On the other hand, the consistency percentage for ice cloud pixels is only ~60%. Nearly ~20% of cloud pixels detected as ice phase by SGLI are detected as water phase in MODIS observations. At the same time, undetermined pixels also account for ~20% in MODIS observations for cloud pixels detected as ice phases in SGLI observations. Overall, Table 2 suggests a considerable mismatch in ice phase detection between MODIS and SGLI. It is important to note that SGLI uses a single pair of two wavelengths—10.8 and 12.0 μm—to discriminate cloud phase; whereas, MODIS uses three pairs of four infrared wavelengths (see Section 2.1) for this purpose. As shown by Baum et al. [26], the imaginary parts of the refractive indices for water and ice particles are nearly equal in the 8.5 to 10 μm wavelength range, but they are diverse between 10 and 13 μm wavelengths. This difference between 10 and 13 μm is the foundation for using infrared wavelengths in cloud phase detection in satellite remote sensing. MODIS having more infrared channels than SGLI may effectively capture the information contained within 10 to 13 μm to effectively distinguish the absorption capacities for water and ice cloud particles, and thereby the cloud phase. It is worth mentioning that alternative procedures are being developed to detect cloud phase for SGLI observations. For example, Nagao and Suzuki [27] developed algorithms for simultaneous retrievals of COT, CER, and cloud thermodynamic phase to estimate the fractional probability of the cloud phase as an alternative to discrete discrimination into liquid and ice typical of operational cloud retrievals.

3.2. Comparison of Cloud Properties

3.2.1. Water Clouds

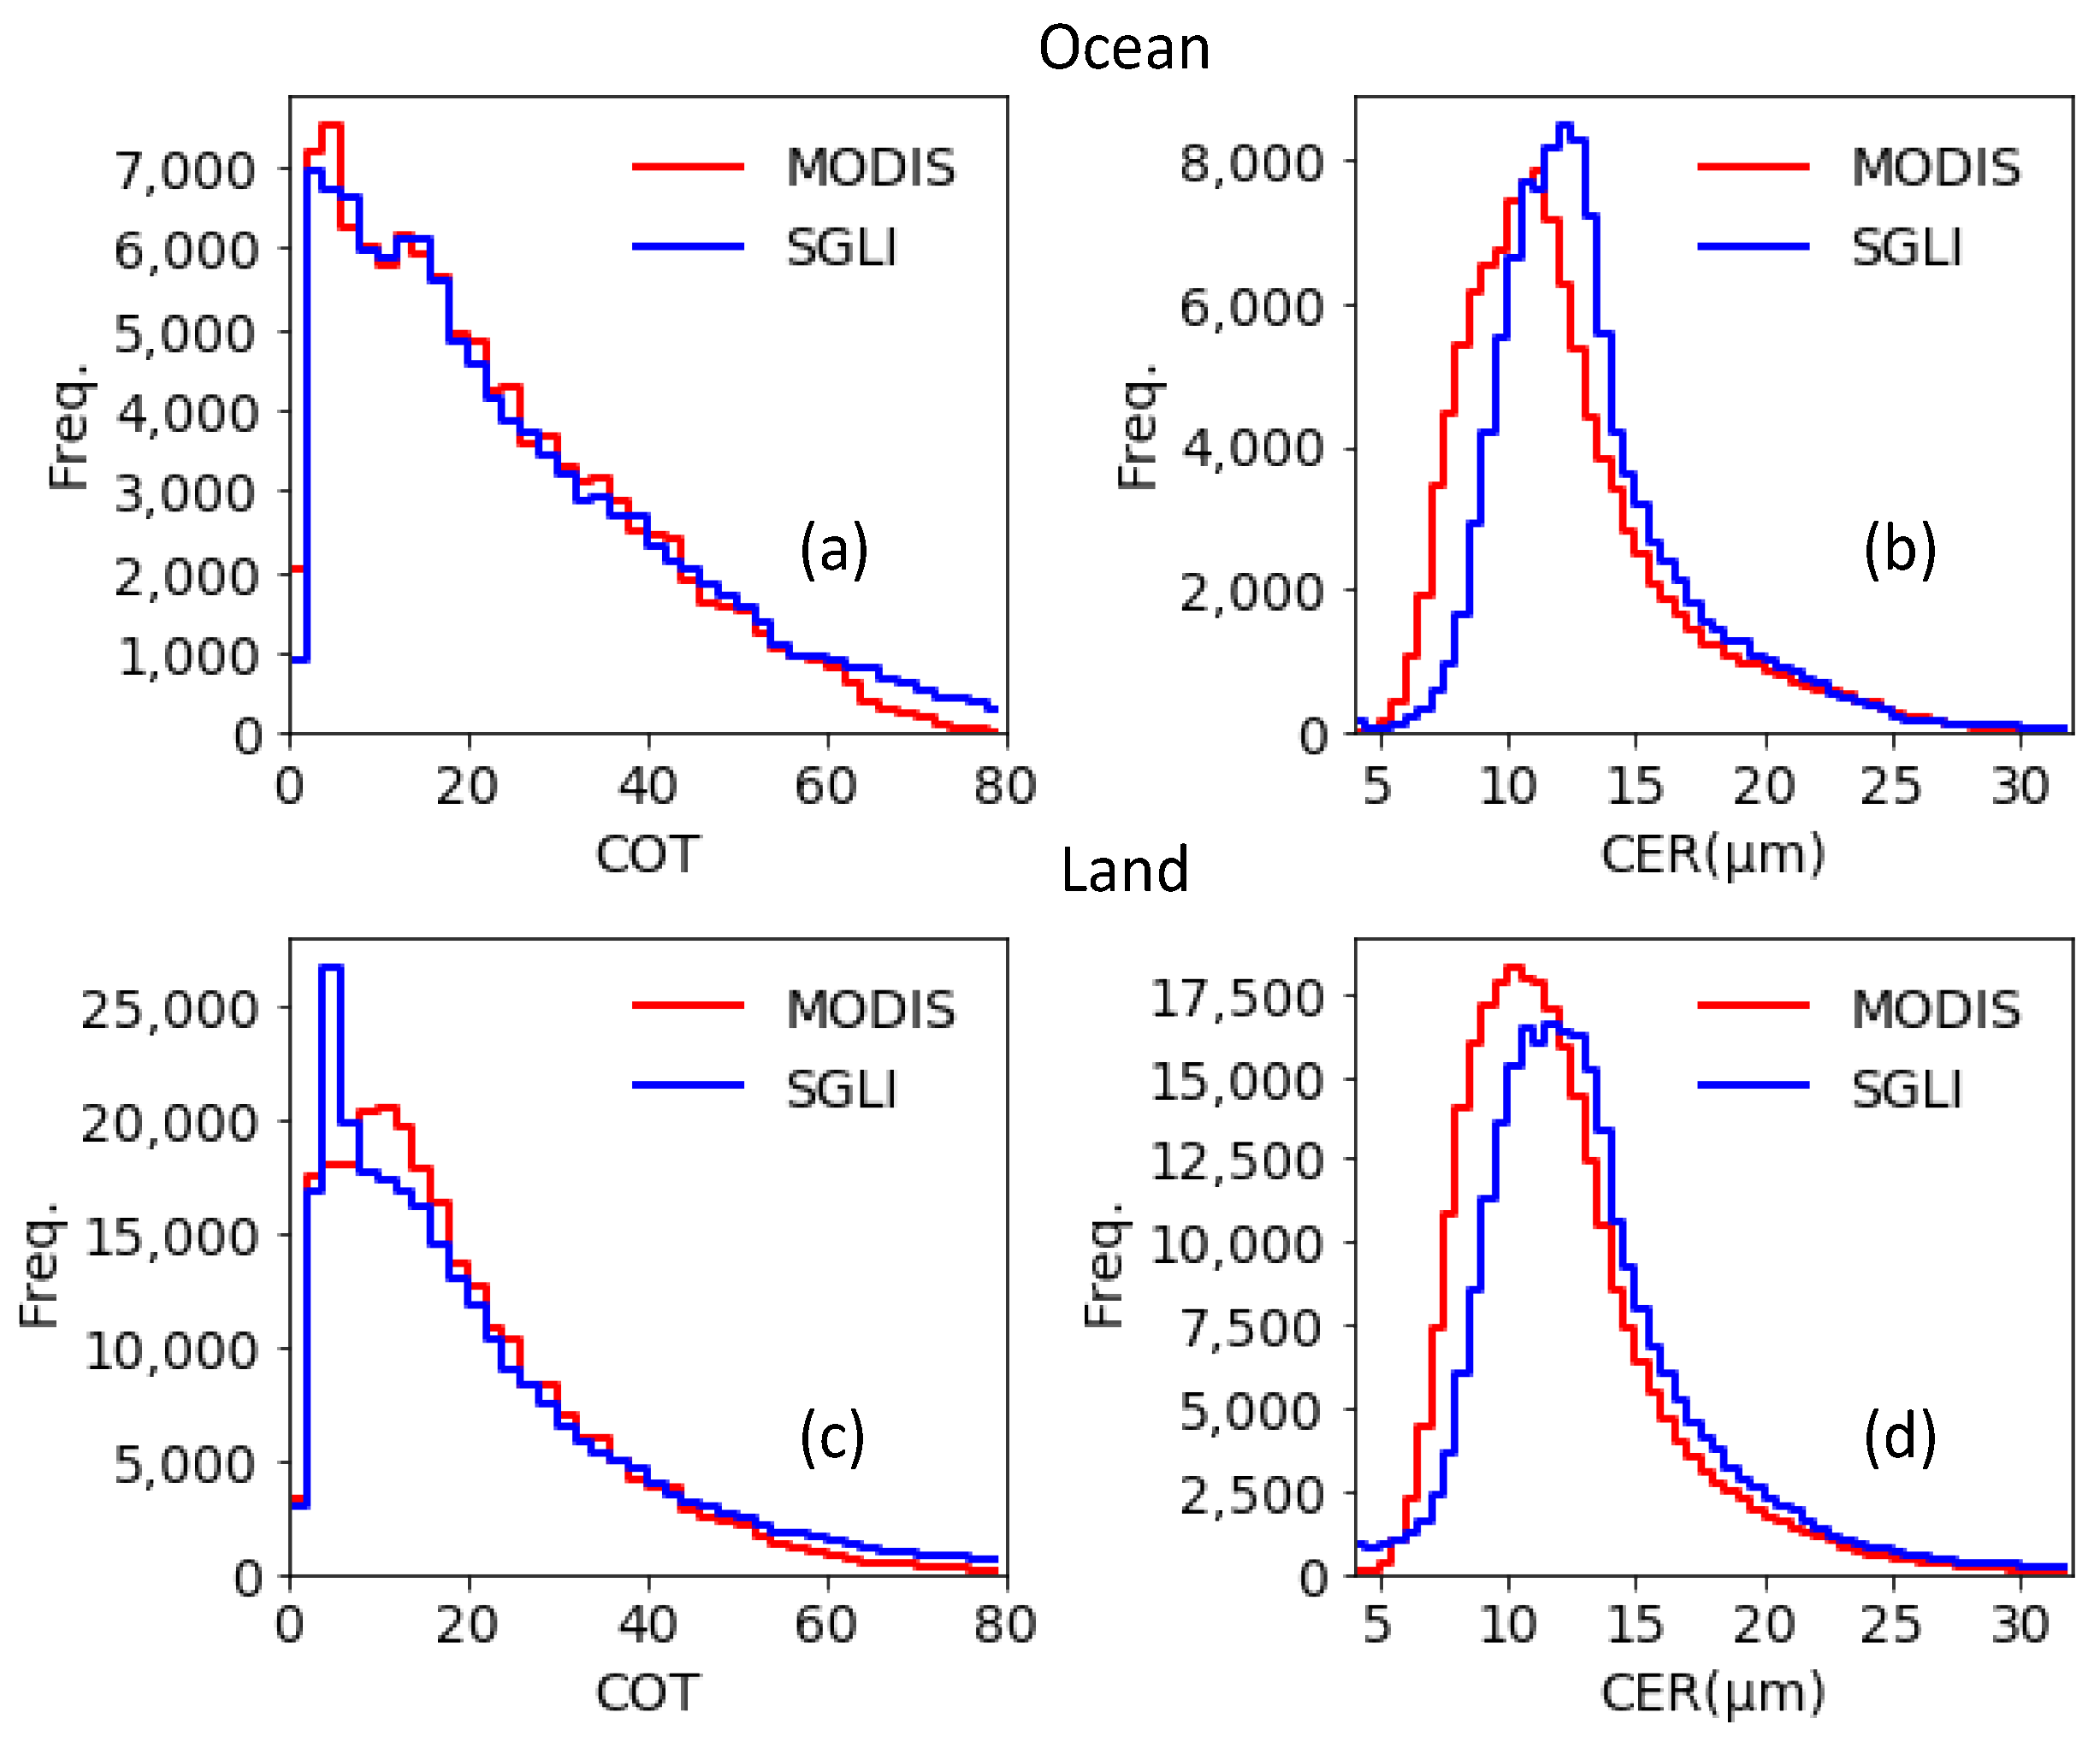
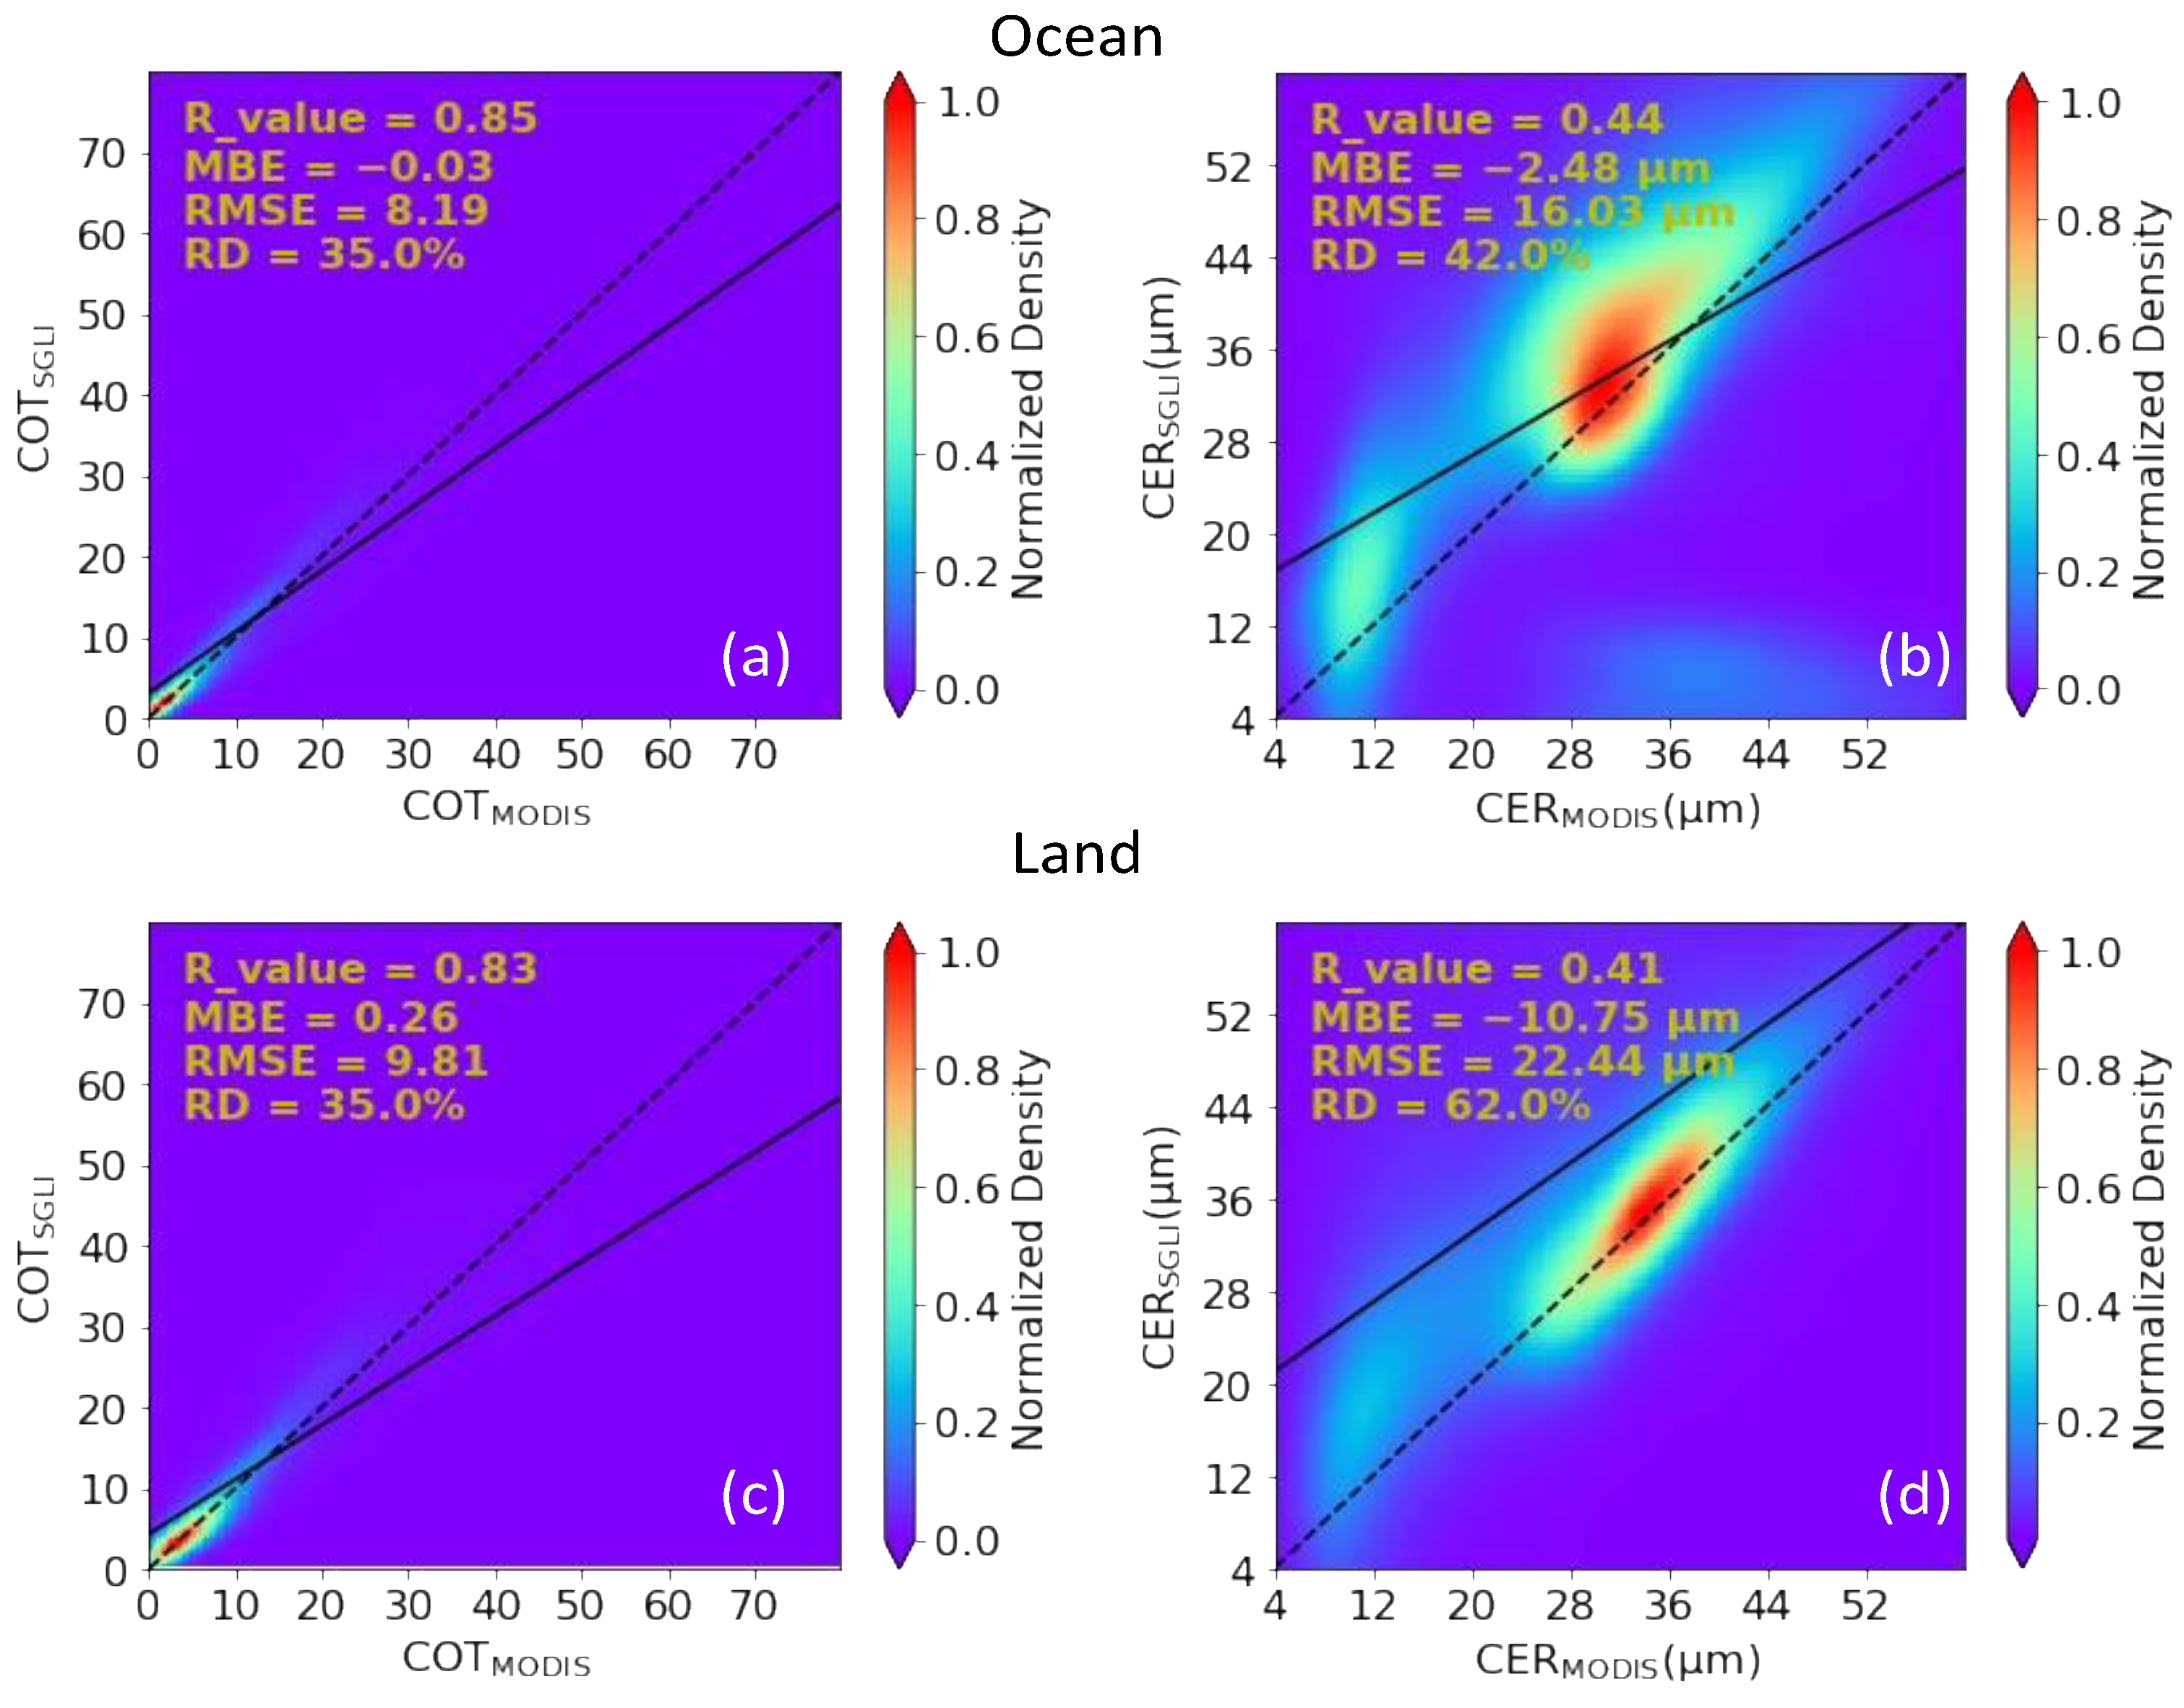
Figure 1 shows the comparisons of COT (left) and CER (right) between SGLI and MODIS for pixels detected as water clouds by both satellite sensors for ocean surface (upper) and land surface (lower). Different comparison metrics are shown in each plot of Figure 1 to understand the degree of agreement between MODIS and SGLI values. The comparison metrics, including RD values, suggest that cloud properties between MODIS and SGLI can have different levels of agreement over land and ocean surfaces. In general, the agreement is better for ocean surface than for land surface for both COT and CER values. As surface reflectance is differently characterized in cloud retrieval algorithms of MODIS and SGLI [5,20], such differences in surface reflectance can play an important role in increasing the difference for land surface than for ocean surface. This is because the reflection of land is more complex than that of ocean due to the variation in surface type over land [28]. For both land and ocean surfaces, the correlation is stronger for COT comparison than for CER comparison. This is because of the fact that CER retrieval is generally more complicated than COT retrieval. For example, CER retrieval strongly depends on the choice of absorbing wavelength, refractive index value, etc., though such factors have mere influence on COT retrieval. The MBE values are relatively small in each plot of Figure 1, and they are negative in magnitude. This suggests that, on average, SGLI cloud properties can be higher than MODIS cloud properties. To obtain better insight into the comparison results shown in Figure 1, frequency distributions for COT and CER bins of 2 and 0.5 μm intervals, respectively, are shown in Figure 2. In Figure 2, the left and right panels show frequency distributions for COT and CER, respectively. Similarly, the upper and lower panels show the distributions for ocean and land surfaces, respectively. Figure 2 suggests that the frequency distributions of COT for MODIS and SGLI agree better for ocean surface than for land surface. This again emphasizes the better agreement of COT between MODIS and SGLI for ocean surface than for land surface. At the same time, those results suggest that the quality of cloud products over land surfaces can be improved by using high-quality information of surface reflectance data in cloud retrieval algorithms. For both ocean surface (Figure 2a) and land surface (Figure 2c), frequencies of very thick clouds (COT > 55) are more increased in SGLI observations than in MODIS observations. Such increased thicker clouds in SGLI observations could possibly contribute to the increase in negative MBE in COT comparison between MODIS and SGLI shown in Figure 1. Considering that optical sensors, such as MODIS and SGLI, may lose sensitivity to observe such very high COTs; for instance, if comparison metrics shown in Figure 1a,c are recalculated by excluding COTs larger than 55, R_value, MBE, RMSE, and RD for ocean (land) correspond to 0.95 (0.85), −1.16 (−0.54), 4.59 (6.76), and 22.0% (37.0%), respectively. These data suggest that excluding such high COTs can improve the comparison metrics by showing a relatively better agreement in COT comparisons between them. In contrast to the COT frequency distributions shown in Figure 2a,c, the CER frequency distributions shown in Figure 2b,d show distinct differences between MODIS and SGLI observations. Though CER distributions for both MODIS and SGLI observations generally follow a distribution close to gaussian distribution for both land and ocean surfaces, in general, CERs from SGLI are higher than those from MODIS. Clearly, the peak value of distribution falls at a larger CER in SGLI observations than in MODIS observations.

3.2.2. Ice Clouds

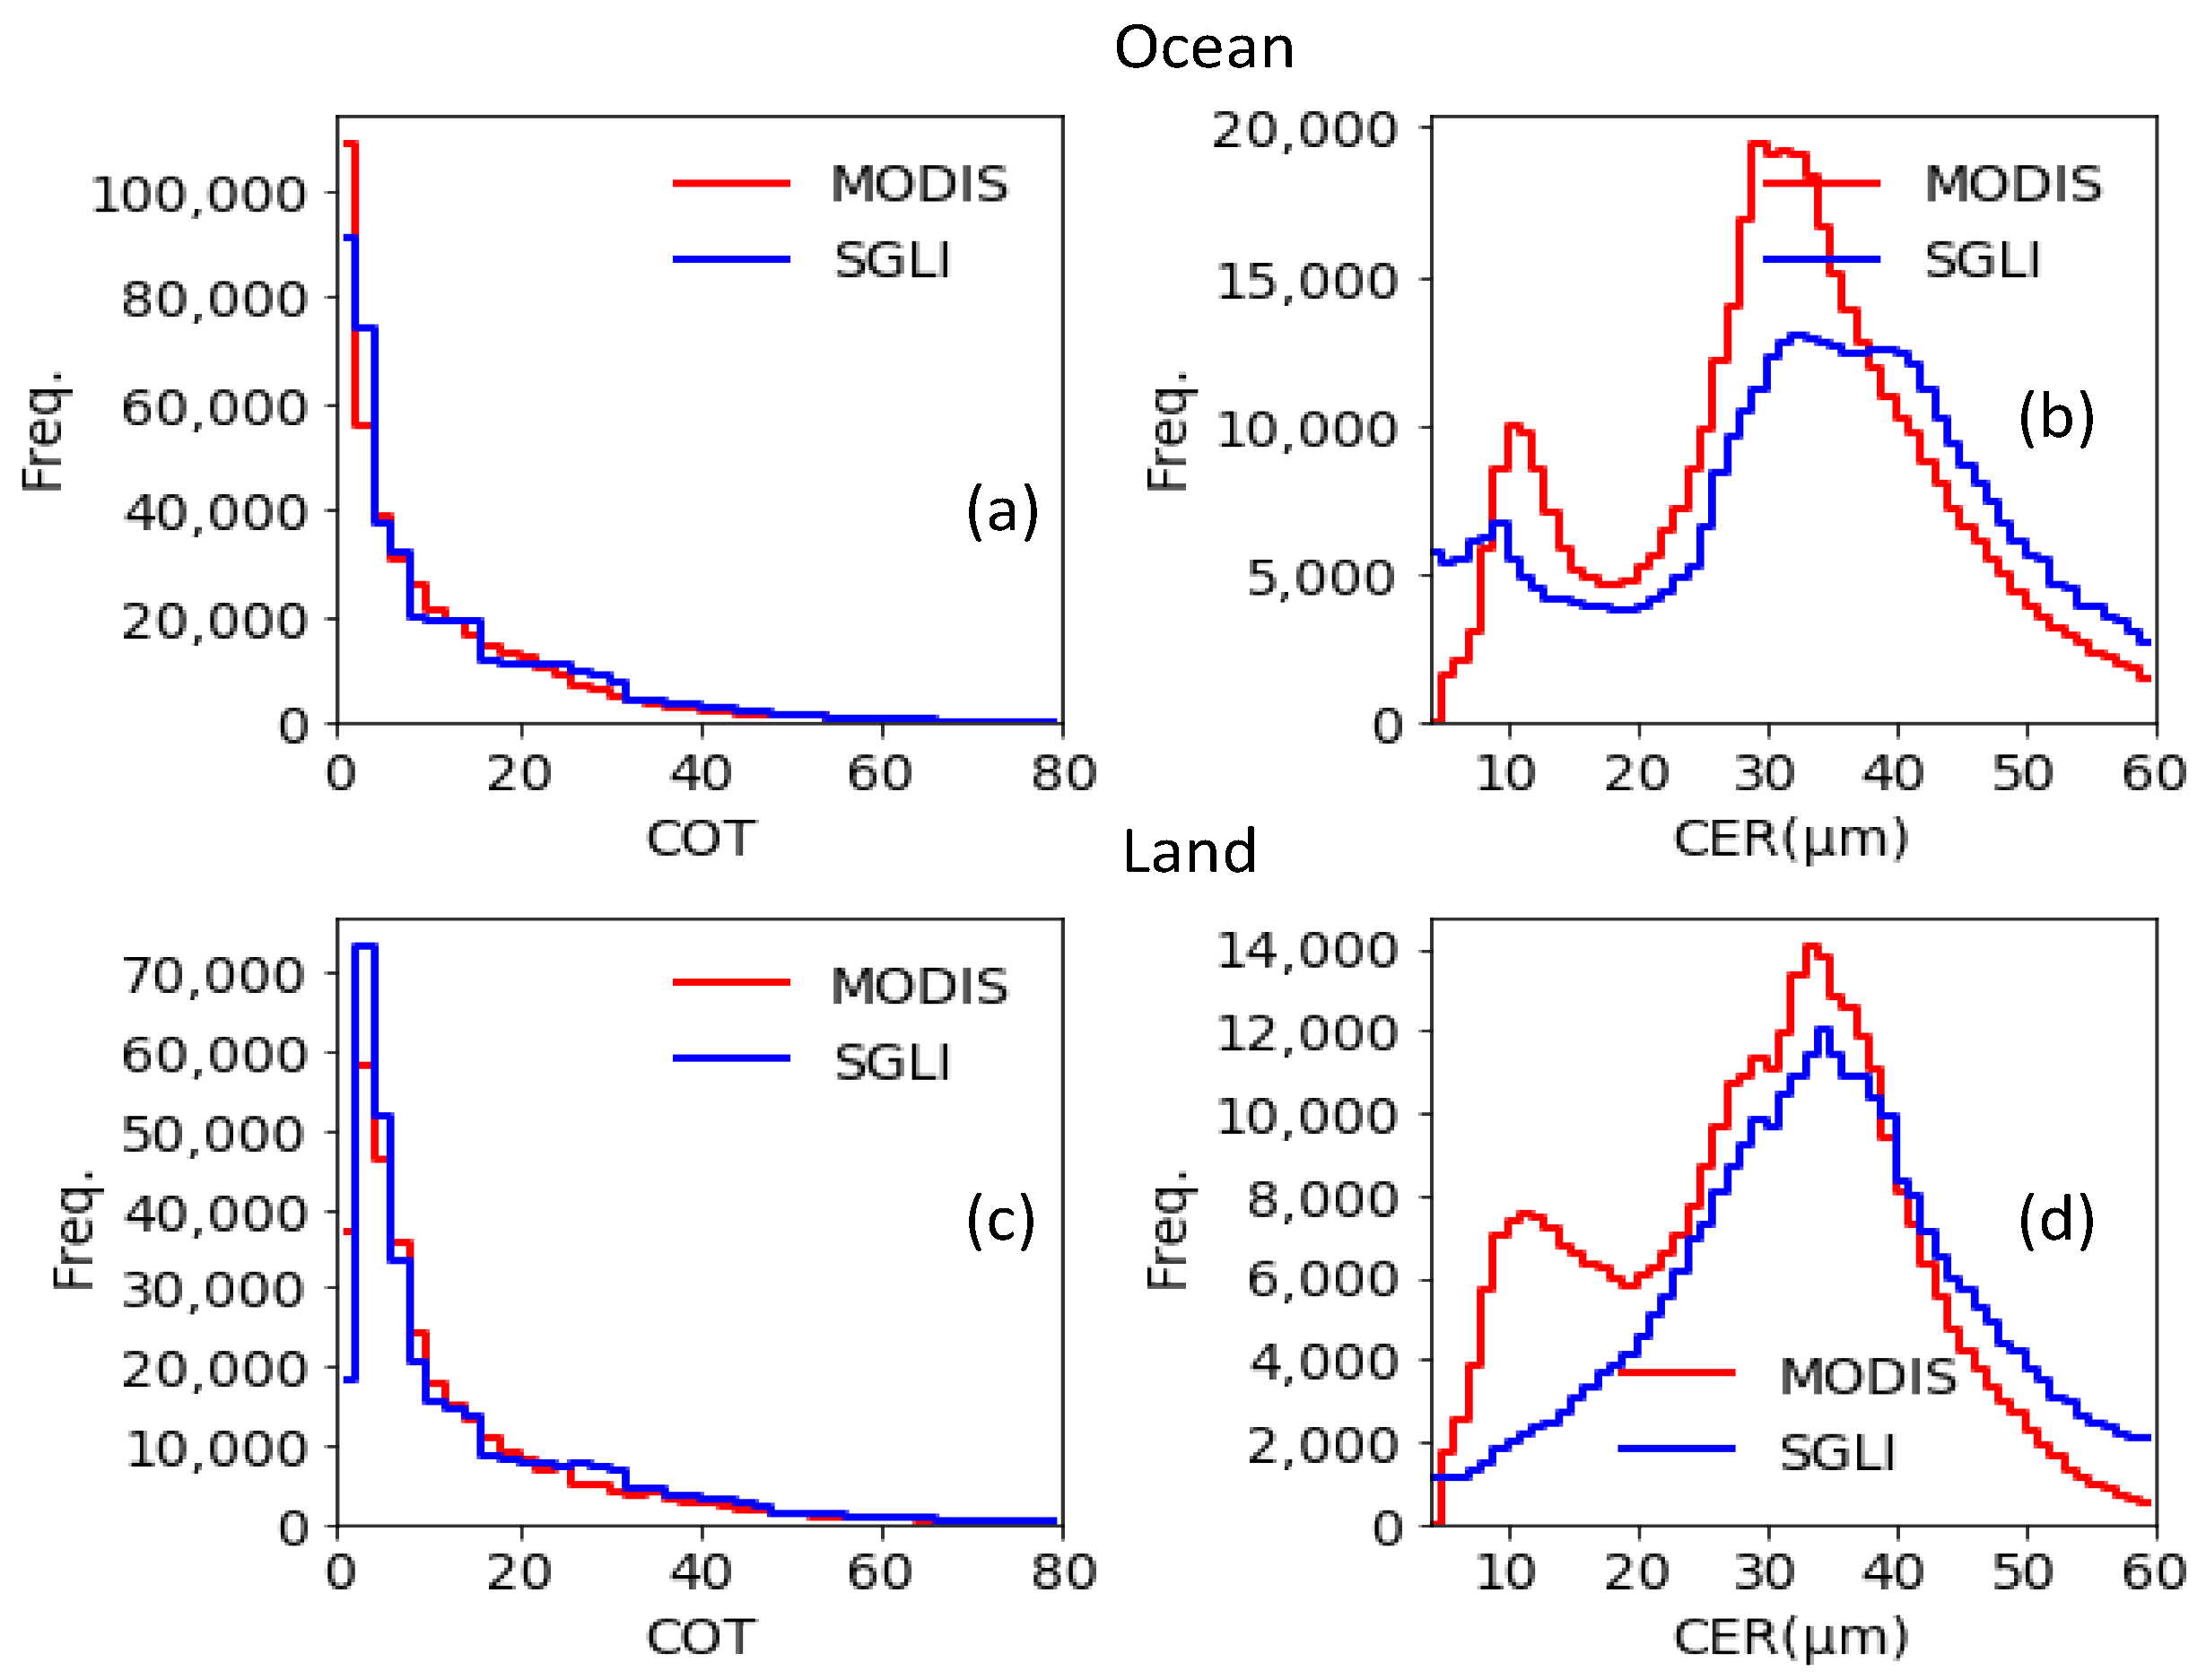
Figure 3 shows the comparisons of COT (left) and CER (right) between SGLI and MODIS for pixels detected as ice clouds by both satellite sensors for ocean surface (left) and land surface (right). Figure 3 suggests that COT and CER values obtained from MODIS and SGLI observations can agree better over the ocean surface than over the land surface. This result is consistent with the water cloud properties shown in Figure 1, showing the important effects of surface reflectance on the retrieved properties of ice clouds as well. With respect to the comparison metrics shown in Figure 1, Figure 3 suggests that cloud properties between MODIS and SGLI are less consistent with each other than water cloud properties. The poorer agreements for ice cloud properties can be noted for both land and ocean surfaces. It is because ice cloud retrievals can be more complex and uncertain than water cloud retrievals, which is primarily due to irregular shapes of ice cloud particles. As single-scattering properties (e.g., asymmetry parameter, single-scattering albedo, extinction efficiency) of ice particles can change with the change in ice particle habits [23], MODIS and SGLI can show poor agreements for comparisons of ice cloud properties between them. It is because different ice cloud habits are considered in the cloud retrieval algorithms of MODIS and SGLI (see Section 2.1). Additionally, one can note poorer agreements for CER comparisons than for COT comparisons in Figure 3. This is due to the fact that CER retrieval depends on factors more than COT retrieval, as mentioned in Section 3.1. The worst agreement can be seen in Figure 3d for CER comparisons of land surface, which shows an RD value as high as 62%. This indicates high uncertainties for the retrieved CERs of ice clouds over land surfaces. It is important to note that, in Figure 3b,d, ice cloud CERs have distinct distributions for MODIS CERs below and above 20 μm. Therefore, to better quantify CER agreements between MODIS and SGLI, we calculated comparison metrics similar to those shown in Figure 3 by splitting data pairs corresponding to MODIS CER ≤ 20 μm and MODIS CER > 20 μm. The comparison metrics are shown in Table 3. Table 3 suggests that MODIS and SGLI can have relatively better agreement for relatively larger CERs for both ocean and land surfaces. For example, one can note considerably low values of RD followed by MBE in comparison, corresponding to data pairs with MODIS CER > 20 μm in Table 3. Though RMSE can be large for data of larger values, Table 3 suggests smaller RMSE for data pairs with MODIS CER > 20 μm with respect to that for data pairs with MODIS CER ≤ 20 μm for land surface. This further emphasizes that MODIS and SGLI can have better agreement for relatively larger CERs for ice cloud observations. It is likely due to the fact that ice clouds with smaller CERs may result from cloud misclassification, as discussed below. Similar to Figure 2, Figure 4 shows the frequency distributions of COT (left) and CER (right) for ocean surface (upper) and land surface (lower) for ice clouds for COT and CER bins of 2 and 1 μm intervals, respectively. The frequency distributions for COT values of MODIS and SGLI are relatively closer to each other than those for water cloud COT frequency distributions shown in Figure 2. On the other hand, there exist considerable differences in ice cloud CER frequency distributions between MODIS and SGLI for both ocean and land surfaces, as shown in Figure 4b,d. The most important feature to be noted is that there appears to be bimodal distribution, with the small and large peaks appearing at ~12 μm and ~35 μm, respectively. This bimodal CER distribution can arise if ice and water mixed multilayered clouds are identified as ice clouds [29]. It is because water cloud droplets are less absorptive than ice cloud droplets at near-infrared wavelengths for a given size. As noted in Figure 3a,c, COTs are relatively small for pixels detected as ice clouds by MODIS and SGLI. Forward modeling indicates that information required to discriminate monolayer and multilayer clouds is limited when COT becomes less than 4 [30]. As a result, the detection of water and ice mixed multilayered clouds is a difficult task when clouds are relatively thin. This can result in a considerable amount of mixed phase clouds to be detected as ice phase clouds, adding uncertainties in retrieved ice cloud properties; more specifically, in retrieved CER values. Strict data screening criteria may eliminate such small peaks [29]. However, Figure 4b,d shows that CERs from SGLI can still become larger than those from MODIS, even without such small peaks. It is interesting to note that SGLI observations suggest a monomodal distribution over land surface in Figure 4d, which is different than the distribution for MODIS data. As the decoupling of cloud reflectance from undesirable radiation components from surfaces is one of the major tasks in the cloud remote sensing process [31], differently characterized surface reflectance over the land surface, along with different size distribution functions, single-scattering properties, ancillary data, and the radiative transfer model in ice cloud retrieval algorithms of MODIS and SGLI, could bring considerable difference to the estimated contribution of land surfaces for mixed phase clouds, which could have more complicated radiative transfer processes than water or ice clouds. Therefore, Figure 4d suggests that the ice cloud retrieval algorithm for SGLI may result in the CER of mixed phase clouds being comparable to values for ice clouds for land surfaces. By showing such features of retrieved CERs for ice clouds over land surfaces, this study underscores the necessity of more detailed investigations in future.

4. Discussions

A number of factors can be associated with the differences in cloud properties between MODIS and SGLI. Among them, some important factors are discussed here.

4.1. Cloud Optical Thickness

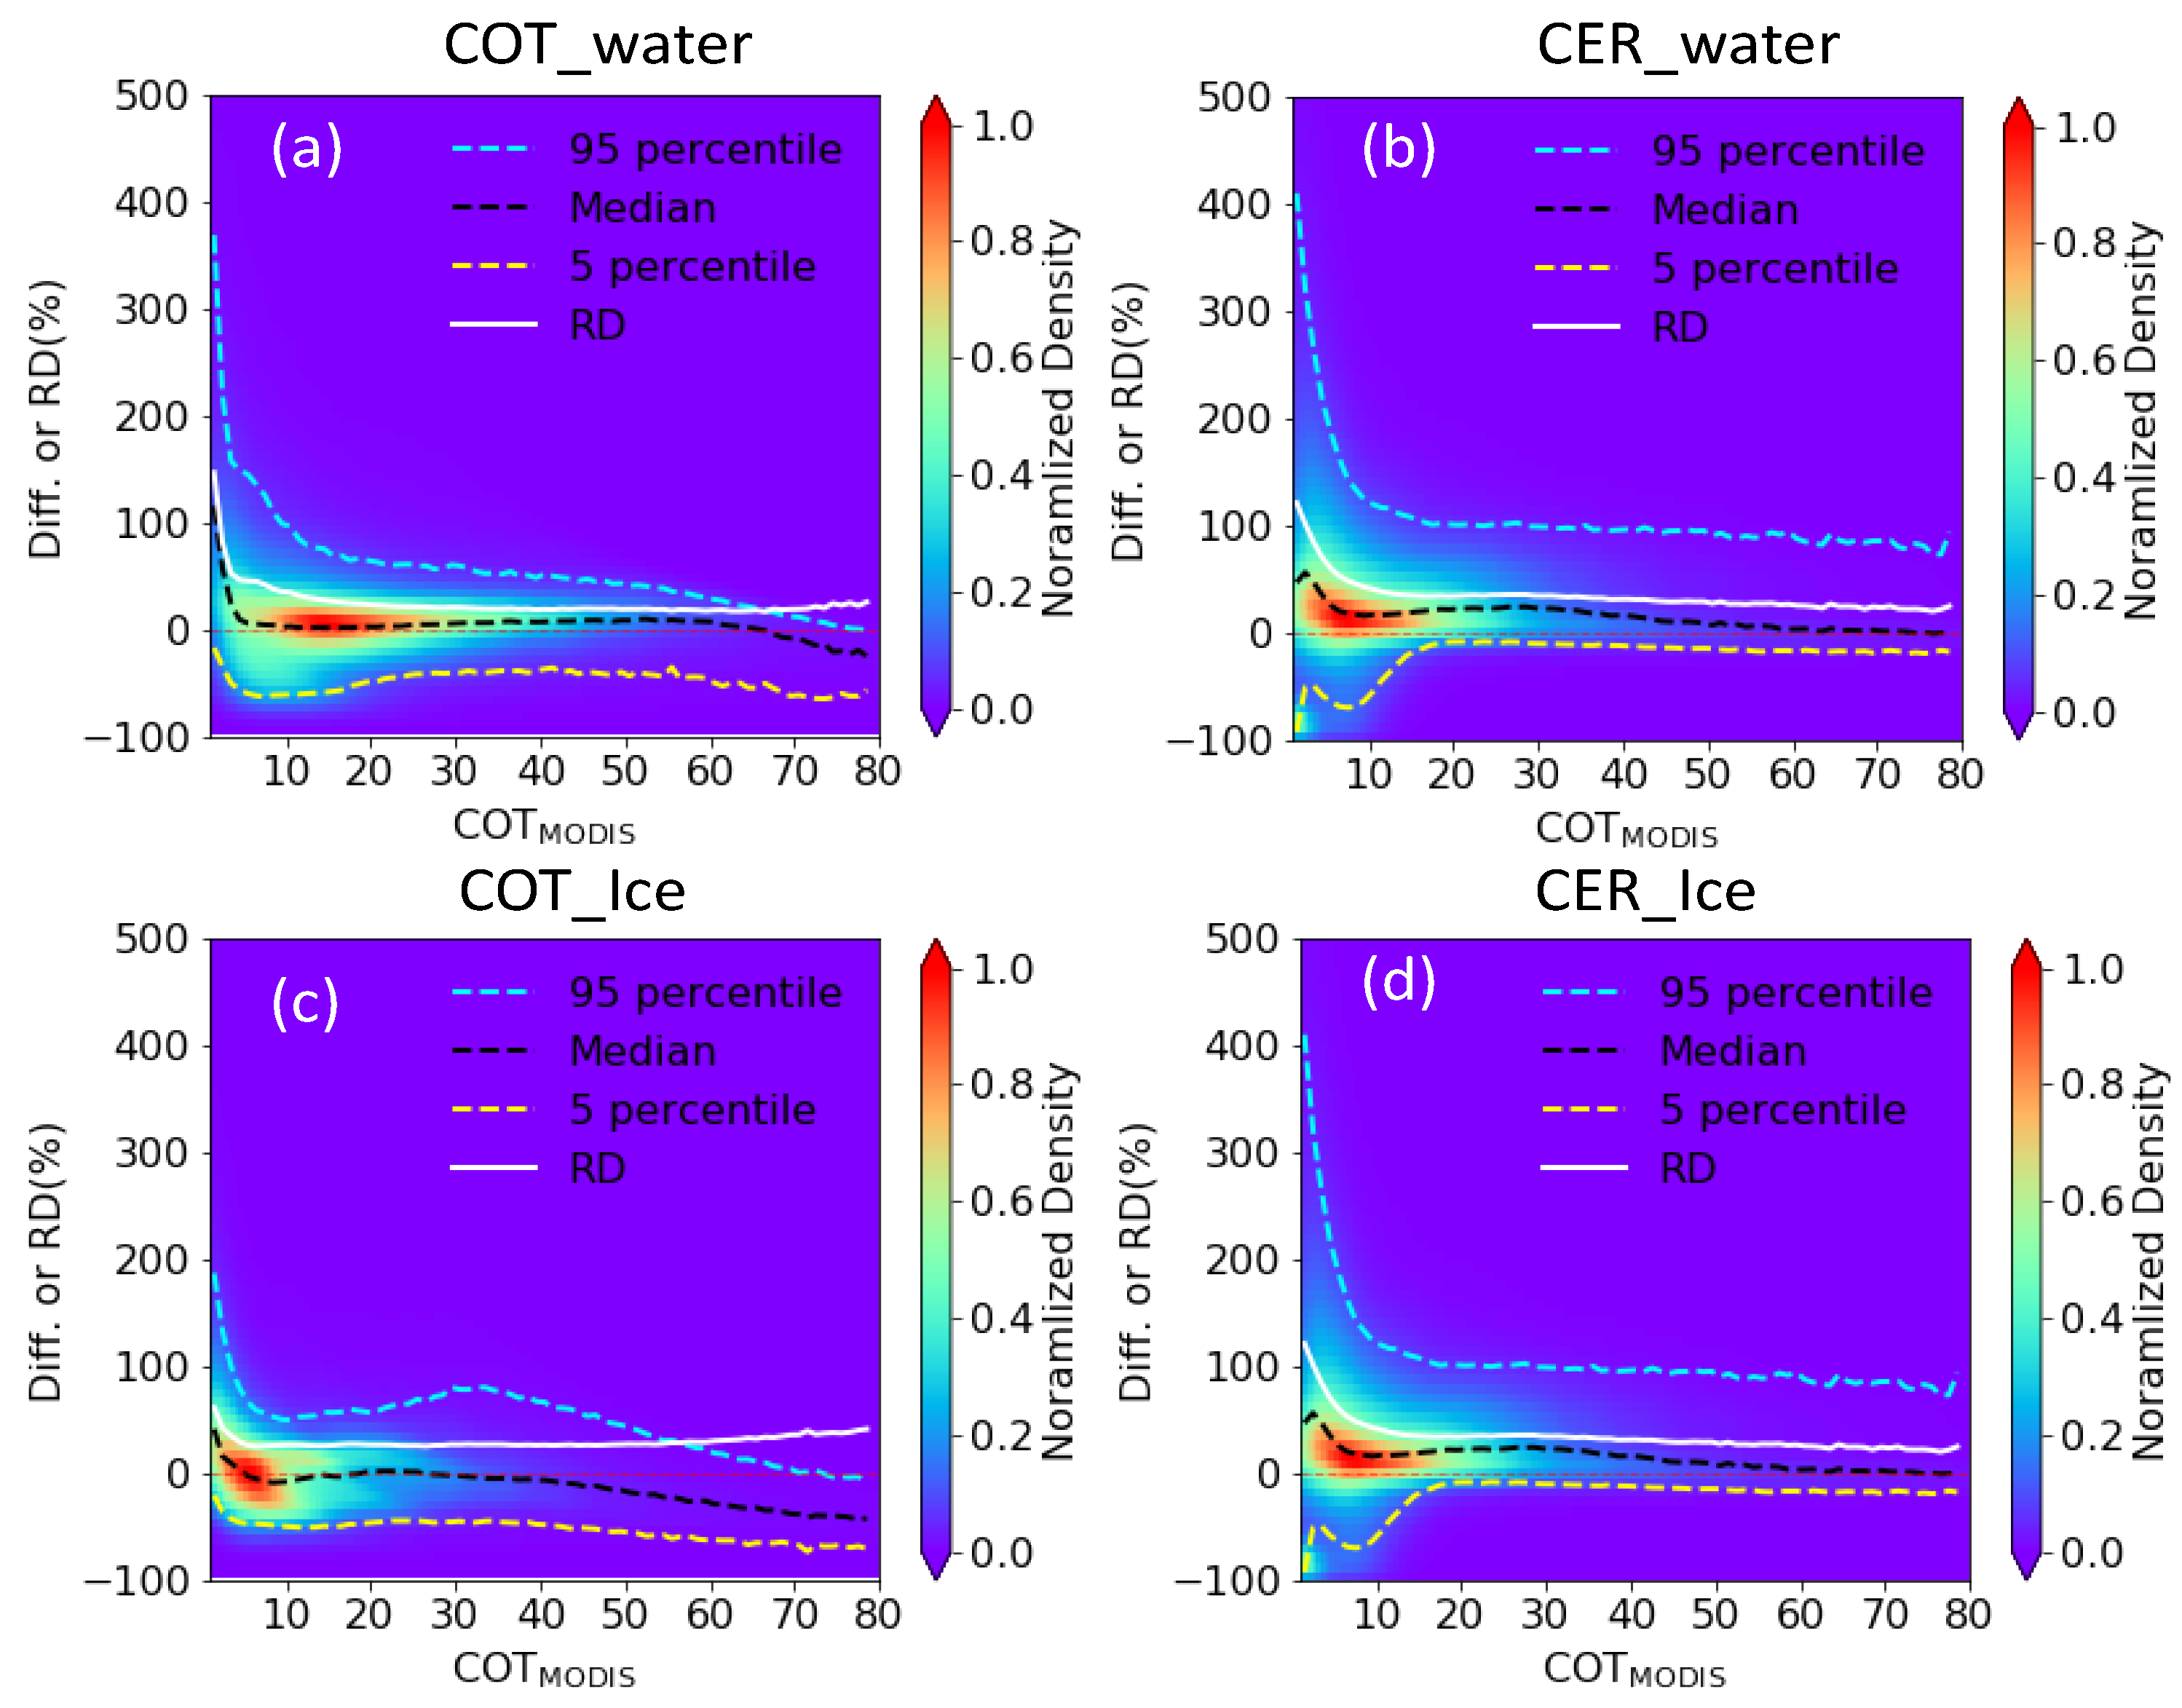
Optically thin clouds are known to have ambiguous retrievals, resulting in two possible solutions for COT and CER [21]. Therefore, cloud thickness can be one of the important factors for the inconsistent cloud properties between MODIS and SGLI presented in Section 3. To understand the influence of cloud thickness on the differences in retrieved cloud properties between MODIS and SGLI, Figure 5 shows statistical analyses (95 percentile, median, 5 percentile, and RD values) of differences as functions of MODIS COT for COT (left) and CER (right) values for water clouds (upper) and ice clouds (lower). The difference (Di) for i pair of MODIS and SGLI samples is calculated as,
D i = S i M i M i .
The statistical analyses are performed by binning differences (Di values) corresponding to each cloud property into a MODIS COT interval of 1. Note that RD corresponding to each bin is calculated by taking absolute values of Di using Equation (4). As the results corresponding to land and ocean surfaces are qualitatively the same, for brevity, Figure 5 is generated without taking into account the surface type. Figure 5 shows that the differences in COT and CER between MODIS and SGLI increase with the decrease in COT. In general, there is a fall in RD values in an exponential way with the increase in COT until COT reaches ~10. Such a rapid fall within the domain of COT less than ~10 can be further noted for the median values of COT differences in Figure 5a,c. One can further note a similar decrease in median values within COT with less than ~10 domain for CER differences in Figure 5b,d as well, except for very thin clouds with COT less than ~2. For COT greater than ~10 domain, the RD values are nearly constant, although, in general, the median values show a somewhat decreasing trend with the increase in COT. Furthermore, the differences between 95 and 5 percentiles values are larger for COT less than ~10 domain than those for COT greater than ~10 domain for both COT and CER differences for both water and ice clouds. Although, there appears both negative and positive differences (Di values) at different COTs; but, in general, the median values are positive or close to 0 for both COT and CER differences for both land and ocean surfaces, except for COT differences for water clouds with COT greater than ~60, and for ice clouds with COT greater than ~30. One can further note that the differences between the 95 percentile and median values are larger than the differences between the mean and 5 percentile values for a wide range of COT domains; more specifically, for the CER differences shown in Figure 5b,d. Figure 5 further reveals that higher values from SGLI (positive differences) are more pronounced in thinner clouds than in thicker clouds. To quantitatively illustrate this fact, Table 4 summarizes the comparison metrics shown in Figure 1 after breaking data samples into two groups of relatively thin (COT ≤ 10) and thick (COT > 10) clouds. As expected, except for RMSE for COT comparison, all metrics suggest better agreements between MODIS and SGLI cloud properties for thicker than for thinner water clouds. The increased RMSE for the comparison of larger COTs with respect to the comparison of smaller COTs is obvious, as calculated RMSEs are in terms of absolute values. The results are also more or less consistent for ice cloud properties. However, as ice cloud retrievals have greater uncertainties than water cloud retrievals, the results shown in Table 4 for ice cloud properties are less prominent than those for water cloud properties. Nonetheless, SGLI and MODIS can have different degrees of agreement for thinner and thicker clouds, suggesting that cloud thickness can be one important factor for differences in cloud properties between them.

4.2. Solar Zenith Angle

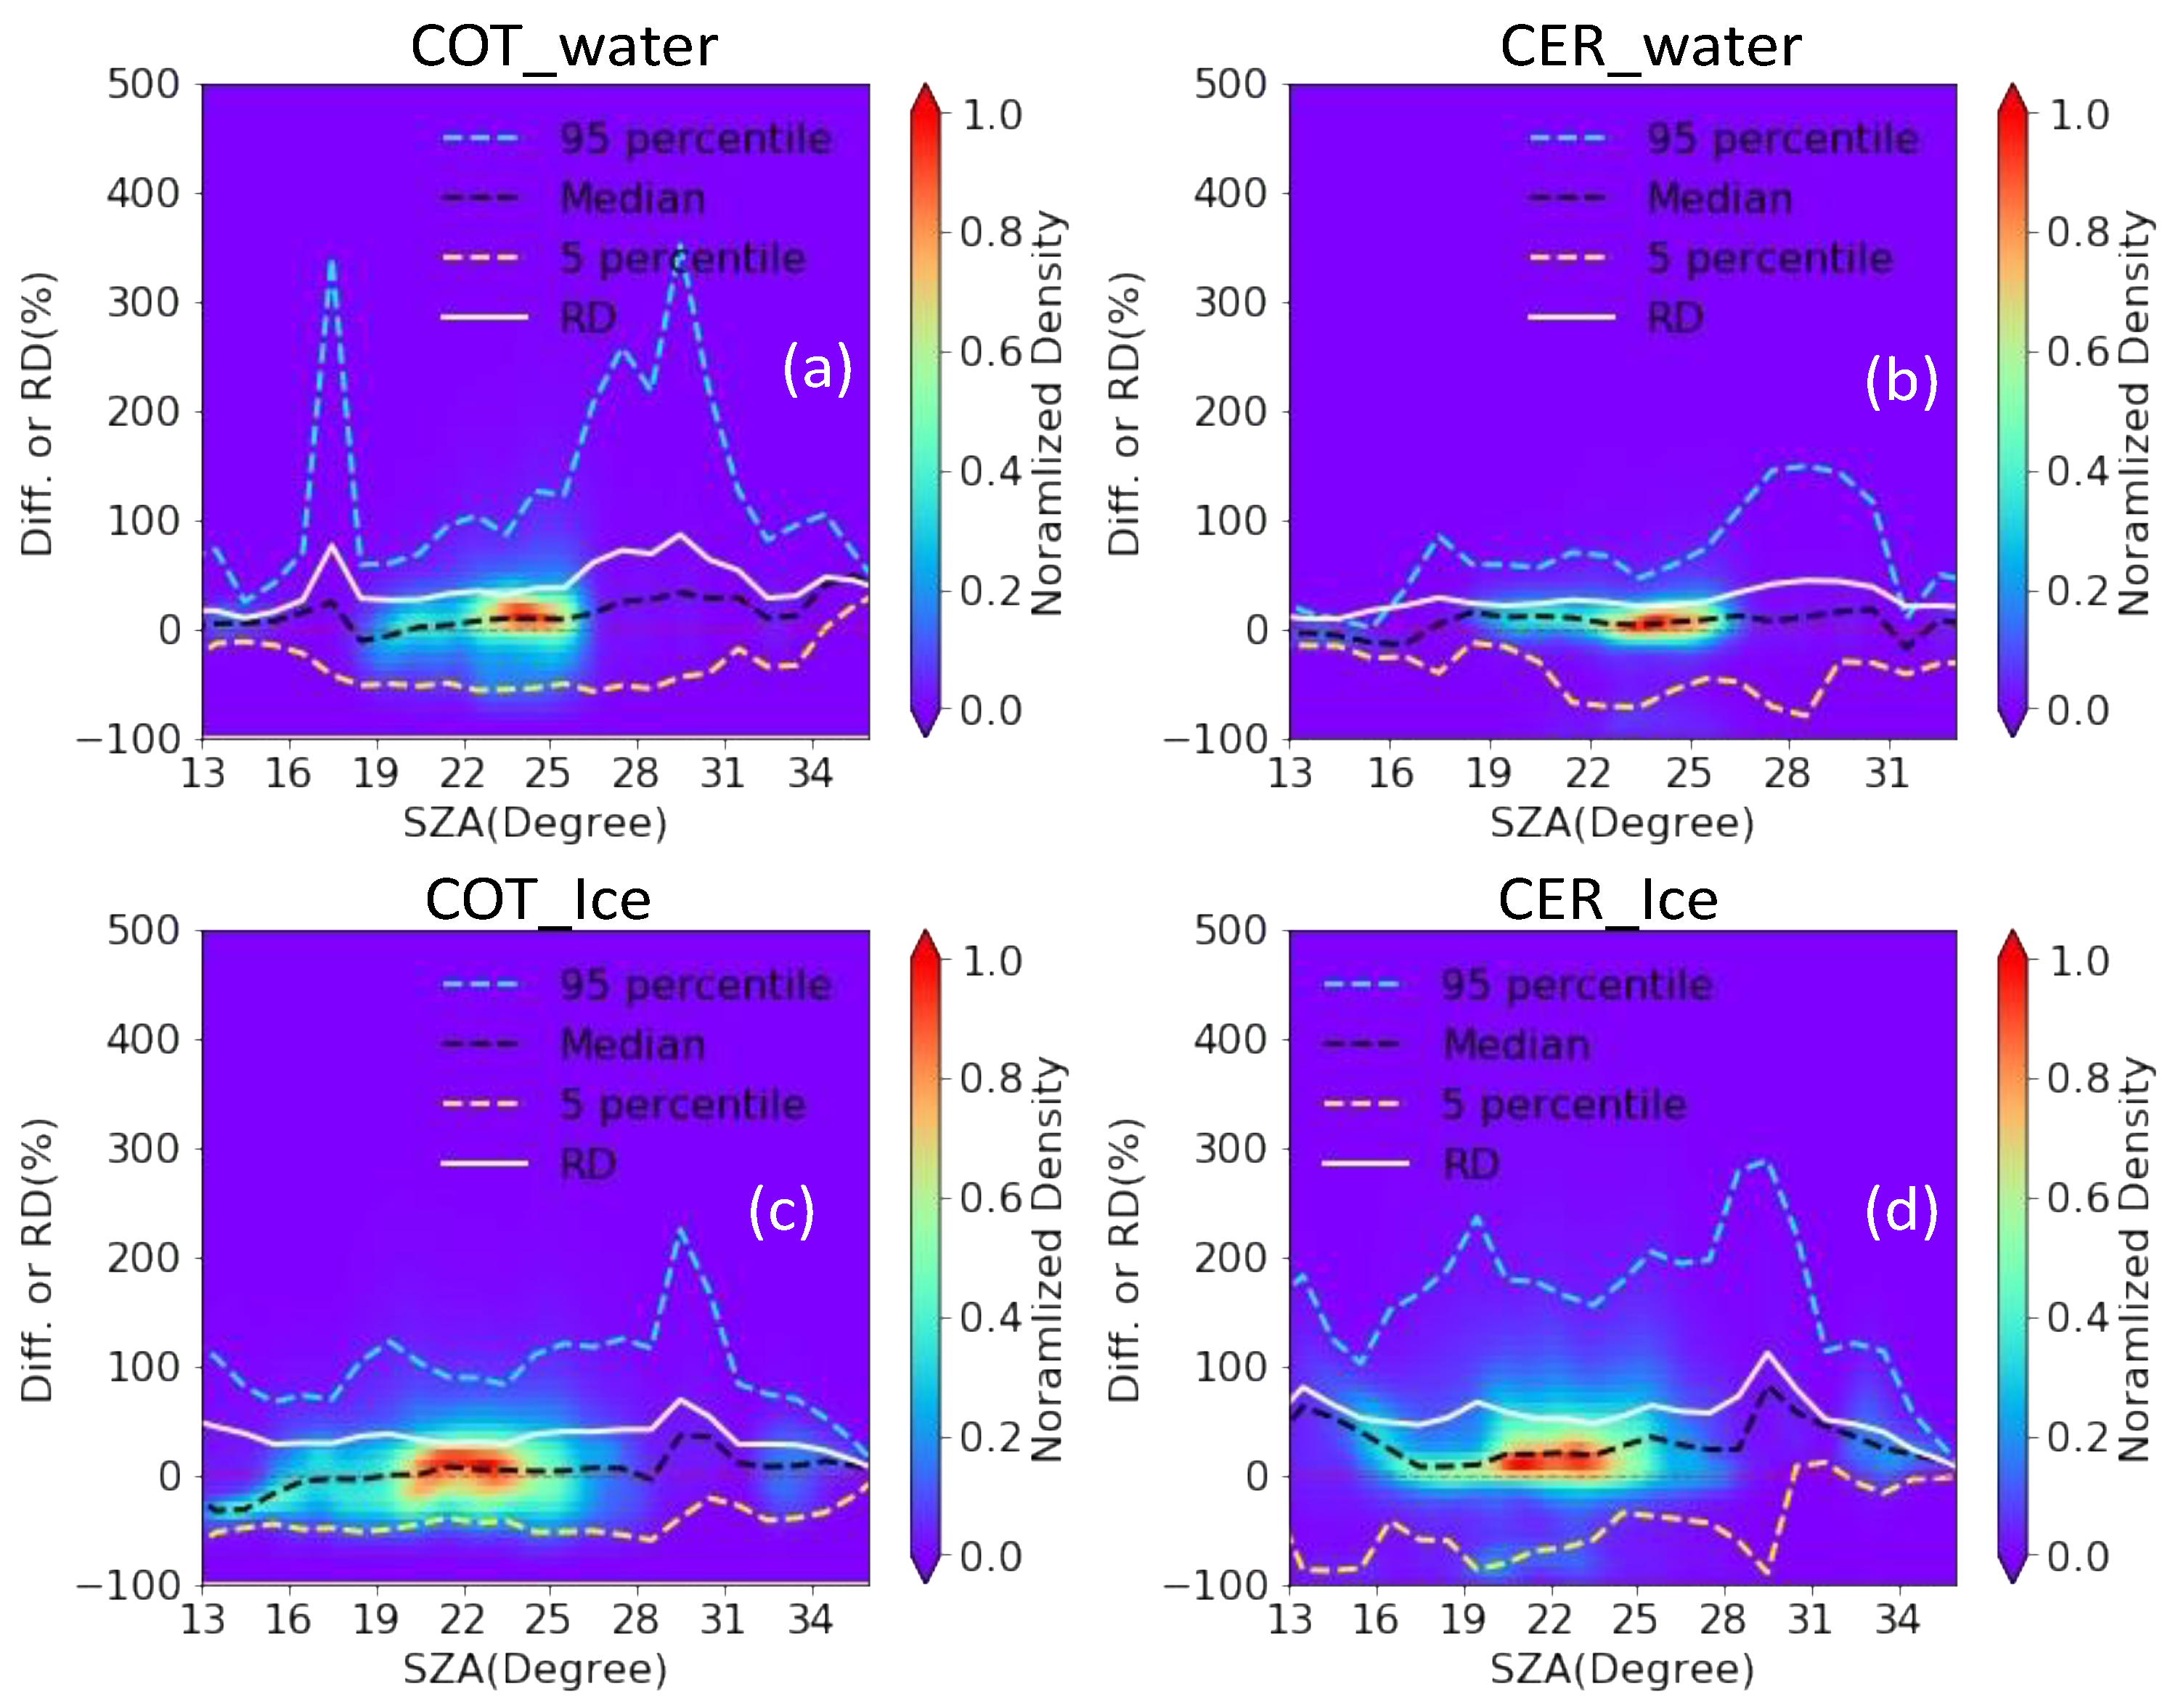
Both observations [32] and radiative transfer model simulations [33] suggest that COT retrieved by assuming cloud as plane-parallel horizontal layers increases with the increase in SZA because the horizontal leakage of radiation from cloud sides decreases relative to overhead Sun [34] and cloud sides have a greater opportunity to intercept more solar radiation for oblique Sun to increase the cloud-top-leaving radiance [35]. As cloud retrieval algorithms of both MODIS and SGLI assume clouds as plane-parallel horizontal layers, SZA can affect the retrieved cloud properties for both to generate the differences in cloud properties between them. Therefore, it is of interest to study the effect of SZA on differences in cloud properties between MODIS and SGLI. Figure 6 shows statistical analyses (95 percentile, median, 5 percentile, and RD values) of differences (Di values) as functions of SZA for COT (left) and CER (right) for water (upper) and ice (lower) clouds. The statistical analyses were performed by grouping data into a SZA bin of 1° interval. Figure 6a,b suggests that the differences in COT and CER between MODIS and SGLI for water clouds are bounded within a relatively small range (relatively small difference between 95 and 5 percentile values) when SZA is small (<~16°); but, the difference becomes large when SZA exceeds ~16°. As both MODIS and SGLI cloud retrieval algorithms use the Mie scattering-based database to retrieve water cloud properties, and the retrieval biases for results of each sensor can be relatively small for low SZAs, the retrieved cloud properties from MODIS and SGLI can become more consistent with each other to result in such low differences between 95 and 5 percentile values for water clouds when SZAs are relatively small. On the other hand, when SZA becomes large, SZA-led biases on retrieved cloud properties can be large and more complex depending on a number of factors, including Sun-satellite position and cloud inhomogeneity [11,36,37]. As discussed in Section 4.3, MODIS and SGLI have different viewing geometries while observing the same target clouds. Even for the same target cloud, the differences in viewing geometries between MODIS and SGLI can result in inconsistent cloud properties at higher SZAs, resulting in an increase in the differences between 95 and 5 percentile values. On the other hand, as shown in Figure 6c,d, the differences between 95 and 5 percentile values of ice cloud properties do not suggest such dependence on SZA. This indicates that SZA-led impacts on retrieved ice cloud properties for both MODIS and SGLI, and thereby differences between them, may be overshadowed by other important factors, such as differences in ice cloud habits, the cloud droplet size distribution function, etc., between cloud retrieval algorithms of MODIS and SGLI. It can be further noted that the median values for water cloud COTs (Figure 6a) are generally larger at higher SZAs than at lower SZAs. On the other hand, the median values for water cloud CERs (Figure 6b) are negative at lower SZAs, but they increase to become positive or close to 0 with the increase in SZA at dominant SZA bins. The RD values corresponding to COT and CER differences shown in Figure 6a,b also indicate the increase in values at higher SZAs. These data may further suggest relatively better agreements at smaller SZAs than at larger SZAs for water cloud properties. However, as noted in Figure 6c, the median values for ice cloud COTs are negative at smaller SZAs, but close to 0 and/or positive at higher SZAs. Similarly, the median values are positive for ice cloud CER differences at all COTs in Figure 6d. Unlike water cloud properties, these median and RD values for ice cloud properties do not indicate their dependencies on SZA.

4.3. Satellite Geometries

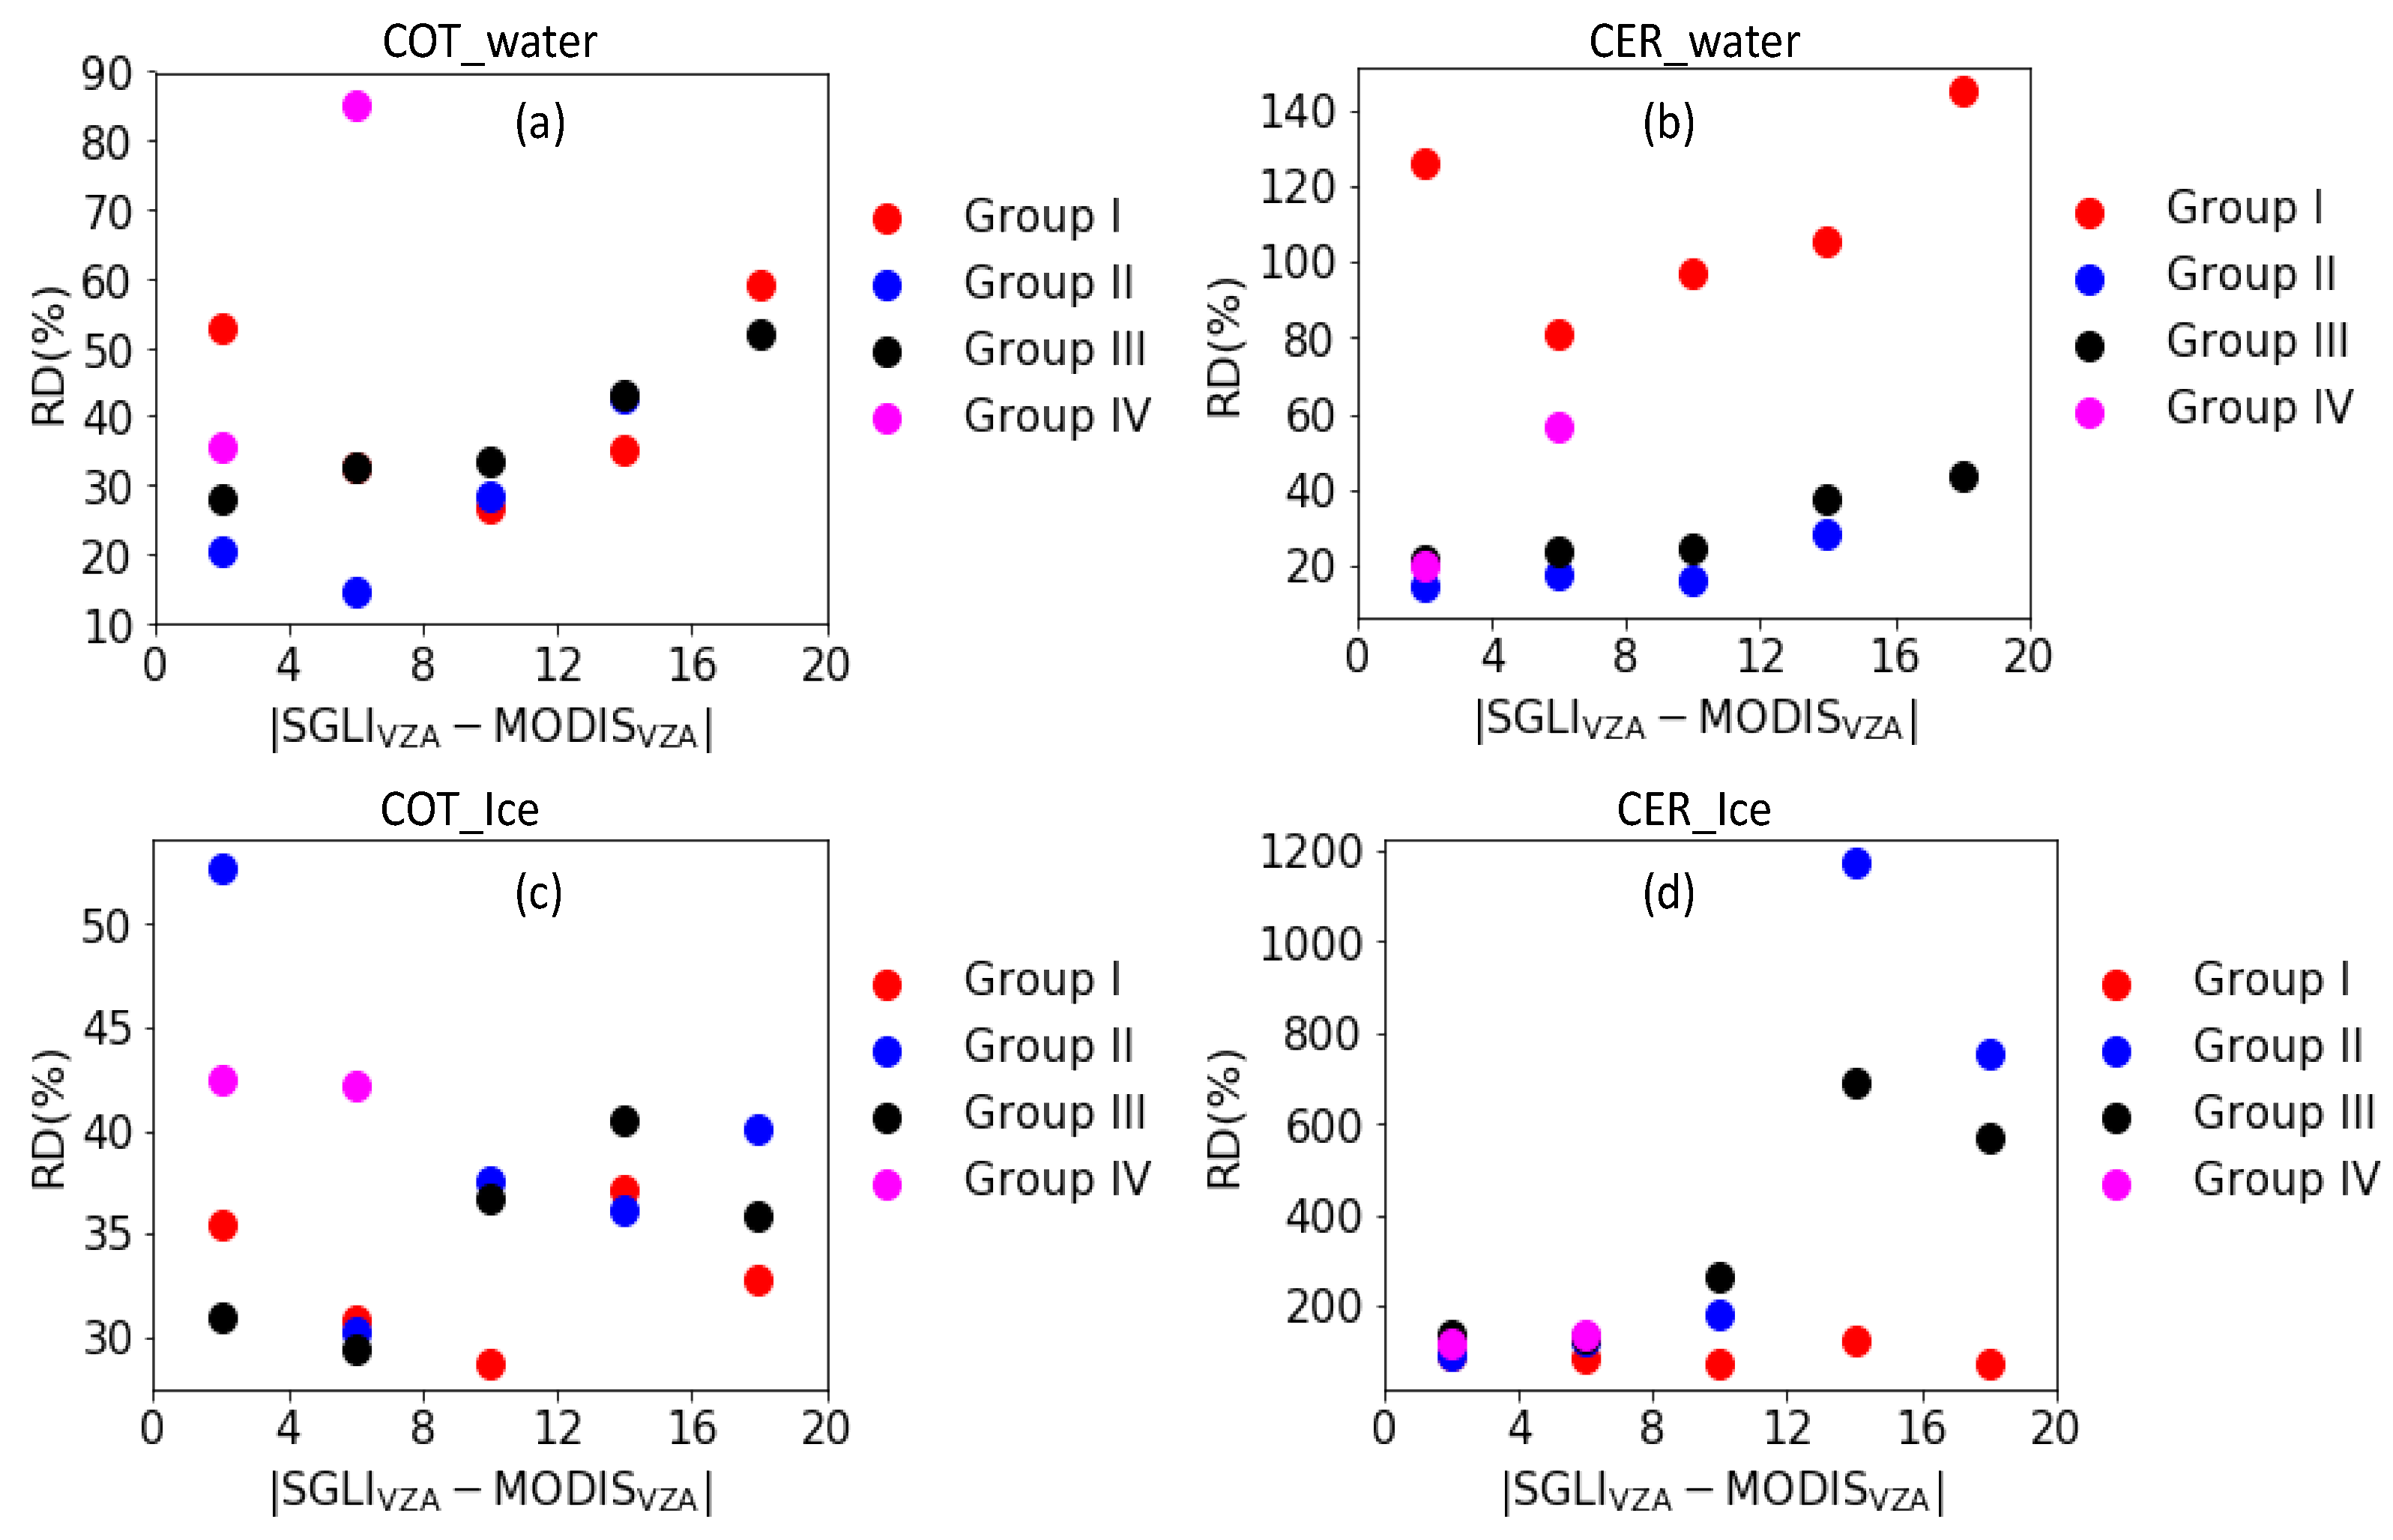
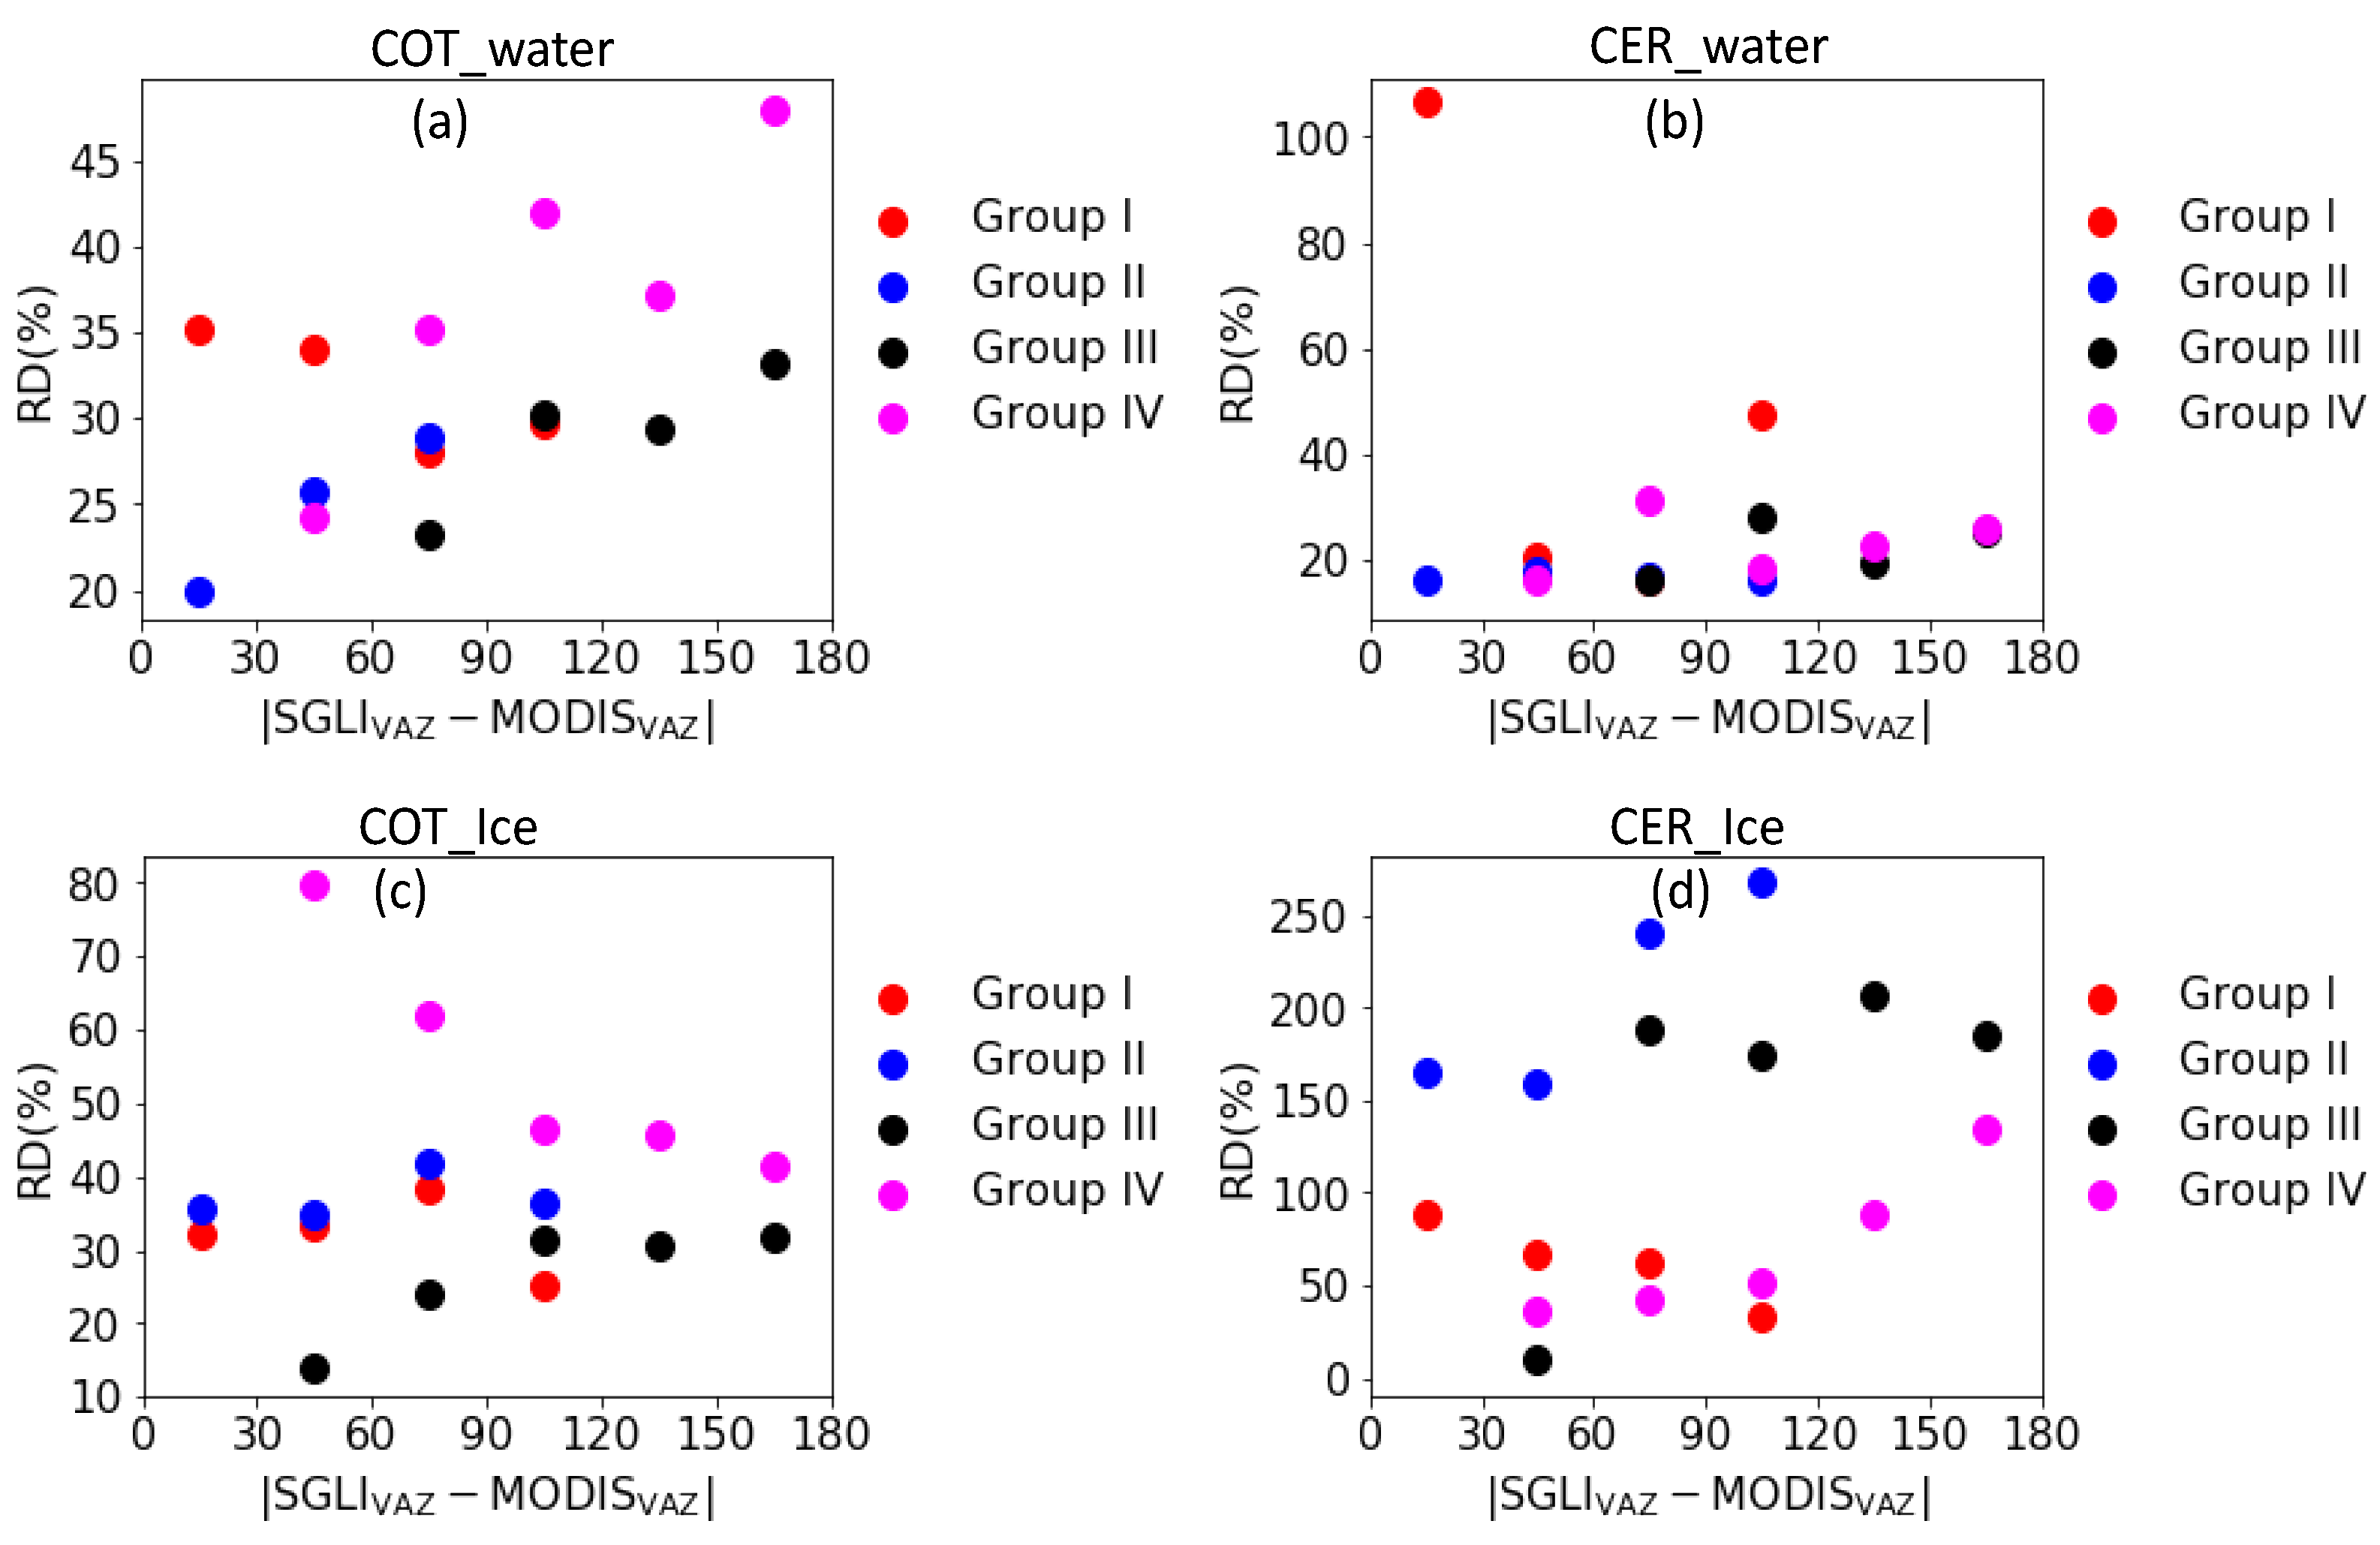
Depending on Sun-satellite geometry, shadowing and illumination effects can greatly affect cloud properties retrieved by assuming clouds as plane-parallel horizontal layers [38]. It has been further suggested that the dark gaps between cloud fields can be filled by brighter cloud sides through photon leakage when partly cloudy scenes are viewed more obliquely, leading to higher values of COT in both the forward and backward scattering directions [37]. Though the Sun’s position remains the same, MODIS and SGLI sensors can observe target clouds from different directions, making it possible to obtain different cloud properties because of differences in satellite-received radiances due to cloud inhomogeneity. This, in turn, can bring differences in retrieved cloud properties between MODIS and SGLI. To understand this possibility, we analyzed how the differences in VZA and VAZ between MODIS and SGLI sensors are related to the differences in cloud properties between them. Such analyses are performed after classifying data into four different groups—Group I to Group IV—as described in Section 2.2. Figure 7 shows the relationships between RD and the absolute difference is VZA between MODIS and SGLI for (a) COT and (b) CER of water clouds and (c) COT and (d) CER of ice clouds for bins of absolute VZA difference of 4°. Similarly, Figure 8 shows results similar to Figure 7, but for an absolute VAZ difference of 30° between MODIS and SGLI. In both Figure 7 and Figure 8, RD values are not calculated if the total sample count within a bin becomes less than 50. As the difference in cloud properties between MODIS and SGLI can result from manifold factors, including some discussed above, a strict relationship between RD and absolute VZA (or VAZ) difference may be hard to achieve. Nonetheless, if some outliers are not included, both Figure 7 and Figure 8 suggest that RD can increase with the increase in both absolute VZA and VAZ differences. Such an increase with the increase in absolute VZA (or VAZ) difference seems to be more prominent for water cloud properties than for ice cloud properties. The relatively less prominent results for ice cloud properties can be associated with the fact that retrieved ice cloud properties can be influenced by a number of factors as mentioned above, which may be more largely weighted than the effect of satellite position difference. The RD values are considerably higher for ice cloud CERs at higher absolute VZA and VAZ differences in Figure 7 and Figure 8, respectively. This indicates that ice cloud CERs may be quite uncertain when VZA and VAZ become larger either in MODIS observations or in SGLI observations, or in both. Furthermore, both Figure 7 and Figure 8 do not suggest any clear difference in results (relationship between RD and absolute VZA or VAZ difference) among different groups (Groups I–IV), which correspond to the positions of satellite sensors with respect to the position of the Sun. It has been suggested that cloud properties retrieved under the assumption of plane-parallel horizontal cloud layers can have both increased or decreased values in forward and backward scattering directions, depending on not only the Sun-satellite position, but also on the competition among multiple factors governed by SZA, RAZ, and cloud inhomogeneity [11,36]. For example, COTs were found to increase with the increase in VZA in both forward and backward scattering directions, which were suggested due to the fact that dark gaps between the cloud fields could be filled up by brighter cloud sides through photon leakage when obliquely viewing partly cloudy scenes [37]. On the contrary, a decreasing and increasing COT in the forward and backward scattering directions, respectively, have been also shown, which were suggested due to shadowing and illumination effects [38]. Therefore, complex interactions among multiple factors, including cloud inhomogeneity and Sun and satellite geometries, could produce different cloud products in independent observations of MODIS and SGLI, resulting in not clear differences in relationships between RD and absolute VZA or VAZ differences between MODIS and SGLI among different groups representing various Sun and satellite positions.

5. Conclusions

A comparison of water and ice phase cloud pixels between MODIS and SGLI satellite sensors revealed that cloud pixels identified as water phase were consistent with each other by more than 90%, although this was only by ~60% for ice cloud pixels. This considerable mismatch in ice phase detection is suggested due to the fact that SGLI uses a single pair of two infrared wavelengths (10.8 and 12.0 μm), whereas MODIS uses three different pairs of wavelengths between 7.3 to 12.0 μm to detect cloud phase. Similarly, for a comparison of cloud optical properties, COT (CER) for water clouds over ocean and land surfaces were found to agree with RD values of 22% (18%) and 37% (24%), respectively; whereas the agreements for ice clouds were relatively poorer with respective RD values of 35% (42%) and 35% (62%). Along with these RD values, other comparison metrics also suggested better agreements for water cloud properties than for ice cloud properties and for ocean surfaces than for land surfaces; though, in general, SGLI values were higher than MODIS values. Some major differences between MODIS and SGLI ice cloud retrieval algorithms, including differences in ice particle habit, cloud-particle size distribution function, etc., are suggested to be important for poorly correlated ice cloud properties between MODIS and SGLI. Unlike monomodal CER frequency distribution for water clouds, ice clouds were found to have bimodal distribution, possibly due to the inability of satellite sensors to correctly identify mixed multilayered clouds. As a result, CERs for ice clouds, especially those for land surfaces, agreed very poorly between MODIS and SGLI. As thinner clouds have greater retrieval uncertainties than thicker clouds, MODIS and SGLI cloud properties poorly agreed for thinner clouds, and the dependencies of cloud properties differences between MODIS and SGLI on cloud thickness were relatively stronger for water clouds than for ice clouds. Furthermore, as retrieved cloud properties have less biases at smaller SZAs, MODIS and SGLI observations showed better agreements for smaller SZAs for water clouds; although, the ice cloud properties differences between them were noted to less depend on SZA, possibly due to the complexity in ice cloud retrievals. The relative positions of MODIS and SGLI aboard satellites were also found to cause differences in cloud properties between them: in general, cloud properties differences increased with the increase in VZA and VAZ differences between them, and such differences were more (less) prominent for water (ice) clouds. Overall, these comparison results suggest that, though a number of factors can be associated with differences in cloud properties between MODIS and SGLI, these sensors, in general, have better consistency in retrieved properties of water clouds, especially when clouds are relatively thicker, the underlying surface is ocean, SZA becomes low, and both sensors have close observation geometries. These results also have important implications for the further advancement of cloud remote sensing technology and the effective use of satellite-observed cloud products in scientific research, policy-making, etc.

Author Contributions

P.K. and T.H. conceptualized the study; P.K. composed a draft; T.H. reviewed and edited the draft. All authors have read and agreed to the published version of the manuscript.

Funding

This research is supported by the 3rd Research Announcement on the Earth Observations of the Japan Aerospace Exploration Agency (JAXA) (PI No. ER3GCF211, Specification No. JX-PSPC-530166).

Data Availability Statement

MODIS and SGLI data used in this study are downloaded from https://search.earthdata.nasa.gov/search and https://gportal.jaxa.jp/gpr/?lang=en, respectively.

Conflicts of Interest

The authors declare no conflict of interest.

References

  1. Ramanathan, V.; Cess, R.D.; Harrison, E.F.; Minnis, P.; Barkstrom, B.R.; Ahmad, E.; Hartmann, D. Cloud-radiative forcing and climate: Results from the Earth radiation budget experiment. Science 1989, 243, 57–63. [Google Scholar] [CrossRef] [Green Version]
  2. Rosenfeld, D.; Andreae, M.O.; Asmi, A.; Chin, M.; de Leeuw, G.; Donovan, D.P.; Kahn, R.; Kinne, S.; Kivekäs, N.; Kulmala, M.; et al. Global observations of aerosol-cloud-precipitation-climate interactions. Rev. Geophys. 2014, 52, 750–808. [Google Scholar] [CrossRef] [Green Version]
  3. Khatri, P.; Takamura, T. An Algorithm to Screen Cloud-A?ected Data for Sky Radiometer Data Analysis. J. Meteorol. Soc. 2009, 87, 189–204. [Google Scholar] [CrossRef] [Green Version]
  4. Khatri, P.; Ooashi, H.; Iwabuchi, H. Investigating Aerosol Effects on Maritime Deep Convective Clouds Using Satellite and Reanalysis Data. Sola 2020, 16, 228–232. [Google Scholar] [CrossRef]
  5. Platnick, S.; Meyer, K.G.; King, M.D.; Wind, G.; Amarasinge, N.; Marchant, B.; Arnold, G.T.; Zhibo, Z.; Hubanks, P.A.; Holz, R.E.; et al. The MODIS cloud optical and microphysical products: Collection 6 updates and examples from terra and aqua. IEEE Trans. Geosci. Remote Sens. 2017, 55, 502–525. [Google Scholar] [CrossRef] [Green Version]
  6. Bessho, K.; Date, K.; Hayashi, M.; Ikeda, A.; Imai, T.; Inoue, H.; Kumagai, Y.; Miyakawa, T.; Murata, H.; Ohno, T.; et al. An Introduction to Himawari-8/9–Japan’s New-Generation Geostationary Meteorological Satellites. J. Meteorol. Soc. Jpn. Ser. II 2016, 94, 151–183. [Google Scholar] [CrossRef] [Green Version]
  7. Khatri, P.; Iwabuchi, H.; Saito, M. Vertical Profiles of Ice Cloud Microphysical Properties and Their Impacts on Cloud Retrieval Using Thermal Infrared Measurements. J. Geophys. Res. Atmos. 2018, 123, 5301–5319. [Google Scholar] [CrossRef]
  8. Letu, H.; Yang, K.; Nakajima, T.Y.; Ishimoto, H.; Nagao, T.M.; Riedi, J.; Baran, A.J.; Ma, R.; Wang, T.; Shang, H.; et al. High-resolution retrieval of cloud microphysical properties and surface solar radiation using Himawari-8/AHI next-generation geostationary satellite. Remote Sens. Environ. 2020, 239, 111583. [Google Scholar] [CrossRef]
  9. Letu, H.; Nakajima, T.Y.; Wang, T.; Shang, H.; Ma, R.; Yang, K.; Baran, A.J.; Riedi, J.; Ishimoto, H.; Yoshida, M.; et al. A new benchmark for surface radiation products over the East Asia-Pacific region retrieved from the Himawari-8/AHI next-generation geostationary satellite. Bull. Am. Meteorol. Soc. 2021, 103, 1–40. [Google Scholar] [CrossRef]
  10. Khatri, P.; Hayasaka, T.; Holben, B.; Tripathi, S.N.; Misra, P.; Patra, P.K.; Hayashida, S.; Dumka, U.C. Aerosol Loading and Radiation Budget Perturbations in Densely Populated and Highly Polluted Indo-Gangetic Plain by COVID-19: Influences on Cloud Properties and Air Temperature. Geophys. Res. Lett. 2021, 48, e2021GL093796. [Google Scholar] [CrossRef]
  11. Khatri, P.; Hayasaka, T.; Irie, H.; Letu, H.; Nakajima, T.Y.; Ishimoto, H.; Takamura, T. Quality assessment of Second-generation Global Imager (SGLI)-observed cloud properties using SKYNET surface observation data. Atmos. Meas. Tech. 2022, 15, 1967–1982. [Google Scholar] [CrossRef]
  12. Damiani, A.; Irie, H.; Takamura, T.; Kudo, R.; Khatri, P.; Iwabuchi, H.; Masuda, R.; Nagao, T. An Intensive Campaign-Based Intercomparison of Cloud Optical Depth from Ground and Satellite Instruments under Overcast Conditions. Sola 2019, 15, 198–204. [Google Scholar] [CrossRef] [Green Version]
  13. Khatri, P.; Iwabuchi, H.; Hayasaka, T.; Irie, H.; Takamura, T.; Yamazaki, A.; Damiani, A.; Letu, H.; Kai, Q. Retrieval of cloud properties from spectral zenith radiances observed by sky radiometers. Atmos. Meas. Tech. 2019, 12, 6037–6047. [Google Scholar] [CrossRef] [Green Version]
  14. Khatri, P.; Hayasaka, T.; Iwabuchi, H.; Takamura, T.; Irie, H.; Nakajima, T.Y. Validation of MODIS and AHI Observed Water Cloud Properties Using Surface Radiation Data. J. Meteorol. Soc. Jpn. Ser. II 2018, 96B, 151–172. [Google Scholar] [CrossRef] [Green Version]
  15. Nakajima, T.; Campanelli, M.; Che, H.; Estellés, V.; Irie, H.; Kim, S.-W.; Kim, J.; Liu, D.; Nishizawa, T.; Pandithurai, G.; et al. An overview of and issues with sky radiometer technology and SKYNET. Atmos. Meas. Tech. 2020, 13, 4195–4218. [Google Scholar] [CrossRef]
  16. Khatri, P.; Takamura, T.; Shimizu, A.; Sugimoto, N. Observation of low single scattering albedo of aerosols in the downwind of the East Asian desert and urban areas during the inflow of dust aerosols. J. Geophys. Res. Atmos. 2014, 119, 787–802. [Google Scholar] [CrossRef]
  17. Khatri, P.; Takamura, T.; Shimizu, A.; Sugimoto, N. Spectral Dependency of Aerosol Light-Absorption over the East China Sea Region. Sola 2010, 6, 1–4. [Google Scholar] [CrossRef] [Green Version]
  18. Min, Q.; Joseph, E.; Lin, Y.; Min, L.; Yin, B.; Daum, P.H.; Kleinman, L.I.; Wang, J.; Lee, Y.N. Comparison of MODIS cloud microphysical properties with in-situ measurements over the Southeast Pacific. Atmos. Chem. Phys. 2012, 12, 11261–11273. [Google Scholar] [CrossRef] [Green Version]
  19. Liu, J.; Li, Z.; Zheng, Y.; Chiu, J.C.; Zhao, F.; Cadeddu, M.; Weng, F.; Cribb, M. Cloud optical and microphysical properties derived from ground-based and satellite sensors over a site in the Yangtze Delta region. J. Geophys. Res. Atmos. 2013, 118, 9141–9152. [Google Scholar] [CrossRef] [Green Version]
  20. Nakajima, T.Y.; Ishida, H.; Nagao, T.M.; Hori, M.; Letu, H.; Higuchi, R.; Tamaru, N.; Imoto, N.; Yamazaki, A. Theoretical basis of the algorithms and early phase results of the GCOM-C (Shikisai) SGLI cloud products. Prog. Earth Planet. Sci. 2019, 6, 1–25. [Google Scholar] [CrossRef] [Green Version]
  21. Nakajima, T.; King, M.D. Determination of the Optical Thickness and Effective Particle Radius of Clouds from Reflected Solar Radiation Measurements. Part I: Theory. J. Atmos. Sci. 1990, 47, 1878–1893. [Google Scholar] [CrossRef]
  22. Platnick, S. Vertical photon transport in cloud remote sensing problems. J. Geophys. Res. Atmos. 2000, 105, 22919–22935. [Google Scholar] [CrossRef] [Green Version]
  23. Yang, P.; Bi, L.; Baum, B.A.; Liou, K.-N.; Kattawar, G.W.; Mishchenko, M.I.; Cole, B. Spectrally Consistent Scattering, Absorption, and Polarization Properties of Atmospheric Ice Crystals at Wavelengths from 0.2 to 100 μm. J. Atmos. Sci. 2013, 70, 330–347. [Google Scholar] [CrossRef]
  24. Baum, B.A.; Menzel, W.P.; Frey, R.A.; Tobin, D.C.; Holz, R.E.; Ackerman, S.A.; Heidinger, A.K.; Yang, P. MODIS Cloud-Top Property Refinements for Collection 6. J. Appl. Meteorol. Climatol. 2012, 51, 1145–1163. [Google Scholar] [CrossRef]
  25. Ishimoto, H.; Masuda, K.; Mano, Y.; Orikasa, N.; Uchiyama, A. Irregularly shaped ice aggregates in optical modeling of convectively generated ice clouds. J. Quant. Spectrosc. Radiat. Transf. 2012, 113, 632–643. [Google Scholar] [CrossRef]
  26. Baum, B.A.; Soulen, P.F.; Strabala, K.I.; King, M.D.; Ackerman, S.A.; Menzel, W.P.; Yang, P. Remote sensing of cloud properties using MODIS airborne simulator imagery during SUCCESS: 2. Cloud thermodynamic phase. J. Geophys. Res. Atmos. 2000, 105, 11781–11792. [Google Scholar] [CrossRef]
  27. Nagao, T.M.; Suzuki, K. Temperature-Independent Cloud Phase Retrieval from Shortwave-Infrared Measurement of GCOM-C/SGLI With Comparison to CALIPSO. Earth Space Sci. 2021, 8, e2021EA001912. [Google Scholar] [CrossRef]
  28. Tang, J.; Xue, Y.; Yu, T.; Guan, Y.; Cai, G.; Hu, Y. Aerosol retrieval over land by exploiting the synergy of TERRA and AQUA MODIS data. Sci. China Ser. D 2006, 49, 641–649. [Google Scholar] [CrossRef]
  29. Marchant, B.; Platnick, S.; Meyer, K.; Wind, G. Evaluation of the MODIS Collection 6 multilayer cloud detection algorithm through comparisons with CloudSat Cloud Profiling Radar and CALIPSO CALIOP products. Atmos. Meas. Tech. 2020, 13, 3263–3275. [Google Scholar] [CrossRef]
  30. Wind, G.; Platnick, S.; King, M.D.; Hubanks, P.A.; Pavolonis, M.J.; Heidinger, A.K.; Yang, P.; Baum, B.A. Multilayer Cloud Detection with the MODIS Near-Infrared Water Vapor Absorption Band. J. Appl. Meteorol. Climatol. 2010, 49, 2315–2333. [Google Scholar] [CrossRef]
  31. Nakajima, T.Y.; Nakajima, T. Wide-area determination of cloud microphysical properties from NOAA AVHRR measurement for FIRE and ASTEX regions. J. Atmos. Sci. 1995, 52, 4043–4059. [Google Scholar] [CrossRef]
  32. Loeb, N.G.; Davies, R. Angular dependence of observed reflectances: A comparison with plane parallel theory. J. Geophys. Res. Atmos. 1997, 102, 6865–6881. [Google Scholar] [CrossRef]
  33. Kato, S.; Hinkelman, L.M.; Cheng, A. Estimate of satellite-derived cloud optical thickness and effective radius errors and their effect on computed domain-averaged irradiances. J. Geophys. Res. 2006, 111, D17201. [Google Scholar] [CrossRef]
  34. Fu, Q.; Cribb, M.C.; Barker, H.W.; Krueger, S.K.; Grossman, A. Cloud Geometry Effects on Atmospheric Solar Absorption. J. Atmos. Sci. 2000, 57, 1156–1168. [Google Scholar] [CrossRef]
  35. Loeb, N.G.; Várnai, T.; Davies, R. Effect of cloud inhomogeneities on the solar zenith angle dependence of nadir reflectance. J. Geophys. Res. Atmos. 1997, 102, 9387–9395. [Google Scholar] [CrossRef]
  36. Liang, L.; Girolamo, L.D. A global analysis on the view-angle dependence of plane-parallel oceanic liquid water cloud optical thickness using data synergy from MISR and MODIS. J. Geophys. Res. Atmos. 2013, 118, 2389–2403. [Google Scholar] [CrossRef]
  37. Várnai, T.; Marshak, A. View angle dependence of cloud optical thicknesses retrieved by Moderate Resolution Imaging Spectroradiometer (MODIS). J. Geophys. Res. 2007, 112, D06203. [Google Scholar] [CrossRef]
  38. Loeb, N.G.; Coakley, J.A., Jr. Inference of Marine Stratus Cloud Optical Depths from Satellite Measurements: Does 1D Theory Apply? J. Clim. 1998, 11, 215–233. [Google Scholar] [CrossRef]
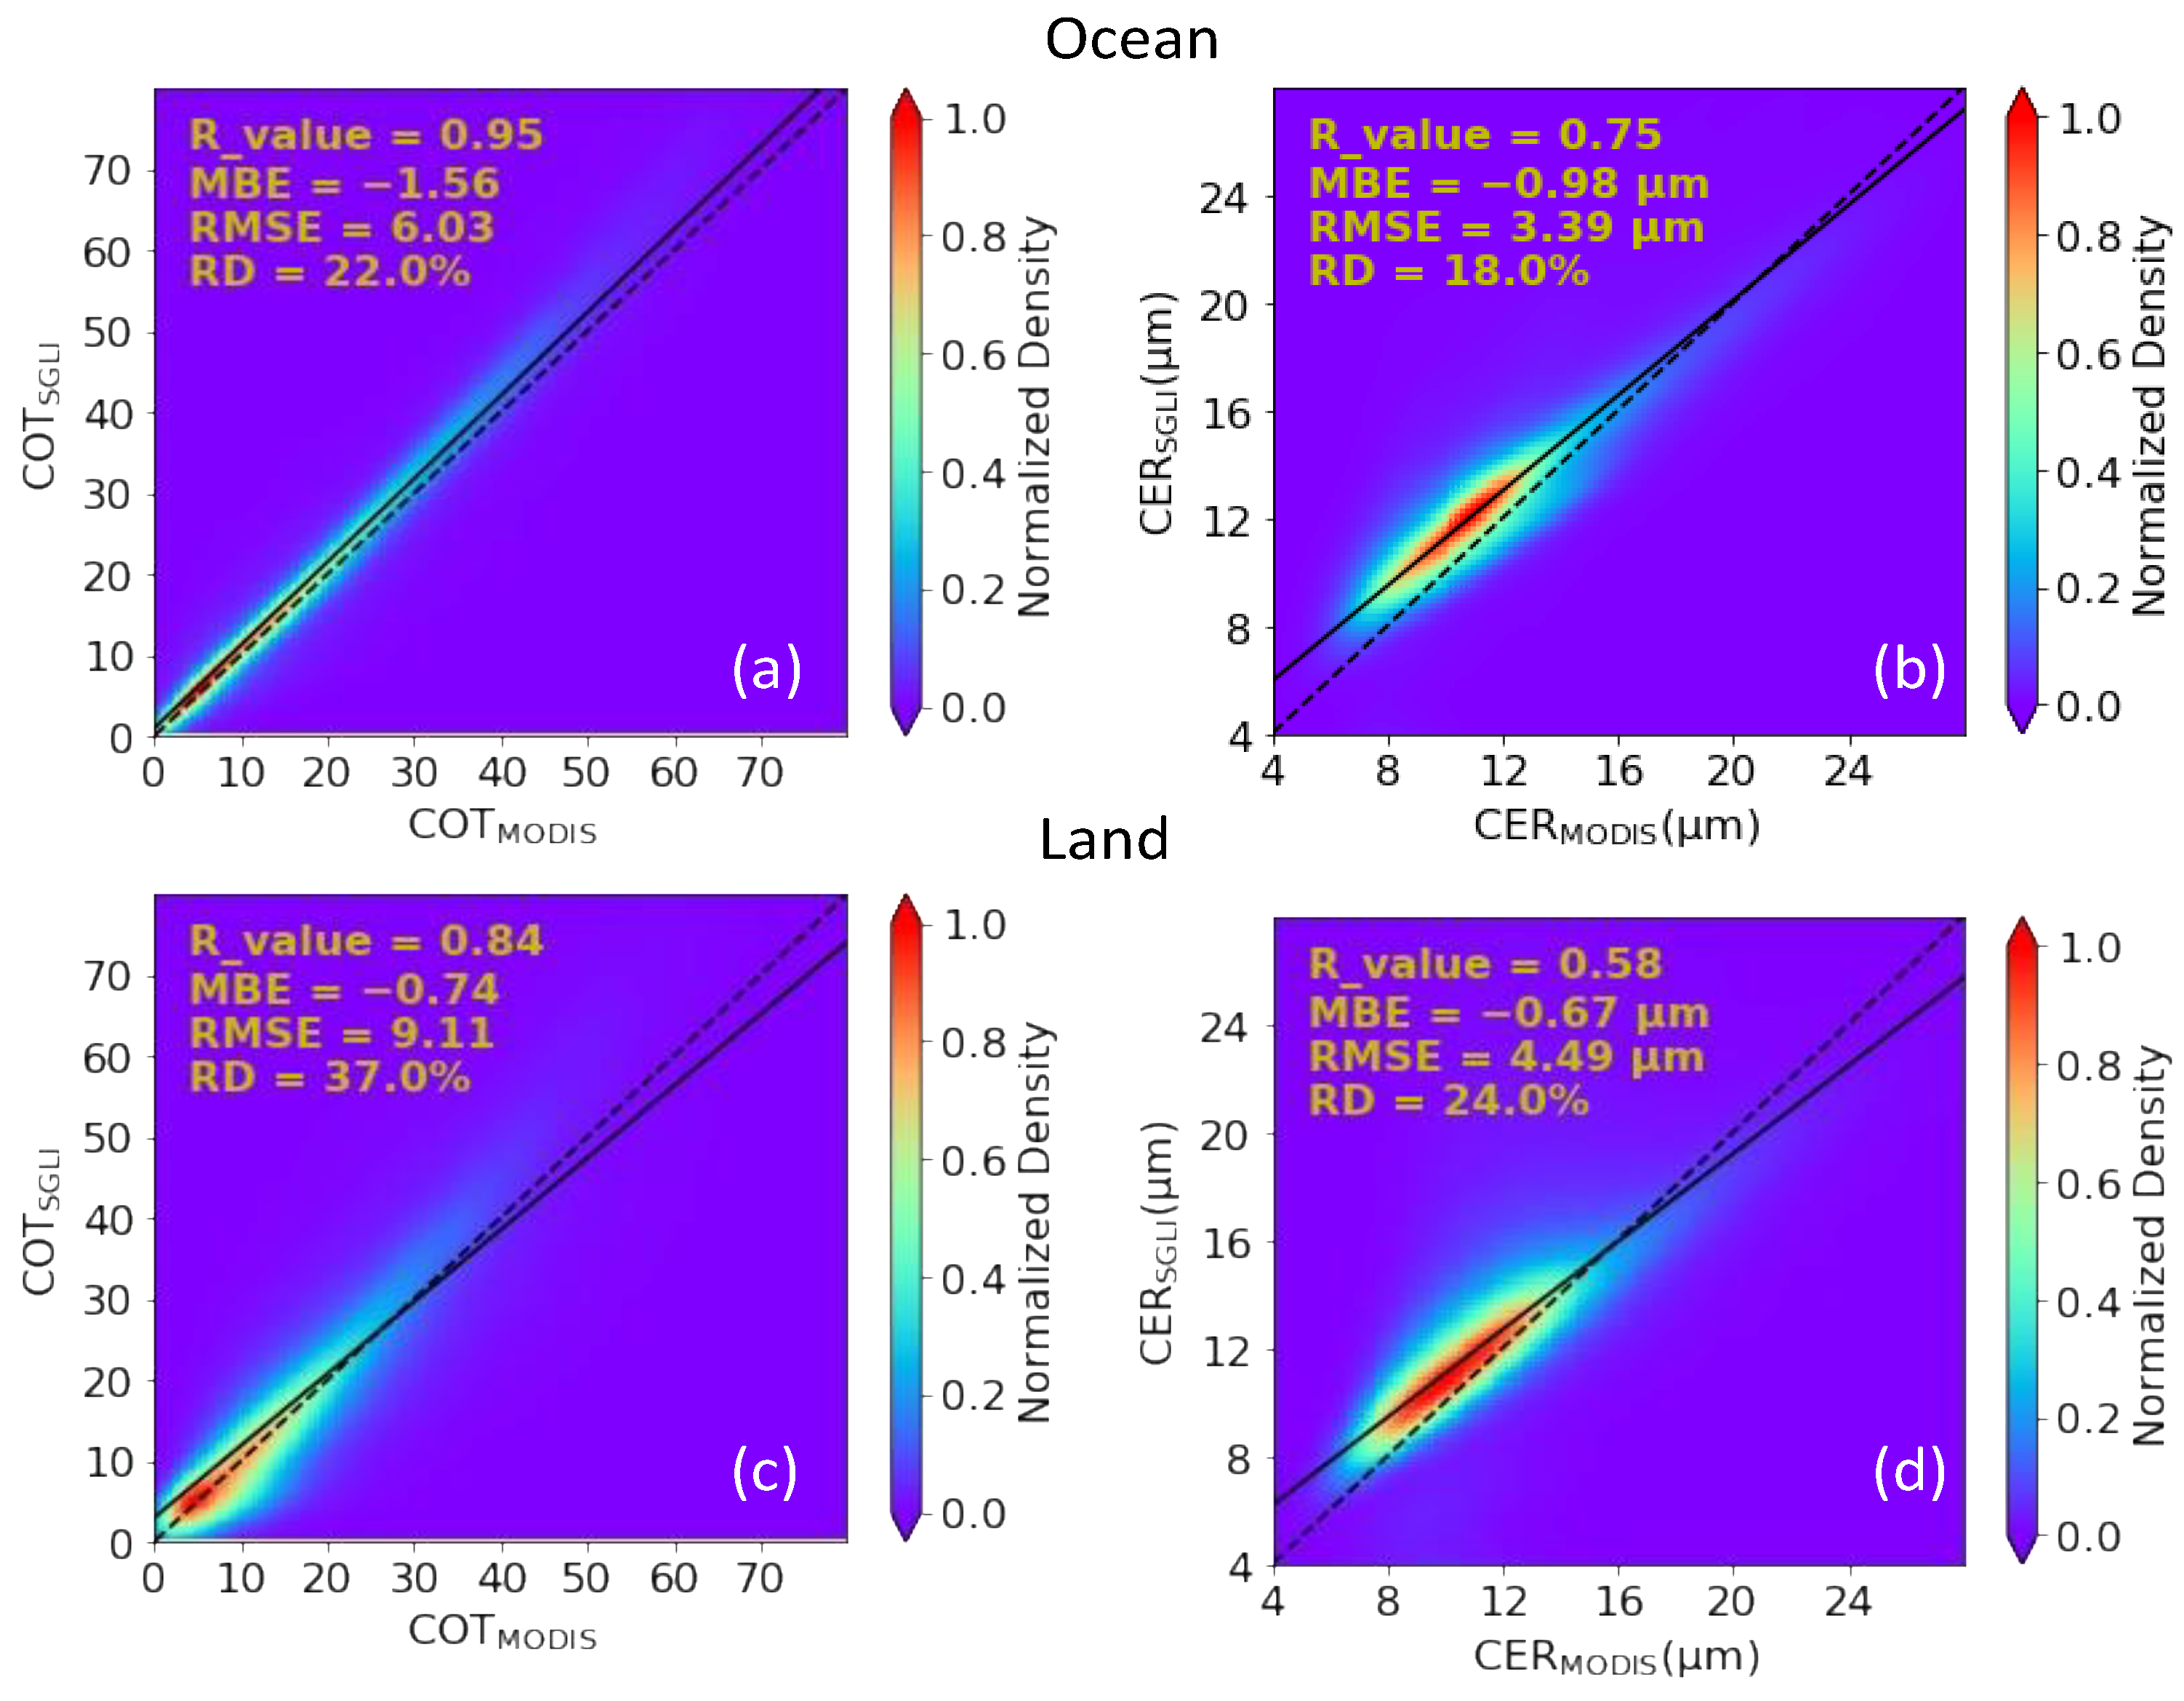
Figure 1. Comparison between MODIS and SGLI for (a) COT over ocean, (b) CER over ocean, (c) COT over land, and (d) CER over land for water cloud pixels.
Remotesensing 15 01075 g001
Figure 2. Frequencies of (a) COT over ocean, (b) CER over ocean, (c) COT over land, and (d) CER over land for MODIS (red) and SGLI (blue) for water cloud pixels.
Remotesensing 15 01075 g002
Figure 3. Comparison between MODIS and SGLI for (a) COT over ocean, (b) CER over ocean, (c) COT over land, and (d) CER over land for ice cloud pixels.
Remotesensing 15 01075 g003
Figure 4. Frequencies of (a) COT over ocean, (b) CER over ocean, (c) COT over land, and (d) CER over land for MODIS (red) and SGLI (blue) for ice cloud pixels.
Remotesensing 15 01075 g004
Figure 5. Statistical analyses (95 percentile, mean, 5 percentile, and RD values) of differences in (a) COT and (b) CER for water clouds and (c) COT and (d) CER for ice clouds between SGLI and MODIS for different values of MODIS COTs. For detail, see text.
Remotesensing 15 01075 g005
Figure 6. Statistical analyses (95 percentile, mean, 5 percentile, and RD values) of differences in (a) COT and (b) CER for water clouds and (c) COT and (d) CER for ice clouds between SGLI and MODIS for different values of solar zenith angle. For detail, see text.
Remotesensing 15 01075 g006
Figure 7. RD values as functions of absolute VZA difference between SGLI and MODIS sensors for (a) COT and (b) CER of water clouds and (c) COT and (d) CER of ice clouds.
Remotesensing 15 01075 g007
Figure 8. RD values as functions of absolute VAZ difference between SGLI and MODIS sensors for (a) COT and (b) CER of water clouds and (c) COT and (d) CER of ice clouds.
Remotesensing 15 01075 g008
Table 1. A quick look at MODIS and SGLI cloud products.
MODISSGLI
Product identificationLevel 2.0 (Collection 6.1)Level 2.0 (Version 3.0)
Wavelengths for retrievals of cloud properties0.66, 0.86, 1.24, 1.6, 2.1, and 3.7 μm1.05 and 2.21 μm
Wavelengths for detection of cloud phase7.3, 8.5, 11.0, 12.0 μm10.8 and 12.0 μm
Cloud-particle size distribution for retrieval of cloud propertiesGamma size distributionLog-normal size distribution
Single-scattering properties for water cloudsMie calculationMie calculation
Single-scattering properties for ice cloudsSeverely roughened aggregated columns modelVoronoi model
Table 2. Percentage distributions of MODIS-detected cloud phases for total counts of SGLI-detected water and ice cloud pixels.
SGLI Cloud PixelsMODIS Cloud Pixels
Water PhaseIce PhaseMixed PhaseUndetermined
Water phase (100%)92.1%3.2%0%4.7%
Ice phase (100%)23.5%58.1%0%18.4%
Table 3. Metrics for CER comparisons of ice clouds corresponding to data with MODIS CER ≤ 20 μm and MODIS CER > 20 μm.
MODIS CER ≤ 20 μmMODIS CER > 20 μm
OceanLandOceanLand
R_value0.430.280.230.31
MBE−7.25 μm−15.49 μm−1.34 μm−9.18 μm
RMSE13.08 μm26.42 μm16.66 μm20.97 μm
RD77.0%137.0%33.0%37.0%
Table 4. Metrics for COT and CER comparisons between MODIS and SGLI for water and ice cloud properties.
Comparison MetricsWater Cloud PixelsIce Cloud Pixels
COT ≤ 10COT > 10COT ≤ 10COT > 10
COTCERCOTCERCOTCERCOTCER
R-value0.410.530.780.610.690.380.680.51
MBE−1.17−0.79 μm−0.57−0.49 μm−0.44−13.78 μm1.26−6.66 μm
RMSE4.414.53 μm10.44.09 μm2.3126.37 μm15.0715.64 μm
RD60%25%28%22%41%78%26%36%
Disclaimer/Publisher’s Note: The statements, opinions and data contained in all publications are solely those of the individual author(s) and contributor(s) and not of MDPI and/or the editor(s). MDPI and/or the editor(s) disclaim responsibility for any injury to people or property resulting from any ideas, methods, instructions or products referred to in the content.