Abstract
One reason for soil degradation is salinization in inland dryland, which poses a substantial threat to arable land productivity. Remote-sensing technology provides a rapid and accurate assessment for soil salinity monitoring, but there is a lack of high-resolution remote-sensing spatial salinity estimations. The PlanetScope satellite array provides high-precision mapping for land surface monitoring through its 3-m spatial resolution and near-daily revisiting frequency. This study’s use of the PlanetScope satellite array is a new attempt to estimate soil salinity in inland drylands. We hypothesized that field observations, PlanetScope data, and spectral indices derived from the PlanetScope data using the partial least-squares regression (PLSR) method would produce reasonably accurate regional salinity maps based on 84 ground-truth soil salinity data and various spectral parameters, like satellite band reflectance, and published satellite salinity indices. The results showed that using the newly constructed red-edge salinity and yellow band salinity indices, we were able to develop several inversion models to produce regional salinity maps. Different algorithms, including Boruta feature preference, Random Forest algorithm (RF), and Extreme Gradient Boosting algorithm (XGBoost), were applied for variable selection. The newly constructed yellow salinity indices (YRNDSI and YRNDVI) had the best Pearson correlations of 0.78 and −0.78. We also found that the proportions of the newly constructed yellow and red-edge bands accounted for a large proportion of the essential strategies of the three algorithms, with Boruta feature preference at 80%, RF at 80%, and XGBoost at 60%, indicating that these two band indices contributed more to the soil salinity estimation results. The best PLSR model estimation for different strategies is the XGBoost-PLSR model with coefficient of determination (R2), root mean square error (RMSE), and ratio of performance to deviation (RPD) values of 0.832, 12.050, and 2.442, respectively. These results suggest that PlanetScope data has the potential to significantly advance the field of soil salinity research by providing a wealth of fine-scale salinity information.
1. Introduction
Soil salinization is a major cause of global land degradation, affecting approximately 1 billion hectares of arable land worldwide and posing a massive threat to ecosystems [1,2]. The effect of soil salinization is particularly pronounced in arid zones [3]. The excessive accumulation of soluble salts leads to a decrease in soil fertility, accelerates the decomposition of organic matter on the soil surface, hinders the uptake of soil water by vegetation, and threatens crop production, agricultural activities, and sustainability [4,5]. Cultivated land in oases is an important part of the carbon pool in arid areas and increasing soil salinization is decreasing the organic matter content, thereby contributing to the loss of soil carbon sinks [6]. As such, high-resolution soil salinity monitoring is vital for maintaining food yields, slowing land degradation, and achieving dual carbon goals.
Remote-sensing tools are an effective way to extract quantitative information about soil salinization. The Landsat series [7,8], Sentinel series [9], and other multispectral satellites are very effective for soil salinity monitoring. However, the low- and medium-spatial-resolution of remote-sensing images is still a limiting factor affecting soil salinity map accuracy, which limits their applicability to soil salinity assessment [10]. Han et al. used the results of Gaofen-2 images to estimate soil salinity. The results showed that the texture characteristics of high-spatial-resolution remote sensing can influence soil estimation [11]. When different remote sensing sensors are used to construct a soil salinity prediction model, the higher the spatial resolution, the better the correlation of the model [12]. Shi et al. found that the performance of estimated models from Sentinel-2 data with 10-m spatial resolution outperformed counterparts from Landsat-8 data with 30-m of spatial resolution. Higher spatial resolution reduces the number of mixed pixels, rendering more pure soil pixels for the model [13]. Therefore, high-spatial-resolution multispectral satellite monitoring may provide more accurate information on soil salinity.
Soil salinity studies are an application of spectral indices, based on the different spectral behaviors associated with ground target image pixels [14]. Salinized soils have higher spectral reflectance values than nonsaline soils, and the reflectance values of the soil spectrum increase with increasing soil salinity [15]. Salinity indices are the most effective way to assess and monitor soil salinity on a large scale [16], where indicators such as the soil salinity index (Int 1–2), Normalized Differential Salinity Index (NDSI), and Salinity Index (SI 1–5) are very effective for salinity mapping [17,18,19]. Also, there is a direct relationship between the Normalized Difference Vegetation Index (NDVI) and soil salinity; with increasing salinity, vegetation growth is inhibited and does not survive in the long term, so there are related studies using NDVI as an indicator of soil salinity [20,21]. Soil salinity indexes present a reliable theoretical basis for soil salinity trends. Significant progress has been made in estimating and mapping soil salinity by combining various spectral salinity indices [22].
The PlanetScope satellite data has brought unprecedented opportunities for high-precision and global-scale remote-sensing mapping by providing 3-m spatial resolution and near-daily revisit frequencies. PlanetScope Labs Inc. (San Francisco, CA, USA) launched the third-generation sensors PSB.SD (SuperDoves) in April 2019, using remote-sensing data from Sentinel-2 as a standard for improved spectral-band calibration to obtain more accurate spectral information [23]. The SuperDoves have eight spectral bands (coastal blue, blue, green I, green II, yellow, red, red-edge, and near infrared (NIR)) to capture image information. PlanetScope data are used to monitor rapid changes in land-surface statuses and processes, like fine-scale land-use development [24,25], agricultural expansion [26,27], forest change [28], glacial lakes mapping [29], and associated impact assessments. There are also aspects of crop growth prediction [30,31], quantifying delicate phenological plants [32], characterizing surface carbon [33,34], etc. In summary, PlanetScope is a powerful new tool for accurate surface monitoring. Salinity monitoring is also a vital issue for surface monitoring. However, it remains unclear whether PlanetScope satellites can effectively monitor and map surface soil salinity. Therefore, the practical advancement of PlanetScope satellites may present a new opportunity for high-precision salinity monitoring.
Previous research into the bands of PlanetScope remote-sensing satellites was limited to the fusion of data in the four bands of blue, green, red, and near-infrared [24,29]. The SuperDove satellites have eight bands, among which the yellow and red-edge bands differ from other satellites. The current spectral index is biased toward visible and near-infrared bands [35] than the yellow and red-edge spectral bands. Muller and van Niekerk [36] used WorldView-2 data to derive a better performance of the yellow band index compared to the standard salinity index and NDVI, demonstrating the monitoring capability of the yellow band. As such, the introduction of the yellow and red-edge bands into the spectral index of soil salinity characterization provides an opportunity to further explore the salinity monitoring potential of the PlanetScope remote-sensing satellites.
To fill in the high-resolution soil salinity monitoring gaps, we try to answer this question: is the PlanetScope data applicable to soil salinity monitoring in inland drylands? This study has the following four aims: (1) to clarify the relationship between waveband information from the PlanetScope satellites and soil salinity; (2) to develop a new PlanetScope salinity index to validate their salinity monitoring capability; (3) to construct an optimal information retrieval model by comparing the estimated nuanced readings of different partial least-squares regression (PLSR) models; and (4) to monitor and map soil salinity in the arid inland region of Xinjiang, China.
2. Materials and Methods
2.1. Study Area
This study selected the Ogan-Kucha River Oasis (abbreviated here as Weiku Oasis), located in the north-central Tarim Basin at the southern foot of the Tianshan Mountains in the Aksu region of southern Xinjiang (Figure 1). The oasis includes Kuche, Shaya, and Xinhe counties. The geographical coordinates are from 41°06′N to 41°38′N and 81°26′E to 83°17′E, encompassing a typical and complete premountain alluvial fan and plain. The area has a typical continental, warm temperate, arid climate with hot summers and little rain, a cold and dry winter, an annual average temperature of 10.5–14.4 °C, a multiyear average daily difference of 14.7 °C, and an annual > 10 °C accumulated temperature of 4208 °C. The annual average sunshine hours are 2789–3000 h, yearly evaporation is 2420.23 mm, and the annual average precipitation is 43.1 mm. The evaporation–precipitation ratio is approximately 54:1 [37]. Natural vegetation is dominated by Populus euphratica, Tamarix chinensis, Phragmites australis, Alhagi sparsifolia, Suaeda glauca, and Kalidium foliatum. The crops are primarily wheat, cotton, and maize, which are distributed in the inner part of the oasis where the irrigation and drainage systems are relatively well developed.
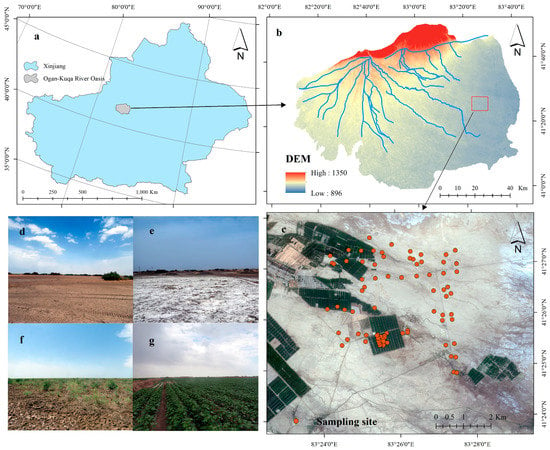
Figure 1.
Location of the study area. (a) The sampling area is in Xinjiang, China. (b) The study location is at the intersection of farmland and desert in the Ogan-Kucha River Oasis, with Digital Elevation Model (DEM) data in the background. (c) Locations of sampling sites. (d–g) The main surface types at the sampling sites, in order of preference, are desert, salt crust, desert vegetation, and cotton.
2.2. Data Sources
PlanetScope Labs is a remote-sensing satellite data company founded in 2010 in San Francisco by former U.S. National Air and Space Administration (NASA) scientists. The company successfully developed microsatellite swarm technology for the first time, creating the only global, high-resolution, remote-sensing satellite system with full high-frequency coverage and able to provide the most inexpensive, fast, and applicable remote-sensing satellite data acquisition system. To date, PlanetScope Labs has launched 122 satellites, forming a constellation of satellites that acquire 3–5-m resolution imagery daily with near-daily revisiting frequency. The satellites are characterized by frequent coverage, high spatial resolution, and standard spectral resolution.
The PlanetScope satellite data comes with eight bands that are orthorectified, geometrically and radiometrically corrected, and atmospherically fixed [23], among other operations. The waveband information of the PlanetScope satellite is shown in Table 1. The spatial resolution of the satellite is 3 m, the width of an imaging pass is 24 km, the revisit period is 1–2 days, and the transit date of the product used in this work is for 24 July 2021.

Table 1.
Spectral bands of PlanetScope sensors.
2.3. Field Sampling and Data Acquisition
A field soil information survey was conducted in the study area between 20 July to 25 July 2021. Based on land use/land coverage (LU/LC), soil types, soil surface characteristics, previous field sampling experience, and accessibility to the potential sampling sites, a total of 84 representative sampling points were selected in agricultural fields and deserts that meet the spatial resolution of the satellites. (1) Field sampling: A portable global positioning system (GPS; LT500T, CHC Navigation Technology Co. Ltd., Shanghai, China) was used to record the exact location of the center point of each sample. A five-point composite sample (center point and four corners) was taken and mixed in the field to a depth of 10 cm, for a mixed sample of approximately 500 g. The collected soil samples were placed in sealed waterproof bags and labeled for subsequent chemical analysis. (2) Laboratory sample preparation: Samples were air dried, ground, homogenized, and passed through a 2-mm sieve in the laboratory. Then, to establish a 1:5 soil-to-water ratio, 20-g of soil and 100-g of distilled water were thoroughly mixed for at least 30 min. (3) Laboratory experimental measurements: The leachate was extracted to measure electrical conductivity (EC) via a digital multiparameter measuring apparatus (Multi 3420 Set B, WTW GmbH, Weilheim, Germany) equipped with a composite electrode (TetraCon 925) at room temperature (25 °C).
2.4. Spectral Salinity Indices
Some widely used indices for accurate reflection of the spatial distribution characteristics of soil salinity assessment are listed in Table 2. The satellite’s green band has two parts, labeled as G1 and G2 in this work. To document the novel spectral monitoring capabilities of the yellow and red-edge bands, we used two bands (B5 and B7) to construct new spectral indices and calculated various combinations from these two new bands to generate potential soil salinity indices for estimating EC. The specific way to name the Salinity index (S1) is as follows: when the red-edge band is used to replace the red band, for example, it is named RS1; when the yellow band is used to replace the blue band, it is named YBS1. Due to this construction rule, 22 new red-edge spectral indices and 42 new yellow spectral indices are constructed in this work (Table 3 and Table 4).

Table 2.
Reference spectral salinity indices.

Table 3.
The newly proposed red-edge spectral indices.

Table 4.
The newly proposed yellow spectral indices.
2.5. Modeling Strategy
PLSR is a statistical method for finding a linear regression model by projecting the predicted and observed variables into a new space [41]. It is one of the most widely used regression strategies for spectral modeling [42,43]. PLSR can simultaneously model multiple predicted dependent variables, thereby reducing dimensionality and avoiding multicollinearity [44]. PLSR combines the advantages of principal component analysis, typical correlation analysis, and multiple linear analysis and is more suitable for small samples than traditional multiple linear regression (MLR) [45]. This study used PLSR analysis to assess the potential relationships among dependent and independent variables. Still, considering the PLSR model’s uncertainty, errors occurred in predicting the predictors [46]. Therefore, band feature optimization, which can reduce the uncertainty and error, is critical to the performance of the PLSR model. For this reason, three strategies with different options for band importance screening are established in this work [47]: Boruta feature selection, random forest (RF) classification, and extreme gradient boosting (XGBoost).
2.5.1. Boruta Feature Selection
The Boruta algorithm generates three random shadow feature attributes by mixing and washing the original variable attribute values, thus reducing the covariance with the independent variables [9]. Subsequently, RF regression is performed on the predicted values, combining the three shadow attribute values. By setting the maximum number of iterations, each iteration checks whether each real feature value has higher importance than the best-shaded feature attribute value, filters out the important and unimportant feature values by constant comparison, and determines the Z-score as the importance of each variable. The Boruta feature selection method selects the set of all features relevant to the dependent variable and thus provides a more comprehensive understanding of the factors influencing the dependent variable [48].
2.5.2. Random Forest (RF) for Waveform Selection
Breiman [49] developed RF to aggregate ideas and solve classification and regression problems. RF is an integrated machine-learning algorithm that seems practical and, therefore, is increasingly popular in variable selection [50]. In the RF framework, the importance of variables is influenced by two main parameters: the size of the subset of input variables (mtry) and the number of trees in the forest (ntree). The value of ntree is set to 5 in this study, based on repeated tests.
2.5.3. Extreme Gradient Boosting (XGBoost)
To improve model interpretation and estimation accuracy, it is crucial to select sensitive wavelengths associated with the target parameters [51]. This study used the XGBoost method for feature selection. XGBoost is a variant of gradient-boosting decision trees that evaluates the importance of boosting trees with three parameters (gain, frequency, and coverage) [52,53]. The gain parameter describes the importance of the tree branching features, the frequency parameter captures the number of elements in the constructed tree, and the coverage parameter represents the relative value of the feature observations.
2.6. Model Evaluation
In this study, Boruta and RF algorithm implementations were carried out using the R platform, and XGBoost was implemented through Python 3.7. To determine the ideal number of potential variables when using PLSR, leave-one-out cross-validation (LOOCV) was performed to prevent overfitting or underfitting the data, which may produce models with poor performance [54].
To evaluate the performance of the calibrated model, several statistical parameters were compared between the measured and model estimates based on independent validation sets: coefficient of determination (R2), root mean square error (RMSE), and the ratio of prediction to deviation (RPD). According to the classification guidelines for inverse models outlined in [55], these models can be classified into three categories: class A (RPD ≥ 2.00) is the most efficient model with reliable predictive power; class B (1.40 ≤ RPD < 2.00) is a good model that usually has adequate results; and class C (RPD ≤ 1.40) is an unreliable model. Typically, the most effective model features have high R2 and RPD values and low RMSE values.
3. Results
3.1. Salinity Data Statistics
Figure 2 shows the characteristics of the EC statistical distribution of soil samples in the study area. The range of EC was 0.35–124.90 dS m−1, with a mean of 38.04 dS m−1, a standard deviation of 33.13 dS m−1, and a coefficient of variation of 0.87, which indicates moderate variation. The results show that the soil salinity in this area is relatively high; it is greatly affected by salt and the overall salinization is relatively serious. In this paper, the Kennard–Stone (K–S) algorithm is selected to randomly divide all soil samples into a training set (t) and verification set (v) to ensure the stability of the model. Sets (t) and (v) were separated in the ratio of approximately 7:3, where set (t) had 58 soil samples and set (v) had 26 soil samples. As shown in Table 5, the distributions of sets (t) and (v) are like those of the entire data set; the soil salinity of both datasets is representative of the whole dataset and can be used to calibrate the model to generate more satisfactory predictions.
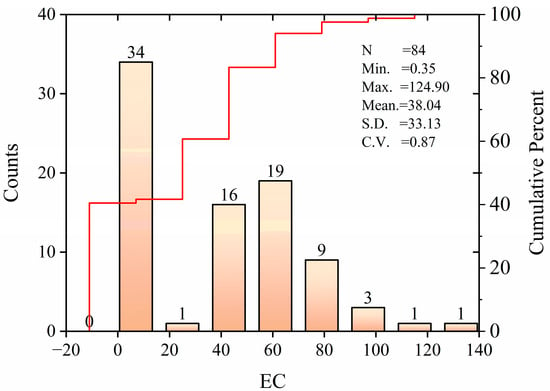
Figure 2.
A statistical plot of the actual measured soil salinity data.

Table 5.
Descriptive statistics of the soil EC data.
As shown in Figure 3, different soil salinities showed similar spectral shapes and amplitudes of spectral reflectance curvature, which increased with increasing soil salinity. Soil spectra showed significant reflectance fluctuations in the visible (VIS) and near-infrared (NIR) range, are relatively flat in the 400–600 nm and 650–713 nm ranges, and exhibit sharp increases in reflectance values at 600–620 nm and 845–885 nm. The first peak was observed in the yellow band followed by a maximum in the NIR band. The spectral difference of 0.68 dS m−1 saline soil is not obvious in the NIR band. The results tentatively determine that the yellow band and NIR band reflectances can distinguish soil samples with different salinities and different sensitivities to salinity. This preliminary analysis provides the basis for the subsequent satellite index development.
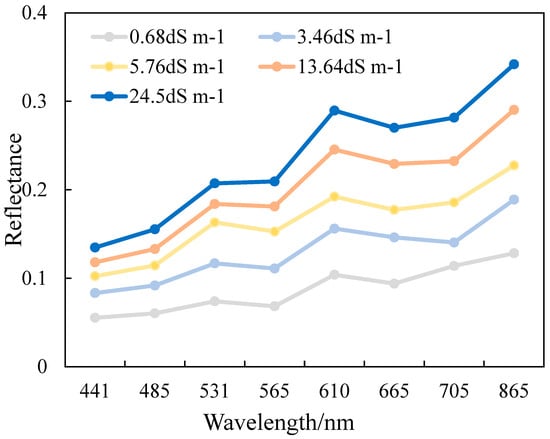
Figure 3.
Reflectance spectra curves of soils with different electrical conductivity (EC) values in the study area.
3.2. Determining the Optimal Band of PlanetScope Data for EC Salinity
To further explore the salinity estimation potential of PlanetScope satellite data, a single-band linear inversion model was constructed to quantify local soil salinity (Table 6). The results show that the NIR band has the most correlation with soil salinity (R2 = −0.761), followed by the red band and the yellow band. Second, the calibration set has different degrees of improvement shown by R2 and RMSE compared to the validation set, both of which had the best performance in the NIR band (0.579 and 21.381 and 0.716 and 17.103, respectively). The best single band is NIR, which produces a ratio of performance to interquartile distance (RPIQ) of 2.722. Therefore, the single-band results can meet the modeling requirements but still cannot provide effective soil salinity dynamic monitoring. As such, the feasibility of the spectral index needs to be further verified.

Table 6.
Relationships between PlanetScope bands and EC data in the study area (dS m−1).
Third, the relationships among soil salinity in the study area and the existing salinity index (Figure 4), the new red-edge salinity index, and the new yellow salinity index were compared. The indices of YRNDSI and YRNDVI are the best in the Pearson correlation (r) range of 0.050–0.77. They are optimized with correlations of 0.78 and −0.78. Both optimal results were obtained by replacing the red band with the yellow band; introducing the yellow band enhanced the index’s sensitivity to soil salinity because salinity in this region is more sensitive to the yellow band. Taking NDSI and NDVI as examples, when the red-edge band replaced the red band, the sensitivity to soil salinity was not enhanced. The correlations decreased by 0.005 and 0.012 for NDSI and NDVI, respectively, which may be because some vegetation in the region affected the sensitivity of the red-edge band to salinity.
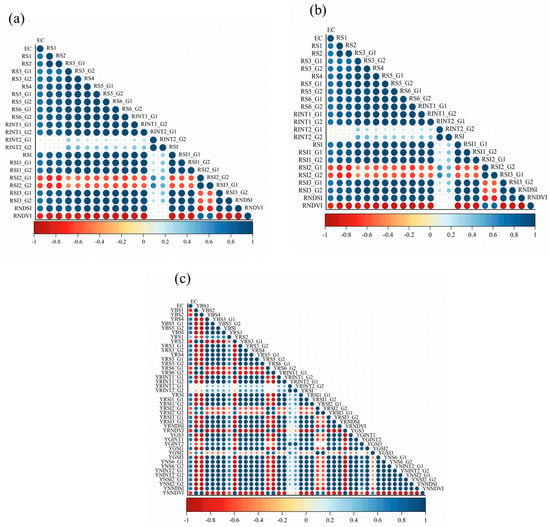
Figure 4.
Relevance of the correlation between electrical conductivity (EC) and different soil salinity indices. (a) shows the Pearson correlation between the original salinity index and soil salinity. (b) shows the Pearson correlation between the new red-edge salinity index and soil salinity, and (c) shows the Pearson correlation between the new yellow-edge salinity index and soil salinity.
3.3. Importance Screening of Spectral Indices
To explore the performance of these satellite data in soil salinity monitoring, this work applied 8 band indices, 22 original salinity indices, 22 new red-edge band salinity indices, and 42 new yellow band salinity indices totaling 94 spectra and 3 different algorithmic features to preferentially select salinity indices with high importance for PLSR model construction.
The results of the Boruta algorithm show that 20 spectral indicators are important, 14 are uncertain, and 60 are unimportant among the 94 salinity indicators (Figure 5). Among them, the band indicators are essential for B8 and B5, and the importance of B8 is greater than that of B5, indicating that the NIR band (B8) has the most vital relationship with soil EC. This finding confirms the higher sensitivity of EC within the NIR band, followed closely by the yellow band (B5). There are two original salinity indicators, NDVI and S6_g2, six new red-edge and ten new yellow band salinity indicators. The newly constructed spectral indices can accurately indicate soil salinity, as the newly constructed salinity indices have a significant share of 80%. The percentage of yellow band salinity indicators is 50%, and the results show that the yellow band (B5) plays a vital role in EC.
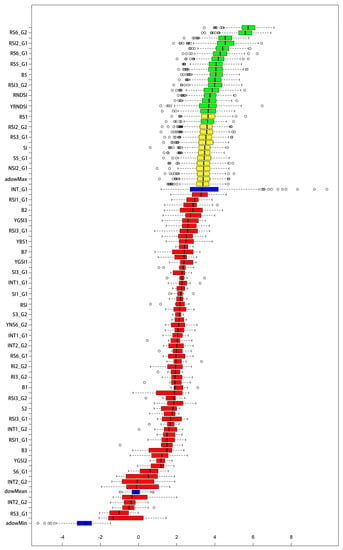
Figure 5.
Boruta’s algorithm determines the importance of the existing and new salinity indexes. The blue variables are shaded features, the green variables are essential, the yellow ones are undetermined, and the red ones are irrelevant.
We obtained the importance ranking of each variable of the EC-related salinity index through importance screening with the RF algorithm. Considering the results of the Boruta algorithm, we selected the importance of the first 20 spectral indicators of the RF algorithm to keep the input metric data consistent for the PLSR model that follows. The number of original salinity indicators remains the same at two, but the bands have changed to S3-G2 and S6-G2. There are six new red-edge band salinity indicators and ten new yellow band salinity indicators. The importance ratio of the newly constructed indicators is 80%. The results are consistent with the Boruta algorithm, which again characterizes that the freshly-built spectral indices are highly sensitive to soil salinity. Please see Figure 6 for details.
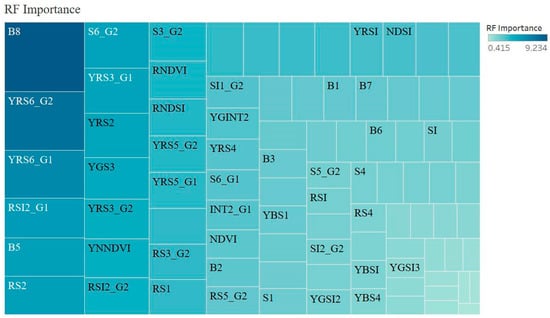
Figure 6.
Random forest (RF) algorithm to determine the importance of the existing salinity index and the new salinity index.
The feature selection function of the XGBoost algorithm considers the metrics with the highest importance values, and the RPD of the XGBoost model in Python 3.7 is 2.047. The results indicate that this model is reliable and valid (Figure 7). To be consistent with the first two algorithms, we chose the top 20 spectral indicators in the XGBoost algorithm for modeling. The importance screening results of the band indicators still point to B8 and B5, but unlike the previous two algorithms, B5 outperforms B8 in terms of importance. Second, the number of original spectral indices is six, there are eight new yellow band salinity indices, and four new red-edge band salinity indices. Although the number ratio is not consistent with those of the first two algorithms, the importance ratio of the newly constructed spectral indicators is still high at 60% overall. Therefore, we consider that the newly constructed spectral indicators are highly sensitive to soil salinity, and the yellow band is ranked second in importance in this algorithm. We think that the yellow band is essential to the sensitivity of salinity.
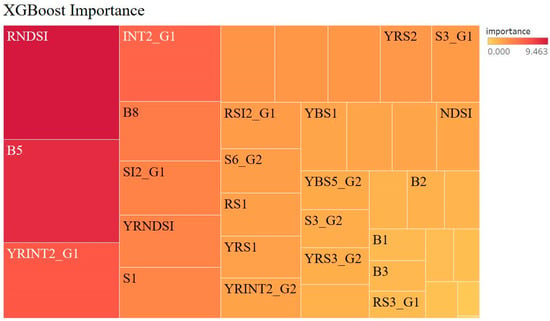
Figure 7.
Extreme gradient boosting (XGBoost) algorithm to determine the importance of the existing salinity index and the new salinity index.
3.4. Model Estimation and Comparison
We applied all 94 spectral variables and the top 20 important spectral variables selected by the different algorithms to calibrate the PLSR model for salinity estimation. The performance of the PLSR model based on the different variable selection strategies is shown in Table 7. Specifically, the model’s performance for estimating EC using the XGBoost algorithm was the best and had the best predictive ability. The XGBoost-PLSR model (R2v = 0.832, RMSEv = 12.05 and RPD = 2.44) generated the most reliable estimates. The XGBoost-PLSR model performance was 4.65% and 2.84% higher than that of the Boruta-PLSR and RF-PLSR, respectively, in terms of R2v. Boruta-PLSR and RF-PLSR have similar performances, which is to be expected. The scatter plot of soil salinity from the measured and predicted values shows that the XGBoost-PLSR model outperforms the other two models, and its results are closer to the 1:1 fit line, indicating the best fit (Figure 8). In summary, the XGBoost-PLSR model has the ideal performance of linking spectral information and soil salinity.

Table 7.
Comparisons of partial least-squares regression (PLSR) models of soil salinity inversion based on different modeling strategies (dS m−1).
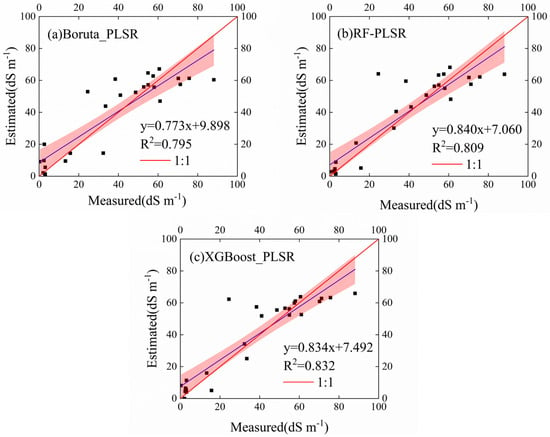
Figure 8.
Scatter plots of the measured versus estimated electrical conductivity (EC) using different models with various modeling strategies: (a) random forest partial least-squares regression (RF-PLSR), (b) Boruta-PLSR, (c) extreme gradient boosting (XGBoost)-PLSR.
3.5. Soil Salinity Maps
We used PLSR models with three strategies (Boruta, RF, and XGBoost) to generate maps of the spatial distribution of soil salinity in the study area. We found that the three strategies had sound mapping effects on soil salinity by comparing Figure 9. The trends of soil salinity were generally similar across the three strategies, with the low soil salinity areas concentrated mainly in the interior of the oasis and the high soil salinity focused primarily in the desert area. The XGBoost-PLSR model produced the best model accuracy with predicted soil salinity intervals in the range of 0–125 dS m−1, matching the measured soil salinity data. The Boruta-PLSR and RF-PLSR models were slightly less accurate, with predicted values in the ranges of 0–91 dS m−1 and 0–95 dS m−1, respectively. Second, the XGBoost-PLSR model better reflects the finer variations of soil salinity and the areas of low, medium, and high soil salinity are more clearly defined, making it easier to observe the spatial variations of soil salinity. Overall, the spatial distribution of soil salinity was better predicted based on the XGBoost-PLSR model, showing more detailed variations in soil salinity distribution.
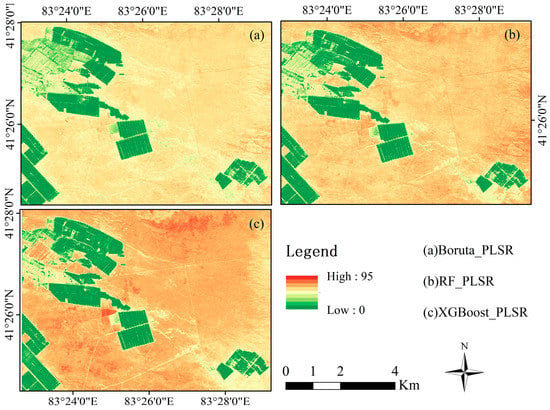
Figure 9.
Digital soil electrical conductivity (EC) spatial distribution map.
4. Discussion
Highly accurate mapping is essential for monitoring soil salinity status. In this study, we evaluated the monitoring capability and mapping effectiveness of high-spatial-resolution PlanetScope satellite data for monitoring soil salinity in inland drylands. The results show that the soil salinity predicted by the XGBoost-PLSR model agrees well with the salinity derived from ground observations. Additionally, it is possible to map the spatial variability of soil salinization at the 3-m fine scale. Overall, these results demonstrate the significant potential of using PlanetScope imagery to characterize soil salinization levels in inland drylands.
4.1. Influence of Spatial Resolution
The influence of remote-sensing image element scale is an essential issue in geological research, and the high-precision spatial scale is directly proportional to the model’s accuracy [7]. Therefore, the remote-sensing multispectral image element scale plays a vital role in the inversion accuracy of soil salinization. For example, in this study, PlanetScope remote-sensing satellite data are used for soil salinity estimations in the assessed area. We conclude that the spatial resolution of this satellite (3-m) improves the accuracy of remote-sensing estimation when it matches the corresponding ground sample observations (1-m) with fewer mixed pixels [42,56]. The Landsat series with 30-m spatial resolution has more mixed soil–vegetation pixels and lower estimates of soil salinity when matching ground-truth point samples [57,58]. Sentinel-2 is more effective than the Landsat series for monitoring soil salinity, mainly due to the finer spatial resolution (10-m) to identify narrower patches of bare salt soil [59]. Additionally, when the model-estimated soil salinity was compared with the measured soil salinity (Figure 8), the model accuracy of PLSR with the three different strategies was 0.795, 0.809, and 0.832, respectively. This was better than both the Sentinel-2 and Landsat series in terms of estimation results. These observation results produce an R2 of approximately 0.48 for the Landsat series [60] and 0.64 for Sentinel-2 [61] under the same conditions, with improvements in accuracy of more than 30% and 15%, respectively. Previous studies have shown that multispectral imaging (MSI) performs better than operational land imaging (OLI) because of the finer spatial resolution of MSI [7]. Therefore, more accurate salinity estimation requires finer spatial resolution, and higher spatial and temporal resolution is also an essential direction for salinity monitoring in future studies.
4.2. Band Reflectance and Spectral Index
Reflectance is the most important characteristic of a satellite band and determines the inversion potential. In this work, PlanetScope data for soil indicated that the NIR band and the red-edge band were most correlated with the soil surface salinity, with R2 values of 0.716 and 0.694, respectively, and their modeling accuracy was high. However, the single-band R2 of Landsat data with soil salinity ranges from 0.21–0.56 [62], and the single-band R2 range of Sentinel-2 is in the interval of 0.14–0.39 [44,58].This show that both single-band models have low accuracy [63]. Additionally, previous studies have shown that the sensitive bands for salt are mostly the VIS, NIR, and short-wave infrared (SWIR) bands of Sentinel-2 [43], where the spectral characteristics of the SWIR band are influenced by the chemical composition of salt in the soil [63,64]. However, the satellites used in this study did not have SWIR so such an exploration could not be carried out. In this study, we found that the introduction of the yellow band enhanced the sensitivity of the salinity index to soil salinity [65], which may be attributed to the absorption of yellow light by the vegetation in the region and the high reflectance of yellow wavelengths by the salt weathering in the soil [2,36,66,67]. The introduction of the red-edge band did not enhance the sensitivity to soil salinity. However, the R2 decreased by 0.005 and 0.012. This may be due to the vegetation in the oasis farmland disturbing the sensitivity of the red-edge band [68]. The contribution of the new salinity index to the PLSR model is decisive. Among the three different PLSR modeling strategies, we observed that the newly constructed yellow salinity indicators had importance percentages of 50%, 50%, and 40%, and estimated R2 values of 0.795, 0.809, and 0.832, respectively. These findings are like those of Abood et al. [66]. The monitoring of salinized areas is improved when the red band is replaced by the yellow band. In summary, the PlanetScope remote-sensing satellite spectrum has more advantages in high-precision mapping in the case of limited scope.
4.3. Soil Salinity Inversion Model
This study shows that soil salinity in arid regions was successfully monitored and mapped by the PLSR model combined with PlanetScope data to calculate various salinity spectral indices. Yu et al. can effectively optimize the exploration of soil salinity through an improved PLSR algorithm [69]; Sidike et al. [70] found that PLSR was superior to stepwise multiple regression (SMR) in restoring soil salinity. Current related scholars using SVR, RF, CNN, and other machine learning algorithms to study soil salinity can improve the accuracy of the model [18,71,72]. After screening the best bands, Zhang et al. used three modeling methods– PLSR, Cubist, and ELM–whose ELM modeling method outperformed PLSR [73], However, Peng et al. showed satisfactory accuracy results when estimating EC using PLSR and Cubist models [14]. Zhu et al. found that RF had better predictive power than PLSR when estimating UAV salinity potential [74]. The results of the PLSR model derived from PlanetScope data in this study showed a good correlation with ground-monitored soil salinity. However, this comparison shows that the different modeling approaches need to be more consistent in their modeling accuracy, which needs to be addressed in the next steps of the work. This content was added to the original article after line 448, so please review it again.
4.4. Research Limitations and Future Work
There are uncertainties in the accuracy of PlanetScope-based soil monitoring. This study demonstrates how PLSR can combine high-spatial-resolution remote-sensing data and various spectral indices to estimate and map soil salinity in arid regions successfully. However, soil spectral characteristics are not only affected by salinity, but also interfered with by soil texture [75], vegetation cover [73], and soil water content [14], and the spectral information of this satellite data is limited. The combination with data such as those from Sentinel-2A should be considered to enhance the spectral information in the future. Environmental variables, such as topography, vegetation, and soil moisture, must also be considered. The spatial variability of soil salinity is considered to integrate the accuracy of soil salinity estimation.
The experimental group had limited experimental conditions because the sampling cost was high, so this study did not carry out a time-series analysis. In a following study, we will combine time-series PlanetScope data and measured soil salinity to accurately estimate temporal soil salinity and provide theoretical support for the high-precision estimation of soil salinity in arid zones.
5. Conclusions
Soil salinization mapping with high spatial resolution is of great significance for fine-scale monitoring of salinization. In this study, the recent emergence of PlanetScope data provides an unprecedented opportunity to monitor the delicate expression of soil salinity. Here, we identify the sensitive bands of PlanetScope satellite data for soil salinity and develop a new PlanetScope spectral salinity index combined with measured soil salinity data to assess the monitoring of salinity in oases in the Xinjiang arid zone. The yellow band of PlanetScope satellite data has a higher sensitivity to soil salinity. Among the three algorithms for feature preference (Boruta, RF, and XGBoost), we observe that the newly constructed yellow and red-edge band indices are advantageous for soil salinity estimation, with weights of 80%, 80%, and 60%, respectively. The analysis showed that the new salinity index contributed more to soil salinity. We found that PlanetScope satellites had soil estimation and mapping capabilities for soils in different strategy models, with the best-performing XGBoost-PLSR model R2, RMSE, and RPD values of 0.832, 12.050, and 2.442, respectively, all of which indicated that salt-affected soils dominate in the study area. The model generates 3-m resolution EC maps with more soil salinization details than medium-resolution maps. The study verifies that the model can be used to monitor soil salinization in arid or semi-arid regions. Furthermore, although our current study has not yet been implemented, we intend to use PlanetScope time-series data for soil salinity mapping at different periods in the future. We believe that we can further reduce uncertainties and improve the accuracy of predictions. This work provides an essential reference for developing strategies to manage and improve soil salinity in Xinjiang for sustainable oasis development and continued food security. Meanwhile, Planetscope has gradually become an essential part of earth imaging remote sensing, giving full play to the significant advantages of high precision, effectively deciphering the ground features, and promoting the rapid development of mapping, agriculture, environmental monitoring, and other industries.
Author Contributions
Conceptualization, J.T. and J.D.; methodology, J.T. and L.H.; software, J.T. and Y.L.; validation, Z.Z., R.W. and J.W.; formal analysis, J.T.; investigation, L.H.; resources, J.D.; data curation, S.Q. and X.W.; writing—original draft preparation, J.T.; writing—review and editing, J.D. and X.G.; visualization, J.T.; supervision, J.D.; project administration, Z.Z.; funding acquisition, J.D. All authors have read and agreed to the published version of the manuscript.
Funding
This research was funded by the Key Project of Natural Science Foundation of Xinjiang Uygur Autonomous Region (No.2021D01D06), the National Natural Science Foundation of China (No.41961059), Social Science Foundation of Xinjiang Autonomous Region (19BJL030), the Excellent Doctoral Innovation Project of Xinjiang University (XJU2022BS053).
Data Availability Statement
The authors do not have permission to share data.
Acknowledgments
We are sincerely grateful to the reviewers and editors for their constructive comments on the improvement of the manuscript.
Conflicts of Interest
The authors declare that they have no known competing financial interests or personal relationships that could have appeared to influence the work reported in this paper.
References
- Gorji, T.; Sertel, E.; Tanik, A. Monitoring soil salinity via remote sensing technology under data scarce conditions: A case study from Turkey. Ecol. Indic. 2017, 74, 384–391. [Google Scholar] [CrossRef]
- Metternicht, G.I.; Zinck, J.A. Remote sensing of soil salinity: Potentials and constraints. Remote Sens. Environ. 2003, 85, 1–20. [Google Scholar] [CrossRef]
- Litalien, A.; Zeeb, B. Curing the earth: A review of anthropogenic soil salinization and plant-based strategies for sustainable mitigation. Sci. Total. Environ. 2020, 698, 134235. [Google Scholar] [CrossRef] [PubMed]
- Hassani, A.; Azapagic, A.; Shokri, N. Global predictions of primary soil salinization under changing climate in the 21st century. Nat. Commun. 2021, 12, 6663. [Google Scholar] [CrossRef]
- Wu, J.; Vincent, B.; Yang, J.; Bouarfa, S.; Vidal, A. Remote Sensing Monitoring of Changes in Soil Salinity: A Case Study in Inner Mongolia, China. Sensors 2008, 8, 7035–7049. [Google Scholar] [CrossRef]
- Liu, X.; Wang, S.; Zhuang, Q.; Jin, X.; Bian, Z.; Zhou, M.; Meng, Z.; Han, C.; Guo, X.; Jin, W.; et al. A Review on Carbon Source and Sink in Arable Land Ecosystems. Land 2022, 11, 580. [Google Scholar] [CrossRef]
- Wang, J.; Ding, J.; Yu, D.; Ma, X.; Zhang, Z.; Ge, X.; Teng, D.; Li, X.; Liang, J.; Guo, Y.; et al. Machine learning-based detection of soil salinity in an arid desert region, Northwest China: A comparison between Landsat-8 OLI and Sentinel-2 MSI. Sci. Total. Environ. 2020, 707, 136092. [Google Scholar] [CrossRef]
- Yahiaoui, I.; Douaoui, A.; Zhang, Q.; Ziane, A. Soil salinity prediction in the Lower Cheliff plain (Algeria) based on remote sensing and topographic feature analysis. J. Arid. Land 2015, 7, 794–805. [Google Scholar] [CrossRef]
- Ge, X.; Ding, J.; Teng, D.; Wang, J.; Huo, T.; Jin, X.; Wang, J.; He, B.; Han, L. Updated soil salinity with fine spatial resolution and high accuracy: The synergy of Sentinel-2 MSI, environmental covariates and hybrid machine learning approaches. Catena 2022, 212, 106054. [Google Scholar] [CrossRef]
- Zinck, A. Applications of Hyperspectral Imagery to Soil Salinity Mapping. In Remote Sensing of Soil Salinization; CRC Press: Boca Raton, FL, USA, 2008; pp. 127–154. [Google Scholar]
- Yang, H.; Wang, Z.; Cao, J.; Wu, Q.; Zhang, B. Estimating soil salinity using Gaofen-2 imagery: A novel application of combined spectral and textural features. Environ. Res. 2023, 217, 114870. [Google Scholar] [CrossRef]
- Avdan, U.; Kaplan, G.; Matcı, D.K.; Avdan, Z.Y.; Erdem, F.; Mızık, E.T.; Demirtaş, İ. Soil salinity prediction models constructed by different remote sensors. Phys. Chem. Earth Parts A/B/C 2022, 128, 103230. [Google Scholar] [CrossRef]
- Shi, H.; Hellwich, O.; Luo, G.; Chen, C.; He, H.; Ochege, F.U.; Van de Voorde, T.; Kurban, A.; de Maeyer, P. A Global Meta-Analysis of Soil Salinity Prediction Integrating Satellite Remote Sensing, Soil Sampling, and Machine Learning. IEEE Trans. Geosci. Remote Sens. 2022, 60, 4505815. [Google Scholar] [CrossRef]
- Peng, J.; Biswas, A.; Jiang, Q.; Zhao, R.; Hu, J.; Hu, B.; Shi, Z. Estimating soil salinity from remote sensing and terrain data in southern Xinjiang Province, China. Geoderma 2019, 337, 1309–1319. [Google Scholar] [CrossRef]
- Howari, F.M.; Goodell, P.C.; Miyamoto, S. Spectral Properties of Salt Crusts Formed on Saline Soils. J. Environ. Qual. 2002, 31, 1453–1461. [Google Scholar] [CrossRef]
- Fourati, H.T.; Bouaziz, M.; Benzina, M.; Bouaziz, S. Modeling of soil salinity within a semi-arid region using spectral analysis. Arab. J. Geosci. 2015, 8, 11175–11182. [Google Scholar] [CrossRef]
- Gorji, T.; Yildirim, A.; Hamzehpour, N.; Tanik, A.; Sertel, E. Soil salinity analysis of Urmia Lake Basin using Landsat-8 OLI and Sentinel-2A based spectral indices and electrical conductivity measurements. Ecol. Indic. 2020, 112, 106173. [Google Scholar] [CrossRef]
- Wang, N.; Peng, J.; Chen, S.; Huang, J.; Li, H.; Biswas, A.; He, Y.; Shi, Z. Improving remote sensing of salinity on topsoil with crop residues using novel indices of optical and microwave bands. Geoderma 2022, 422, 115935. [Google Scholar] [CrossRef]
- Zhou, X.; Zhang, F.; Liu, C.; Kung, H.-T.; Johnson, V.C. Soil salinity inversion based on novel spectral index. Environ. Earth Sci. 2021, 80, 501. [Google Scholar] [CrossRef]
- Allbed, A.; Kumar, L.; Aldakheel, Y.Y. Assessing soil salinity using soil salinity and vegetation indices derived from IKONOS high-spatial resolution imageries: Applications in a date palm dominated region. Geoderma 2014, 230–231, 1–8. [Google Scholar] [CrossRef]
- Yengoh, G.T.; Dent, D.; Olsson, L.; Tengberg, A.E.; Tucker, C.J., III. Use of the Normalized Difference Vegetation Index (NDVI) to Assess Land Degradation at Multiple Scales: Current Status, Future Trends, and Practical Considerations; Springer: Berlin/Heidelberg, Germany, 2015. [Google Scholar]
- Douaoui, A.E.K.; Nicolas, H.; Walter, C. Detecting salinity hazards within a semiarid context by means of combining soil and remote-sensing data. Geoderma 2006, 134, 217–230. [Google Scholar] [CrossRef]
- Roy, D.P.; Huang, H.; Houborg, R.; Martins, V.S. A global analysis of the temporal availability of PlanetScope high spatial resolution multi-spectral imagery. Remote Sens. Environ. 2021, 264, 112586. [Google Scholar] [CrossRef]
- Kpienbaareh, D.; Sun, X.; Wang, J.; Luginaah, I.; Kerr, R.B.; Lupafya, E.; Dakishoni, L. Crop Type and Land Cover Mapping in Northern Malawi Using the Integration of Sentinel-1, Sentinel-2, and PlanetScope Satellite Data. Remote Sens. 2021, 13, 700. [Google Scholar] [CrossRef]
- Wang, J.; Lee, C.K.; Zhu, X.; Cao, R.; Gu, Y.; Wu, S.; Wu, J. A new object-class based gap-filling method for PlanetScope satellite image time series. Remote Sens. Environ. 2022, 280, 113136. [Google Scholar] [CrossRef]
- Pisman, T.I.; Erunova, M.G.; Botvich, I.Y.; Shevyrnogov, A.P. Spatial Distribution of NDVI Seeds of Cereal Crops with Different Levels of Weediness According to PlanetScope Satellite Data. J. Sib. Fed. Univ. Eng. Technol. 2020, 13, 578–585. [Google Scholar] [CrossRef]
- Sagan, V.; Maimaitijiang, M.; Bhadra, S.; Maimaitiyiming, M.; Brown, D.R.; Sidike, P.; Fritschi, F.B. Field-scale crop yield prediction using multi-temporal WorldView-3 and PlanetScope satellite data and deep learning. ISPRS J. Photogramm. Remote Sens. 2021, 174, 265–281. [Google Scholar] [CrossRef]
- Francini, S.; McRoberts, R.E.; Giannetti, F.; Mencucci, M.; Marchetti, M.; Mugnozza, G.S.; Chirici, G. Near-real time forest change detection using PlanetScope imagery. Eur. J. Remote Sens. 2020, 53, 233–244. [Google Scholar] [CrossRef]
- Qayyum, N.; Ghuffar, S.; Ahmad, H.M.; Yousaf, A.; Shahid, I. Glacial Lakes Mapping Using Multi Satellite PlanetScope Imagery and Deep Learning. ISPRS Int. J. Geo-Inf. 2020, 9, 560. [Google Scholar] [CrossRef]
- Mansaray, A.; Dzialowski, A.; Martin, M.; Wagner, K.; Gholizadeh, H.; Stoodley, S. Comparing PlanetScope to Landsat-8 and Sentinel-2 for Sensing Water Quality in Reservoirs in Agricultural Watersheds. Remote Sens. 2021, 13, 1847. [Google Scholar] [CrossRef]
- Pickering, J.; Tyukavina, A.; Khan, A.; Potapov, P.; Adusei, B.; Hansen, M.; Lima, A. Using Multi-Resolution Satellite Data to Quantify Land Dynamics: Applications of PlanetScope Imagery for Cropland and Tree-Cover Loss Area Estimation. Remote Sens. 2021, 13, 2191. [Google Scholar] [CrossRef]
- Zhao, Y.; Lee, C.K.; Wang, Z.; Wang, J.; Gu, Y.; Xie, J.; Law, Y.K.; Song, G.; Bonebrake, T.C.; Yang, X.; et al. Evaluating fine-scale phenology from PlanetScope satellites with ground observations across temperate forests in eastern North America. Remote Sens. Environ. 2022, 283, 113310. [Google Scholar] [CrossRef]
- Dechant, B.; Ryu, Y.; Badgley, G.; Köhler, P.; Rascher, U.; Migliavacca, M.; Zhang, Y.; Tagliabue, G.; Guan, K.; Rossini, M.; et al. NIRVP: A robust structural proxy for sun-induced chlorophyll fluorescence and photosynthesis across scales. Remote Sens. Environ. 2022, 268, 112763. [Google Scholar] [CrossRef]
- Kong, J.; Ryu, Y.; Liu, J.; Dechant, B.; Rey-Sanchez, C.; Shortt, R.; Szutu, D.; Verfaillie, J.; Houborg, R.; Baldocchi, D.D. Matching high resolution satellite data and flux tower footprints improves their agreement in photosynthesis estimates. Agric. For. Meteorol. 2022, 316, 108878. [Google Scholar] [CrossRef]
- Gorji, T.; Tanik, A.; Sertel, E. Soil Salinity Prediction, Monitoring and Mapping Using Modern Technologies. Procedia Earth Planet Sci. 2015, 15, 507–512. [Google Scholar] [CrossRef]
- Muller, S.J.; van Niekerk, A. Identification of WorldView-2 spectral and spatial factors in detecting salt accumulation in cultivated fields. Geoderma 2016, 273, 1–11. [Google Scholar] [CrossRef]
- Han, L.; Ding, J.; Ge, X.; He, B.; Wang, J.; Xie, B.; Zhang, Z. Using spatiotemporal fusion algorithms to fill in potentially absent satellite images for calculating soil salinity: A feasibility study. Int. J. Appl. Earth Obs. Geoinf. 2022, 111, 102839. [Google Scholar] [CrossRef]
- Khan, S.; Abbas, A. Using remote sensing techniques for appraisal of irrigated soil salinity. In Proceedings of the MODSIM07 International Congress on Modelling and Simulation: Land, Water & Environmental Management: Integrated Systems for Sustain, Christchurch, New Zealand, 10–13 December 2007; pp. 2632–2638. [Google Scholar]
- Pettorelli, N.; Vik, J.O.; Mysterud, A.; Gaillard, J.-M.; Tucker, C.J.; Stenseth, N.C. Using the satellite-derived NDVI to assess ecological responses to environmental change. Trends Ecol. Evol. 2005, 20, 503–510. [Google Scholar] [CrossRef]
- Bannari, A.; Guedon, A.M.; El-Harti, A.; Cherkaoui, F.Z.; El-Ghmari, A. Characterization of Slightly and Moderately Saline and Sodic Soils in Irrigated Agricultural Land using Simulated Data of Advanced Land Imaging (EO-1) Sensor. Commun. Soil Sci. Plant Anal. 2008, 39, 2795–2811. [Google Scholar] [CrossRef]
- Abdi, H. Partial least square regression (PLS regression). Encycl. Res. Methods Soc. Sci. 2003, 6, 792–795. [Google Scholar]
- Wang, Z.; Zhang, F.; Zhang, X.; Chan, N.W.; Kung, H.-T.; Ariken, M.; Zhou, X.; Wang, Y. Regional suitability prediction of soil salinization based on remote-sensing derivatives and optimal spectral index. Sci. Total. Environ. 2021, 775, 145807. [Google Scholar] [CrossRef] [PubMed]
- Zovko, M.; Romić, D.; Colombo, C.; Di Iorio, E.; Romić, M.; Buttafuoco, G.; Castrignanò, A. A geostatistical Vis-NIR spectroscopy index to assess the incipient soil salinization in the Neretva River valley, Croatia. Geoderma 2018, 332, 60–72. [Google Scholar] [CrossRef]
- Gopalakrishnan, T.; Kumar, L. Modeling and Mapping of Soil Salinity and Its Impact on Paddy Lands in Jaffna Peninsula, Sri Lanka. Sustainability 2020, 12, 8317. [Google Scholar] [CrossRef]
- Wang, J.; Hu, X.; Shi, T.; He, L.; Hu, W.; Wu, G. Assessing toxic metal chromium in the soil in coal mining areas via proximal sensing: Prerequisites for land rehabilitation and sustainable development. Geoderma 2022, 405, 115399. [Google Scholar] [CrossRef]
- El-Hendawy, S.E.; Al-Suhaibani, N.A.; Hassan, W.; Dewir, Y.H.; Elsayed, S.; Al-Ashkar, I.; Abdella, K.A.; Schmidhalter, U. Evaluation of wavelengths and spectral reflectance indices for high-throughput assessment of growth, water relations and ion contents of wheat irrigated with saline water. Agric. Water Manag. 2019, 212, 358–377. [Google Scholar] [CrossRef]
- Xie, B.; Ding, J.; Ge, X.; Li, X.; Han, L.; Wang, Z. Estimation of Soil Organic Carbon Content in the Ebinur Lake Wetland, Xinjiang, China, Based on Multisource Remote Sensing Data and Ensemble Learning Algorithms. Sensors 2022, 22, 2685. [Google Scholar] [CrossRef] [PubMed]
- Abedi, F.; Amirian-Chakan, A.; Faraji, M.; Taghizadeh-Mehrjardi, R.; Kerry, R.; Razmjoue, D.; Scholten, T. Development. Salt dome related soil salinity in southern Iran: Prediction and mapping with averaging machine learning models. Land Degrad. Dev. 2021, 32, 1540–1554. [Google Scholar] [CrossRef]
- Breiman, L. Random forests. Mach. Learn. 2001, 45, 5–32. [Google Scholar] [CrossRef]
- Belgiu, M.; Drăguţ, L. Random forest in remote sensing: A review of applications and future directions. ISPRS J. Photogramm. Remote Sens. 2016, 114, 24–31. [Google Scholar] [CrossRef]
- Chen, T.; Guestrin, C. Xgboost: A scalable tree boosting system. In Proceedings of the 22nd ACM SIGKDD International Conference on Knowledge Discovery and Data Mining, San Francisco, CA, USA, 13–17 August 2016; pp. 785–794. [Google Scholar]
- Ma, G.; Ding, J.; Han, L.; Zhang, Z.; Ran, S. Digital mapping of soil salinization based on Sentinel-1 and Sentinel-2 data combined with machine learning algorithms. Reg. Sustain. 2021, 2, 177–188. [Google Scholar] [CrossRef]
- Qi, G.; Chang, C.; Yang, W.; Zhao, G. Soil salinity inversion in coastal cotton growing areas: An integration method using satellite-ground spectral fusion and satellite-UAV collaboration. Land Degrad. Dev. 2022, 33, 2289–2302. [Google Scholar] [CrossRef]
- Kearns, M.; Ron, D. Algorithmic stability and sanity-check bounds for leave-one-out cross-validation. In Proceedings of the Tenth Annual Conference on Computational Learning Theory, Nashville, TN, USA, 6–9 July 1997; pp. 152–162. [Google Scholar]
- Chang, C.-W.; Laird, D.A.; Mausbach, M.J.; Hurburgh, C.R., Jr. Near-Infrared Reflectance Spectroscopy-Principal Components Regression Analyses of Soil Properties. Soil Sci. Soc. Am. J. 2001, 65, 480–490. [Google Scholar] [CrossRef]
- Ma, Y.; Chen, H.; Zhao, G.; Wang, Z.; Wang, D. Spectral Index Fusion for Salinized Soil Salinity Inversion Using Sentinel-2A and UAV Images in a Coastal Area. IEEE Access 2020, 8, 159595–159608. [Google Scholar] [CrossRef]
- Davis, E. Comparison of Sentinel-2 and Landsat 8 OLI in the Mapping of Soil Salinity in Hyde County, North Carolina. Ph.D Thesis, University of South Carolina, Columbia, SC, USA, 2018. [Google Scholar]
- Davis, E.; Wang, C.; Dow, K. Comparing Sentinel-2 MSI and Landsat 8 OLI in soil salinity detection: A case study of agricultural lands in coastal North Carolina. Int. J. Remote Sens. 2019, 40, 6134–6153. [Google Scholar] [CrossRef]
- Meti, S.; Lakshmi, P.D.; Nagaraja, M.S.; Shreepad, V. Hanumesh sentinel 2 and landsat-8 bands sensitivity analysis for mapping of alkaline soil in northern dry zone of Karnataka, India. Int. Arch. Photogramm. Remote Sens. Spat. Inf. Sci. 2019, 42, 307–313. [Google Scholar] [CrossRef]
- Aldabaa, A.; Weindorf, D.C.; Chakraborty, S.; Sharma, A.; Li, B. Combination of proximal and remote sensing methods for rapid soil salinity quantification. Geoderma 2015, 239–240, 34–46. [Google Scholar] [CrossRef]
- Taghadosi, M.M.; Hasanlou, M.; Eftekhari, K. Retrieval of soil salinity from Sentinel-2 multispectral imagery. Eur. J. Remote Sens. 2019, 52, 138–154. [Google Scholar] [CrossRef]
- Shrestha, R.P. Relating soil electrical conductivity to remote sensing and other soil properties for assessing soil salinity in northeast Thailand. Land Degrad. Dev. 2006, 17, 677–689. [Google Scholar] [CrossRef]
- Wang, J.; Ding, J.; Yu, D.; Ma, X.; Zhang, Z.; Ge, X.; Teng, D.; Li, X.; Liang, J.; Lizaga, I.; et al. Capability of Sentinel-2 MSI data for monitoring and mapping of soil salinity in dry and wet seasons in the Ebinur Lake region, Xinjiang, China. Geoderma 2019, 353, 172–187. [Google Scholar] [CrossRef]
- Bannari, A.; El-Battay, A.; Bannari, R.; Rhinane, H. Sentinel-MSI VNIR and SWIR Bands Sensitivity Analysis for Soil Salinity Discrimination in an Arid Landscape. Remote Sens. 2018, 10, 855. [Google Scholar] [CrossRef]
- Ge, X.; Ding, J.; Teng, D.; Xie, B.; Zhang, X.; Wang, J.; Han, L.; Bao, Q.; Wang, J. Exploring the capability of Gaofen-5 hyperspectral data for assessing soil salinity risks. Int. J. Appl. Earth Obs. Geoinf. 2022, 112, 102969. [Google Scholar] [CrossRef]
- Abood, S.; Maclean, A.; Falkowski, M. Soil Salinity Detection in the Mesopotamian Agricultural Plain Utilizing WorldView-2 imagery. Ph.D Thesis, Michigan Technological University Houghton, Houghton, MI, USA, 2011. [Google Scholar]
- Alexakis, D.D.; Daliakopoulos, I.N.; Panagea, I.S.; Tsanis, I.K. Assessing soil salinity using WorldView-2 multispectral images in Timpaki, Crete, Greece. Geocarto Int. 2016, 33, 321–338. [Google Scholar] [CrossRef]
- Allbed, A.; Kumar, L.; Sinha, P. Mapping and Modelling Spatial Variation in Soil Salinity in the Al Hassa Oasis Based on Remote Sensing Indicators and Regression Techniques. Remote Sens. 2014, 6, 1137–1157. [Google Scholar] [CrossRef]
- Yu, H.; Liu, M.; Du, B.; Wang, Z.; Hu, L.; Zhang, B. Mapping Soil Salinity/Sodicity by using Landsat OLI Imagery and PLSR Algorithm over Semiarid West Jilin Province, China. Sensors 2018, 18, 1048. [Google Scholar] [CrossRef] [PubMed]
- Sidike, A.; Zhao, S.; Wen, Y. Estimating soil salinity in Pingluo County of China using QuickBird data and soil reflectance spectra. Int. J. Appl. Earth Obs. Geoinf. 2014, 26, 156–175. [Google Scholar] [CrossRef]
- Wang, N.; Xue, J.; Peng, J.; Biswas, A.; He, Y.; Shi, Z. Integrating Remote Sensing and Landscape Characteristics to Estimate Soil Salinity Using Machine Learning Methods: A Case Study from Southern Xinjiang, China. Remote Sens. 2020, 12, 4118. [Google Scholar] [CrossRef]
- Wang, Y.; Xie, M.; Hu, B.; Jiang, Q.; Shi, Z.; He, Y.; Peng, J. Desert Soil Salinity Inversion Models Based on Field In Situ Spectroscopy in Southern Xinjiang, China. Remote Sens. 2022, 14, 4962. [Google Scholar] [CrossRef]
- Zhang, J.; Zhang, Z.; Chen, J.; Chen, H.; Jin, J.; Han, J.; Wang, X.; Song, Z.; Wei, G. Estimating soil salinity with different fractional vegetation cover using remote sensing. Land Degrad. Dev. 2020, 32, 597–612. [Google Scholar] [CrossRef]
- Zhu, C.; Ding, J.; Zhang, Z.; Wang, Z. Exploring the potential of UAV hyperspectral image for estimating soil salinity: Effects of optimal band combination algorithm and random forest. Spectrochim. Acta Part A Mol. Biomol. Spectrosc. 2022, 279, 121416. [Google Scholar] [CrossRef] [PubMed]
- Abbas, A.; Khan, S.; Hussain, N.; Hanjra, M.A.; Akbar, S. Characterizing soil salinity in irrigated agriculture using a remote sensing approach. Phys. Chem. Earth Parts A/B/C 2013, 55–57, 43–52. [Google Scholar] [CrossRef]
Disclaimer/Publisher’s Note: The statements, opinions and data contained in all publications are solely those of the individual author(s) and contributor(s) and not of MDPI and/or the editor(s). MDPI and/or the editor(s) disclaim responsibility for any injury to people or property resulting from any ideas, methods, instructions or products referred to in the content. |
© 2023 by the authors. Licensee MDPI, Basel, Switzerland. This article is an open access article distributed under the terms and conditions of the Creative Commons Attribution (CC BY) license (https://creativecommons.org/licenses/by/4.0/).