Abstract
A distinctive feature of modern Global Navigation Satellite System (GNSS) signals is that they transmit multiple signal components at the same carrier frequencies. The idea of joints across the signal channels from the same carrier frequency and even across different frequencies has been presented in many studies for tracking purposes. Carrier joint tracking is required on the premise that the frequency and phase relationship between signals are nominal values, and the bias of carrier characteristics between signals is drowned in noise as the signal reaches the ground, which requires high-gain receiving equipment to restore the original signal. The space signal-quality monitoring and evaluation system built by the National Timing Center of the Chinese Academy of Sciences is based on a 40 m dish antenna, which can automatically track a single satellite and achieve a high-fidelity reception of navigation signals to a certain extent, realizing fine signal quality monitoring (SQM) of GNSS satellites. Based on this platform, we discuss four types of time distributions of the combined signals among different signal components and provide a method to estimate the carrier characteristic bias between GNSS signals. We derived the correction method of carrier characteristic bias in the joint reception by the joint tracking mathematical model. Under the conditions of narrow correlation and unobstructed case, the carrier characteristic deviation does not vary significantly with the correlator interval and the satellite elevation angle. Based on the results of stability analysis, it is recommended that the receivers should update the carrier frequency bias correction number of the intra-frequency signal and carrier phase bias correction number of the intra-frequency signal monthly. The carrier phase deviation correction number of the inter-frequency signal is performed daily. The measured data from satellites show that the phase accumulation error of the joint tracking carrier loop can be eliminated to achieve long-term stable tracking after frequency bias correction. After the carrier phase bias correction, the joint positioning accuracy of the B2a and B2b signals was improved by 0.81%, and those of the B1C, L1C, E1C, and B2a signals were improved by 0.35%, 0.04%, 0.20%, and 0.11%, respectively. The positioning accuracy improvement effect of inter-frequency signals was greater than that of intra-frequency signals after carrier phase correction.
1. Introduction
Compared to traditional Global Navigation Satellite System (GNSS) signals, a distinctive feature of modern GNSS signals is that they transmit multiple signal components at the same carrier frequency [1]. For example, three signals are modulated at 1575.42 MHz by GPS and Galileo systems, and six and four signals are modulated at the B1 and B2 frequency points by BDS3 [2,3], respectively. These signals are multiplexed with a constant envelope using various methods, and a specific phase and frequency relationship exist between the synthesized signals [4,5]. This design scheme provides more abundant signals to realize different applications while bringing more possibilities to the receiver. For instance, multi-component signals can provide signal observations at multiple frequencies to form flexible design strategies for advanced receiver baseband signal processing, such as inner-band aiding and joint tracking, and form a linear combination of observations used for different purposes, such as ionospheric-free, wide-lane, and narrow-lane combinations. Additionally, the availability, accuracy, and robustness of both tracking and navigation solutions can be improved through the redundancy of multiple signal components from the same satellite [6]. Researchers can design receiving algorithms with different complexities and performances based on the requirements. Based on the GNSS multiplexed signal, a joint receiving algorithm has been developed by the receiver developer to maximize the use of signal energy.
To maximize the positioning accuracy of the navigation signals, high-precision user receivers consider the advantages of more signal components for positioning. The combinations were considered for channels operating at the same carrier frequency and channels across different carrier frequencies. Some scholars have combined data and pilot components to achieve the best positioning performance. The idea of collaboration across pilot and data channels from the same carrier frequency and even across different frequencies transmitted from the same satellite has been presented in many studies for tracking purposes. For example, there are non-coherent combination algorithms, differential combination algorithms, and coherent combination algorithms for the joint acquisition of data/pilot [7,8,9,10]. There are also many joint tracking methods for data/pilots. Refs. [11,12] adopted a combination of discriminators and provided a calculation method for the coefficients. In [13], a method for eliminating the navigation data of the data channel through a newly designed navigation data prediction module was analyzed and proposed, and then, the correlator integration results of the data and pilot were coherently combined using an equal weight ratio. Compared with previous methods, the correlator joint has the lowest complexity because only one set of discriminators and filters are required in the loop. The above references are studies on data/pilots with equal power allocation. GPS-L1C and BDS-B1C adopted the signal modulation method, in which the powers of the data and pilot channels are not equal. The conclusions, based on an analysis of the signal component joint receiving the algorithm with equal power, cannot be completely applied to situations where the powers of two or three data/pilots are not equal by simple derivation, which attracts researchers to study the joint reception of the data/pilot with unequal power distribution in more depth. The acquisition and tracking of the correlator joint based on the data/pilot power ratio were introduced in [14,15,16,17], and the receiving performance was improved. Ref. [18] discussed the combination coefficients of the correlator joint-receiving algorithm for unequal power signals. Based on the equivalence principle of the correlator and discriminator joints, the optimal coefficient of the carrier loop was determined as the amplitude ratio. Research on signal tracking collaborations across different carrier frequency bands from the same satellite can be divided into two categories: interband Doppler-aided and Kalman filter technologies. Interband Doppler-aided dual-frequency tracking technologies are explored using the optimal linear combined Doppler-aided tracking loop, denoted here as OLC-DATL, for GPS L1 CA/L5, L1 CA/L2C [19,20], and BDS B1C/B2a [21] signals that explore the inherent linear relationship among different signal frequencies from the same satellite and improve the tracking performance of the aided signal.
However, the carrier characteristic bias between the signals has not been considered in previous studies. If there is a carrier orthogonal bias, it will cause carrier loop tracking deviation and affect the high-precision positioning performance. Similarly, for the receiver of the PN code joint tracking, this offset between branches reduces the PN code tracking accuracy [22]. Carrier orthogonal deviation was presented in [23] as a feature of the communication signal. The traditional method of measuring the carrier quadrature of Quadrature Phase Shift Keying (QPSK) modulated signals is to use instruments such as vector signal analyzers, which require a relatively high signal-to-noise ratio of the input signal and simple constellation traces [24]. In [25], quadrature deviations were measured through the phase-locked loop output of the I/Q path, and only the simulated pure signals were tested and verified. In [26], the quadrature deviation was measured by a spread spectrum receiver; however, the signal measurement accuracy was influenced by the signal-to-noise ratio. The above studies on carrier orthogonality did not analyze the stability of the measurement results. The complex constellation and novel modulation methods of modern GNSS signals require more accurate methods for measuring the deviation of carrier characteristics and developing correction methods for the receivers.
Because the carrier phase between modern GNSS signals is not a fixed orthogonal design, the carrier phase deviation, which is the difference between the actual satellite carrier phase and design, was analyzed in this study. The deviation of the carrier frequency and phase between signals belong to a slight change in signals, which is submerged in noise as the signals penetrate the atmosphere and reach the ground. Therefore, ground equipment is required to gain and amplify it. The space signal quality monitoring and evaluation system built by the National Time Service Center of the Chinese Academy of Sciences integrates navigation, communication, electronics, microwave, time frequency, and other technologies. This has played an important role in the construction of the global BDS system. The precision measurement subsystem is composed of a 40 m dish antenna, data acquisition equipment, and evaluation data processing equipment, which realizes the high-fidelity reception and transmission of GNSS navigation signals, and realizes the refined test and evaluation of GNSS, including the BDS Global System and GPS III navigation signals.
To improve tracking accuracy and reception sensitivity for high-end receivers, joint carrier tracking is required on the premise that the frequency and phase relationship between signals are nominal values. This study investigates the subtle carrier characteristic bias between signals to improve the joint reception accuracy between GNSS signals. First, a method to estimate the carrier frequency and phase bias between GNSS signals was proposed based on signal-in-space quality assessment and monitoring platform observations. The phase bias caused by the time distribution of the discrete signals was corrected based on the four-time distributions of the discrete points of the multiplexed signals. The natural frequency projection deviation term was estimated to correct the phase-locked loop frequency-assisted term between multiplexed signals. Second, the carrier characteristic bias of representative intra-frequency and inter-frequency signals were estimated, the effects of satellite elevation angle and receiver parameters were analyzed, and the suggested update period and scheme of joint receiver correction parameters for intra-frequency and inter-frequency signals were given according to the daily and monthly stability. Finally, the reception and positioning performances of the carrier frequency and phase-corrected signals were verified using measured data from GNSS satellites.
2. Materials and Methods
2.1. Specification for Representative Signals of GNSS
With the modernization of GNSS, many multiplexed signals have been proposed by the satellite payload designer. First, for the data and pilot separation at the same frequency point, which, respectively, realize the functions of message transmission and ranging. This scheme was first implemented in the GPS L5 signal, Galileo E5a signal, and BDS3 B2a signal at 1176.45 MHz, which belong to the traditional Binary Phase Shift Keying (BPSK) signals. Subsequently, it is implemented in B1C signal, L1C signal, and E1OS signal at 1575.42 MHz, which are modulated by MBOC (6,1,1/11) designed for GNSS interoperability. In order to enrich the GNSS signal and expand the application of the receiver, signals with different frequencies but similar ones are also modulated together. For example, the B1I signal of BDS3 B1 frequency point is modulated at 14.3220 MHz below the center frequency point, which is compatible with BDS2 as a transition signal. The B2a signal and B2b signal of BDS3 B2 frequency point are, respectively, modulated at 15.3450 MHz above and below the center frequency point, whose frequency difference between the two signals is 30.69 MHz. Due to the space limitation of this paper, only a few representative signals of GNSS are selected for analysis, testing, and method verification. As in Table 1, B2a, B1C, E1OS signals, and L1C signals are selected, which belong to the joint reception of the same frequency points. B2a and B2b signals are taken as representatives of the joint reception of adjacent frequency points.

Table 1.
Representative signals of GNSS joint reception.
The representative signals selected in this paper contain BPSK and Multiplexed Binary Offset Carrier (MBOC) modulation. BPSK modulation is the most basic modulation for satellite navigation. BPSK modulation uses a spreading code waveform with rectangular pulses, which takes a constant value throughout the code slice period. Therefore, the only parameter that can be adjusted for this modulation is the spreading code rate, whose signal normalized power spectral density can be defined follows:
The MBOC signal modulated on the GNSS system, denoted as MBOC (6,1,1/11), is specified by its power spectral density (PSD), which is a mixture of the PSDs of and with an appropriate weighting factor . is the normalized PSD of a sine-phase BOC spreading modulation, which is defined by (1) as follows [27]:
where represents the code period and represents the subcarrier period. Considering the definition of the MBOC signal, the normalized PSD (pilot and data channel) is given by (2), as follows:
Modern satellite navigation signals require constant envelope multiplexing of multiple navigation signal components at the same frequency point or even at a nearby dual/triple frequency point before a high-power amplifier on the satellite [28]. In order to reduce signal distortion, GNSS payload designers have adopted different approaches to combine these signal components into a constant envelope composite signal. As shown in Table 1, the representative signals selected in this paper contain five multiplexing methods: the Phase Optimized Constant-Envelope Transmission (POCET) [29], the Coherent Adaptive Subcarrier Modulation (CASM) [30], the Quadrature Phase Shift Keying (QPSK), and the asymmetric constant envelope binary offset carrier (ACE-BOC) [31].
These multiplexing and modulation methods generate signals with a specific frequency, phase, and power distribution relationships. Different distortions were generated during the signal generation process. Table 2 lists the characteristics of the five representative signals analyzed in this study. Among them, 1–4 belong to joint reception at the same frequency, and 5 belongs to joint reception at adjacent frequency points.

Table 2.
Characteristics of the five representative signals.
2.2. Joint Receiving Scheme between GNSS Multiplexed Signals
The special design of multiplexed signals completely synchronizes the code when the satellite transmits the signal. The carrier frequency and phase relationship are fixed. Thus, joint tracking is an attractive option. Traditional single-component tracking methods waste useful power. Based on the fixed relationship between the multiplexed signals, the receiver adopts correlator joint receiving, where the total signal power is increased to obtain a higher tracking accuracy. The signal joint for receiving the design framework is shown in Figure 1.
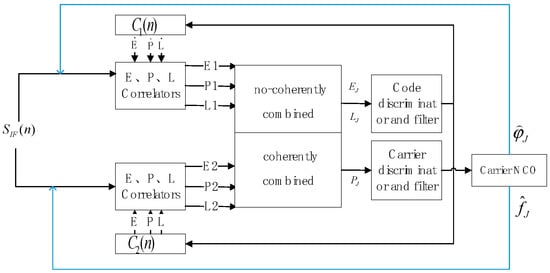
Figure 1.
Framework of correlator joint receiving.
The receiver correlator outputs early branch E and promotes branch P and later branch L. To fully use all the energies of the two components, a combination is performed after the correlator. Based on Table 2, the phase relationship between the signal components is syndromic for the L1C (GPS, QZS2–4) and E1OS signals. The phase relationship between the signal components was orthogonal for the B1C, L1C(QZS1), B2a, and B2 signals. Consequently, the output of the correlator after joining can be expressed as
where and represent the non-coherently combined early and late correlations, respectively, which are used in the joint code loop for the code phase error estimation. represents the coherently combined punctual correlation, which is used in the joint carrier loop to estimate the carrier phase error. and are combination coefficients. Weight combinations based on the correlator output variances helps to exclude noisy measurements. Because the signal component powers were different, their weights in the joint correlation were also different. Optimal coefficients should be estimated to obtain the best combination performance. However, the optimal coefficient was related to the discriminator structure used in the tracking loop. In this study, a noncoherent delay-locked code loop (DLL) envelope discriminator was used in the code loop, and a two-quadrant arctangent function discriminator was used in the carrier loop. The optimal coefficient of the carrier loop was determined to be the amplitude ratio between the multiplexed signals based on the equivalence principle of the correlator and discriminator joints. The optimal coefficient of the carrier loop was determined to be the amplitude ratio based on the mathematical model of the joint code tracking accuracy [18].
In the next subsection, the deviation of the carrier characteristics between GNSS-multiplexed signals was estimated and a correction scheme for high-precision joint reception was presented.
3. Estimation and Correction of Carrier Characteristic Bias
According to Table 2, the multiplexed signal was designed to have a constant frequency, phase, and power relationship. However, deviation of the signals occurs during generation. The carrier characteristics between the signal components are an important manifestation of the signal modulation parameters. The carrier phase error directly affects the correctness of the signal modulation. Figure 2 shows the constellation diagram of the QPSK, POCET, and INTERPLEX multiplexed signals. Contrary to QPSK signals, modern GNSS signals modulate more than three multiplexed signals, where the B1 frequency modulates seven signals using POCET, and the E1 frequency modulates three signals using INTERPLEX. The carrier-phase relationship between the signals is complex, and the phase angles between the phase points are dense. Traditional instrumental measurement methods cannot analyze complex modulated signals.

Figure 2.
Multiplex signal constellation diagram. (a) BPSK signal. (b) POCET signal. (c) INTERPLEX signal.
Therefore, based on the signal-in-space quality evaluation and monitoring platform, this study proposes a high-precision data-measurement method for GNSS receivers.
3.1. Signal-in-Space Quality Assessment and Monitoring Platform
The signal-in-space quality assessment and monitoring platform built by the National Time Service Center of the Chinese Academy of Sciences is located at the National Time Service Center Haoping Observatory, integrating navigation, communication, electronics, microwave, time frequency and other technologies. The signal-in-space quality assessment and monitoring platform consists of signal monitoring, precision measurement, calibration, management control, comprehensive processing, time-frequency reference, and other subsystems. The core of the platform is the precision measurement subsystem, which is composed of a 40 m dish antenna, data acquisition equipment, and evaluation data processing equipment, which realizes the high-fidelity reception and transmission of GNSS navigation signals, and realizes the refined test and evaluation of GNSS navigation signals. The platform enables real-time continuous monitoring accelerated by CPU multi-threaded real-time data processing for complex calculations in the core algorithm.
The larger the received signal C/N0, the higher the range accuracy. Conversely, the C/N0 is too small, indicating that the received signal is unstable, and there may be a large noise or even signal loss lock, and the range accuracy will be seriously affected. Both the 40 m dish and its channel provide gain to amplify the available signal.
The 40 m high-gain dish antenna is the core equipment of the system. The main surface is the 40 m dish and the secondary surface is 4 m in diameter. The antenna receives a right-hand circularly polarized signal with a mono-pulse self-tracking system. When working in the L-band, it has a gain greater than 51.2 dBi. The gain curve in the 1.1 GHz to 1.7 GHz is shown in Figure 3.
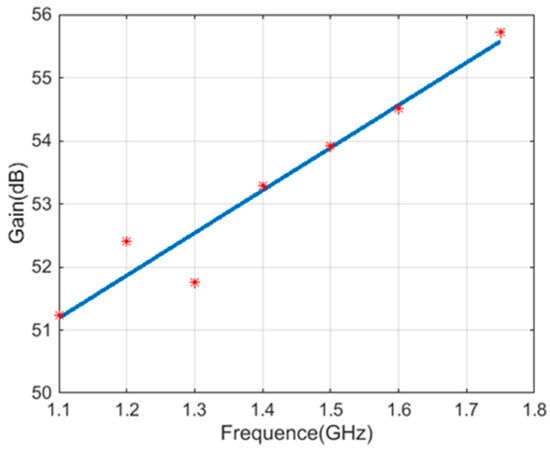
Figure 3.
Gain curve of 40 m dish antenna: antenna gain obtained by the radio power test method (red pots) and the linear fitting result of the actual measurement (blue curve).
The receiving channel needs to amplify signal power with a low noise level. The receiving channel of 40 m dish antenna can provide 40 dB in the range of 1.1 GHz–1.7 GHz with the variation of 3 dB gain. The calibration signal in sweep mode is sent to the RF link and the channel amplitude–frequency characteristic is shown in Figure 4.
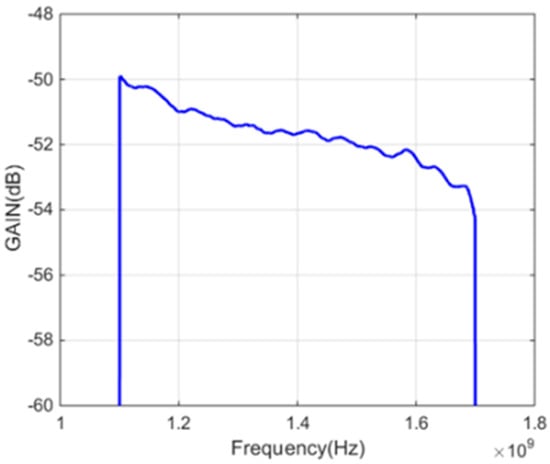
Figure 4.
Amplitude–frequency characteristic of L-band channel.
In order to meet the high stability of gain and time delay, the broadband analog optical technology is used for radio frequency (RF) signal transmission and an optical network for calibration is used in the system. The measurement accuracy of time delay is better than 0.1 ns. A laser ranging technology is used to test the phase center and reflection surface deformation for a 40 m dish antenna. The high-gain receiving link of the assessment system includes a 40 m dish antenna, receiving channel, calibration channel, and monitoring equipment in Figure 5.
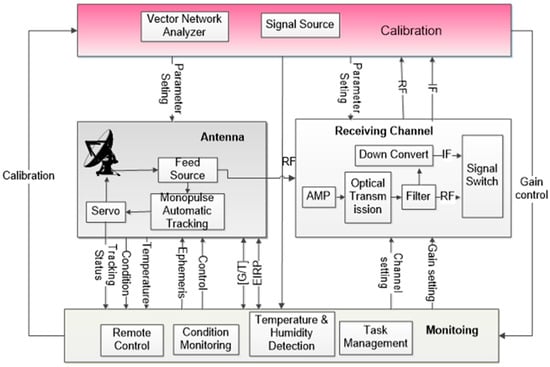
Figure 5.
High-gain receiving link of the assessment system. The data collected by the dish antenna using mono-pulse tracking mode is amplified and filtered in the receiving channel. The system has environmental monitoring functions, such as temperature and humidity.
3.2. Estimation Method of Carrier Characteristic Bias between GNSS Multiplexed Signals
Figure 6 shows the flow of carrier characteristic bias estimation. First, the satellite signals were tracked and amplified through a 40 m dish antenna and receiving channel, and RF signals were sampled using high-precision data acquisition equipment. The same set of sampling data was then sent to the software receiver of the signal to be evaluated for high-precision tracking and data processing. Finally, we compared and analyzed the measurement difference between the carrier characteristics of each useful signal component of the input signal and theoretical value to obtain the measurement result of the relative deviation of the carrier characteristics.

Figure 6.
Flow of carrier characteristic bias estimation.
The discrete signal was processed using a high-precision tracking receiver module. The code loop estimates the code frequency and phase in units of pseudocode periods. The carrier loop estimates the carrier frequency and phase in units of the pseudocode periods. The loop outputs observations in units of the code periods.
- a.
- First, the carrier phase offset estimation method is introduced.
Let and be the carrier phase observation outputs of the receiver at the starting time of the S-th code cycle of signal components 1 and 2, respectively. Owing to the signal distortion caused by satellite signal generation and multiplexing, the corresponding time distribution of the discrete signal sampling points received by the receiver in the signal components will have a small difference. Figure 7 shows an example of the distribution of discrete signal sampling points in two signal component code periods. Numbers 1–10 represent the first 10 discrete signal sampling points received. Assuming that S represents the S-th code period of the signal, the first sampling point in Figure 7 corresponds to the S-1st period of signal component 1 and the S-th period of signal component 2. We assume that and are the starting times of the second code period of signal components 1 and 2. A common starting time should be determined for the two components to compare the carrier phase at the same reference time. Here, was chosen as the reference start time for both signals.

Figure 7.
Example of the time distribution of discrete signals between two signal components.
The cumulative carrier phase pseudo-range of signal component 1 at any moment can be estimated from (8).
where s = s, s + 1, s + 2, … n. is the starting moment of the S-th code cycle of component 1. is the estimated carrier frequency of the S-th code cycle of component 1.
Similarly, based on (8), the accumulated carrier phase pseudo range of signal component 2 at any time can be obtained. It can be estimated using (9).
where s = s, s + 1, s + 2, … n. is the carrier phase of signal component 2 at the reference start moment, which cannot be obtained directly by the high-precision receiver since the receiver outputs a single signal observation. The method to calculate is shown in Formula (A1) in the Appendix A. is the phase accumulation of signal component 2 within the s–s + 1 code cycle range for component 1.
If the difference in the time distribution of the discrete signal between the two signal components is not considered, can be calculated using the following equation:
The exact calculation of phase accumulation is related to the time distribution of the combined discrete signals of the signal components. The four-time distributions of discrete points of the multiplexed signal between signal components can be obtained, as presented in Table 3.

Table 3.
Four-time distributions of discrete points of multiplexed.
The calculation of in Table 3 eliminates the phase-estimation error caused by the difference in the time distribution of the discrete signals.
According to Equations (8) and (9) and Table 3, carrier phase deviation between signal components 1 and 2 at any moment can be obtained using (11).
- b.
- Next, the estimation of the carrier frequency bias was performed.
The carrier frequency observation output from the high-accuracy receiver module comprises nominal frequency , Doppler frequency , and natural frequency . The natural frequency is the deviation from the nominal frequency caused by modules, such as up-conversion modulation of the satellite load.
Based on (12), the difference between the carrier frequency observations of the two signal components can be obtained from (13).
Based on the Doppler frequencies’ relationship to the different signals from the same satellite, which is shown in Formula (A2) in the Appendix A, we can obtain (14).
The third term in polynomial (14) belongs to the natural frequency projection deviation between the signal components, which is the natural frequency deviation from signal components 1 to 2.
According to (14), can be driven as follows:
where and are the known quantities, and and are the carrier-frequency observation outputs from the high-accuracy receiver module.
Particularly, if the two signals involved in the joint tracking belong to the same frequency point, natural frequency projection deviation between the signal components can be written as (17).
3.3. Correction Method of Carrier Characteristic Bias in Joint Tracking
For high-end receivers, joint carrier tracking is required on the premise that the frequency and phase relationships between signals are nominal values to improve tracking accuracy and reception sensitivity. If there is a carrier characteristic deviation, it will cause a carrier loop tracking deviation and affect high-precision positioning performance. Similarly, for the receiver of the PN code joint tracking, this offset between branches reduces the PN code tracking accuracy. Figure 8 shows a block diagram of the carrier characteristic bias correction method with joint correlator tracking. Contrary to Figure 1, the carrier phase and frequency bias fed back by carrier numerically controlled oscillator (NCO) to each component are corrected in Figure 8.
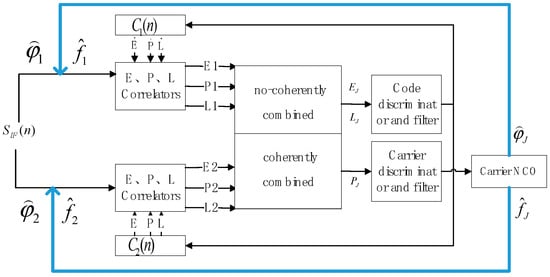
Figure 8.
Block diagram of the carrier characteristic bias correction method.
and are the carrier phase and frequency of the combined signals of signals 1 and 2, respectively. and are the carrier phase and frequency estimates fed back to component 1 after correction, and and are the carrier phase and frequency estimates fed back by carrier NCO to component 2, respectively.
where and are the carrier phase and frequency correction for component 1, and and are the carrier phase and frequency correction for component 2, respectively.
The values of , ,, and were derived according to the mathematical model of the joint reception method.
- a.
- Carrier phase correction and are derived first.
According to the joint tracking discriminator characteristics [32], we can obtain the linear relationship based on Formula (A3)–(A5) in the Appendix A as follows:
where , , and are the phase estimated value of the multiplexed signal and single-signal tracking, respectively. and are given by the following equation [33]:
We assume that the carrier phase bias between the signal components is . According to the carrier tracking loop stability experience, the estimated value will infinitely converge to the true value after the loop is stabilized; thus, we can obtain the carrier discriminator output relationship for single-signal tracking as follows:
The following equation can be obtained by substituting (22) into (20).
According to (27), the relationship between , , , and can be obtained, as shown in (24) and (25).
According to (18), (21), (24) and (25), the carrier phase correction in Figure 8 can be derived as
where is the carrier phase deviation between the signal components, which can be obtained using the estimation method described in Section 3.2.
- b.
- Carrier frequency correction and are derived next.
The carrier frequency bias of inter-frequency signals contains nominal frequency deviation , Doppler frequency deviation , and natural frequency deviation between signal components.
In a modernized GNSS receiver that tracks multiple civil signals, the relationship between the Doppler frequencies (proportional to the corresponding carrier frequencies) of all signals is known; therefore, Doppler estimates of a PLL can be utilized by another PLL tracking a different frequency [21]. Assuming that signal R is used as a reference signal with frequency observation , the Doppler frequency is , and the natural frequency is .
We use the real-time Doppler frequency as an assistant, and the Doppler of signal components 1 and 2 can be determined from the fixed frequency relationship. Equation (27) can be rewritten as (28).
Rewrite (28) as (29).
According to (12), (29) can be rewritten as (30).
where , , , , and are the known quantities. is the frequency observation of the reference signal that can be controlled by reference signal tracking.
The third term in polynomial (30) is the natural frequency projection deviation of the reference signal on signal components 1 and 2. According to Equation (15), is calculated as follows:
where is the natural frequency projection deviation between signal components i and R, which can be obtained using the estimation method in Section 3.2. This deviation is constant, independent of satellite motion, and can be estimated based on the signal-in-space quality assessment and monitoring platform.
As with the allocation of the carrier phase correction, refer to (26). The carrier frequency correction shown in Figure 8 can be derived as (32).
4. Experiment and Analysis
4.1. Data Collection Campaign
The test platform shown in Figure 9 was used to verify the proposed method. This experiment was conducted in Luonan County. To obtain high-precision results for the GNSS carrier characteristic bias owing to signal deformation, all types of large errors that may affect the results should be eliminated. The 40 m dish high-gain antenna of the National Timing Center Haoping Observatory (Luonan County) conducts a high-speed collection of GNSS signals through an L-band radio frequency receiving link. The carrier characteristic deviation of the real-time data was estimated using a signal-in-space quality assessment and monitoring platform. Finally, the correction value was provided to the common user receiver using the GNSS all-in-view antenna, and the carrier frequency and phase bias in joint tracking were corrected. The joint static single-point positioning accuracy was obtained using the mean square error of the positioning results.
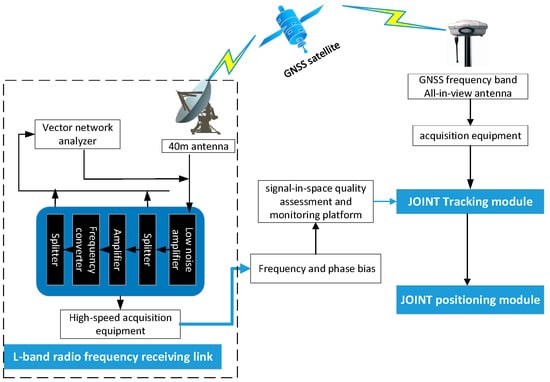
Figure 9.
Architecture of the test platform.
The dataset received by the 40 m dish antenna presented here was collected using national instruments (NI) data acquisition (DAQ) equipment, with a sampling rate of 250 MHz and an intermediate frequency of 62.5 Hz, as shown in Figure 10. The collection device with the RF signal acquisition function of the three channels synchronously was used to acquire the data of the GNSS satellites. As shown in Figure 10, the device is composed of five units: an embedded system controller module, calibration module, sync module, and recorder units. The signal inputs from the three RF ports and gain controller were used to reach an appropriate power level. The local oscillator generates three signals matched with each of the RF signals based on the external reference clock, and the signals are mixed in the down converter. The intermediate frequency (IF) signals at 187.5 MHz were obtained. Three analog-to-digital converters (ADC) digitized the IF signals. The data were stored in the recorder units of the PXI Express chassis. The collected signals were characterized by high speed, bandwidth, and accuracy.
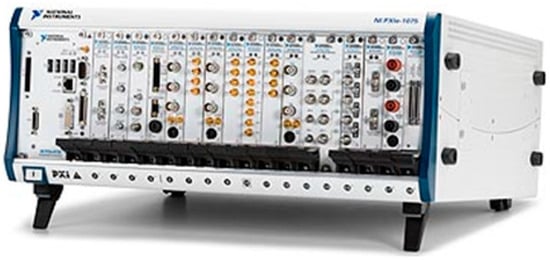
Figure 10.
Collection device with RF signal acquisition function of three channels.
Two groups of data collected by the all-in-view antenna on 25 January 2021 and 14 September 2022 were used for user correction experiment verification.
4.2. Evaluation Results of Carrier Characteristic Deviation
The carrier characteristic bias of the satellite data was estimated as follows: Table 4 in Section 3.2 introduces the estimation error of the phase bias caused by the difference in the time distribution of discrete signals. Figure 11 shows the estimated carrier phase bias between B2ad and B2ap of the BDS3 prn 21 satellite from April 2021 to November 2022. The standard deviations of the 13 groups of data before and after the time distribution of the discrete signal correction were 0.129 and 0.012, respectively. The stability of the carrier phase estimation after the time distribution of the discrete signal correction was improved by an order of magnitude, which also verifies the estimated method in Table 3.

Table 4.
Carrier characteristic bias for BDS3 prn 21.
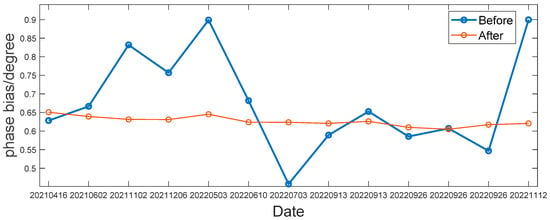
Figure 11.
Carrier phase bias estimation between B2ad and B2ap of BDS3 prn 21 satellite.
It is necessary to further analyze whether the measurement results are affected by the user receiver parameters and satellite elevation angle. The B2a signal was used as an example to analyze the effect of the satellite orientation relative to the receiver. To avoid ground clutter and near-Earth occlusion, a minimum elevation angle of 10° is required for satellite observation. To be conservative, we chose an elevation angle of 20° or greater for this experiment. Most satellites cannot reach an elevation angle of more than 80°; therefore, the highest elevation angle for this experiment was 80°. Table 4 lists a sample of the phase deviation between BDS3 prn 21 satellite B2ad and B2ap signals measured in the selected elevation observation range with a polar difference of 0.02108. The polar difference of the sample of the frequency deviation between BDS3 prn 21 satellite B2a and B2b signals was 0.00049. It can be observed that the satellite acceleration angle had no significant effect on the carrier phase deviation between the signals.
To analyze the effect of the user receiver discriminator spacing on the carrier characteristic bias, the carrier phase deviation between the B2ad and B2ap signals of the BDS2 prn 21 satellite is shown in Figure 12. It can be observed that the carrier phase bias increased slightly with the correlator interval. It increased after the 0.1 chip and leveled off after the 0.3 chip. Narrow correlation has a higher code tracking accuracy; therefore, it is recommended that receivers use a discriminator interval within 0.1 chip for phase deviation estimation.
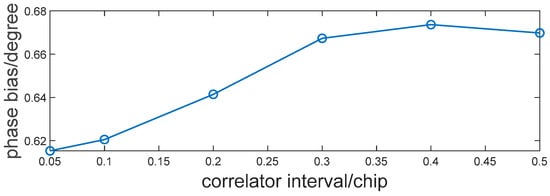
Figure 12.
Carrier phase bias estimation between B2ad and B2ap of BDS3 prn 21 satellite.
The carrier frequency bias between the B2a and B2b signals of the BDS2 Prn 21 satellite is shown in Figure 13. Clearly, there is no significant linear relationship between the carrier frequency bias and correlator interval. The sample polar difference within 0.5 chip was less than 10−4.

Figure 13.
Carrier frequency bias estimation between B2a and B2b of BDS3 prn 21 satellite.
The estimated values of the carrier phase and frequency bias for all the satellite signals involved in the reception corrections in this study are given below. Estimated values for several months were provided to determine their stability. Figure 14 shows the carrier phase bias between the data and pilot components of the MBOC signals (B1C, L1C, and E1OS) from January to April 2020. The monthly stability of the carrier phase deviation for each satellite was good; therefore, it is recommended that users update the correction parameters monthly. The carrier phase bias between the data and pilot components for the B1C and L1C signals ranged between −1 and 2°, which is much larger than the carrier phase bias between the data and pilot components for E1OS signals. This indicates that the Galileo signal has a more ideal phase relationship between the data and the pilot components.

Figure 14.
Carrier phase bias between data and pilot of MBOC signal in 2020.
The carrier phase deviations of B1C and L1C were of the same order of magnitude. The carrier phase bias of the five satellites of GPS III (G04,G18,G23,G14,G11)has good consistency, floating around −0.5 degrees. Contrarily, the E1OS signal was extremely small. This phenomenon is related to satellite payload implementation technology and hardware equipment. The low biases for the Galileo satellites are most likely because of the digital signal generation unit onboard the spacecraft [34]. This may be an advantage of this constellation compared with other GNSSs. Several parameters of the Galileo signals that we monitored performed better than the GPS and BDS.
Figure 15 shows the carrier phase bias between the data and pilot components of the B2a signal from May to October 2022. The monthly stability of the carrier phase bias for each satellite was good; therefore, it is recommended that users update the correction parameters monthly. Except for C21, C59, C60, C61, the carrier phase bias between the data and pilot components of the BDS3 B2b signal ranged between −0.1 and 0.1°. In Figure 15, C38, C39, and C40 belong to the IGSO satellites; C59, C60 and C61 belong to the GEO satellites; and the rest belong to the MEO satellites. The deviation of the three GEO satellites is relatively large, up to 0.9 degrees.
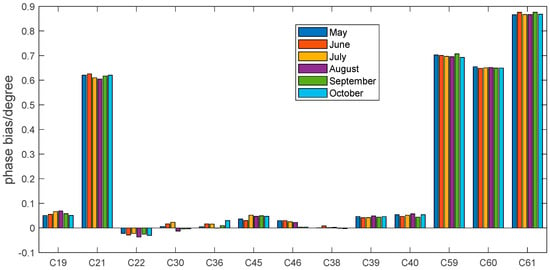
Figure 15.
Carrier phase bias between data and pilot of B2a signal in 2022.
Various factors in the satellite payload production process lead to individual deviations. The track of the B2a signal constellation is simple; therefore, the carrier phase bias of most satellites will be small. Even if the 21 satellites were 0.6°, this is within the index specified in the BDS ICD.
Figure 16 shows the carrier phase bias between B2ap and B2bp for six datasets analyzed in September and October 2022. The carrier phase deviation between B2a and B2b of most satellites is negative; the deviation of the three GEO satellites is positive. The carrier phase deviation varied slightly from month to month; however, the daily stability was good. Therefore, it is recommended that users update the correction parameters on a daily basis. The carrier phase deviations of both the B2a and B2b signals fluctuated from −10 to 10°.
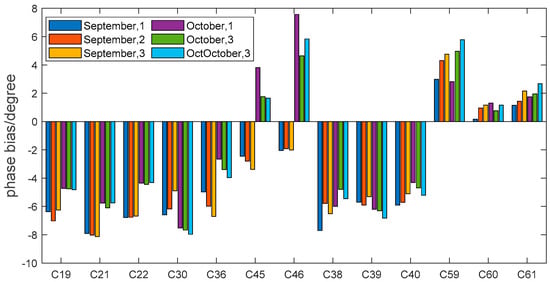
Figure 16.
Carrier phase bias between B2ap and B2bp signal in 2022.
Figure 17 shows the carrier frequency bias between B2a and B2b for May–October 2022. The monthly stability of the carrier frequency bias for each satellite is good, and the carrier frequency bias stability of the three GEO satellites is the best. Therefore, it is recommended that users update the correction parameters monthly. The carrier frequency deviations of both the B2a and B2b signals fluctuate around −0.01 Hz. According to Equation (19), the frequency bias is related to the frequency ratio between the signals. The frequency ratio of B2a to B2b was 0.98. Therefore, the frequency deviation correction number is in agreement with the individual satellites.
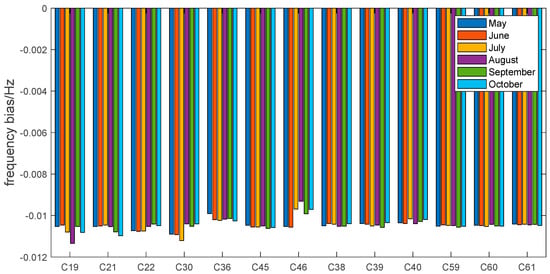
Figure 17.
Frequency bias between B2a and B2b signal in 2022.
4.3. Verification of Carrier Characteristic Correction
To clearly observe the influence of carrier phase bias on joint tracking, Figure 18 shows the standard deviation of the PLL discriminator output for the simulation signal with a designed phase difference of 0–pi. Clearly, the error increases faster with an increase in the carrier phase bias between the signals.
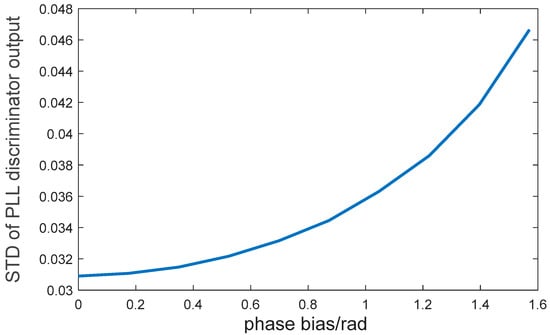
Figure 18.
Standard deviation of carrier loop discriminator of simulation signal.
A constant carrier frequency bias produces a cumulative phase error in continuous tracking, and this error accumulation touches the linear edge of the discriminator after reaching 180°and then converges again in a short time. Figure 19 shows the carrier discriminator output for the joint tracking of the simulated signal with a designed carrier frequency deviation of 0.1 Hz. The accumulated phase error touched the phase discriminator’s linear edge at approximately 5 s. However, the carrier frequency bias of the intra-frequency point signal is of the order 10−4, which requires approximately 50,000 s of continuous tracking to touch the discriminator linear edge.
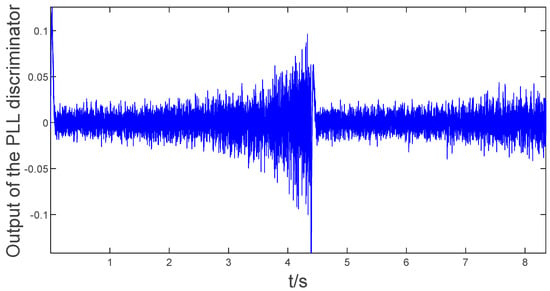
Figure 19.
Output of the carrier loop discriminator of simulation signal.
To verify the estimation method in this study, the satellite data collected by the all-in-view antenna on 25 January 2021 and 14 September 2022 were used for user correction experiment verification.
Figure 20 and Figure 21 show the relative improvement in the joint tracking carrier loop discriminator-output accuracy after correcting the carrier phase bias for the MBOC signals (B1C, L1C, E1OS) collected by the all-in-view antenna in January 2021 and B2a signals collected in September 2022. The maximum increase in the accuracy of the MBOC signal for a single satellite was 0.25%, which is an order of magnitude higher than that of the B2a signal. It is easy to understand that this phenomenon is caused by the generally higher carrier phase bias of MBOC signals than that of B2a signals in Figure 14 and Figure 15.
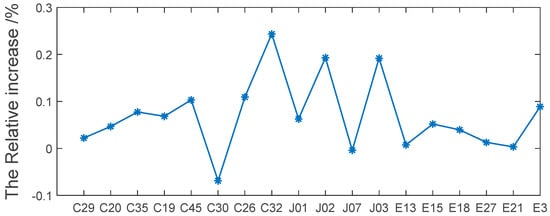
Figure 20.
Relative increase in PLL discriminator output accuracy for MBOC signal.
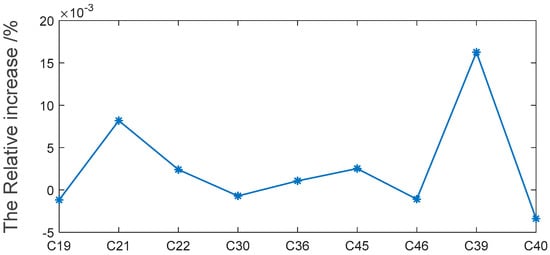
Figure 21.
Relative increase in PLL discriminator output accuracy for B2a signal.
Figure 22 shows the PRN22 satellite carrier loop output before and after frequency bias correction (B2ap and B2bp joint tracking). Similar to the theoretical analysis results, the carrier loop error accumulated over time and reached a maximum in 30 s before the carrier frequency bias correction. The error accumulation was eliminated after the carrier frequency bias was corrected.
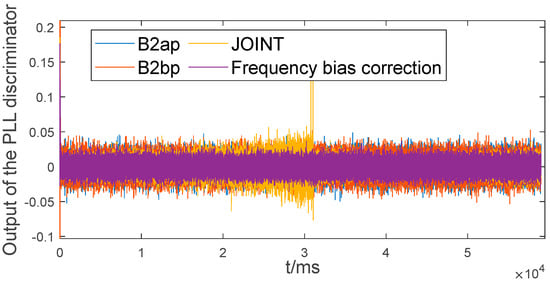
Figure 22.
Carrier loop discriminator output before and after frequency bias correction for B2a and B2b signal.
Figure 23 shows the standard deviation of the carrier and code loop outputs before and after the phase deviation correction (B2ap and B2bp joint tracking). After the carrier phase bias was corrected, the carrier loop error was reduced and the code loop had almost no effect.
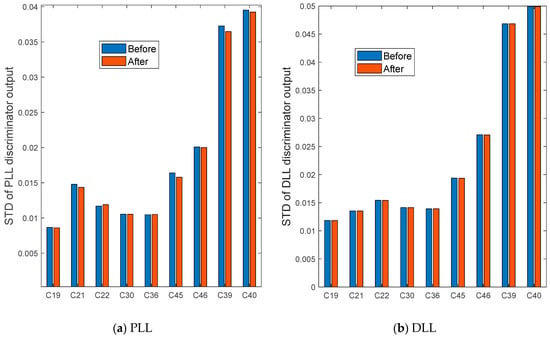
Figure 23.
Standard deviation of loop output before and after phase bias correction for B2a and B2b signal.
Based on Figure 23, Table 5 lists the relative improvement in the carrier loop discriminator output accuracy after correcting for the carrier phase bias for B2a and B2b. The maximum enhancement ratio of a single satellite could reach 3.7% after the correction of the carrier phase bias for the inter-frequency signal, which indicates a better effect of the carrier phase correction for the inter-frequency signal.

Table 5.
Relative increase in PLL discriminator output accuracy for B2a and B2b signal/%.
However, the accuracy relative increase effect was not proportional to the estimated value of the phase bias. We conjecture that this may have been caused by the non-coincidence of the validation time with the observation time. Alternatively, other factors affecting the accuracy of the carrier loop existed, such as intercode bias, which requires further investigation.
5. Discussion
According to the analysis in Section 4.3, the carrier frequency bias of the intra-frequency signals was of the order 10−4, which has a negligible effect on joint tracking. The carrier frequency bias of the inter-frequency was approximately 0.01 Hz, which produces cumulative phase errors in the long-time continuous tracking based on Doppler frequency assistance. Such errors can be eliminated after the carrier frequency bias correction.
The overall carrier-phase bias of the intra-frequency signals was smaller than that of the inter-frequency signals. After correction in joint reception, most of the satellite carrier-loop accuracy was improved. However, a few satellites have negative growth in varying degrees, which may be owing to the time for user correction verification being not completely consistent with the time for estimating carrier phase deviation, leading to changes in a satellite’s status. For example, in Table 5, the omission of the observation mission caused the C22 satellite to be observed by the 40 m dish antenna on September 27, while the all-in-view antenna collected the signal on September 14. The long-time difference may cause the satellite to omit information at that time. However, because of the large number of satellites involved in positioning, there is no negative growth in positioning accuracy. Figure 24 shows the positioning accuracy after the correction of the carrier phase bias for both intra- and inter-frequency signals to verify the improved effect of joint positioning.
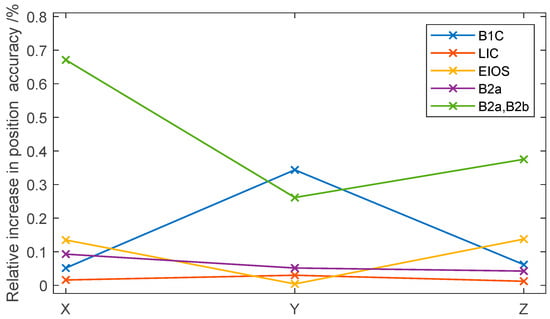
Figure 24.
Relative increase in position accuracy.
All signals participating in the verification can improve positioning accuracy. After correcting the carrier phase bias of the inter-frequency signal, the positioning accuracy can be improved by a maximum of 0.7% in the X-direction. The joint positioning accuracy of the B2a and B2b signals improved by 0.81%, and the B1C, L1C, E1C, and B2a signals improved by 0.35%, 0.04%, 0.20%, and 0.11% in the direction of the combined path of X, Y, and Z, respectively.
6. Conclusions
To improve the joint reception accuracy between GNSS signals, this study investigated the subtle carrier characteristic bias between signals. MBOC signals, such as B1C, L1C, E1OS, and BPSK signals, such as B2a signals, are representative of the intra-frequency signals and BDS3 B2 frequency of the inter-frequency signals. First, this study introduced carrier characteristic bias assessment and provided a correction method for joint reception. Subsequently, the carrier frequency and phase bias of the measured satellite data were evaluated for stability. Finally, the tracking loop and positioning accuracy improvement were verified using satellite signals collected from an all-in-view antenna.
- Under the conditions of narrow correlation and unobstructed case, the carrier characteristic deviation did not vary significantly with the correlator interval and satellite elevation angle. However, to eliminate occlusion, noise, and other factors, it is recommended that the evaluation monitoring platform selects an observation angle of more than 20°and a code discriminator interval within 0.1 chip.
- According to the evaluation results of the carrier frequency bias, it is recommended that users do not consider the carrier frequency bias of the intra-frequency signals because its value is significantly small; however, it is recommended that the frequency bias of the inter-frequency signals is updated monthly. Based on the evaluation results of the carrier phase bias, the phase deviation of the intra-frequency signals is more stable, and it is recommended that it is updated every month. It is recommended that the phase bias of inter-frequency signals is updated daily.
- After the frequency bias correction, the phase accumulation error of the joint tracking carrier loop can be eliminated to achieve long-term stable tracking. The carrier-loop accuracy of most satellites can be improved by phase-bias correction. The positioning accuracy improvement effect of inter-frequency signals was greater than that of intra-frequency signals after carrier phase correction.
The observation speed of the directional antenna is limited; therefore, sometimes a sudden change in the characteristics of individual satellites leads to an inability to match the time of user verification, which may lead to experimental results that do not match expectations. We will even consider a combined directional antenna observation network to improve the observation efficiency in later studies. Simultaneously, we will investigate factors such as inter-code bias in future work, which also affects the carrier loop accuracy.
Author Contributions
Conceptualization, Y.R. and X.W.; methodology, Y.G.; software, Y.G. and D.Z.; validation, Y.G. and Y.R.; formal analysis, Y.G. and Y.R.; resources, Y.G. and H.S.; data curation, Y.G. and N.J.; writing—original draft preparation, Y.G.; writing—review and editing, X.W. and D.Z.; project administration, D.Z. and Y.R. All authors have read and agreed to the published version of the manuscript.
Funding
This research was funded by National Natural Science Foundation of China: grant number 41974032.
Data Availability Statement
Not applicable.
Conflicts of Interest
The authors declare no conflict of interest.
Appendix A
The carrier phase of signal component 2 at the reference start moment can be calculated as follows:
where and are the estimates of the carrier frequencies at the s-th and s-1st code cycles of signal component 2.
The Doppler frequencies of the different signals from the same satellite are proportional to the nominal frequency of the signal, as illustrated as follows:
where and are the RF frequencies of the signal components.
According to the joint tracking discriminator characteristics, the discriminator output of joint tracking is a linear combination of single-component tracking [32]. As in Equation (A3),
where , , and are the discriminator outputs of the multiplexed signal and single–signal tracking, respectively.
Because the two-quadrant arctangent discriminator results are highly approximate to the phase error, Equation (A3) can be split into (A4).
where , , and represent the true values of the carrier phase of the single and multiplexed signals. , , and represent the estimated values of the carrier phase of single and multiplexed signals.
Based on Equation (A4), the estimated value can be expressed as follows:
References
- Yuan, H.; Lv, J.; Yu, Y.; Chang, J. A Fast Acquisition Algorithm for L1C Based on L1CA and L1C Combined Detection. In Proceedings of the China Satellite Navigation Conference (CSNC) 2012 Proceedings; Springer: Berlin/Heidelberg, Germany, 2012; pp. 689–698. [Google Scholar]
- Zhang, Q.; Zhu, Y.; Chen, Z. An In-Depth Assessment of the New BDS-3 B1C and B2a Signals. Remote Sens. 2021, 13, 788. [Google Scholar] [CrossRef]
- Salgueiro, F.; Luise, M.; Zanier, F.; Crosta, P. Pilot-aided GNSS data demodulation performance in realistic channels and urban live tests. In Proceedings of the 2016 8th ESA Workshop on Satellite Navigation Technologies and European Workshop on GNSS Signals and Signal Processing (NAVITEC), Noordwijk, The Netherlands, 14–16 December 2016. [Google Scholar]
- Dafesh, P.A. Cahn CRJpotitmotion: Application of POCET Method to Combine GNSS Signals at Different Carrier Frequencies. In Proceedings of the 2011 International Technical Meeting of The Institute of Navigation, San Diego, CA, USA, 24–26 January 2011; pp. 1201–1206. [Google Scholar]
- Yao, Z.; Lu, M.J.E.L. Dual-frequency constant envelope multiplex with non-equal power allocation for GNSS. Electron. Lett. 2012, 48, 1624–1625. [Google Scholar] [CrossRef]
- Wu, M.; Zhao, L.; Ding, J.; Gao, Y.; Li, Y.; Kang, Y. A BDS-3 B1C/B2a dual-frequency joint tracking architecture based on adaptive Kalman filter and extended integration time. GPS Solut. 2020, 24, 30. [Google Scholar] [CrossRef]
- Borio, D.; O’Driscoll, C.; Lachapelle, G. Coherent, Noncoherent, and Differentially Coherent Combining Techniques for Acquisition of New Composite GNSS Signals. IEEE Trans. Aerosp. Electron. Syst. 2019, 45, 1227–1240. [Google Scholar] [CrossRef]
- Hegarty, C.J. Optimal and Near-optimal Detectors for Acquisition of the GPS L5 Signal. In Proceedings of the 2006 National Technical Meeting of the Institute of Navigation, Monterey, CA, USA, 18–20 January 2006. [Google Scholar]
- Daniele, B. A Statistical Theory for GNSS Signal Acquisition. 2008. Available online: https://www.ucalgary.ca/engo_webdocs/other/DBorio_Torino_Apr08.pdf (accessed on 10 February 2023).
- Ta, T.H.; Dovis, F.; Margaria, D.; Presti, L.L. Comparative study on joint data/pilot strategies for high sensitivity Galileo E1 open service signal acquisition. IET Radar Sonar Navig. 2010, 4, 764–779. [Google Scholar] [CrossRef]
- Muthuraman, K.; Shanmugam, S.K.; Lachapelle, G. Evaluation of DataPilot Tracking Algorithms for GPS L2C Signals Using Software Receiver. In Proceedings of the 20th International Technical Meeting of the Satellite Division of the Institute of Navigation (ION GNSS 2007), Fort Worth, TX, USA, 25–28 September 2007. [Google Scholar]
- Muthuraman, K.; Klukas, R.; Lachapelle, G. Performance Evaluation of L2C DataPilot Combined Carrier Tracking. In Proceedings of the 21st International Technical Meeting of the Satellite Division of the Institute of Navigation (ION GNSS 2008), Savannah, GA, USA, 16–19 September 2008. [Google Scholar]
- Liu, Y.; Li, H.; Cui, X.; Lu, M. A_tracking_method_for_GPS_L2C_signal_based_on_the_joint_using_of_data_and_pilot_channels. In Proceedings of the 2014 11th International Computer Conference on Wavelet Actiev Media Technology and Information Processing, Chengdu, China, 19–21 December 2014. [Google Scholar]
- Macchi-Gernot, F.; Petovello, M.G.; Lachapelle, G. Combined Acquisition and Tracking Methods for GPS L1 C/A and L1C Signals. Int. J. Navig. Obs. 2010, 2010, 190465. [Google Scholar] [CrossRef]
- Li, W.; Qian, T.; Wang, Y.; Huang, C. Constant False Alarm Rate Acquisition Algorithm for Compass B1C Signal. China Commun. 2019, 16, 201–211. [Google Scholar] [CrossRef]
- Wu, T.; Tang, X.; Ma, C.; Wu, J.; Sun, G. Joint acquisition strategy for BDS B1C signal. GNSS World China 2020, 45, 101–108. [Google Scholar] [CrossRef]
- Tian, F.; Tang, X.; Ou, G. Power-weighted combining acquisiton algorithm withdata and pilot signals. J. Natl. Univ. Def. Technol. 2016, 38, 112–116. [Google Scholar]
- Guo, Y.; Zou, D.; Wang, X.; Rao, Y.; Shang, P.; Chu, Z.; Lu, X. Method for Estimating the Optimal Coefficient of L1C/B1C Signal Correlator Joint Receiving. Remote Sens. 2022, 14, 1401. [Google Scholar] [CrossRef]
- Bolla, P.; Lohan, E.S. Dual-frequency Signal Processing Architecture for Robust and Precise Positioning Applications. In Proceedings of the 2018 IEEE/ION Position, Location and Navigation Symposium (PLANS), Monterey, CA, USA, 23–26 April 2018; pp. 72–80. [Google Scholar]
- Qaisar, S.U. Performance Analysis of Doppler Aided Tracking Loops in Modernized GPS Receivers. In Proceedings of the International Technical Meeting of the Satellite Division of the Institute of Navigation, Savannah, CA, USA, 22–25 September 2009. [Google Scholar]
- Wu, M.; Zhao, L.; Ding, J.; Kang, Y.; Luo, Z. Design and Performance Analysis of Doppler-Aided Beidou B1C-B2a Joint Tracking Algorithm. In China Satellite Navigation Conference (CSNC) 2019 Proceedings; CSNC 2019. Lecture Notes in Electrical Engineering; Springer: Singapore, 2019. [Google Scholar]
- Li, Y.; Lu, X.; Wang, X. A new method for estimation of orthogonal and phase deviations of constant-envelope signals. Meas. Sci. Technol. 2017, 28, 125003. [Google Scholar] [CrossRef]
- Park, S.; Cho, S.H. SEP performance of coherent MPSK over fading channels in the presence of phase/quadrature error and I-Q gain mismatch. IEEE Trans. Commun. 2005, 53, 1088–1091. [Google Scholar] [CrossRef]
- Lei, X.; Jiang, X.; Wang, C. Design and Implementation of a Real-Time Video Stream Analysis System Based on FFMPEG. In Proceedings of the 2013 Fourth World Congress on Software Engineering, Hong Kong, China, 3–4 December 2014. [Google Scholar]
- Yang, Y.; Lei, Y. The assessment of navigation signal phase quadrature. In Proceedings of the 2012 5th International Congress on Image and Signal Processing, Chongqing, China, 16–18 October 2012; pp. 1726–1729. [Google Scholar]
- Wang, F.; He, W. Study on I,Q Orthognality Measurement Method for QPSK Spread Spectrum Signals. Radio Eng. 2014, 44, 24–27. [Google Scholar]
- Zheng, Y.; Mingquan, L. Signal Design Principle and Implementation Technology of New Generation Satellite Navigation System; Monograph; Electronic Industry Press: Beijing, China, 2016. [Google Scholar]
- Zhang, M.; Kou, Y. Numerical algorithm for POCET optimal phase search. J. Beijing Univ. Aeronaut. Astronaut. 2017, 43, 1917–1923. (In Chinese) [Google Scholar] [CrossRef]
- Liu, Y.; Li, C.; Niu, H. Research and Implementation of POCET Constant Envelope Modulation Technique. Radio Commun. Technol. 2013, 39, 85–88. [Google Scholar]
- Chen, X. Theory and Simulation of Satellite Navigation Signal Multiplexing; Xidian University: Xi’an, China, 2013. [Google Scholar]
- Yao, Z.; Zhang, J.; Lu, M. ACE-BOC: Dual-frequency Constant Envelope Multiplexing for Satellite Navigation. IEEE Trans. Aerosp. Electron. Syst. 2016, 52, 466–485. [Google Scholar] [CrossRef]
- Bashir Ahmed Siddiqui, J.Z.; Mohammad Zahidu, H. Bhuiyan and Elena Simona Lohan. Joint Data-Pilot Acquisition and Tracking of Galileo E1 Open Service Signal; IEEE: Kirkkonummi, Finland, 2010. [Google Scholar]
- Zhang, Z. A novel combining tracking scheme for MBOC signal. In Proceedings of the 2011 International Conference on Electronics, Communications and Control (ICECC), Ningbo, China, 9–11 September 2011. [Google Scholar]
- Gunawardena, S.; Carroll, M.; Raquet, J.; Graas, F.V. High-Fidelity Signal Deformation Analysis of Live Sky Galileo E1 Signals using a ChipShape Software GNSS Receiver. In Proceedings of the 28th International Technical Meeting of the Satellite Division of the Institute of Navigation (ION GNSS+ 2015), Tampa, FL, USA, 14–18 September 2015. [Google Scholar]
Disclaimer/Publisher’s Note: The statements, opinions and data contained in all publications are solely those of the individual author(s) and contributor(s) and not of MDPI and/or the editor(s). MDPI and/or the editor(s) disclaim responsibility for any injury to people or property resulting from any ideas, methods, instructions or products referred to in the content. |
© 2023 by the authors. Licensee MDPI, Basel, Switzerland. This article is an open access article distributed under the terms and conditions of the Creative Commons Attribution (CC BY) license (https://creativecommons.org/licenses/by/4.0/).