Technical Note

Mapping Diverse Paddy Rice Cropping Patterns in South China Using Harmonized Landsat and Sentinel-2 Data

1
Macro Agriculture Research Institute, College of Plant Science and Technology, Huazhong Agricultural University, Wuhan 430070, China
2
College of Resources and Environment, Huazhong Agricultural University, Wuhan 430070, China
3
Key Laboratory for Geographical Process Analysis & Simulation of Hubei Province, College of Urban and Environmental Sciences, Central China Normal University, Wuhan 430079, China
4
International Food Policy Research Institute, 1201 I Street, NW, Washington, DC 20005, USA
5
State Key Laboratory of Remote Sensing Science, Jointly Sponsored by Aerospace Information Research Institute, Chinese Academy of Sciences and Beijing Normal University, Beijing 100101, China
*
Author to whom correspondence should be addressed.
These authors contributed equally to this work.
Remote Sens. 2023, 15(4), 1034; https://doi.org/10.3390/rs15041034
Submission received: 29 December 2022 / Revised: 5 February 2023 / Accepted: 13 February 2023 / Published: 14 February 2023
(This article belongs to the Special Issue Remote Sensing for Mapping Farmland and Agricultural Infrastructure)

Abstract

:
Paddy rice cropping patterns (PRCPs) play important roles in both agroecosystem modeling and food security. Although paddy rice maps have been generated over several regions using satellite observations, few studies have focused on mapping diverse smallholder PRCPs, which include crop rotation and are dominant cropping structures in South China. Here, an approach called the feature selection and hierarchical classification (FSHC) method was proposed to effectively identify paddy rice and its rotation types. Considering the cloudy and rainy weather in South China, a harmonized Landsat and Sentinel-2 (HLS) surface reflectance product was employed to increase high-quality observations. The FSHC method consists of three processes: cropping intensity mapping, feature selection, and decision tree (DT) model development. The FSHC performance was carefully evaluated using crop field samples obtained in 2018 and 2019. Results suggested that the derived cropping intensity map based on the Savitzky–Golay (S-G) filtered normalized difference vegetation index (NDVI) time series was reliable, with an overall accuracy greater than 93%. Additionally, the optimal spectral (i.e., normalized difference water index (NDWI) and land surface water index (LSWI)) and temporal (start-of-season (SOS) date) features for distinguishing different PRCPs were successfully identified, and these features are highly related to the critical growth stage of paddy rice. The developed DT model with three hierarchical levels based on optimal features performed satisfactorily, and the identification accuracy of each PRCP can be achieved approximately 85%. Furthermore, the FSHC method exhibited similar performances when mapping PRCPs in adjacent years. These results demonstrate that the proposed FSHC approach with HLS data can accurately extract diverse PRCPs over fragmented croplands; thus, this approach represents a promising opportunity for generating refined crop type maps.

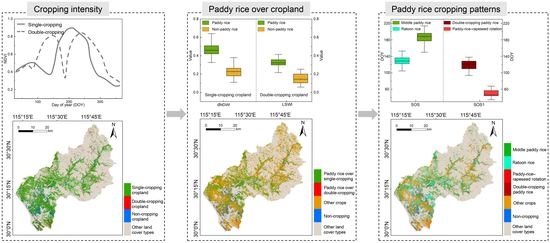
Graphical Abstract

1. Introduction

Paddy rice is one of the most important staple foods worldwide, accounting for more than 12% of global cropland area [1]. As a major grain crop, paddy rice not only contributes critically to global food security but also has a significant impact on climate changes caused by greenhouse gas (GHG) emissions in agricultural production systems [2,3]. Moreover, the widespread paddy rice cropping patterns (PRCPs) in subtropical regions, where the paddy-rice–winter-wheat rotation and double-cropping paddy rice systems are widely distributed, have drawn the attention of scientific communities [4,5,6]. The various PRCPs have different tillage practices, such as drainage, plowing, and fertilization, that impact the physical and chemical properties and microbial activities of soil, which in turn affect GHG emissions [7,8]. Additionally, information on cropping rotations involving paddy rice and other crops is critical for adjusting the cropping structure [9,10]. Therefore, it is of great significance to extract the spatial distributions of various PRCPs accurately and to obtain their dynamic changes over time.
Satellite remote sensing has become the most effective tool for large-scale crop type mapping due to its wide spatial coverage with frequent data acquisition and low observation costs [11]. Previous studies focused mainly on extracting the spatial distribution of paddy rice using various classification strategies with multi-scale satellite images (e.g., using MODIS and Landsat-5/7/8) [12,13,14]. Among these methods, the specific flooding signal of paddy fields in the flooding and rice transplanting periods has been widely adopted to map paddy rice over large regions on a regular basis [15,16]. During these phases, the paddy rice plants are sparse, and the fields are largely covered by surface water, which causes the pixel reflectance of the field on satellite images to be dominated by the spectral signal of water [17]. Nevertheless, this feature alone cannot be suitable for identifying all PRCPs, such as paddy-rice–rapeseed rotations or double-cropping paddy rice. Because paddy rice and other crops exhibit different spectral or phenological features throughout their growing periods [18,19], sufficient time-series images are essential for capturing specific differences among various crop types.
Traditionally, moderate spatial resolution (≥250 m) satellite images with short revisit cycles (e.g., MODIS, AVHRR, etc.) are preferred over obtaining long-term and continuous observations in practice. The coarse pixel grids of these images may contain several land cover types, leading to undesired errors when identifying PRCPs, especially over fragmented and smallholder croplands. By contrast, decametric resolution (10–30 m) images, which can reduce the land cover mixtures effectively, are thus more suitable for diverse PRCP mapping. However, due to the impacts of clouds and the long revisit cycles of these satellites, it is difficult to derive continuous observations from only a single satellite. Thus, several methods that combine various satellites to increase the number of high-quality observations have been proposed and can be divided into two groups. The first group involved the development of spatiotemporal fusion methods, including STRAFM [20], STRUM [21], and CACAO [22], to blend a few decametric-resolution observations (e.g., Landsat) and continuous hectometric-resolution observations (e.g., MODIS) for the generation of continuous decametric-resolution observations. Although these methods can take advantages of fine-scale information and high-frequency observations from decametric- and hectometric-resolution images, respectively, the accuracy of the derived high-spa-tiotemporal-resolution images was usually restricted by the spatial heterogeneity of the land surface and the robustness of the fusion methods. By contrast, the combination of various satellites with similar decametric-resolution sensors shows great potential for generating high-quality, fine-scale, and continuous observations [23,24]. Particularly, the harmonized Landsat and Sentinel-2 (HLS) surface reflectance product [25], which provides an opportunity for the synergistic use of Landsat and Sentinel-2 data, is promising for the mapping of complex crop types in smallholder farming systems.
Several studies have explored different crop type mapping strategies using time-series images from multi-source satellite observations. For instance, imageries from the MODIS, Landsat, and PALSAR-2 sensors were combined to derive paddy rice areas in Vietnam during the summer growing period of 2015 using the random forest model [26]. The hybrid convolutional neural network and long short-term memory architecture were developed to map crop rotations in northern Hunan Province based on the combined Sentinel-1 and -2 image time series [27]. However, most previous studies suffered from several limitations in terms of achieving the goal of mapping PRCPs. First, although temporal information is critical for identifying different crop types, the traditional image stacking approach that involves many temporal features may introduce unnecessary information redundancy and reduce computational efficiency in the classification process [28,29]. Second, only single- and double-cropping paddy rice crops were identified, whereas detailed paddy rice patterns (e.g., paddy-rice–rapeseed rotations and middle paddy rice systems) were usually neglected [30], leading to increased difficulty in understanding the crop structures or rotations which are essential for studies on crop management. Finally, although synthetic aperture radar (SAR) data were employed to reduce the impacts of cloud contamination on the optical data [31], the combination of SAR and optical data may introduce additional uncertainties in crop type mapping caused by the somewhat different band wavelengths and imaging systems of these sensors. These limitations highlight the necessity to explore the potentials of datasets obtained from integrated optical sensors (i.e., HLS) and to propose an effective classification approach for mapping various PRCPs.
The objective of this study is to develop a pragmatic approach, namely the feature selection and hierarchical classification (FSHC) method, to map the crop rotations involving paddy rice and other crops using the HLS data. In view of the diverse PRCPs and fragmented croplands in South China, the Qichun county in Hubei Province was selected as the study area. Specifically, this paper aims to: (1) propose a phenology-based approach to identify the cropping intensity, (2) select the critical temporal and spectral features for separating each crop, and (3) develop a straightforward decision tree (DT) model based on the optimal features for mapping PRCPs efficiently. Furthermore, the field samples collected in 2018 and 2019 were employed to evaluate the performance of both cropping intensity and PRCP maps derived by the FSHC method. This paper is organized as follows. Section 2 describes the study area and detailed materials in this study. Section 3 introduces the framework of the FSHC method, including cropping intensity map derivation, feature selection, and PRCP mapping, whereas Section 4 provides the corresponding results of each part in the FSHC method. Section 5 explores the specific advantages of the proposed FSHC method. The limitations and future improvements are also discussed in this section. Finally, Section 6 provides concluding remarks on this study.

2. Study Area and Materials

2.1. Study Area

Qichun county, which is located in the southern part of Hubei Province, was selected as the study area (Figure 1). The area of Qichun county is approximately 2400 km2, of which the proportion of cropland is greater than 28%. The agricultural landscape in this county is quite heterogeneous due to the complex terrains and widely distributed smallholder farming systems. Qichun is characterized by a humid subtropical monsoon climate with four distinct seasons, and the average annual temperature and average annual precipitation are approximately 17 °C and 1350 mm, respectively. The sufficient sunshine and rainfall conditions are suitable for developing various cropping patterns, including single- and double-cropping practices. According to field surveys and agricultural statistics, there are four main PRCPs in the study area, i.e., double-cropping paddy rice, rapeseed–paddy-rice rotation, middle paddy rice, and ratoon rice. Figure 1 shows a calendar schedule of these four PRCPs in the study area. The overlapping growth periods among various crop types indicate the good representativeness of the study area for evaluating the FSHC method with regards to identifying diverse PRCPs.

2.2. Harmonized Landsat and Sentinel-2 (HLS) Data

The HLS surface reflectance product released by the National Aeronautics and Space Administration (NASA) was generated from the Operational Land Imager (OLI) and Multi-Spectral Instrument (MSI) onboard the Landsat-8 and Sentinel-2 satellites, respectively. The combined sensors can achieve global observations every 2–3 days at a spatial resolution of 30 m or higher [25]. Specifically, the HLS comprises three types of surface reflectance products: L30 (OLI 30 m), S30 (MSI 30 m), and S10 (MSI 10 m). In this study, the L30 and S30 products were selected because their spatial resolutions are consistent, and both were reprocessed by atmospheric correction, spatial coregistration, bidirectional reflectance distribution function normalization, and band pass adjustment to reduce the uncertainty between the two sensors. Table 1 shows the band names and the corresponding wavelength ranges for L30 and S30.
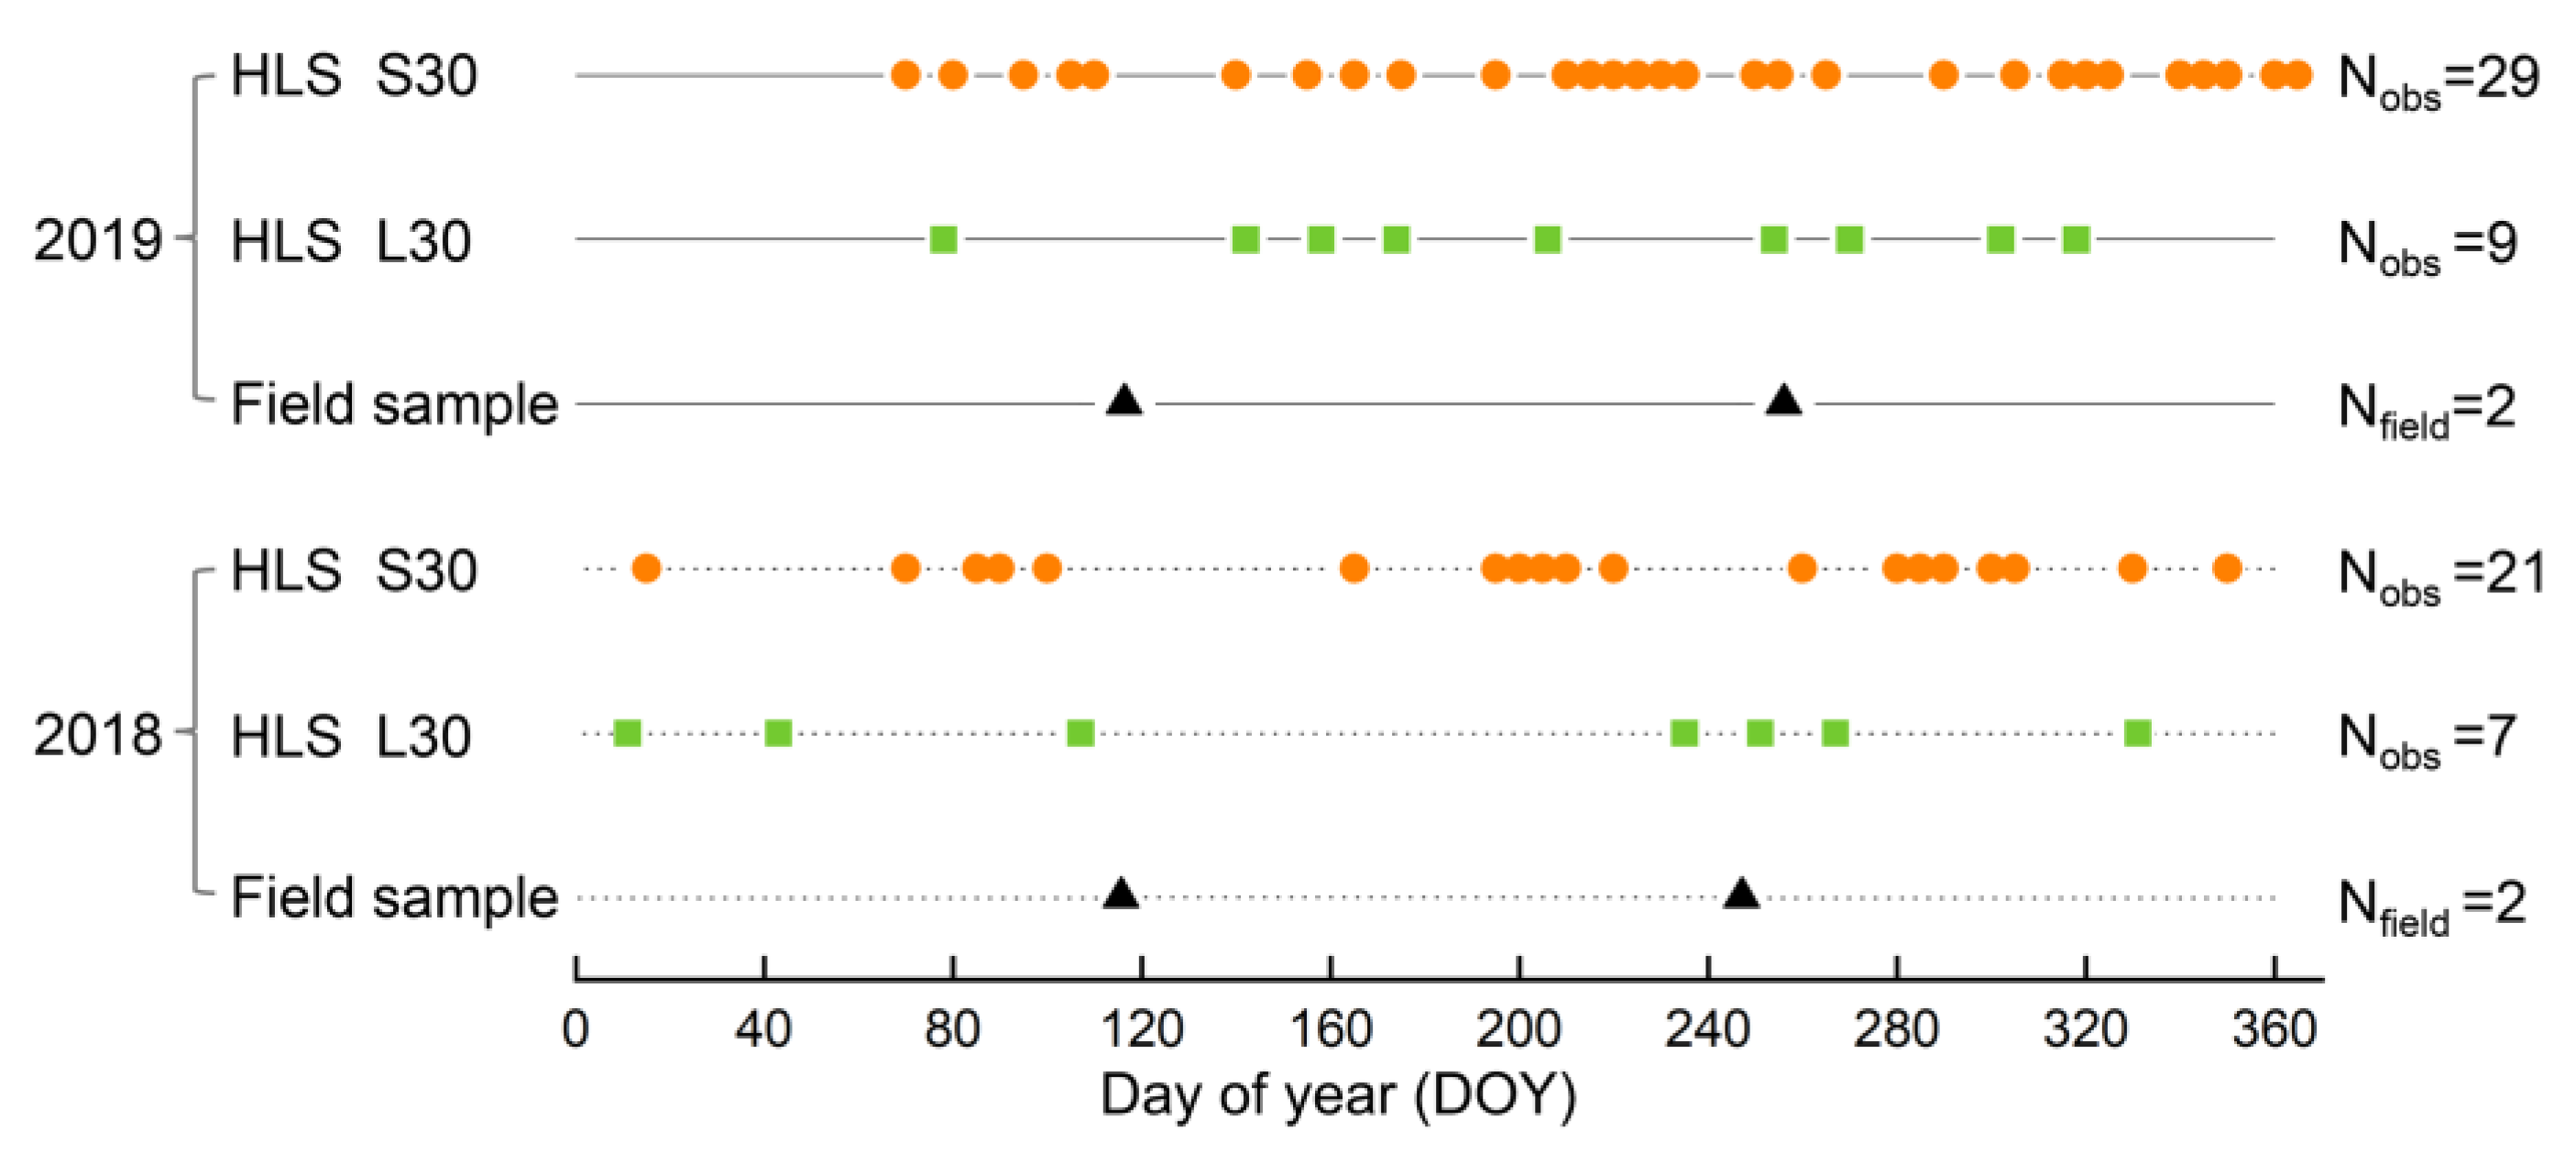
According to the spatial location of Qichun county and the HLS tiling system, data corresponding to three tiles, i.e., 50RLU, 50RKU, and 50RMU, were downloaded from the NASA website (https://hls.gsfc.nasa.gov/data (accessed on 13 July 2022)). To select high-quality HLS products without cloud contaminations, a quality assurance (QA) layer and visual interpretation were both employed. As a result, totals of 28 and 38 high-quality images taken in 2018 and 2019 were obtained, respectively. The specific observation dates of these HLS images in each year are shown in Figure 2. It is noteworthy that the 2019 HLS data were used to develop the FSHC method to extract PRCPs, whereas the 2018 data were adopted to further evaluate the robustness of the proposed method in different years.

2.3. Vegetation Indices Derived from HLS Data

Vegetation indices (VIs) have been widely employed to identify land cover types and to monitor vegetation growth due to their sensitivity to green vegetation or water bodies [32]. Because NDVI exhibits high correlations with leaf area index and leaf chlorophyll content, it has usually been selected in studies involving vegetation-growth monitoring, crop identification, and cropping intensity mapping [33,34,35]. The LSWI, which is sensitive to the water contents of the vegetation and ground, is among the most important spectral features for paddy rice identification and was, thus, selected herein. The LSWI of paddy fields in particular is greater than the NDVI when paddy rice is at the unique flooding stage [36,37]. Thus, a flooding signal vegetation index (FSVI) calculated by subtracting the NDVI from the LSWI was developed to identify the flooding stage of paddy rice. Compared to the normalized difference water index (NDWI), which can suppress vegetation information and achieve the purpose of highlighting water signals [38], the modified normalized difference water index (MNDWI) can further reduce background impacts, such as those induced by vegetation and soil [39]. Therefore, the above 5 VIs were calculated for the feature optimization and PRCP mapping in this study, as shown in Table 2.

2.4. Field Samples

A total of 897 field survey samples were collected in Qichun county in 2019, comprising 840 crop samples and 57 non-crop samples (e.g., fallow land, artificial ponds, etc.). To identify the multi-cropping patterns, these field samples were recorded twice, during the periods of April 23–25 and September 29–30, respectively. These 840 field samples were further divided into 586 single- and 254 double-cropping crop types. Specifically, the spatial distributions of the crop samples, including 195 ratoon rice, 199 middle paddy rice, 192 other single-cropping types, 57 double-cropping paddy rice, 101 paddy-rice–rapeseed rotation, and 96 other double-cropping types, are shown in Figure 1a. Among these crop patterns, some crop samples other than paddy rice contained multiple crop types, such as rapeseed–dryland crop rotations, wormwood crops, and so on. The field samples of each crop type were divided into a 70% subset for training and a 30% subset for validation. Thus, 410 single-cropping samples (134 non-paddy rice samples and 276 paddy rice samples including 139 middle paddy rice samples and 137 ratoon rice samples) and 178 double-cropping samples (67 non-paddy rice samples and 111 paddy rice samples including 71 paddy-rice–rapeseed samples and 40 double-cropping paddy rice samples) were employed as the training dataset to explore the optimal features for identifying various RPCPs. In addition, 166 crop field samples in 2018 were also collected (Figure 1a), which were used only as validation dataset to evaluate the FSHC performance for mapping various PRCPs in different years without training samples.

2.5. Land Cover Map and Slope Data

Because the single-cropping crop type and other vegetation types (e.g., deciduous broadleaf forest or shrub) may share similar spectral and phenological features, it is necessary to introduce a reliable cropland map to eliminate the potential misclassification from natural vegetation types. Otherwise, the additional identification criteria should be developed to remove other vegetation types, which would increase the complexity of the classification method and, therefore, be unsuitable for large areas. In this study, the GlobeLand30 land cover product with the spatial resolution of 30 m in 2020 (http://www.globallandcover.com (accessed on 5 June 2022)) was employed to extract the spatial distribution of croplands. The GlobeLand30 datasets were derived from more than 20,000 Landsat and Chinese environmental and disaster satellite (HJ-1) images with a pixel–object–knowledge (POK)-based approach [41]. An overall classification accuracy above 85% was achieved in China, and the difference in the cropland area between the GlobeLand30 and statistical data was only below 5% in Hubei Province [42,43], which imbue our confidence in the good performance of the extracted cropland over the study area.
Additionally, previous studies have suggested that croplands with slopes greater than 9° are not suitable for paddy rice cropping, as these areas would require considerable amounts of labor and material resources for rice irrigation and harvest [44]. Due to the complex terrain in the study area, a large proportion (>22%) of cropland with a slope greater than 9° was observed over all cropland pixels, indicating the necessity to introduce the slope data to mask the non-paddy field over the cropland. Based on the Advanced Spaceborne Thermal Emission and Reflection Radiometer (ASTER) Global Digital Elevation Model Version 3 (GDEM V3) data (https://asterweb.jpl.nasa.gov/gdem.asp (accessed on 10 June 2022)) [45], the land slope was calculated by obtaining the maximum rate of elevation change between each pixel and its neighbors. We also calculated the slopes of all paddy rice samples, i.e., –the double-cropping paddy rice, paddy-rice–rapeseed rotation, middle paddy rice, and ratoon rice, and found that more than 98% of the paddy rice samples were located on pixels with slopes less than 9°, indicating good reliability with regard to this suggestion. Therefore, slopes greater than 9° could be employed as a reliable criterion to remove many non-paddy rice pixels prior to FSHC classification in this study.

3. Methods

The workflow of the FSHC method to map various PRCPs is shown in Figure 3, which includes three sequential steps: (1) cropping intensity identification, (2) feature selection, and (3) DT model development. Specifically, the cropping intensity, i.e., whether a cropland was single-, double- and non-cropping, was first derived using NDVI time series from the HLS data. Then, the optimal features for identifying paddy rice and its associated rotation types were selected. Finally, the map of diverse PRCP was generated from the DT model based on the selected spectral–temporal features. The validation samples, which were randomly selected from field samples and were independent with training samples, were employed to evaluate the accuracy of the derived PRCP map. The detailed description of each step is provided in Section 3.1, Section 3.2, Section 3.3 and Section 3.4.

3.1. Cropping Intensity Identification

The cropping intensity, i.e., single-, double- and non-cropping cropland, is important for reducing the uncertainty of PRCP mapping over regions with multi-cropping patterns [23]. According to previous studies, NDVI and EVI were two widely adopted indicators to capture the growth cycles of crops [46,47]. Because the blue band is easily affected by the atmosphere, it is challenging to perform the atmospheric correction effectively, leading to many invalid reflectance pixels at this band [48]. Moreover, the EVI across different sensors may be inconsistent due to the more difficult and varying atmospheric correction strategies of the blue band [49]. Furthermore, the VI time series of crop field samples also exhibited that the NDVI was more stable than the EVI in this study. Therefore, the temporal trajectory of the NDVI was utilized to identify the cropping intensity.
To further eliminate the noises caused by clouds or aerosols in the NDVI time series, the Savitzky–Golay (S-G) temporal filtering method was used to improve the extraction of cropping intensity. The S-G filter based on local polynomial least squares fitting in the temporal domain is advantageous in clearly describing the long-term trends and local mutation information of the time series [50]. In this study, the S-G filter in the TIMESAT software package [51,52] was applied to derive the smooth HLS NDVI time series. According to experiments and analyses, the main parameters of the S-G filter, including the window size, spike, and adaptation, were set to 4, 2, and 1, respectively.
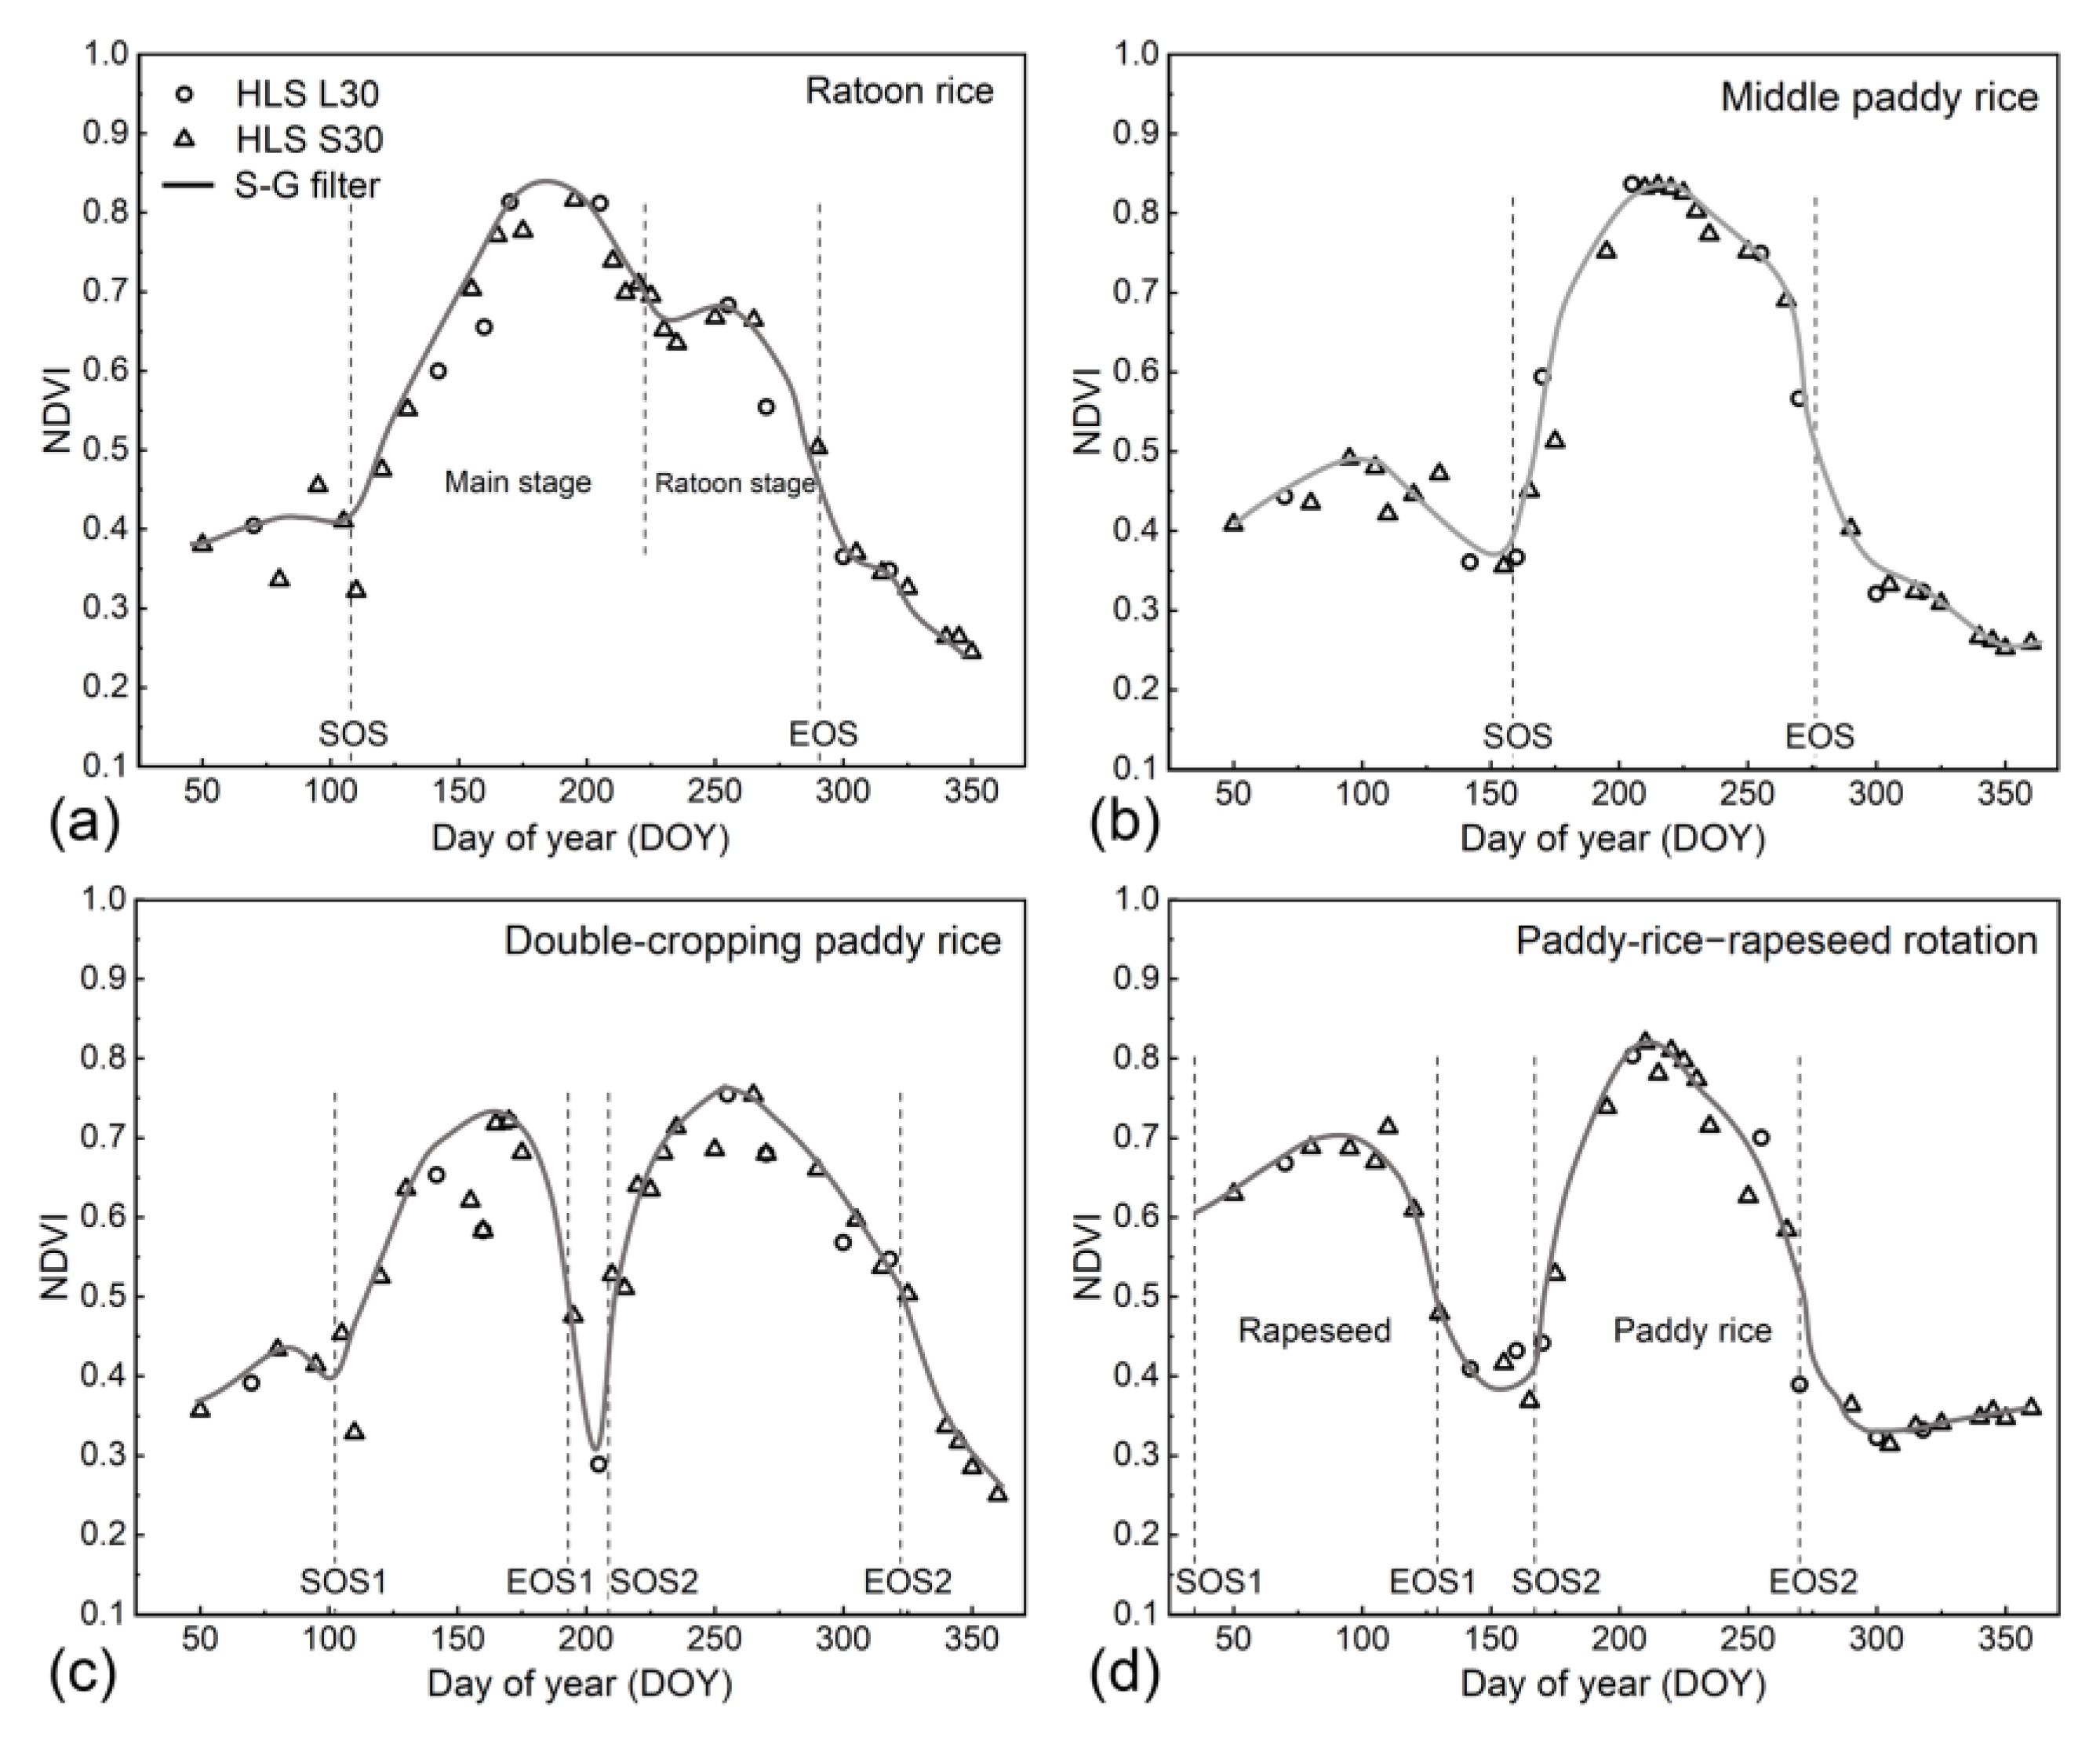
Based on the TIMESAT S-G filter, four phenological crop parameters [51], i.e., the start of season (SOS), end of season (EOS), maximum NDVI value (NDVImax), and length of the growing period (GPlength = EOS-SOS), were derived. Specifically, according to previous studies and the phenological characteristics of crop growth [50,53], the SOS and EOS were determined by the criteria of NDVI(t1 + 1) > NDVI(t1) and NDVI(t1) > 0.4, and NDVI(t2 + 1) < NDVI(t2) and NDVI(t2) < 0.5, respectively. Notably, the associated thresholds of these criteria were determined following the specific crop growth characteristics of field samples in this study. The earliest SOS and EOS dates were selected as long as they satisfied these criteria. Similarly, two SOSs (SOS1 and SOS2) and two EOSs (EOS1 and EOS2) can be obtained for the double-cropping cropland pixels. Then, the criteria defined as NDVImax > 0.5 and 60 < GPlength < 220 between each SOS and EOS were employed to determine the valid crop growth cycle. To improve the efficiency of cropping intensity identification, some non-paddy field pixels with slopes greater than 9° over croplands (Section 2.5) were excluded first. The derived results of 0, 1, and 2 for the remaining pixels (including paddy fields and non-paddy fields) were assigned to the non-, single- and double-cropping croplands in the cropping intensity map, respectively.

3.2. Feature Selection

According to field surveys and statistical data, the PRCPs were divided into two groups, i.e., a single- and a double-cropping group, to identify optimal spectral–temporal features for each group. Because the phenological parameters (SOS and EOS) can provide additional information for capturing the growth stages of crops, these parameters were also added as candidate features for identifying different PRCPs. Although the inclusion of excessive features is beneficial for detecting the subtle differences among various PRCPs, the involvement of redundant features may largely decrease the classification efficiency and accuracy [54]. To derive the four PRCP types targeted in this study efficiently, two essential processes, including the identification of paddy rice from the cropping intensity map and then the identification of each PRCP from the paddy-rice-cropping intensity map, were performed. The former process was to obtain common features for extracting all paddy rice pixels over croplands, whereas the latter process was to select individual features to distinguish between the different PRCPs. The details of each process are described below.
Because paddy rice has a unique flooding stage compared to other crop types, its critical identification features were easily obtained by analyzing the temporal trajectories of different VIs. Nevertheless, different paddy rice types within the same cropping intensity group have similar characteristics, leading to difficulties in selecting the optimal features for identifying each PRCP. Therefore, we employed the random forest (RF) model to automatically identify the key features for mapping each PRCP using all spectral–temporal and phenological features. The advantage of the RF model is that it can predict the importance of all input variables with regards to the final result, thus supporting feature optimization and data dimensionality reduction effectively [55]. The middle paddy rice and ratoon rice samples in the single-cropping group, and the paddy-rice–rapeseed and double-cropping paddy rice samples in the double-cropping group were utilized by the RF model to select the features with the highest pairwise separability in each group. These selected optimal features provided a basis for developing the DT model at different levels for mapping diverse PRCPs.

3.3. DT Model Development for Mapping Diverse PRCPs

In this study, the DT model was developed as a pragmatic method for mapping diverse PRCPs. As one of the most popular classification methods, the DT model is a hierarchical classification approach that uses multi-layer rules within the tree structure to construct discriminant functions of the classification rules. Due to its advantages of independent statistical assumptions and non-parametric models, DTs with high computational efficiencies, good flexibility, and good robustness, have generally been employed in large-scale land cover classification studies [56,57].
Specifically, the DT model in this study was constructed based on the identified cropping intensity (Section 3.1), for which the classification rules were derived from the optimal features selected for identifying various PRCPs (Section 3.2), as shown in Figure 4. First, the cropping intensity data provided the spatial distribution information of the single-, double-, and non-cropping cropland in the study area. Then, based on the optimal feature for identifying paddy rice from single-cropping cropland (i.e., TOF_PRSC) and double-cropping cropland (i.e., TOF_PRDC), the crop types containing the paddy rice were further extracted. Furthermore, the single-cropping types containing paddy rice were divided into middle paddy rice and ratoon rice based on the optimal feature for identifying middle paddy rice (i.e., TOF_MPR), whereas the double-cropping types containing paddy rice were divided into double-cropping paddy rice and paddy-rice–rapeseed rotation using the optimal feature for identifying double-cropping paddy rice (i.e., TOF_DPR). Finally, the map associated with 7 land cover types, including 4 PRCPs, other crops, non-cropping cropland, and other land cover types, was generated for the study area.

3.4. Performance Evaluations

To understand the performance of the proposed FSHC method comprehensively, both the cropping intensity map and the PRCP map were evaluated. According to the synthesized field data, the numbers of single-, double- and non-cropping cropland samples for the evaluation of the cropping intensity map were 176, 76, and 57, respectively. Among these samples, the numbers of paddy rice and non-paddy rice over single-cropping cropland were 118 and 58, respectively, whereas those over double-cropping cropland were 47 and 29, respectively. Finally, field samples, including 58 ratoon rice, 60 middle paddy rice, 30 paddy-rice–rapeseed rotation, 17 double-cropping rice, and 87 other crops, were adopted to evaluate the FSHC performance. The overall accuracy (OA), producer’s accuracy (PA), and user’s accuracy (UA) metrics from the confusion matrix were adopted to evaluate the map of various PRCPs. Additionally, 166 field samples in 2018 (Section 2.1) were employed to analyze the temporal robustness of the FSHC approach for identifying PRCPs over different years.

4. Results

4.1. Derived Cropping Intensity Map

Figure 5 shows the NDVI temporal trajectory of four PRCPs after S-G filtering in the study area. It can be observed that the temporal filtered NDVI captured the seasonal crop dynamics of each PRCP well, i.e., ratoon rice, middle paddy rice, double-cropping paddy rice, and paddy-rice–rapeseed rotation. The ratoon rice and middle paddy rice both exhibited single-cropping patterns with one growth peak, whereas the paddy-rice–rapeseed rotation and double-cropping paddy rice each presented two peaks in one year. The specific characteristic of ratoon rice is that it can be harvested twice following only one seeding. Thus, the ratoon rice was categorized into the single-cropping group in this study. Nevertheless, the ratoon rice grew better in the first growth stage than in the ratoon stage (Figure 5a), which should raise awareness that the second NDVI peak may not be easily detected in practice.
The cropping intensity map in the study area was generated by adopting the criteria for detecting the number of cropping events in Section 3.1, as shown in Figure 6a. The single-cropping crops constituted the main cultivation pattern in the study area, accounting for over 60% of the total cropland area. The double-cropping croplands were located mostly in hilly areas over the northeast and southern regions, whereas the non-cropping areas were generally spatially distributed near artificial surfaces and water bodies. According to the pseudo-color images (RGB channels were composited by near-infrared, red, and green bands, respectively) from the HLS S30 product on June 4, 2019, the single-, double- and non-cropping cropland were primarily displayed as dark red, bright red, and dark blue, respectively. As expected, this is because the single-cropping crops (mainly ratoon rice) and double-cropping crops (mainly paddy-rice–rapeseed rotation) on this observation date were at the peak and start of growth, respectively (Figure 1). The evaluation results indicated the good performance of the derived cropping intensity map, with an accuracy of 93.20% based on field samples (Figure 6b). Moreover, the PA and UA of each cropping pattern also exhibited the potential to achieve a good accuracy of over 90%. Finally, only croplands with single- or double-cropping patterns were employed to map the diverse PRCPs.

4.2. Optimal Features for Identifying Various PRCPs

According to the developed FSHC strategy, totals of 192 (5 VIs × 38 time points + 2 phenological parameters) and 194 (5 VIs × 38 time points + 4 phenological parameters) features were prepared for single- and double-cropping groups, respectively. Figure 7 shows the temporal trajectories of 5 VIs (Section 2.3) representing paddy rice and non-paddy rice in the single- and double-cropping groups, respectively. For single-cropping croplands (the lower panel of Figure 7), both NDVI and NDWI exhibited significant separability between paddy rice and non-paddy rice on several observation dates. Specifically, the NDVI of paddy rice was greater than that of non-paddy rice from day of year (DOY) 160–220, whereas the paddy rice displayed higher and lower NDWIs than the non-paddy rice from DOY 110–140 and 160–210, respectively. The higher NDWIs of paddy rice from DOY 110–140 can be explained by the specific flooding phase of paddy rice. Apart from NDVI and NDWI, the other VIs cannot identify paddy rice and non-paddy rice effectively over all observation dates. In terms of the double-cropping croplands (the upper panel of Figure 7), only LSWI showed good separability between paddy rice and non-paddy rice from DOY 110–140 and 200–220, corresponding to the two flooding phases of paddy rice. Thus, the derived temporal and spectral features provided critical information for developing the criteria of the paddy rice identification within the DT model.
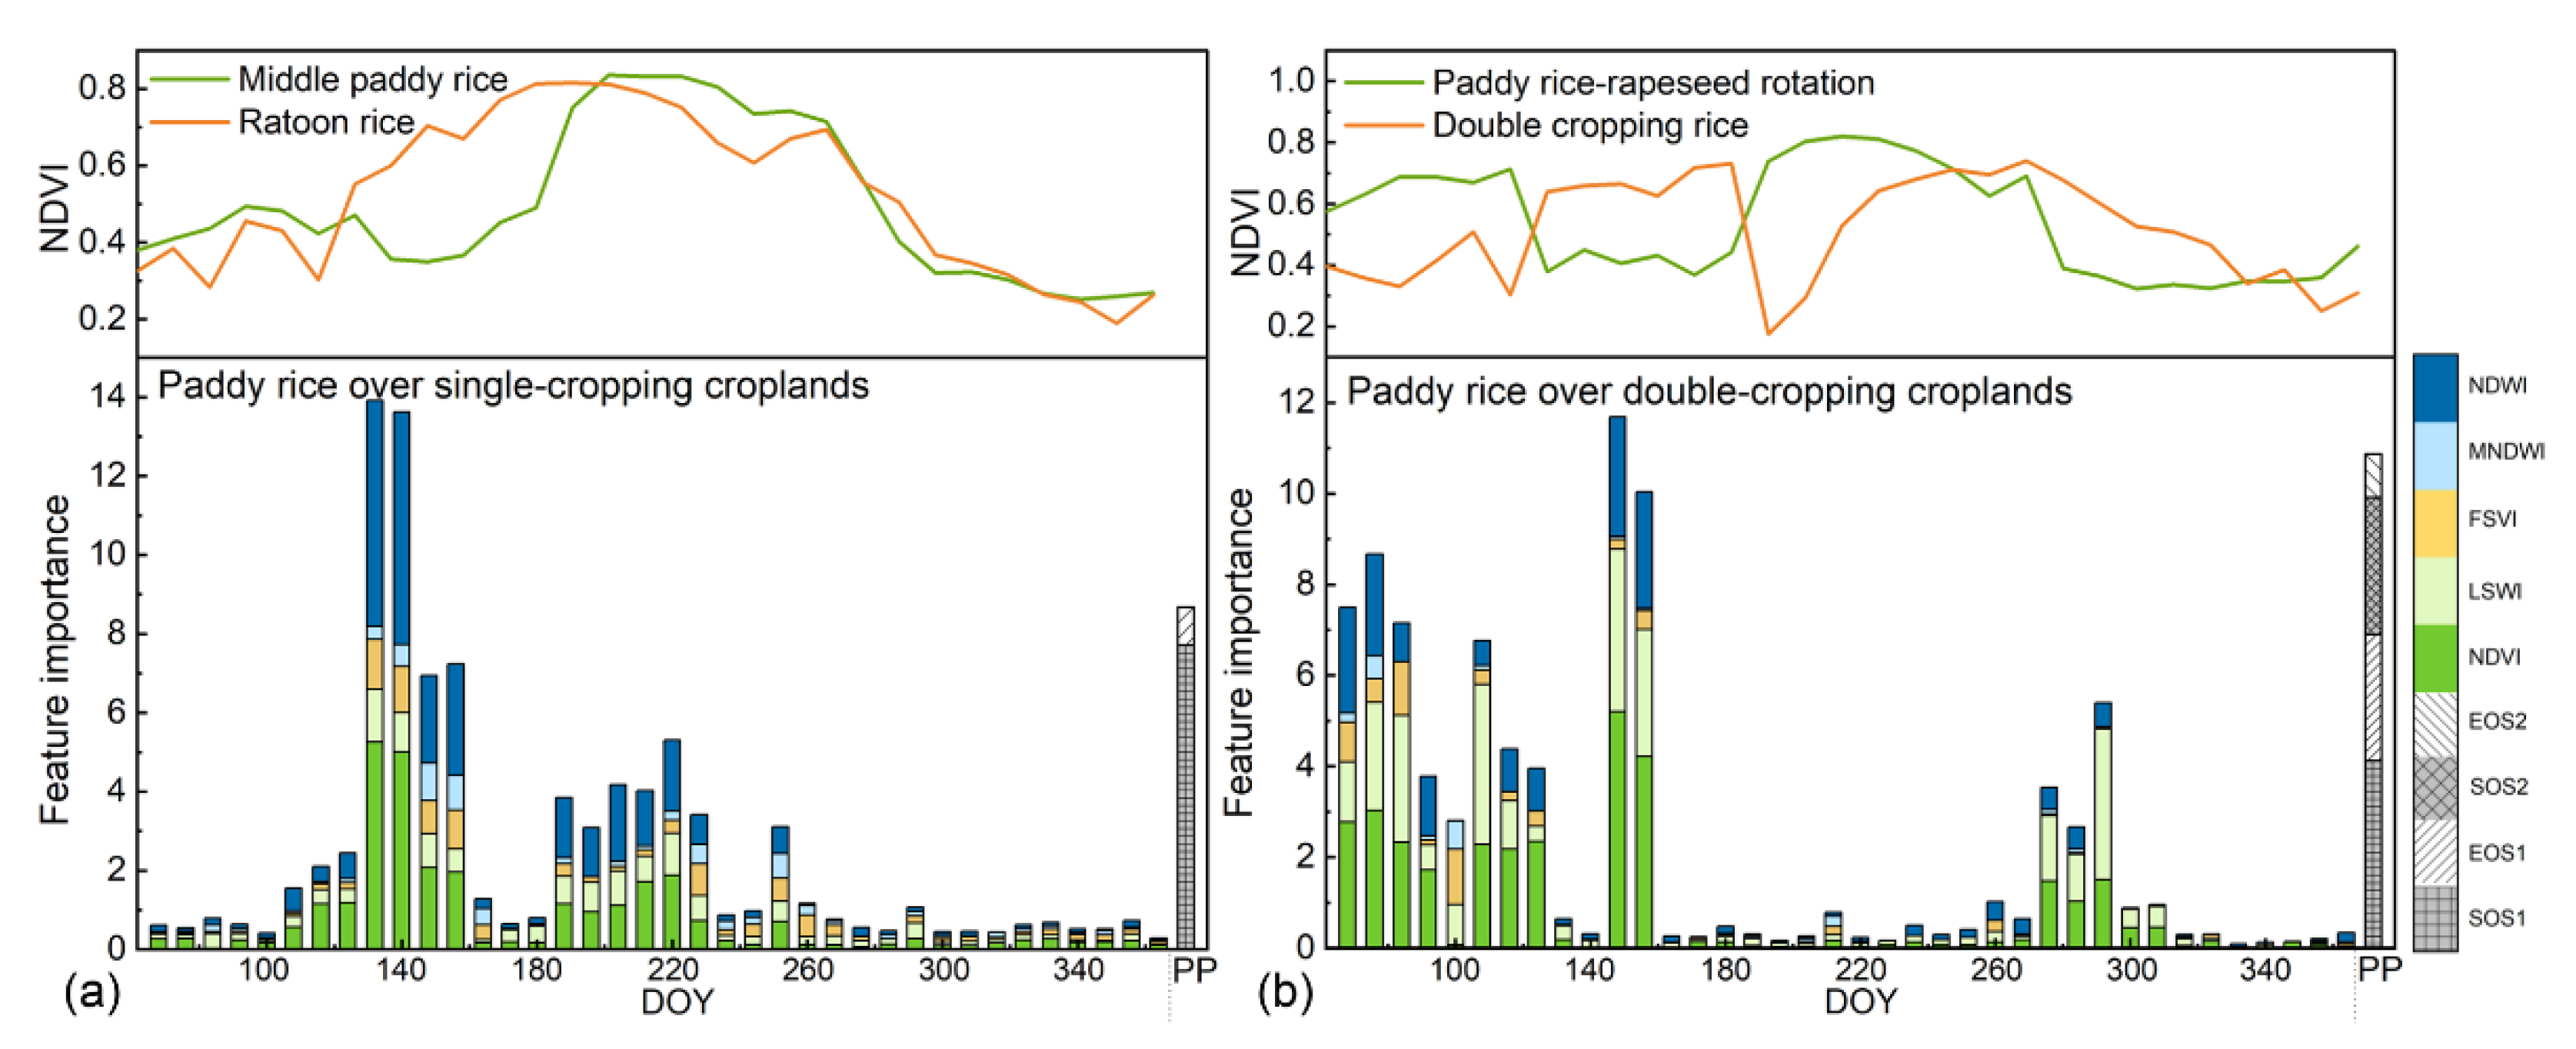
Regarding the separability between middle paddy rice and ratoon rice over the single-cropping cropland, DOY 130 was the most important temporal feature, which was also denoted by the NDVI time series (Figure 8a). This result can be explained primarily by the different growth stages of these cropping systems at this observation date, i.e., the flooding stage of middle paddy rice and the first tillering stage of ratoon rice. Furthermore, the phenological phase of the SOS and the spectral features of the NDVI and NDWI were obviously superior to those of other features. According to the evaluation of feature importance for paddy-rice–rapeseed rotation and double-cropping rice (Figure 8b), the critical temporal feature was approximately DOY 150, corresponding to the flooding stage of paddy rice in the paddy-rice–rapeseed rotation and the tillering stage of early paddy rice in the double cropping paddy rice. Moreover, due to the different crops in the first cropping pattern (i.e., rapeseed for the paddy-rice–rapeseed rotation and paddy rice for the double-cropping paddy rice), SOS1 played the most important role among the four phenological phases. Finally, NDVI and LSWI also exhibited good performances for identifying paddy-rice–rapeseed rotation and double-cropping paddy rice.

4.3. The Developed DT Model Based on the Optimal Feature Analyses

Figure 9 shows the boxplot of selected VIs on various dates for paddy rice and non-paddy rice in the single- and double-cropping groups, respectively. In the single-cropping group, the NDWI can exhibit the specific characteristics of paddy rice well, i.e., paddy rice has higher and lower NDWI than non-paddy rice during the flooding stage (DOY 110–140) and peak stage (DOY 195–205), respectively. However, due to the negative effects of similar spectral characteristics between paddy rice and aquatic plants (e.g., lotus) on ponds at the flooding stage as well as other crop types (e.g., wormwood) at the peak stage, using a single feature may not derive a satisfactory result for paddy rice and non-paddy rice identification over the single-cropping cropland. Thus, the difference of NDWI (dNDWI) between these two stages was calculated to highlight the unique characteristics of paddy rice, as shown in Figure 9a. The maximum separability between paddy rice and non-paddy rice could be observed when the dNDWI was greater than 0.35, which can be adopted to extract paddy rice in the single-cropping group. For the double-cropping group (Figure 9b), the LSWI was a critical indicator showing the flooding signals of paddy rice, i.e., the first flooding stage (DOY 105–150) of paddy-rice–rapeseed rotation and the two flooding stages (DOY 105–150 and DOY 195–210) of double-cropping rice. Thus, a minimum LSWI threshold of 0.35 was set in these two stages to identify paddy rice in the double-cropping group.
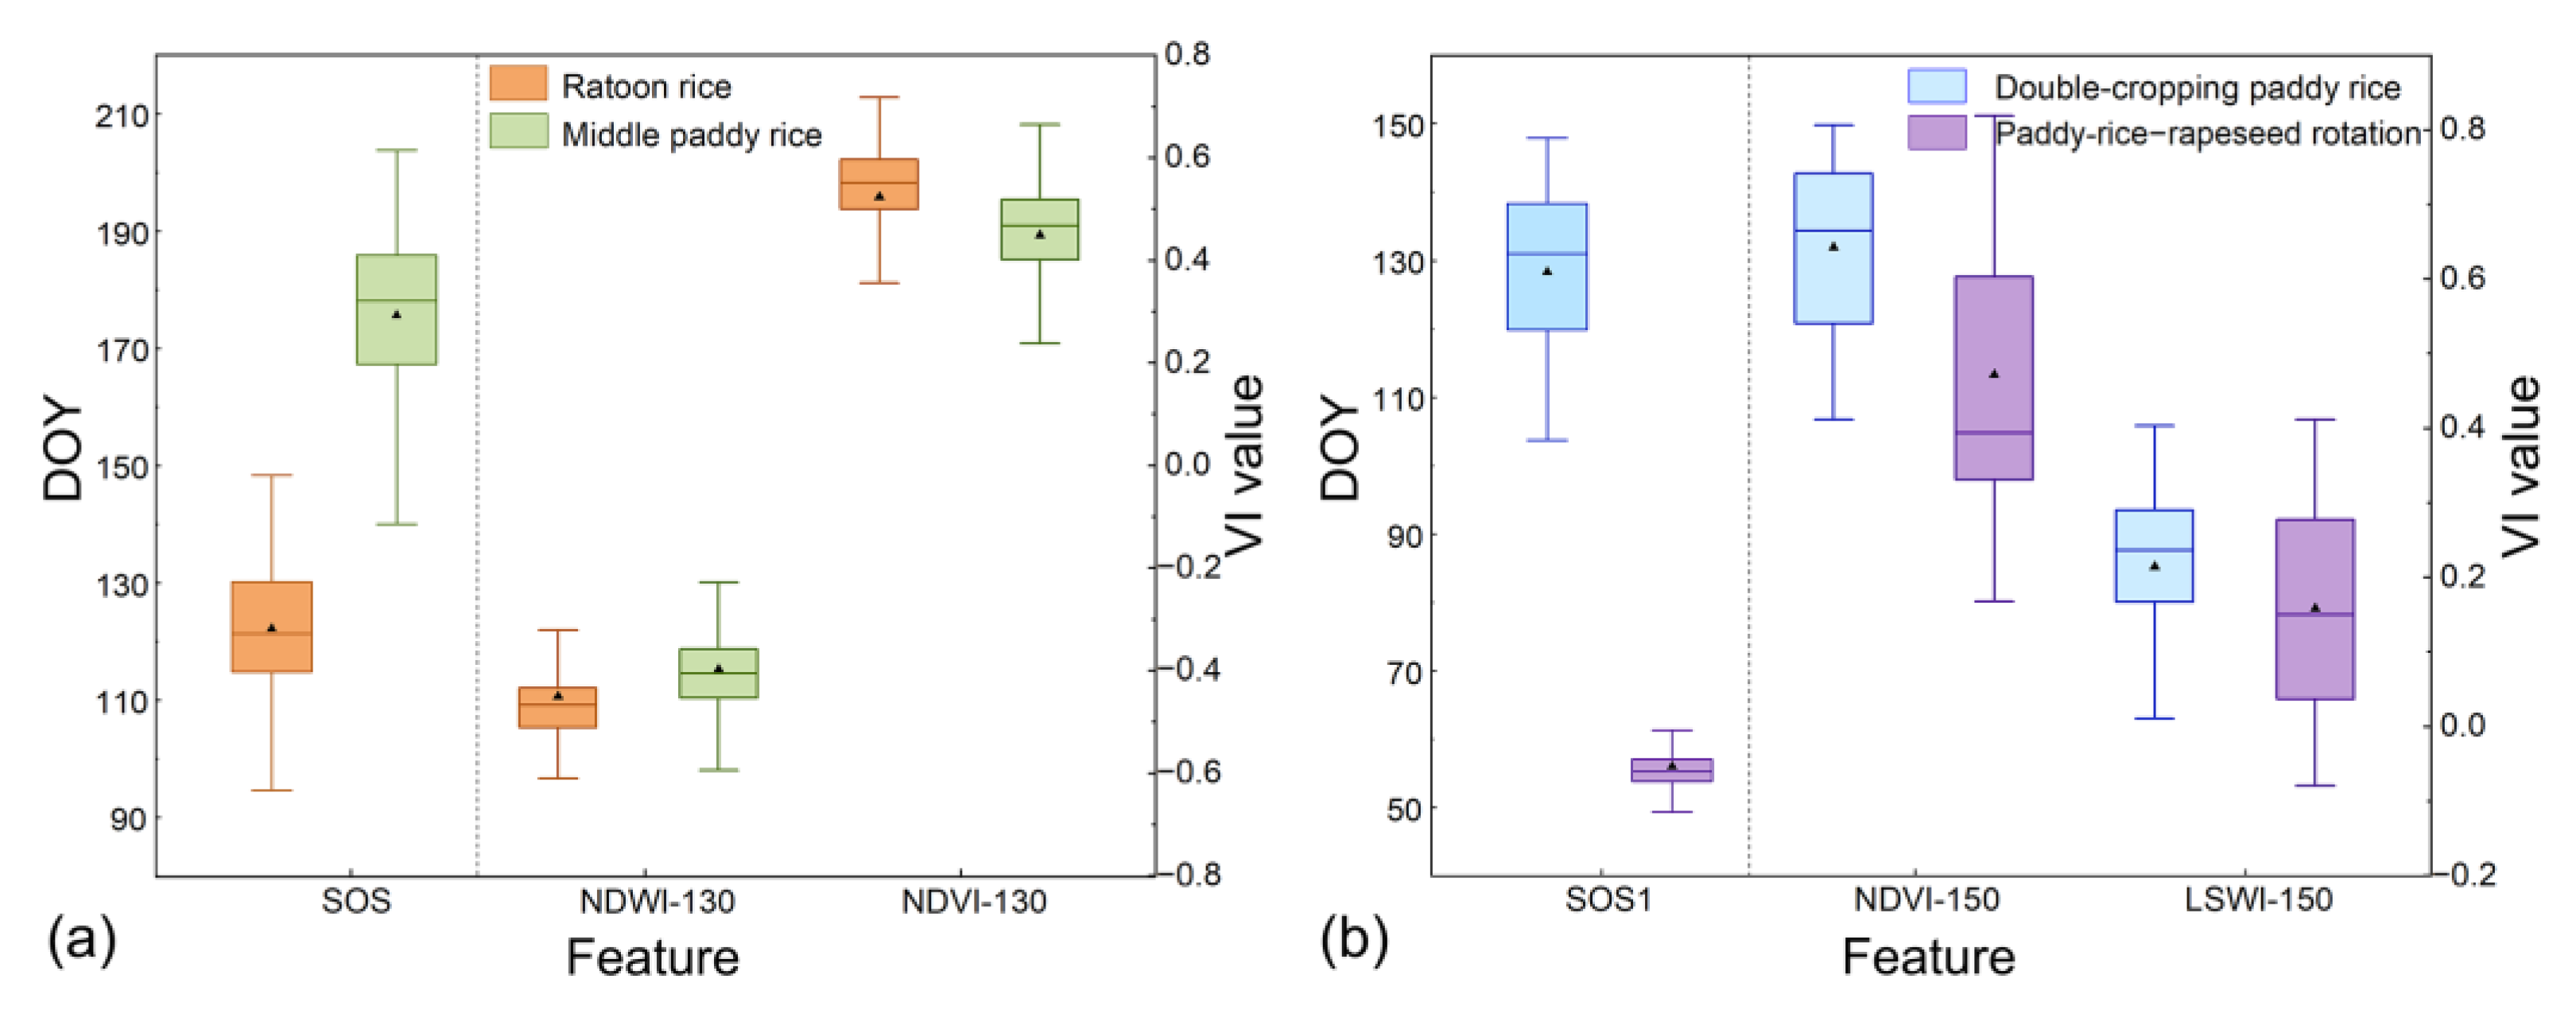
Furthermore, Figure 10 exhibits the value ranges of the top three features for the four PRCPs. It can be observed that the separability of the SOS dates between ratoon rice and middle paddy rice was larger than those of the NDVI and NDWI (Figure 10a), which was determined by the growth stages of these cropping patterns. Thus, an SOS later than DOY 150 was adopted as the criterion to identify middle paddy rice, whereas the remaining pixels in the single-cropping paddy rice group were ratoon rice. Similarly, the first stage of SOS (SOS1) performed best for separating double-cropping rice and paddy-rice–rapeseed rotation in the double-cropping group (Figure 10b), with SOS1 dates later than DOY 70 for double-cropping rice and earlier than DOY 70 for paddy-rice–rapeseed rotation. Overall, although the analyzed crop types have different growth stages, the SOS or SOS1 was always the best phenological feature for extracting the specific PRCP easily as long as the paddy rice crop intensity was identified.
Thus, the classification rules of the DT model, i.e., TOF_PRSC: dNDWI > 0.35, TOF_PRDC: LSWI > 0.35 in the flooding stage (DOY 105–150 or DOY 195–210), TOF_MPR: SOS > 150, and TOF_DPR: SOS1 > 70, were determined to map diverse PRCPs based on the above selected feature thresholds. It is noteworthy that the identification of PRCPs benefited from three hierarchical levels, i.e., the cropping intensity, paddy rice extraction, and specific PRCP extraction. These levels can thus greatly reduce the potential impacts of other crop types with similar spectral or phenological features on PRCP identification results.

4.4. Evaluation of the PRCP Map

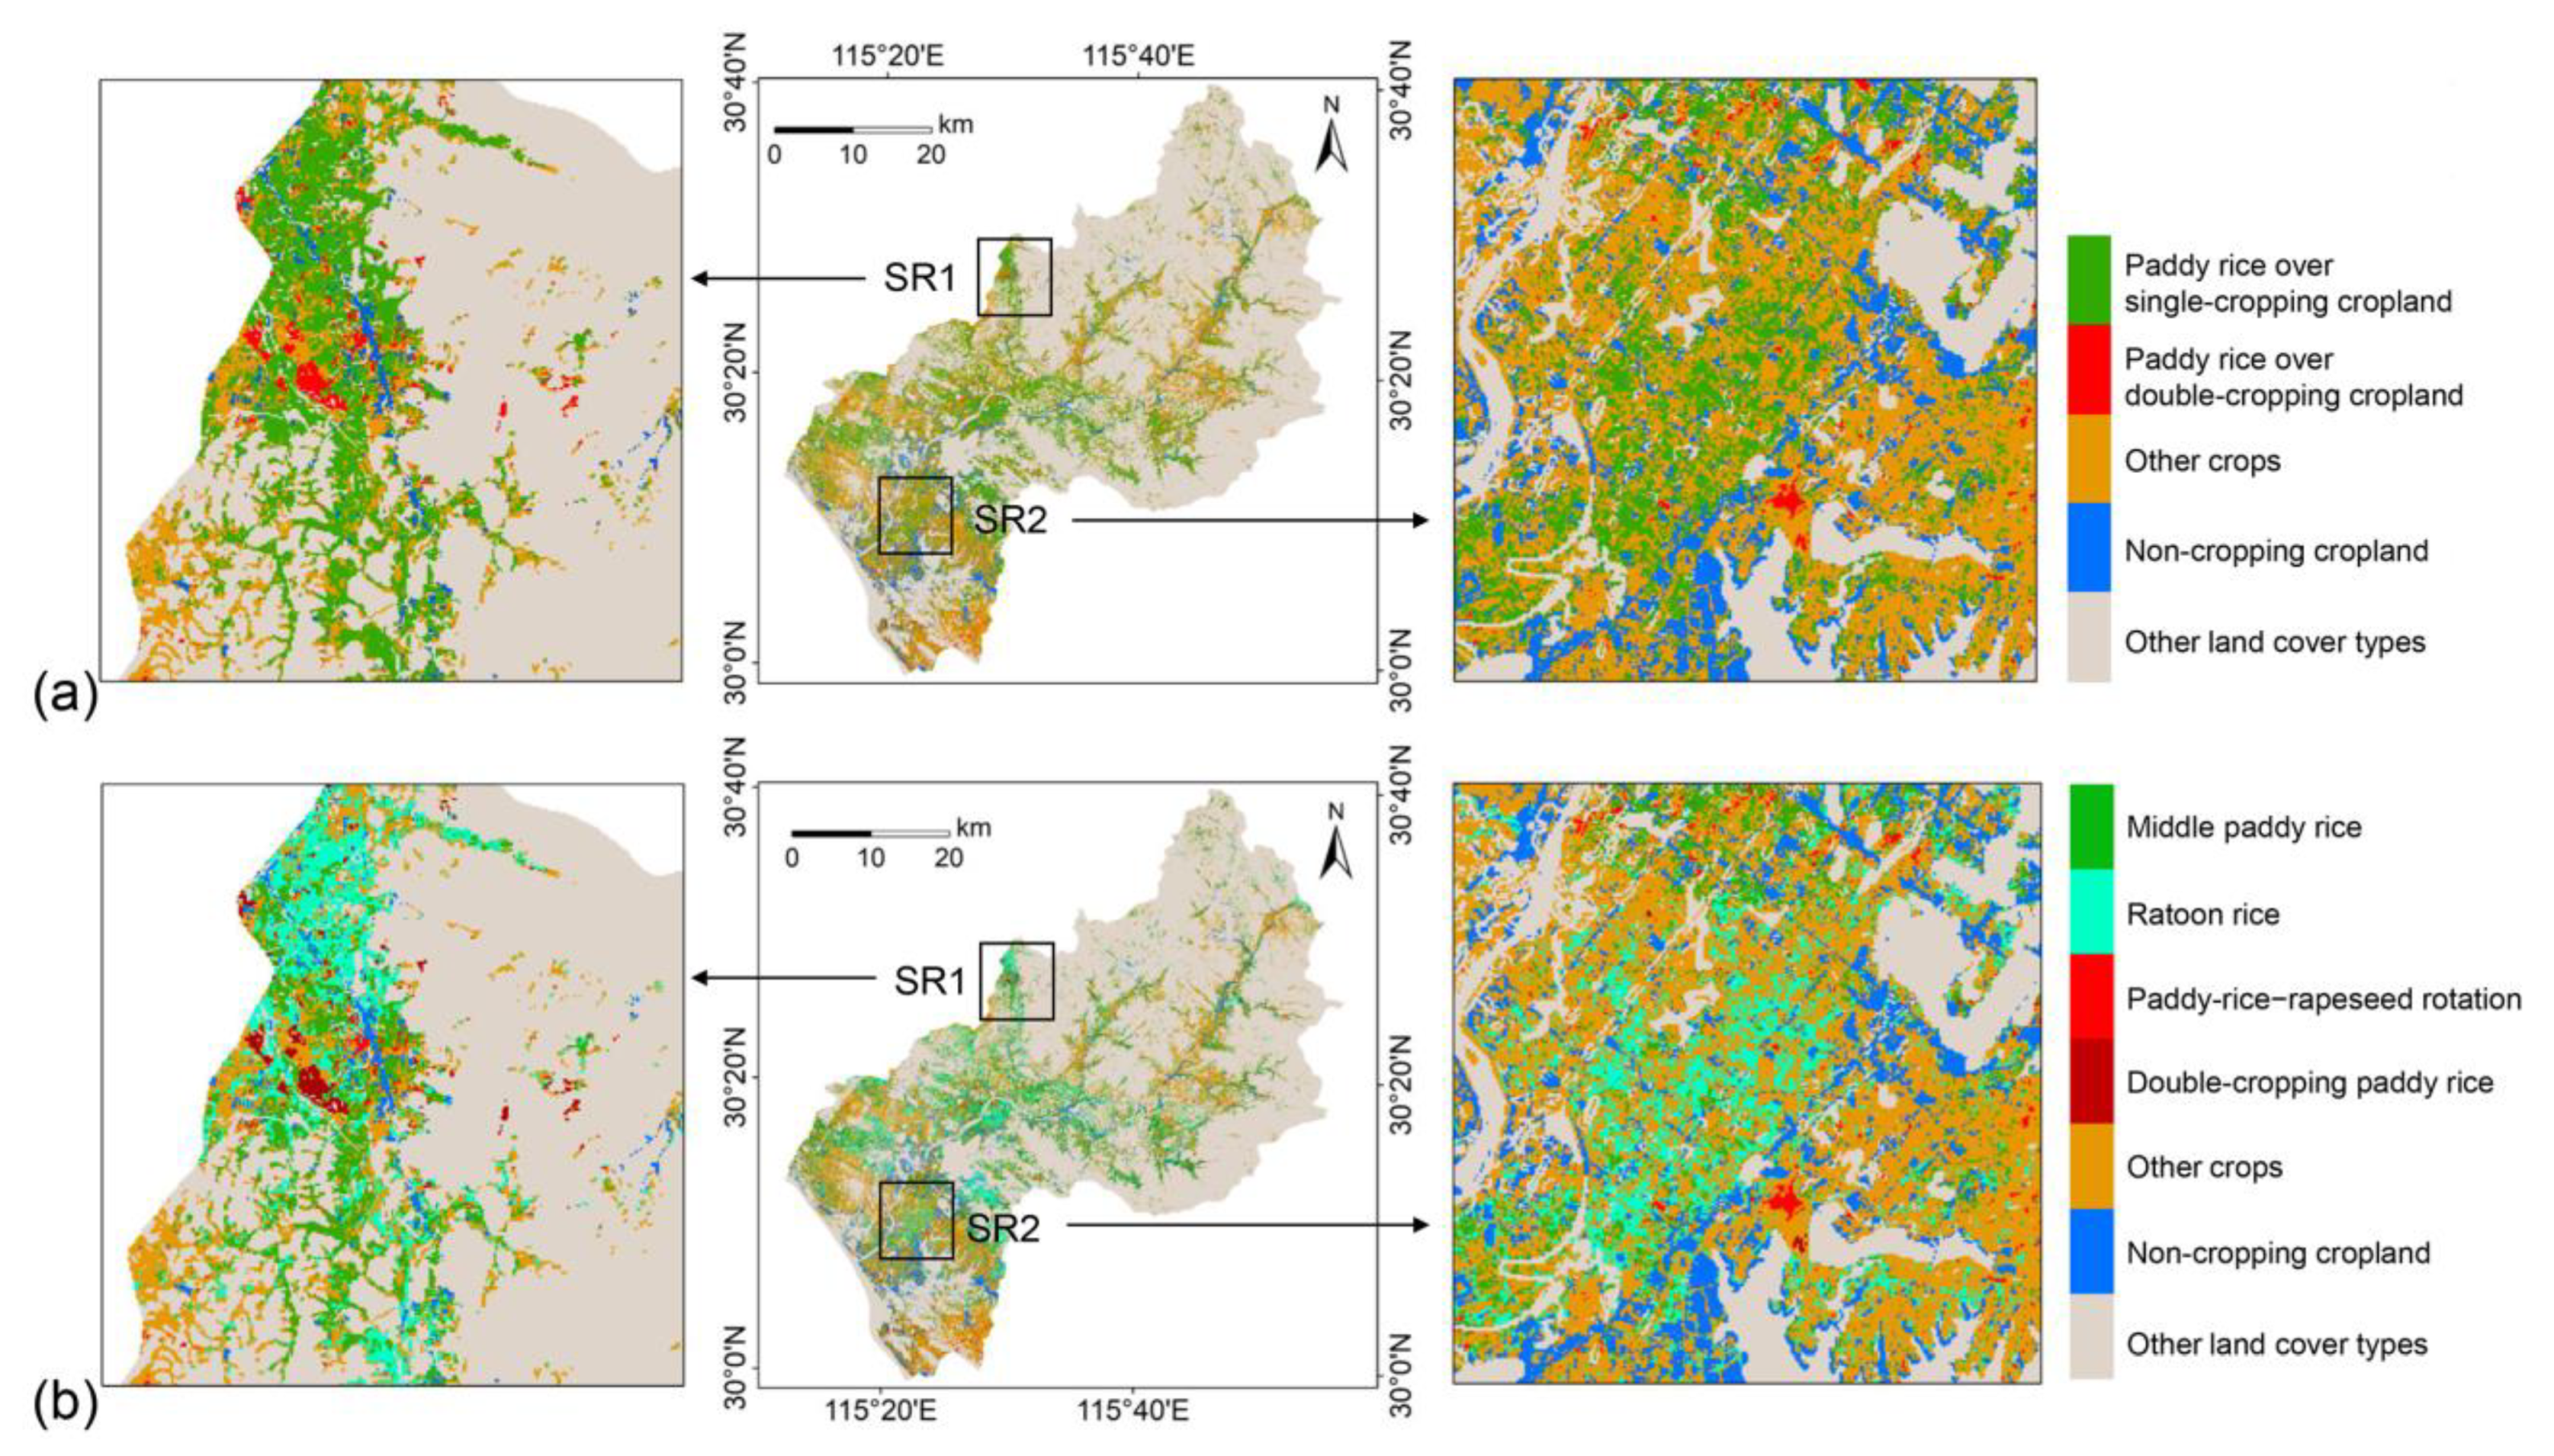
Figure 11 shows the cropping intensity map of paddy rice and the diverse PRCP map in 2019 based on the developed DT model. The single-cropping paddy rice was widely distributed in flat regions within the study area, whereas the double-cropping paddy rice was clustered over the non-flat area with low elevation. For the various PRCPs shown in Figure 11b, the area of ratoon rice was slightly larger than that of middle paddy rice, and most of the paddy rice in the double-cropping croplands was represented by the paddy-rice–rapeseed rotation system. Furthermore, Figure 11 shows that the PRCPs were quite heterogeneous across the fragmented croplands, thus highlighting the importance of high spatiotemporal resolution HLS data for fine-scale crop mapping.
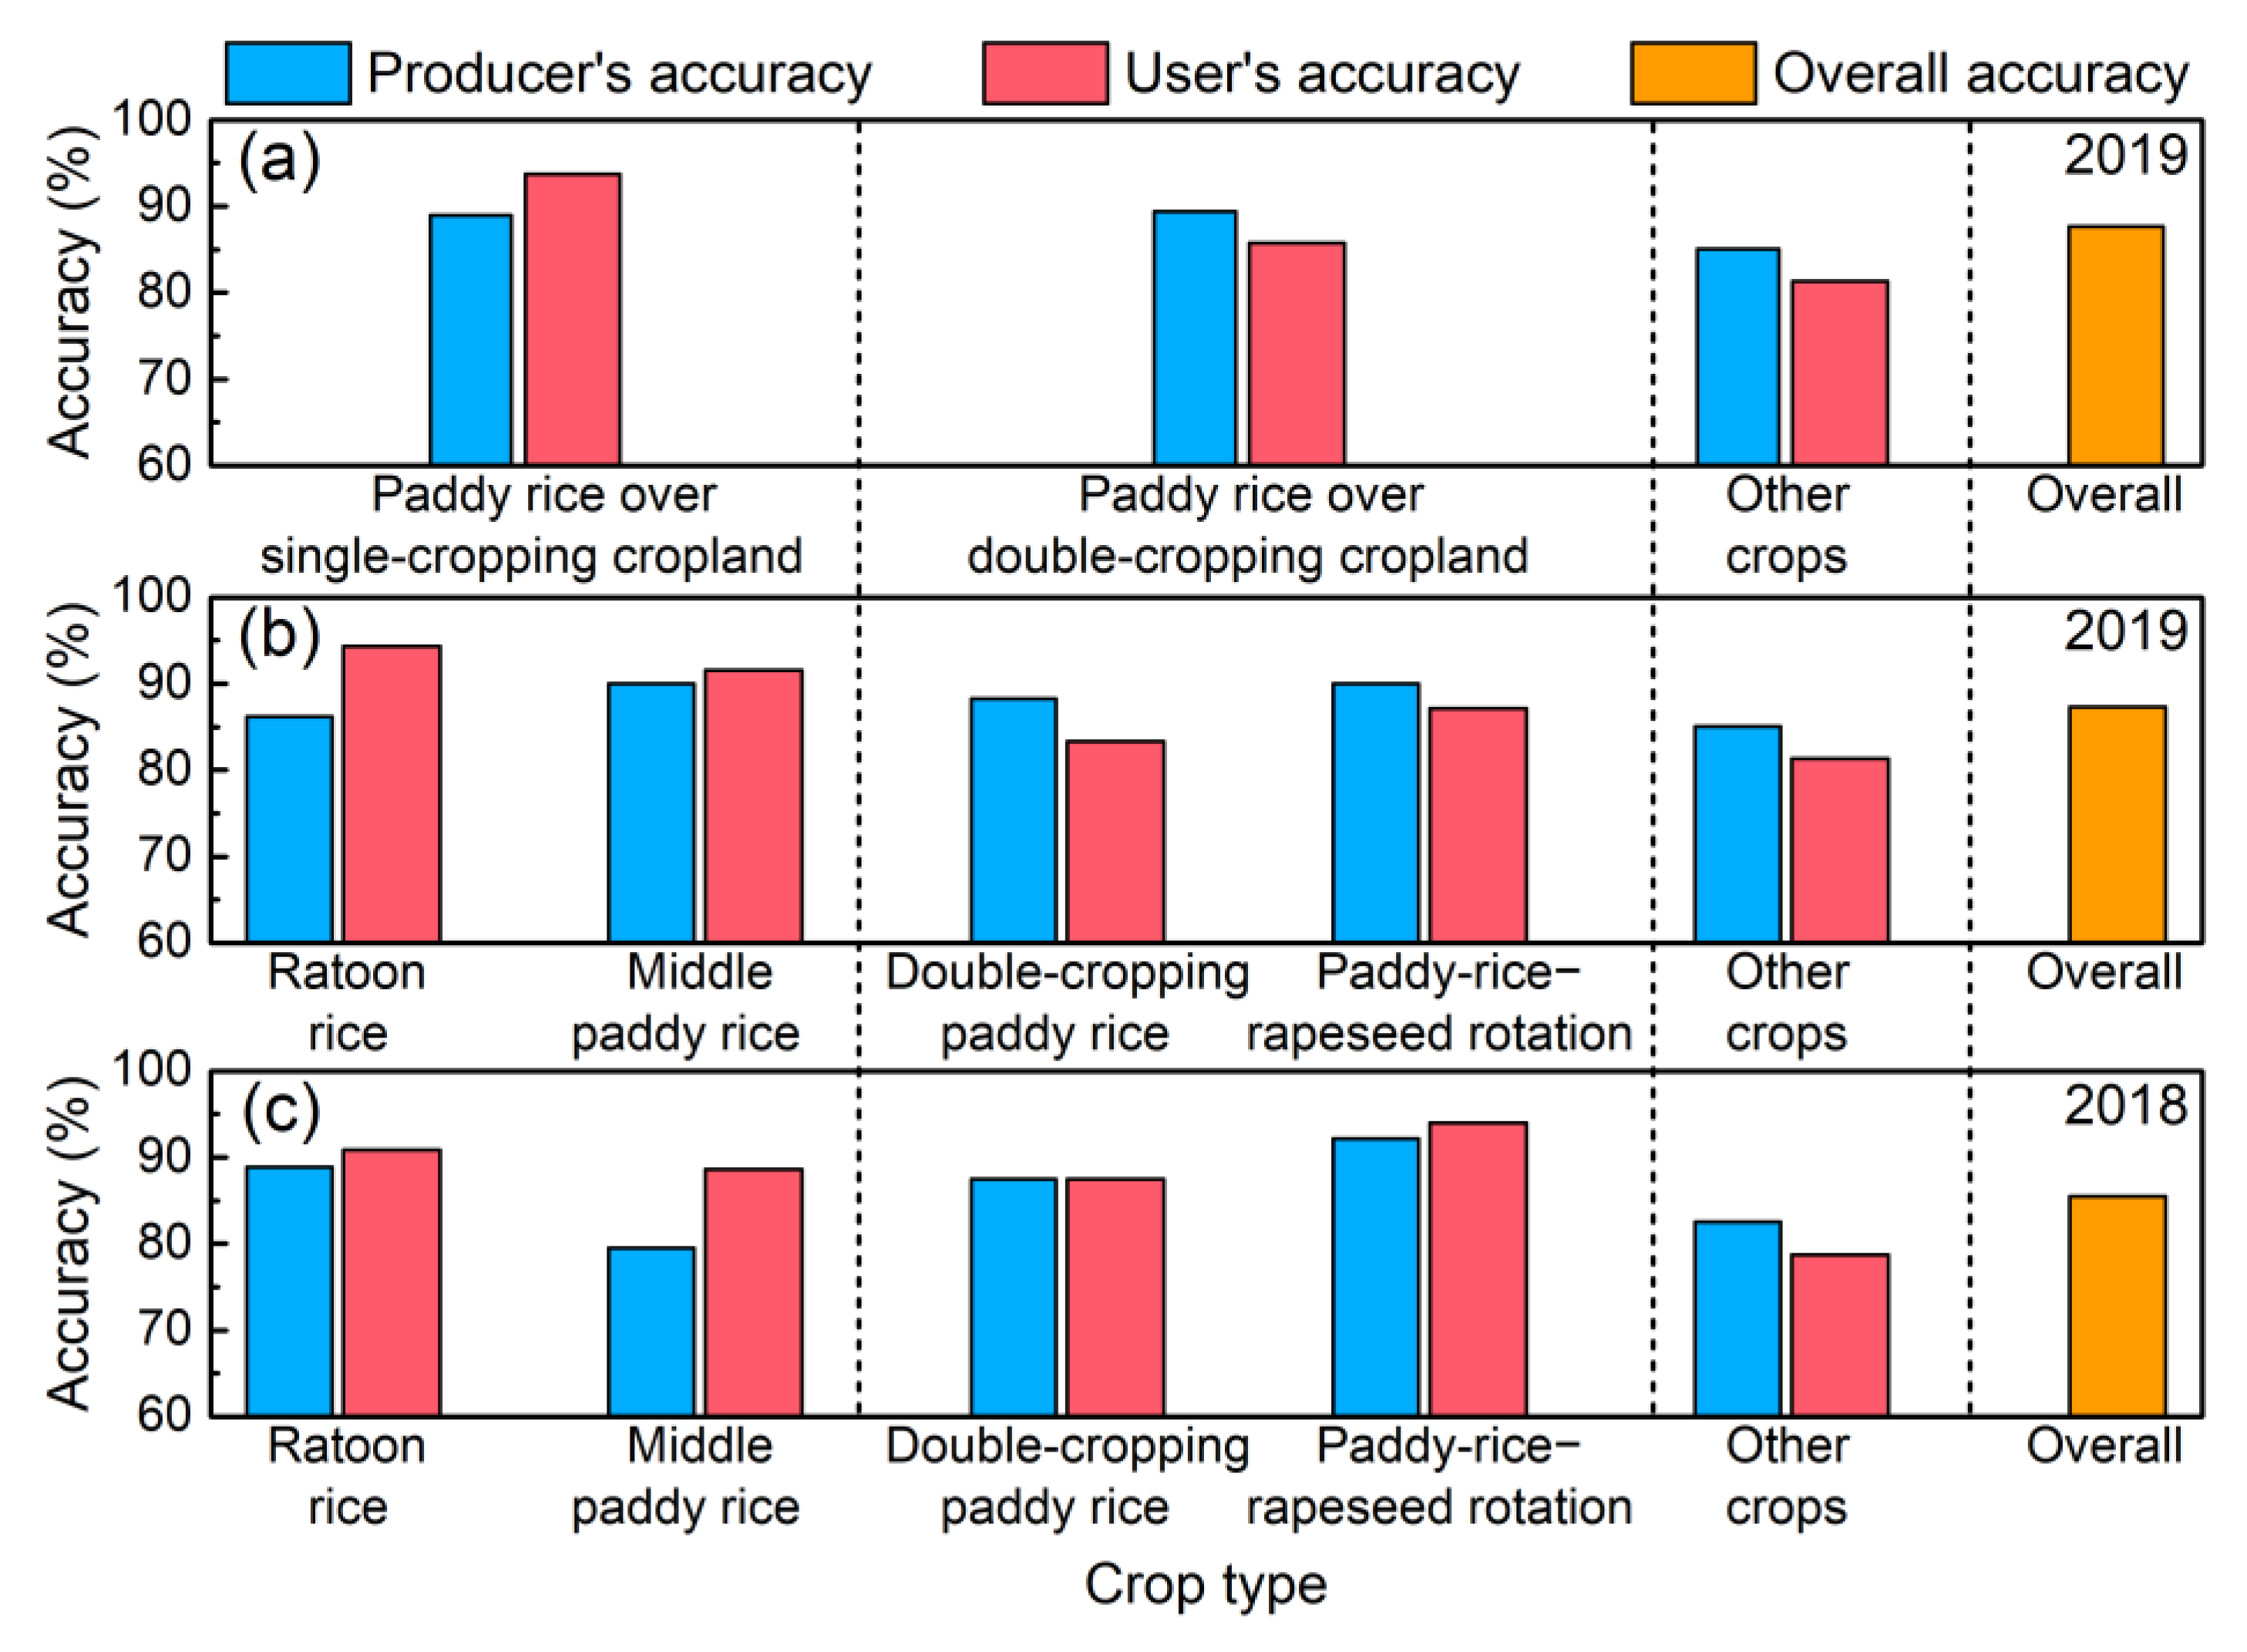
Additionally, the derived cropping intensity map of paddy rice was first evaluated based on the validation samples, as shown in Figure 12a. The accuracy of paddy rice identification over single-cropping croplands was the highest (PA = 88.98% and UA = 93.75%), followed by those of paddy rice over double-cropping croplands and other crops. These results can be explained by the better extraction performance of single-cropping croplands than that of double-cropping croplands, as well as by the relatively long flooding stage of single-cropping paddy rice (Figure 1), which can be easily captured by HLS images. Furthermore, the overall identification accuracy for the three crop types was 87.7%, indicating the good reliability of the paddy rice cropping intensity map. Regarding the performance of the derived PRCPs (Figure 12b), the proposed FSHC could distinguish ratoon rice and middle paddy rice over the single-cropping paddy rice croplands well, with both PA and UA greater than 85%. The extracted double-cropping paddy rice and paddy-rice–rapeseed rotation samples also displayed good agreement with the field samples, and the OA was 87.3%. Finally, the FSHC method was also implemented to generate PRCPs based on 28 high-quality HLS images in 2018. Note that the accuracy of PRCPs in 2018 was also evaluated using the corresponding 166 field samples, as shown in Figure 12c. The best extraction performance was exhibited for ratoon rice, with PA and UA of 88.89% and 90.91%, respectively, whereas other crops presented the lowest accuracy of approximately 80%. The OA of the extracted PRCPs was 85.49%, which was slightly inferior to that of results in 2019. Although the number of high-quality HLS images in 2018 was less than that in 2019, the FSHC method holds great potential to map PRCPs with robust performances in different years.

5. Discussion

5.1. Specific Advantages of the Proposed FSHC Method

In this study, the proposed FSHC method was used to effectively identify various PRCPs with an overall accuracy greater than 85%, which is comparable with that found in other similar studies [58,59,60]. Particularly, the FSHC is advantageous in the following aspects. Because different PRCPs have various impacts on the environment and food security, this study aimed to extract fine-scale paddy rice planting information. This study represented an important improvement in understanding cropping structures compared to previous studies that attempted only single- or double-cropping paddy rice identifications. Furthermore, high spatiotemporal resolution images were required to reduce the mixed-pixel effects caused by the fragmented croplands in South China and to capture the specific temporal features of each PRCP. Nevertheless, due to the trade-off between the spatial and temporal resolutions of images and due to cloud impacts, a single decametric resolution sensor may not satisfy the requirement for the number of high-quality images. Thus, the HLS product was introduced to maximize the advantages of combining different sensors with consistent surface reflectance, which has been demonstrated to map the diverse PRCPs accurately (Figure 12).
Additionally, the FSHC method employed a feature selection process based on separability analyses to maximize the computational efficiency and improve the mapping accuracy. Notably, the selected spectral and temporal features can well represent typical growth stages of paddy rice. For instance, the reason why the importance levels of the NDWI and LSWI were higher than those of other VIs can be attributed to the flooding stage of paddy fields, which is the unique characteristic of paddy fields. After extracting paddy rice in single- or double-cropping croplands, the SOS exhibited the most significant differences among various PRCPs and was thus selected as the optimal feature. Finally, considering the complex cropping patterns in South China, the FSHC method was developed based on three hierarchical levels, which could also be applied to other regions with similar cropping patterns. This classification strategy can not only reduce the negative impacts induced by the presence of other crops but can also provide important information for the uncertainty analysis of the PRCP map.

5.2. Implications, Limitations, and Future Improvements

Taking Qichun county as an example, this study generated the PRCP map by the proposed FSHC method. The PRCP map is the fundamental dataset for various agricultural applications. For instance, the sustainable management of agricultural lands is an urgent need for feeding the growing population. Thus, the detailed spatial distribution of different PRCPs is essential for paddy rice yield estimation, crop planting pattern adjustment, and agricultural production management [61,62]. Particularly, because paddy rice is grown on flooded soils, the PRCP map plays important roles in terms of both trace methane emissions and water resource management [16,17,30]. However, there are several limitations that should be addressed in the future.
First, due to the limited spatial coverage of field samples, the FSHC method was implemented and evaluated only in Qichun county in this study. The collection of more reliable crop samples from other regions in the future could achieve more robust evaluation results for characterizing the performance of the FSHC method. Moreover, it is noteworthy that the slope data used in this study may be not necessary over the plain areas, which could improve the operational efficiency of deriving the PRCP map in larger regions in the future. Second, the thresholds of the three hierarchical levels in the FSHC method were determined using the field samples, restricting the practicability of this method for large regions without field samples. To address this limitation, prior information on the phenological stages could be involved because these optimized thresholds have been demonstrated to be highly related to the critical growth stages of paddy rice. This prior agricultural information could be acquired from the observations of agrometeorological stations or expert knowledge in the study area, which could largely reduce the costs of field investigations, especially in historical crop mapping applications. Third, our study demonstrated that HLS data performed satisfactorily for identifying PRCPs. Nevertheless, the number of high-quality HLS images can be quite different among different regions or years (e.g., 27 and 38 images were available for 2018 and 2019, respectively, in this study). Other decametric resolution sensors, e.g., the wide field of view (WFV) cameras with 16-m resolution onboard Gaofen-1/6 satellites, could be integrated to further improve the availability of high-quality observations. Moreover, the SAR data (e.g., Sentinel-1A/1B), which are not sensitive to cloud conditions, could also be ingested to identify different PRCPs. Fourth, the paddy rice mapping was performed at the pixel scale, which inevitably introduced misclassification errors within the same cropland. The cropland parcel-based paddy rice distribution is, thus, very important for quantifying the changes in ecological systems and improving the management strategies in precision agriculture. Finally, only four PRCPs were mapped according to cropping structures of the study area. The identification of more crop types in different regions using high spatiotemporal resolution data can be further explored in future work.

6. Conclusions

Identifying the detailed spatial distributions of PRCPs is a prerequisite for agricultural monitoring and management. In this study, a pragmatic FSHC method was developed to identify four PRCPs, i.e., ratoon rice, middle paddy rice, double-cropping paddy rice, and paddy-rice–rapeseed rotation, using the HLS time series images. The FSHC first mapped the cropping intensity of cropland using the temporal trajectory of the S-G filtered NDVI. Then, the optimal temporal and spectral features for identifying each PRCP were selected based on the separability analyses among different crop types. Finally, the three hierarchical levels of the DT model were developed to derive the detailed PRCP map. Based on comparisons with crop field samples, the overall accuracy of the cropping intensity map was 93.20%, and the PA and UA of single-, double- and non-cropping cropland were greater than 85%. The NDWI and LSWI in the flooding stage and the SOS date were identified as critical spectral and temporal features, respectively, which could well capture the specific growth stage of each PRCP. The derived PRCP map exhibited good agreement (OA = 87.3%) with the validation samples. Furthermore, the FSHC method showed similar performances when identifying RPCPs in adjacent years. Our study indicated that the proposed FSHC method with HLS data holds great potential for mapping fine-scale PRCPs on the fragmented croplands in regions with cloudy and rainy weather. The refined paddy rice dataset is of great importance for rice yield estimations, agricultural land planning, and evaluations on the impacts of rice planting system changes on the agricultural ecological environment, such as water resource use and trace methane emissions.

Author Contributions

Conceptualization and methodology, J.H., Y.C. and B.X.; resources, L.Y. and B.X.; data curation, B.X.; writing—original draft preparation, J.H. and Y.C.; writing—review and editing, Z.C., H.W., X.Z., W.Z. and B.X.; visualization, J.H. and Y.C.; supervision, L.Y., B.X. and C.W.; funding acquisition, L.Y. and B.X. All authors have read and agreed to the published version of the manuscript.

Funding

This work was supported by the National Natural Science Foundation of China (42271360, 42001303), the National Key Research and Development Program of China (2019YFE0126700), the Fundamental Research Funds for the Central Universities (2662021JC013), and the Key Project of Philosophy and Social Sciences Research, Ministry of Education, China (20JZD015).

Data Availability Statement

The data presented in this study are available on request from the authors.

Conflicts of Interest

The authors declare no conflict of interest.

References

  1. Kuenzer, C.; Knauer, K. Remote sensing of rice crop areas. Int. J. Remote Sens. 2012, 34, 2101–2139. [Google Scholar] [CrossRef]
  2. Zhao, X.; Min, J.; Wang, S.; Shi, W.; Xing, G. Further understanding of nitrous oxide emission from paddy fields under rice/wheat rotation in south China. J. Geophys. Res. 2011, 116, G02016. [Google Scholar] [CrossRef]
  3. Zhang, G.; Xiao, X.; Dong, J.; Xin, F.; Zhang, Y.; Qin, Y.; Doughty, R.B.; Moore, B., 3rd. Fingerprint of rice paddies in spatial-temporal dynamics of atmospheric methane concentration in monsoon Asia. Nat. Commun. 2020, 11, 554. [Google Scholar] [CrossRef] [PubMed]
  4. Geisseler, D.; Linquist, B.A.; Lazicki, P.A. Effect of fertilization on soil microorganisms in paddy rice systems—A meta-analysis. Soil Boil. Biochem. 2017, 115, 452–460. [Google Scholar] [CrossRef]
  5. Zhao, X.; Xie, Y.; Xiong, Z.; Yan, X.; Xing, G.; Zhu, Z. Nitrogen fate and environmental consequence in paddy soil under rice-wheat rotation in the Taihu lake region, China. Plant Soil 2009, 319, 225–234. [Google Scholar] [CrossRef]
  6. Liu, S.; Qin, Y.; Zou, J.; Liu, Q. Effects of water regime during rice-growing season on annual direct N(2)O emission in a paddy rice-winter wheat rotation system in southeast China. Sci. Total Environ. 2010, 408, 906–913. [Google Scholar] [CrossRef]
  7. Yao, H.; Jiao, X.; Wu, F. Effects of continuous cucumber cropping and alternative rotations under protected cultivation on soil microbial community diversity. Plant Soil 2006, 284, 195–203. [Google Scholar] [CrossRef]
  8. Zhang, X.; Zhang, R.; Gao, J.; Wang, X.; Fan, F.; Ma, X.; Yin, H.; Zhang, C.; Feng, K.; Deng, Y. Thirty-one years of rice-rice-green manure rotations shape the rhizosphere microbial community and enrich beneficial bacteria. Soil Boil. Biochem. 2017, 104, 208–217. [Google Scholar] [CrossRef]
  9. Barbieri, P.; Pellerin, S.; Seufert, V.; Nesme, T. Changes in crop rotations would impact food production in an organically farmed world. Nat. Sustain. 2019, 2, 378–385. [Google Scholar] [CrossRef]
  10. Kremen, C.; Iles, A.; Bacon, C. Diversified Farming Systems: An Agroecological, Systems-based Alternative to Modern Industrial Agriculture. Ecol. Soc. 2012, 17, 44. [Google Scholar] [CrossRef]
  11. Song, X.-P.; Potapov, P.V.; Krylov, A.; King, L.; Di Bella, C.M.; Hudson, A.; Khan, A.; Adusei, B.; Stehman, S.V.; Hansen, M.C. National-scale soybean mapping and area estimation in the United States using medium resolution satellite imagery and field survey. Remote Sens. Environ. 2017, 190, 383–395. [Google Scholar] [CrossRef]
  12. Dong, J.; Xiao, X. Evolution of regional to global paddy rice mapping methods: A review. ISPRS J. Photogramm. Remote Sens. 2016, 119, 214–227. [Google Scholar] [CrossRef]
  13. Boschetti, M.; Busetto, L.; Manfron, G.; Laborte, A.; Asilo, S.; Pazhanivelan, S.; Nelson, A. PhenoRice: A method for automatic extraction of spatio-temporal information on rice crops using satellite data time series. Remote Sens. Environ. 2017, 194, 347–365. [Google Scholar] [CrossRef]
  14. Qiu, B.; Li, W.; Tang, Z.; Chen, C.; Qi, W. Mapping paddy rice areas based on vegetation phenology and surface moisture conditions. Ecol. Indic 2015, 56, 79–86. [Google Scholar] [CrossRef]
  15. Han, J.; Zhang, Z.; Luo, Y.; Cao, J.; Zhang, L.; Cheng, F.; Zhuang, H.; Zhang, J.; Tao, F. NESEA-Rice10: High-resolution annual paddy rice maps for Northeast and Southeast Asia from 2017 to 2019. Earth Syst. Sci. Data 2021, 13, 5969–5986. [Google Scholar] [CrossRef]
  16. He, Y.; Dong, J.; Liao, X.; Sun, L.; Wang, Z.; You, N.; Li, Z.; Fu, P. Examining rice distribution and cropping intensity in a mixed single- and double-cropping region in South China using all available Sentinel 1/2 images. Int. J. Appl. Earth Obs. Geoinf. 2021, 101, 102351. [Google Scholar] [CrossRef]
  17. Xiao, X.; Boles, S.; Liu, J.; Zhuang, D.; Frolking, S.; Li, C.; Salas, W.; Moore, B. Mapping paddy rice agriculture in southern China using multi-temporal MODIS images. Remote Sens. Environ. 2005, 95, 480–492. [Google Scholar] [CrossRef]
  18. Zhao, R.; Li, Y.; Ma, M. Mapping Paddy Rice with Satellite Remote Sensing: A Review. Sustainability 2021, 13, 503. [Google Scholar] [CrossRef]
  19. Xiao, W.; Xu, S.; He, T. Mapping Paddy Rice with Sentinel-1/2 and Phenology-, Object-Based Algorithm—A Implementation in Hangjiahu Plain in China Using GEE Platform. Remote Sens. 2021, 13, 990. [Google Scholar] [CrossRef]
  20. Gao, F.; Masek, J.; Schwaller, M.; Hall, F. On the blending of the Landsat and MODIS surface reflectance: Predicting daily Landsat surface reflectance. IEEE Trans. Geosci. Remote Sens. 2006, 44, 2207–2218. [Google Scholar] [CrossRef]
  21. Gevaert, C.M.; García-Haro, F.J. A comparison of STARFM and an unmixing-based algorithm for Landsat and MODIS data fusion. Remote Sens. Environ. 2015, 156, 34–44. [Google Scholar] [CrossRef]
  22. Yin, G.; Li, A.; Jin, H.; Zhao, W.; Bian, J.; Qu, Y.; Zeng, Y.; Xu, B. Derivation of temporally continuous LAI reference maps through combining the LAINet observation system with CACAO. Agric. For. Meteorol. 2017, 233, 209–221. [Google Scholar] [CrossRef]
  23. Wang, J.; Xiao, X.; Liu, L.; Wu, X.; Qin, Y.; Steiner, J.L.; Dong, J. Mapping sugarcane plantation dynamics in Guangxi, China, by time series Sentinel-1, Sentinel-2 and Landsat images. Remote Sens. Environ. 2020, 247, 111951. [Google Scholar] [CrossRef]
  24. Han, J.; Zhang, Z.; Cao, J. Developing a New Method to Identify Flowering Dynamics of Rapeseed Using Landsat 8 and Sentinel-1/2. Remote Sens. 2020, 13, 105. [Google Scholar] [CrossRef]
  25. Claverie, M.; Ju, J.; Masek, J.G.; Dungan, J.L.; Vermote, E.F.; Roger, J.-C.; Skakun, S.V.; Justice, C. The Harmonized Landsat and Sentinel-2 surface reflectance data set. Remote Sens. Environ. 2018, 219, 145–161. [Google Scholar] [CrossRef]
  26. Guan, K.; Li, Z.; Rao, L.N.; Gao, F.; Xie, D.; Hien, N.T.; Zeng, Z. Mapping paddy rice area and yields over Thai Binh Province in Viet Nam from MODIS, Landsat, and ALOS-2/PALSAR-2. IEEE J. Sel. Top. Appl. Earth Obs. Remote Sens. 2018, 11, 2238–2252. [Google Scholar] [CrossRef]
  27. Liu, Y.; Zhao, W.; Chen, S.; Ye, T. Mapping Crop Rotation by Using Deeply Synergistic Optical and SAR Time Series. Remote Sens. 2021, 13, 4160. [Google Scholar] [CrossRef]
  28. Hu, Q.; Sulla-Menashe, D.; Xu, B.; Yin, H.; Tang, H.; Yang, P.; Wu, W. A phenology-based spectral and temporal feature selection method for crop mapping from satellite time series. Int. J. Appl. Earth Obs. Geoinf. 2019, 80, 218–229. [Google Scholar] [CrossRef]
  29. Yin, L.; You, N.; Zhang, G.; Huang, J.; Dong, J. Optimizing Feature Selection of Individual Crop Types for Improved Crop Mapping. Remote Sens. 2020, 12, 162. [Google Scholar] [CrossRef]
  30. Zhan, P.; Zhu, W.; Li, N. An automated rice mapping method based on flooding signals in synthetic aperture radar time series. Remote Sens. Environ. 2021, 252, 112112. [Google Scholar] [CrossRef]
  31. Veloso, A.; Mermoz, S.; Bouvet, A.; Le Toan, T.; Planells, M.; Dejoux, J.-F.; Ceschia, E. Understanding the temporal behavior of crops using Sentinel-1 and Sentinel-2-like data for agricultural applications. Remote Sens. Environ. 2017, 199, 415–426. [Google Scholar] [CrossRef]
  32. Di Vittorio, C.A.; Georgakakos, A.P. Land cover classification and wetland inundation mapping using MODIS. Remote Sens. Environ. 2018, 204, 1–17. [Google Scholar] [CrossRef]
  33. Jiang, Z.; Huete, A.R.; Chen, J.; Chen, Y.; Li, J.; Yan, G.; Zhang, X. Analysis of NDVI and scaled difference vegetation index retrievals of vegetation fraction. Remote Sens. Environ. 2006, 101, 366–378. [Google Scholar] [CrossRef]
  34. Arvor, D.; Jonathan, M.; Meirelles, M.S.P.; Dubreuil, V.; Durieux, L. Classification of MODIS EVI time series for crop mapping in the state of Mato Grosso, Brazil. Int. J. Remote Sens. 2011, 32, 7847–7871. [Google Scholar] [CrossRef]
  35. Eastman, J.; Sangermano, F.; Machado, E.; Rogan, J.; Anyamba, A. Global Trends in Seasonality of Normalized Difference Vegetation Index (NDVI), 1982–2011. Remote Sens. 2013, 5, 4799–4818. [Google Scholar] [CrossRef]
  36. Xiao, X.; Boles, S.; Frolking, S.; Li, C.; Babu, J.Y.; Salas, W.; Moore, B. Mapping paddy rice agriculture in South and Southeast Asia using multi-temporal MODIS images. Remote Sens. Environ. 2006, 100, 95–113. [Google Scholar] [CrossRef]
  37. Dong, J.; Xiao, X.; Menarguez, M.A.; Zhang, G.; Qin, Y.; Thau, D.; Biradar, C.; Moore, B. Mapping paddy rice planting area in northeastern Asia with Landsat 8 images, phenology-based algorithm and Google Earth Engine. Remote Sens. Environ. 2016, 185, 142–154. [Google Scholar] [CrossRef]
  38. McFeeters, S.K. The use of the Normalized Difference Water Index (NDWI) in the delineation of open water features. Int. J. Remote Sens. 1996, 17, 1425–1432. [Google Scholar] [CrossRef]
  39. Xu, H. A Study on Information Extraction of Water Body with the Modified Normalized Difference Water Index (MNDWI). J. Remote Sens. 2005, 9, 589–595. [Google Scholar]
  40. Yin, Q.; Liu, M.; Cheng, J.; Ke, Y.; Chen, X. Mapping Paddy Rice Planting Area in Northeastern China Using Spatiotemporal Data Fusion and Phenology-Based Method. Remote Sens. 2019, 11, 1699. [Google Scholar] [CrossRef]
  41. Chen, J.; Cao, X.; Peng, S.; Ren, H. Analysis and Applications of GlobeLand30: A Review. ISPRS Int. J. Geo Inf. 2017, 6, 230. [Google Scholar] [CrossRef] [Green Version]
  42. Lu, M.; Wu, W.; Zhang, L.; Liao, A.; Peng, S.; Tang, H. A comparative analysis of five global cropland datasets in China. Sci. China Earth Sci. 2016, 59, 2307–2317. [Google Scholar] [CrossRef]
  43. Wang, C.; Zhang, Z.; Chen, Y.; Tao, F.; Zhang, J.; Zhang, W. Comparing different smoothing methods to detect double-cropping rice phenology based on LAI products—A case study in the Hunan province of China. Int. J. Remote Sens. 2018, 39, 6405–6428. [Google Scholar] [CrossRef]
  44. Wang, C.; Zhang, Z.; Zhang, J.; Tao, F. The effect of terrain factors on rice production: A case study in Hunan Province. Acta Geogr. Sin. 2018, 73, 1792–1808. [Google Scholar] [CrossRef]
  45. Abrams, M.; Crippen, R.; Fujisada, H. ASTER Global Digital Elevation Model (GDEM) and ASTER Global Water Body Dataset (ASTWBD). Remote Sens. 2020, 12, 1156. [Google Scholar] [CrossRef]
  46. Gumma, M.K.; Thenkabail, P.S.; Maunahan, A.; Islam, S.; Nelson, A. Mapping seasonal rice cropland extent and area in the high cropping intensity environment of Bangladesh using MODIS 500m data for the year 2010. ISPRS J. Photogramm. Remote Sens. 2014, 91, 98–113. [Google Scholar] [CrossRef]
  47. Hao, P.; Tang, H.; Chen, Z.; Yu, L.; Wu, M. High resolution crop intensity mapping using harmonized Landsat-8 and Sentinel-2 data. J. Integr. Agric. 2019, 18, 2883–2897. [Google Scholar] [CrossRef]
  48. Ju, J.; Roy, D.P.; Vermote, E.; Masek, J.; Kovalskyy, V. Continental-scale validation of MODIS-based and LEDAPS Landsat ETM+ atmospheric correction methods. Remote Sens. Environ. 2012, 122, 175–184. [Google Scholar] [CrossRef]
  49. Fensholt, R.; Sandholt, I.; Stisen, S. Evaluating MODIS, MERIS, and VEGETATION vegetation indices using in situ measurements in a semiarid environment. IEEE Trans. Geosci. Remote Sens. 2006, 44, 1774–1786. [Google Scholar] [CrossRef]
  50. Liu, L.; Xiao, X.; Qin, Y.; Wang, J.; Xu, X.; Hu, Y.; Qiao, Z. Mapping cropping intensity in China using time series Landsat and Sentinel-2 images and Google Earth Engine. Remote Sens. Environ. 2020, 239, 111624. [Google Scholar] [CrossRef]
  51. Jönsson, P.; Eklundh, L. Seasonality Extraction by Function Fitting to Time-Series of Satellite Sensor Data. IEEE Trans. Geosci. Remote Sens. 2002, 40, 1824–1832. [Google Scholar] [CrossRef]
  52. Jönsson, P.; Eklundh, L. TIMESAT—A program for analyzing time-series of satellite sensor data. Comput. Geosci. 2004, 30, 833–845. [Google Scholar] [CrossRef]
  53. Pan, L.; Xia, H.; Yang, J.; Niu, W.; Wang, R.; Song, H.; Guo, Y.; Qin, Y. Mapping cropping intensity in Huaihe basin using phenology algorithm, all Sentinel-2 and Landsat images in Google Earth Engine. Int. J. Appl. Earth Obs. Geoinf. 2021, 102, 102376. [Google Scholar] [CrossRef]
  54. Hu, Q.; Yin, H.; Friedl, M.A.; You, L.; Li, Z.; Tang, H.; Wu, W. Integrating coarse-resolution images and agricultural statistics to generate sub-pixel crop type maps and reconciled area estimates. Remote Sens. Environ. 2021, 258, 112365. [Google Scholar] [CrossRef]
  55. Belgiu, M.; Drăguţ, L. Random forest in remote sensing: A review of applications and future directions. ISPRS J. Photogramm. Remote Sens. 2016, 114, 24–31. [Google Scholar] [CrossRef]
  56. Hansen, M.; Dubayah, R.; Defries, R. Classification trees: An alternative to traditional land cover classifiers. Int. J. Remote Sens. 2007, 17, 1075–1081. [Google Scholar] [CrossRef]
  57. Peña-Barragán, J.M.; Ngugi, M.K.; Plant, R.E.; Six, J. Object-based crop identification using multiple vegetation indices, textural features and crop phenology. Remote Sens. Environ. 2011, 115, 1301–1316. [Google Scholar] [CrossRef]
  58. Ni, R.; Tian, J.; Li, X.; Yin, D.; Li, J.; Gong, H.; Zhang, J.; Zhu, L.; Wu, D. An enhanced pixel-based phenological feature for accurate paddy rice mapping with Sentinel-2 imagery in Google Earth Engine. ISPRS J. Photogramm. Remote Sens. 2021, 178, 282–296. [Google Scholar] [CrossRef]
  59. Cai, Y.; Lin, H.; Zhang, M. Mapping paddy rice by the object-based random forest method using time series Sentinel-1/Sentinel-2 data. Adv. Space Res. 2019, 64, 2233–2244. [Google Scholar] [CrossRef]
  60. Han, J.; Zhang, Z.; Luo, Y.; Cao, J.; Zhang, L.; Zhuang, H.; Cheng, F.; Zhang, J.; Tao, F. Annual paddy rice planting area and cropping intensity datasets and their dynamics in the Asian monsoon region from 2000 to 2020. Agric. Syst. 2022, 200, 103437. [Google Scholar] [CrossRef]
  61. Wei, H.; Hu, Q.; Cai, Z.; Yang, J.; Song, Q.; Yin, G.; Xu, B. An Object- and Topology-Based Analysis (OTBA) Method for Mapping Rice-Crayfish Fields in South China. Remote Sens. 2021, 13, 4666. [Google Scholar] [CrossRef]
  62. Yang, J.; Hu, Q.; You, L.; Cai, Z.; Chen, Y.; Wei, H.; Xu, Z.; He, Z.; Yin, G.; Xu, B. Mapping the potential northern limits and promotion extent of ratoon rice in China. Appl. Geogr. 2023, 150, 102822. [Google Scholar] [CrossRef]
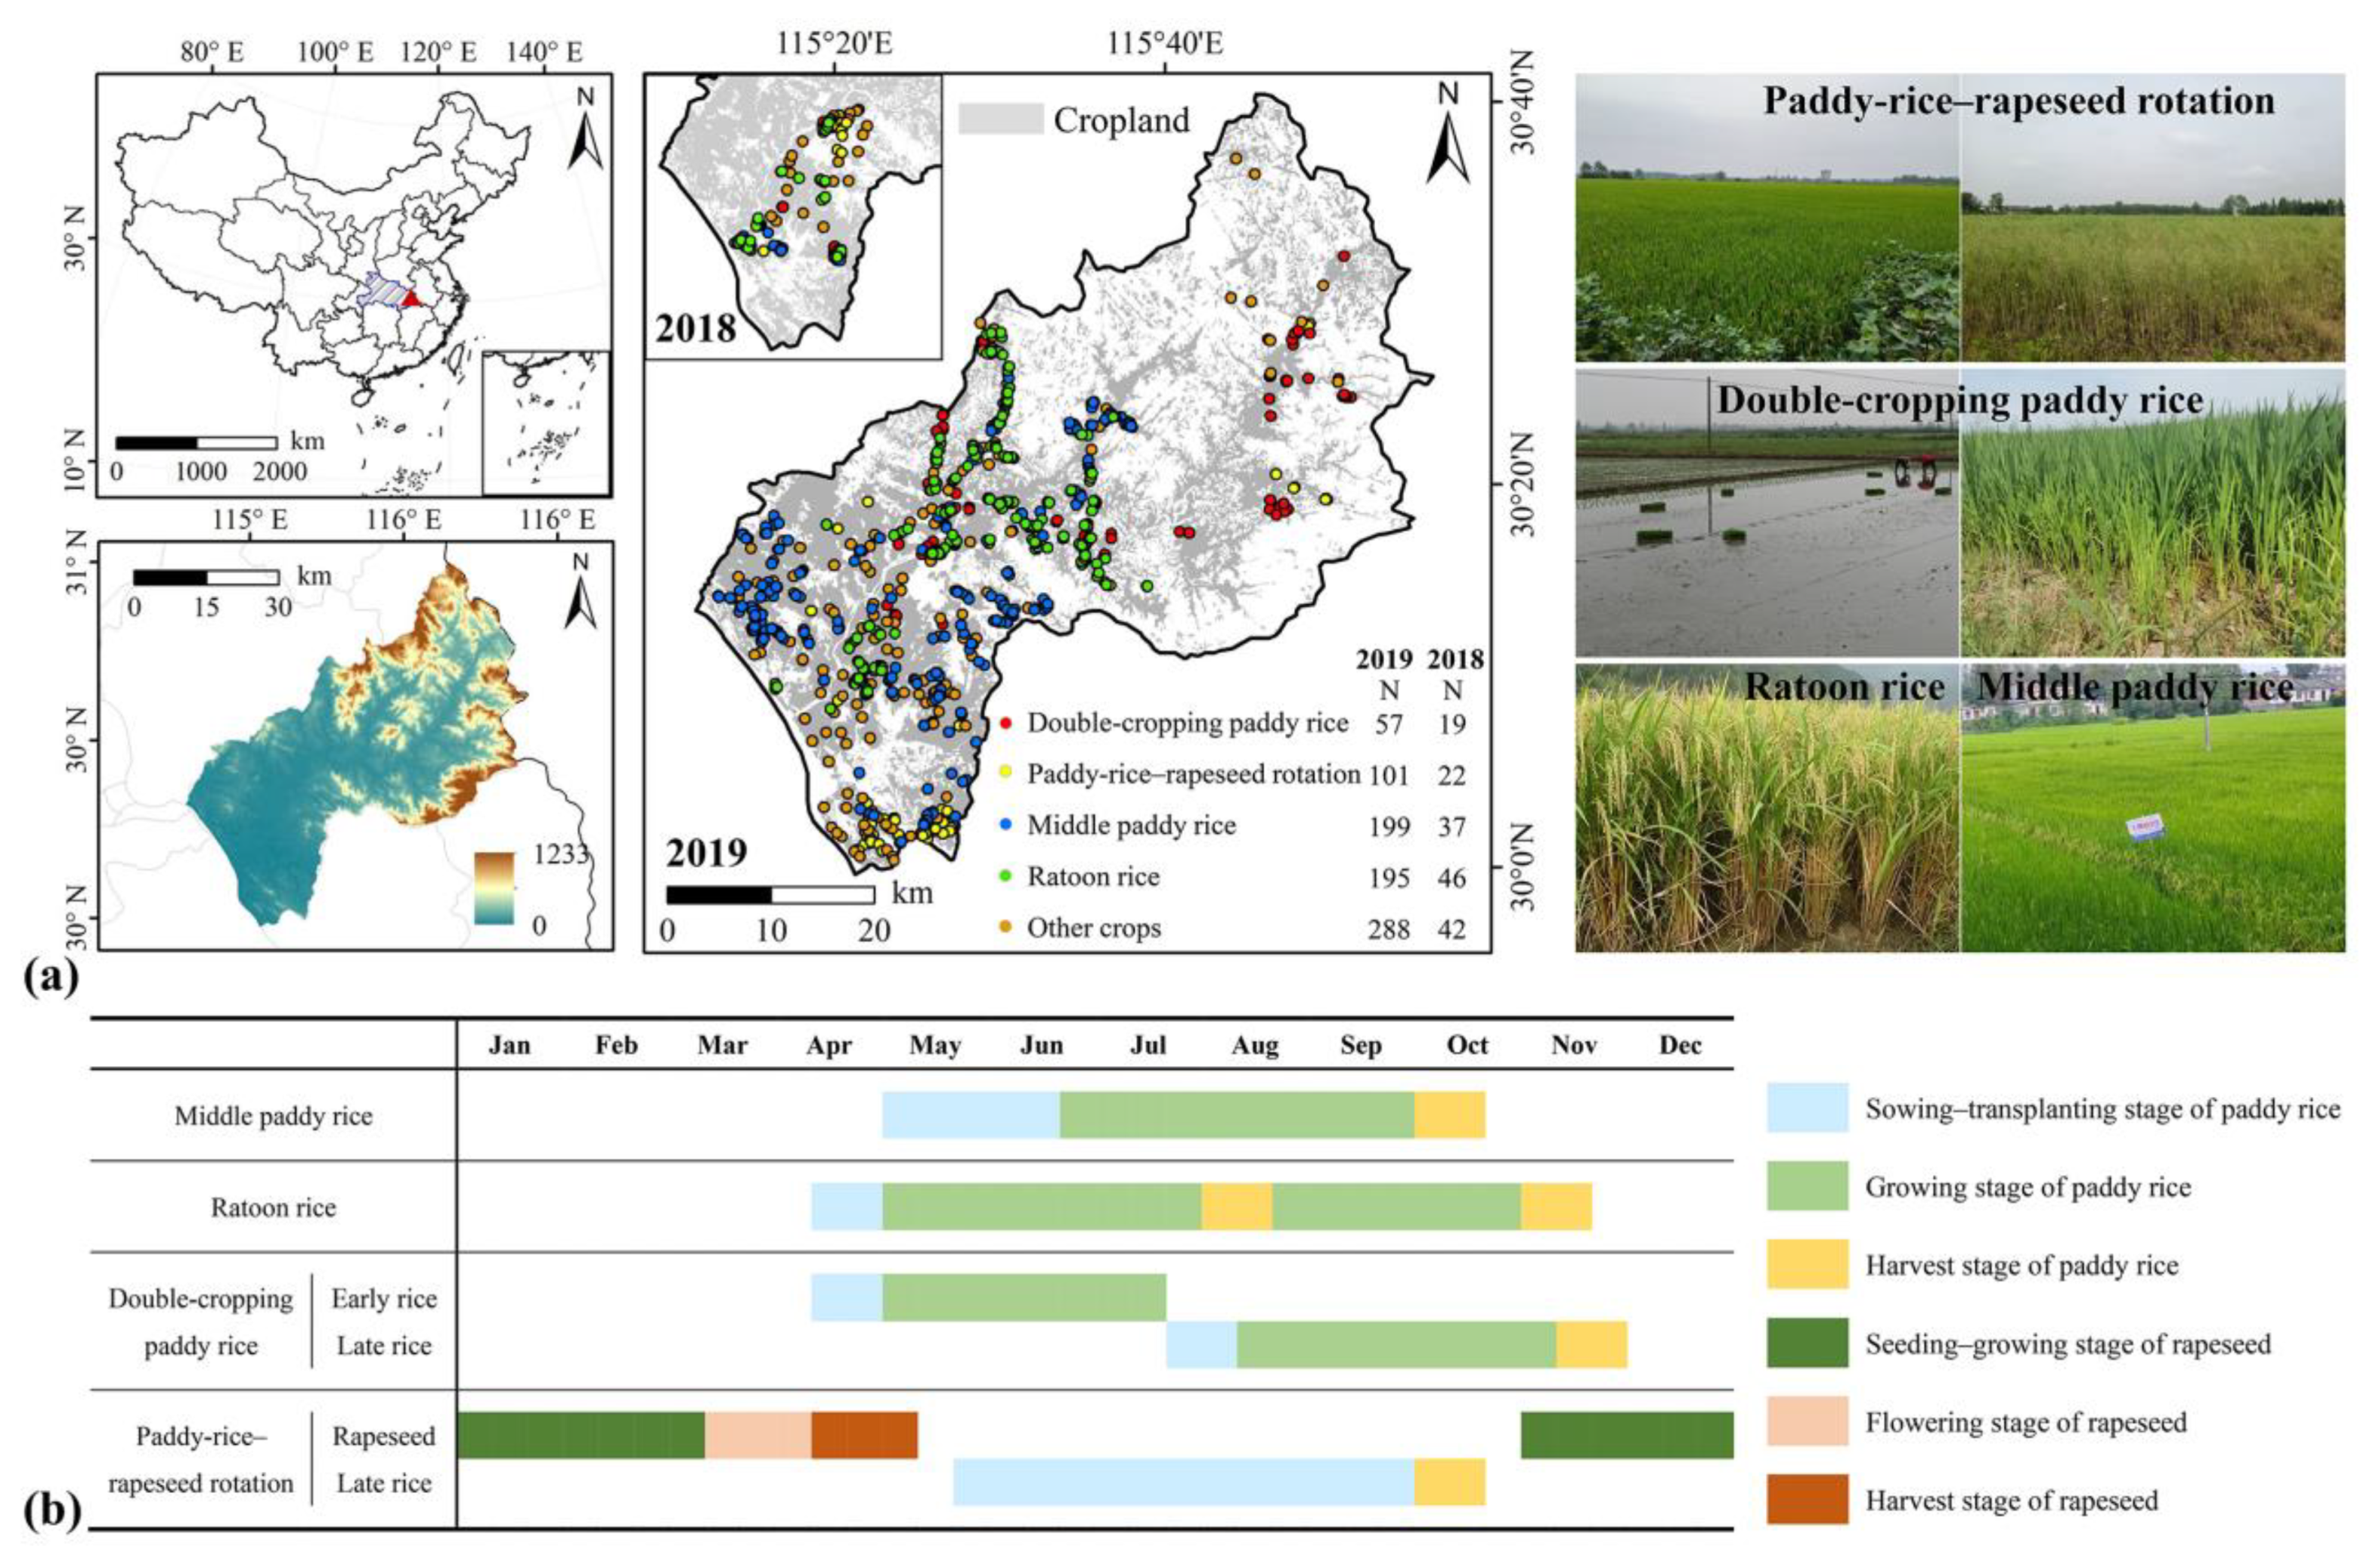
Figure 1. (a) Location and DEM of Qichun county in Hubei Province, China. The cropland data were extracted from the GlobeLand30 product in 2020. The number (N) and the spatial distribution of field samples for different crop types obtained in 2019 and 2018 were also displayed. The example photos of paddy-rice–rapeseed rotation, double-cropping paddy rice, ratoon rice, and middle paddy rice are shown in the right panel. (b) The crop calendars of four PRCPs in the study area.
Remotesensing 15 01034 g001
Figure 2. The numbers (Nobs) and observation dates of high-quality HLS S30 (circle points) and L30 (square points) products obtained over the study area in 2019 and 2018. The crop samples collected from two field surveys (Nfield = 2) and the specific date of each field survey (triangle points) were also displayed in this figure.
Remotesensing 15 01034 g002
Figure 3. Workflow of the FSHC method for mapping diverse PRCPs using the HLS data.
Remotesensing 15 01034 g003
Figure 4. The developed DT model for identifying each PRCP based on three hierarchical levels. “TOF_PRSC” and “TOF_PRDC” denotes the threshold of optimal features for identifying paddy rice over single- and double-cropping cropland, respectively, whereas “TOF_MPR” and “TOF_DPR” indicates the threshold of optimal features for identifying middle and double-cropping paddy rice, respectively.
Remotesensing 15 01034 g004
Figure 5. The NDVI temporal trajectory with the detected SOS and EOS dates after S-G filtering for (a) ratoon rice, (b) middle paddy rice, (c) double-cropping paddy rice, and (d) paddy-rice–rapeseed rotation.
Remotesensing 15 01034 g005
Figure 6. (a) Cropping intensity map of the study area with 3 sub-regions (SRs) for details. The corresponding HLS S30 pseudo-color images (RGB: near-infrared (B8A), red (B4), green (B3)) on June 4, 2019, over 3 SRs were also displayed. (b) Accuracy of the cropping intensity map evaluated by crop field samples.
Remotesensing 15 01034 g006
Figure 7. Temporal trajectories of (a) NDVI, (b) LSWI, (c) FSVI, (d) NDWI, and (e) MNDWI for paddy rice and non-paddy rice over double- (upper panel) and single-cropping (lower panel) croplands. The lines and filled areas represent the VI means and standard deviations for the training samples. The dotted square exhibited the significant VI separability between two crop types.
Remotesensing 15 01034 g007
Figure 8. The feature importance of spectral–temporal information and phenological phase (PP) (a) for identifying middle paddy rice and ratoon rice in the single-cropping paddy rice group and (b) for identifying paddy-rice–rapeseed rotation and double-cropping paddy rice in the double-cropping paddy rice group. The top panel of each figure shows the temporal trajectory of NDVI for each PRCP.
Remotesensing 15 01034 g008
Figure 9. Boxplot of the critical VIs on specific observation dates for distinguishing paddy rice and non-paddy rice in the (a) single- and (b) double-cropping groups. The dNDWI was calculated by the difference between the flooding stage (DOY 110–140) NDWI and the peak-growth stage (DOY 195–205) NDWI. The boxes represent the 25th to 75th percentiles, and the bars show the 1.5 interquartile range. Lines and triangles stand for median and mean values, respectively.
Remotesensing 15 01034 g009
Figure 10. Boxplots of the top three optimal features for (a) ratoon rice and middle paddy rice in the single-cropping paddy rice group and (b) double-cropping paddy rice and paddy-rice–rapeseed rotation in the double-cropping rice group. The boxes represent the 25th to 75th percentiles, and the bars show the 1.5 interquartile range. Lines and triangles stand for median and mean values, respectively.
Remotesensing 15 01034 g010
Figure 11. (a) Cropping intensity map of paddy rice and (b) diverse PRCPs with two sub-regions (SR) for details in the study area in 2019.
Remotesensing 15 01034 g011
Figure 12. Evaluation of the derived (a) paddy rice cropping intensity map in 2019, (b) PRCPs in 2019 and (c) PRCPs in 2018 based on crop field samples.
Remotesensing 15 01034 g012
Table 1. Band parameters of the HLS L30 and S30 surface reflectance products.
Band NameHLS L30 BandHLS S30 BandWavelength Range (μm)
Coastal aerosolB1B10.43–0.45
BlueB2B20.45–0.51
GreenB3B30.53–0.59
RedB4B40.64–0.67
Red-edge 1B50.69–0.71
Red-edge 2B60.73–0.75
Red-edge 3B70.77–0.79
Near infrared (NIR) broadB80.78–0.88
NIR narrowB5B8A0.85–0.88
Short wave infrared (SWIR) 1B6B111.57–1.65
SWIR 2B7B122.11–2.29
Water vaporB90.93–0.95
CirrusB9B101.36–1.38
Thermal infrared 1B1010.60–11.19
Thermal infrared 2B1111.50–12.51
Table 2. Five vegetation indices (VIs) selected in this study and their associated equations.
Vegetation Index (VI)EquationReference
Normalized difference vegetation index (NDVI) ρ N I R ρ R e d ρ N I R + ρ R e d [33]
Land surface water index (LSWI) ρ N I R ρ S W I R 1 ρ N I R + ρ S W I R 1 [17]
Flooding signal vegetation index (FSVI) L S W I N D V I [40]
Normalized difference water index (NDWI) ρ G r e e n ρ N I R ρ G r e e n + ρ N I R [38]
Modified normalized difference water index (MNDWI) ρ G r e e n ρ S W I R 1 ρ G r e e n + ρ S W I R 1 [39]
Disclaimer/Publisher’s Note: The statements, opinions and data contained in all publications are solely those of the individual author(s) and contributor(s) and not of MDPI and/or the editor(s). MDPI and/or the editor(s) disclaim responsibility for any injury to people or property resulting from any ideas, methods, instructions or products referred to in the content.