


Cultivated Land Quality Evaluated Using the RNN Algorithm Based on Multisource Data
 ,
, 

Abstract
1. Introduction
2. Materials and Methods
2.1. Study Area
2.2. Data and Preprocessing
2.3. Methods
2.3.1. Determining the Optimal Indicators for Evaluating the CLQ
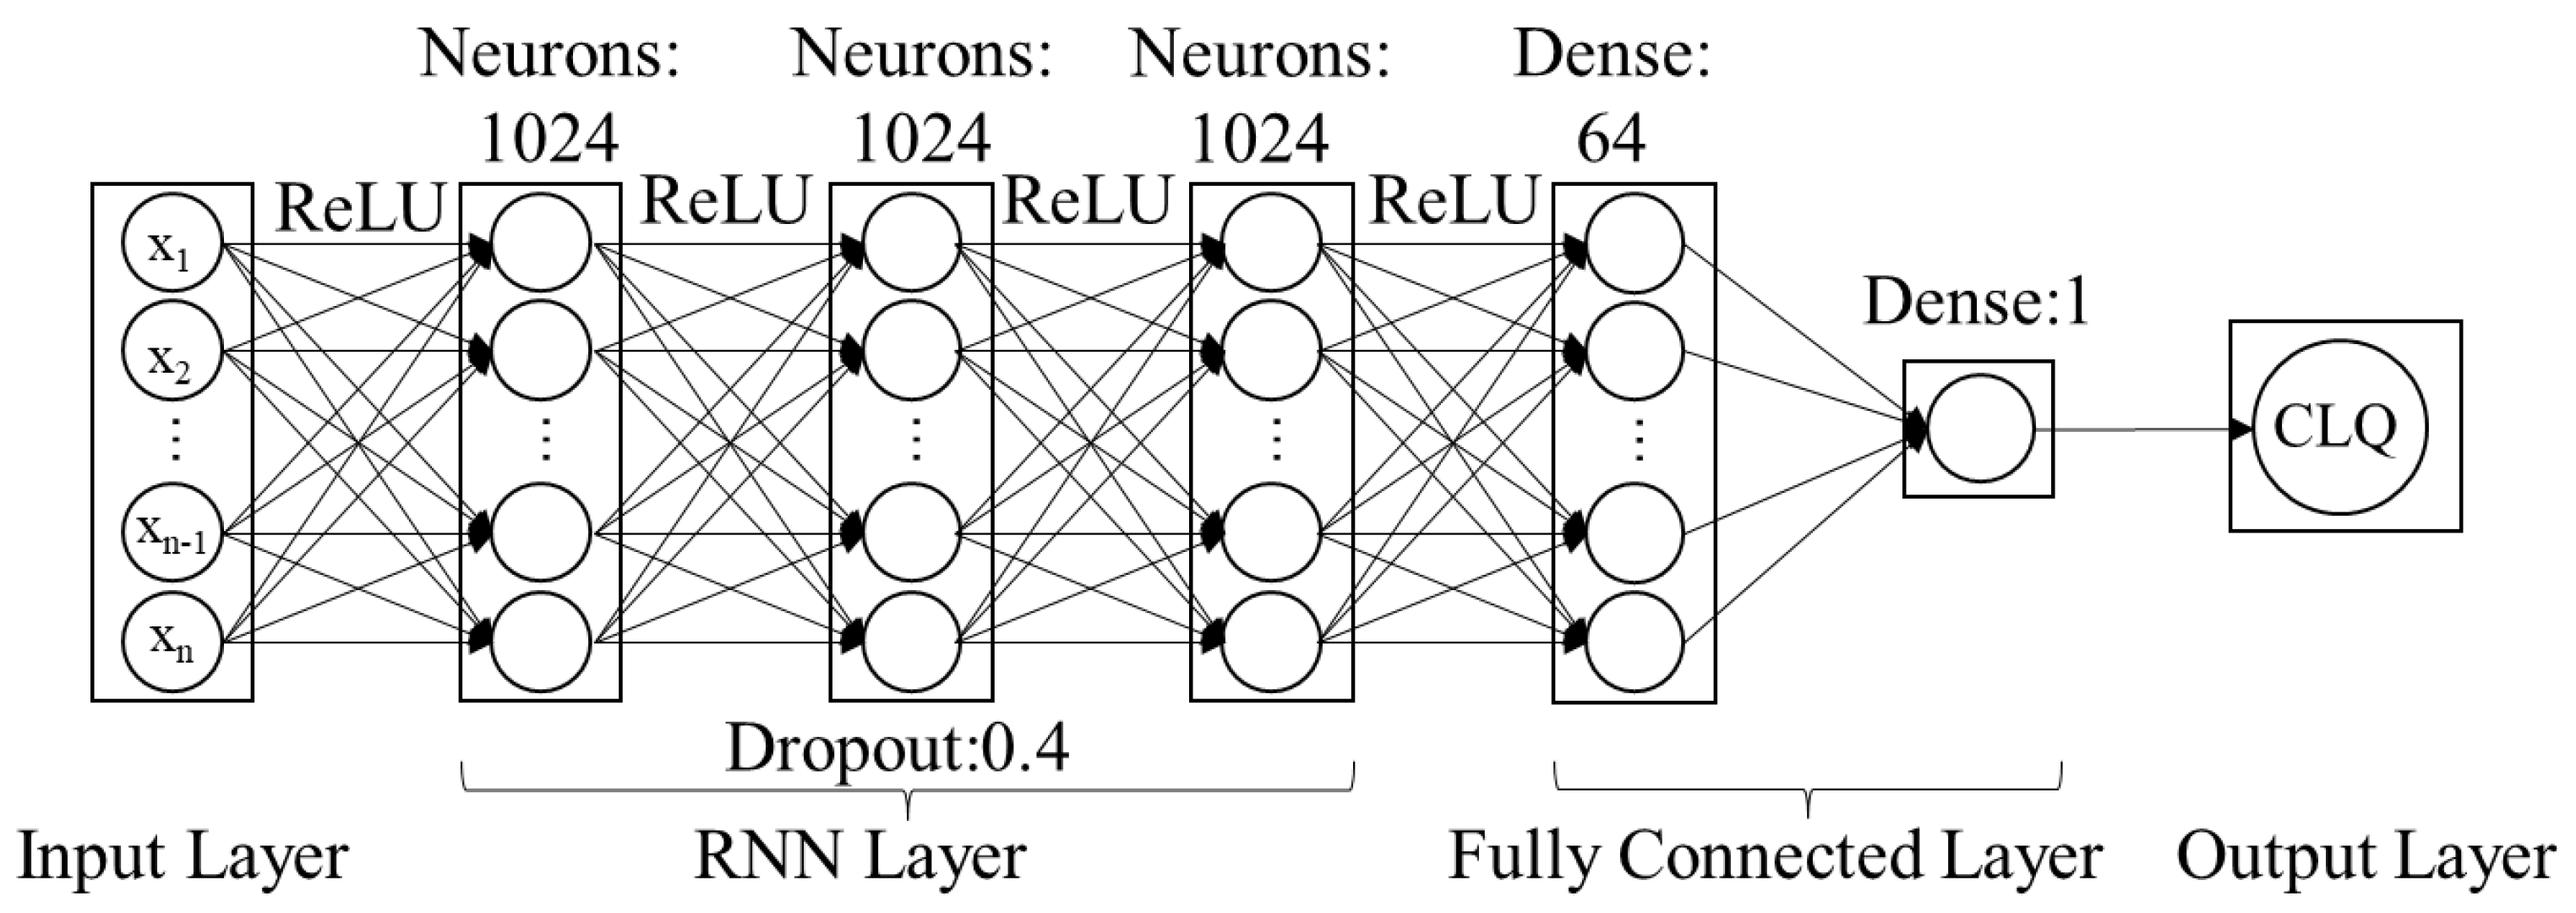
2.3.2. Modeling and Mapping Methods
- (1)
- Calculating the output value of each neuron forward;
- (2)
- Calculating the error term of each neuron, which refers to the partial derivative of the error function to the weighted input of the neuron, by defining the partial derivative of the loss function to the input value of neuron j at time t, followed by the calculation based on the chain rule. Moreover, the partial derivatives of the loss function to the network weights are shown in Equations (7)–(9):
- (3)
- Calculating the gradient of each weight and updating it with an optimization algorithm.
2.3.3. Model Accuracy Evaluation
3. Results
3.1. Indicator Selection Results
3.2. Model Construction and Accuracy Evaluation
3.3. Spatial Distribution and Regional Verification of Cultivated Land Quality
4. Discussion
5. Conclusions
Author Contributions
Funding
Data Availability Statement
Acknowledgments
Conflicts of Interest
References
- Zhuang, Q.; Wu, S.; Huang, X.; Kong, L.; Yan, Y.; Xiao, H.; Li, Y.; Cai, P. Monitoring the impacts of cultivated land quality on crop production capacity in arid regions. Catena 2022, 214, 106263. [Google Scholar] [CrossRef]
- Qu, Y.; Jiang, G.; Li, Z.; Tian, Y.; Wei, S. Understanding rural land use transition and regional consolidation implications in China. Land Use Policy 2019, 82, 742–753. [Google Scholar] [CrossRef]
- Liu, Y. Introduction to land use and rural sustainability in China. Land Use Policy 2018, 74, 1–4. [Google Scholar] [CrossRef]
- Bai, X.; Shi, P.; Liu, Y. Society: Realizing China’s urban dream. Nature 2014, 509, 158–160. [Google Scholar] [CrossRef] [PubMed]
- Du, G.; Liu, Y.; Yu, F.; Liu, M.; Zheng, H. Evolution of concepts of cultivated land quality and recognition. Trans. Chin. Soc. Agric. Eng. 2016, 32, 243–249. (In Chinese) [Google Scholar]
- Bindraban, P.S.; Stoorvogel, J.J.; Jansen, D.M.; Vlaming, J.; Groot, J.J.R. Land quality indicators for sustainable land management: Proposed method for yield gap and soil nutrient balance. Agric. Ecosyst. Environ. 2000, 81, 103–112. [Google Scholar] [CrossRef]
- Duan, D.; Sun, X.; Liang, S.; Sun, J.; Fan, L.; Chen, H.; Xia, L.; Zhao, F.; Yang, W.; Yang, P. Spatiotemporal Patterns of Cultivated Land Quality Integrated with Multi-Source Remote Sensing: A Case Study of Guangzhou, China. Remote Sens. 2022, 14, 1250. [Google Scholar] [CrossRef]
- van Vliet, J.; Eitelberg, D.A.; Verburg, P.H. A global analysis of land take in cropland areas and production displacement from urbanization. Glob. Environ. Chang. 2017, 43, 107–115. [Google Scholar] [CrossRef]
- Liu, S.; Peng, Y.; Xia, Z.; Hu, Y.; Wang, G.; Zhu, A.; Liu, Z. The GA-BPNN-Based Evaluation of Cultivated Land Quality in the PSR Framework Using Gaofen-1 Satellite Data. Sensors 2019, 19, 5127. [Google Scholar] [CrossRef]
- Zhao, L.; Zhou, W.; Peng, Y.; Hu, Y.; Ma, T.; Xie, Y.; Wang, L.; Liu, J.; Liu, Z. A new AG-AGB estimation model based on MODIS and SRTM data in Qinghai Province, China. Ecol. Indic. 2021, 133, 108378. [Google Scholar] [CrossRef]
- Sakai, Y.; Ishizuka, S.; Takenaka, C. Predicting deadwood densities of Cryptomeria japonica and Chamaecyparis obtusa forests using a generalized linear mixed model with a national-scale dataset. For. Ecol. Manag. 2013, 295, 228–238. [Google Scholar] [CrossRef]
- Rodríguez Sousa, A.A.; Parra-López, C.; Sayadi-Gmada, S.; Barandica, J.M.; Rescia, A.J. A multifunctional assessment of integrated and ecological farming in olive agroecosystems in southwestern Spain using the Analytic Hierarchy Process. Ecol. Econ. 2020, 173, 106658. [Google Scholar] [CrossRef]
- Zahra, A.; Hashmi, M.Z.; Malik, R.N.; Ahmed, Z. Enrichment and geo-accumulation of heavy metals and risk assessment of sediments of the Kurang Nallah—Feeding tributary of the Rawal Lake Reservoir, Pakistan. Sci. Total Environ. 2014, 470–471, 925–933. [Google Scholar] [CrossRef] [PubMed]
- Zhang, Y.; Huang, J.; Yu, L.; Wang, S. Quantitatively Verifying the Results’ Rationality for Farmland Quality Evaluation with Crop Yield, a Case Study in the Northwest Henan Province, China. PLoS ONE 2016, 11, e160204. [Google Scholar] [CrossRef] [PubMed]
- Song, W.; Zhang, H.; Zhao, R.; Wu, K.; Li, X.; Niu, B.; Li, J. Study on cultivated land quality evaluation from the perspective of farmland ecosystems. Ecol. Indic. 2022, 139, 108959. [Google Scholar] [CrossRef]
- Wang, L.; Zhou, Y.; Li, Q.; Xu, T.; Zuo, Q.; Wu, Z.; Liu, J. An Intelligent Model of Cultivated Land Quality Evaluation Based on Random Forest and Its Application. Acta Pedol. Sin. 2022, 59, 1279–1292. (In Chinese) [Google Scholar]
- Boojari, M.A.; Zamir, S.M.; Rene, E.R.; Shojaosadati, S.A. Performance assessment of gas-phase toluene removal in one- and two-liquid phase biotrickling filters using artificial neural networks. Chemosphere 2019, 234, 388–394. [Google Scholar] [CrossRef]
- Liu, Y.; Wang, H.; Zhang, H.; Liber, K. A comprehensive support vector machine-based classification model for soil quality assessment. Soil Tillage Res. 2016, 155, 19–26. [Google Scholar] [CrossRef]
- Ghamisi, P.; Benediktsson, J.A. Feature Selection Based on Hybridization of Genetic Algorithm and Particle Swarm Optimization. IEEE Geosci. Remote Sens. 2015, 12, 309–313. [Google Scholar] [CrossRef]
- Liu, Y.; Li, J.; Liu, C.; Wei, J. Evaluation of cultivated land quality using attention mechanism-back propagation neural network. PeerJ Comput. Sci. 2022, 8, e948. [Google Scholar] [CrossRef]
- Xia, Z.; Peng, Y.; Lin, C.; Wen, Y.; Liu, H.; Liu, Z. A spatial frequency/spectral indicator-driven model for estimating cultivated land quality using the gradient boosting decision tree and genetic algorithm-back propagation neural network. Int. Soil Water Conserv. Res. 2022, 10, 635–648. [Google Scholar] [CrossRef]
- Reichstein, M.; Camps-Valls, G.; Stevens, B.; Jung, M.; Denzler, J.; Carvalhais, N.; Prabhat. Deep learning and process understanding for data-driven Earth system science. Nature 2019, 566, 195–204. [Google Scholar] [CrossRef] [PubMed]
- Saud, A.S.; Shakya, S. Analysis of look back period for stock price prediction with RNN variants: A case study on banking sector of NEPSE. Procedia Comput. Sci. 2020, 167, 788–798. [Google Scholar] [CrossRef]
- Errattahi, R.; Hannani, A.E.; Salmam, F.Z.; Ouahmane, H. Incorporating label dependency for ASR error detection via RNN. Procedia Comput. Sci. 2019, 148, 266–272. [Google Scholar] [CrossRef]
- Chen, W.; Yeo, C.K.; Lau, C.T.; Lee, B.S. Leveraging social media news to predict stock index movement using RNN-boost. Data Knowl. Eng. 2018, 118, 14–24. [Google Scholar] [CrossRef]
- Shao, H.; Nonami, K.; Wojtara, T.; Yuasa, R.; Amano, S.; Waterman, D. Neuro-fuzzy position control of demining tele-operation system based on RNN modeling. Robot. Cim.-Int. Manuf. 2006, 22, 25–32. [Google Scholar] [CrossRef]
- Zhang, B. Remotely Sensed Big Data Era and Intelligent Information Extraction. Geomat. Inf. Sci. Wuhan Univ. 2018, 43, 1861–1871. (In Chinese) [Google Scholar]
- Hijmans, R.J.; Cameron, S.E.; Parra, J.L.; Jones, P.G.; Jarvis, A. Very high resolution interpolated climate surfaces for global land areas. Int. J. Climatol. 2010, 25, 1965–1978. [Google Scholar] [CrossRef]
- Carrizosa, E.; Galvis Restrepo, M.; Romero Morales, D. On clustering categories of categorical predictors in generalized linear models. Expert Syst. Appl. 2021, 182, 115245. [Google Scholar] [CrossRef]
- Li, J.; Alvarez, B.; Siwabessy, J.; Tran, M.; Huang, Z.; Przeslawski, R.; Radke, L.; Howard, F.; Nichol, S. Application of random forest, generalised linear model and their hybrid methods with geostatistical techniques to count data: Predicting sponge species richness. Environ. Modell. Softw. 2017, 97, 112–129. [Google Scholar] [CrossRef]
- Lechmere-Oertel, R.G.; Cowling, R.M. Predicting the distribution of fynbos and succulent karoo biome boundaries and plant communities using generalised linear models and geographic information systems. S. Afr. J. Bot. 1999, 65, 89–96. [Google Scholar] [CrossRef]
- Bolker, B.M.; Brooks, M.E.; Clark, C.J.; Geange, S.W.; Poulsen, J.R.; Stevens, M.H.H.; White, J.S. Generalized linear mixed models: A practical guide for ecology and evolution. Trends Ecol. Evol. 2009, 24, 127–135. [Google Scholar] [CrossRef] [PubMed]
- Salehinejad, H.; Sankar, S.; Barfett, J.; Colak, E.; Valaee, S. Recent Advances in Recurrent Neural Networks. arXiv 2017, arXiv:1801.01078. [Google Scholar]
- Srivastava, N.; Hinton, G.; Krizhevsky, A.; Sutskever, I.; Salakhutdinov, R. Dropout: A Simple Way to Prevent Neural Networks from Overfitting. J. Mach. Learn. Res. 2014, 15, 1929–1958. [Google Scholar]
- Liu, Y.; Cai, Z.; Yu, Q.; Wu, W.; Zhou, Q. Spatial variation evaluation of cultivated land quality from the perspective of crop rotation for a typical lateritic red soil farming area in south China. J. Agric. Resour. Environ. 2021, 38, 1051–1063. (In Chinese) [Google Scholar]
- Ye, Y.; Zhao, X.; Hu, Y. Evaluation of cultivated land quality in Pearl River Delta based on GA-BP neural network. Ecol. Environ. Sci. 2018, 27, 964–973. (In Chinese) [Google Scholar]
- Liu, L.; Zhou, D.; Chang, X.; Lin, Z. A new grading system for evaluating China’s cultivated land quality. Land Degrad. Dev. 2020, 31, 1482–1501. [Google Scholar] [CrossRef]
- Wang, H.; Zhu, Y.; Wang, J.; Han, H.; Niu, J.; Chen, X. Modeling of spatial pattern and influencing factors of cultivated land quality in Henan Province based on spatial big data. PLoS ONE 2022, 17, e265613. [Google Scholar] [CrossRef]
- Zhou, J.; Zhao, H.; Song, W.; Hou, X. Spatial variation and impact factors in cultivated land productivity at village level. Chin. J. Agric. Resour. Reg. Plan. 2019, 40, 126–134. (In Chinese) [Google Scholar]
- Zhao, C.; Zhou, Y.; Jiang, J.; Xiao, P.; Wu, H. Spatial characteristics of cultivated land quality accounting for ecological environmental condition: A case study in hilly area of northern Hubei province, China. Sci. Total Environ. 2021, 774, 145765. [Google Scholar] [CrossRef]
- Hamza, M.A.; Anderson, W.K. Soil compaction in cropping systems: A review of the nature, causes and possible solutions. Soil Tillage Res. 2005, 82, 121–145. [Google Scholar] [CrossRef]
- Lin, C.; Hu, Y.; Liu, Z.; Peng, Y.; Wang, L.; Peng, D. Estimation of Cultivated Land Quality Based on Soil Hyperspectral Data. Agriculture 2022, 12, 93. [Google Scholar] [CrossRef]
- Zhu, M.; Liu, S.; Xia, Z.; Wang, G.; Hu, Y.; Liu, Z. Crop Growth Stage GPP-Driven Spectral Model for Evaluation of Cultivated Land Quality Using GA-BPNN. Agriculture 2020, 10, 318. [Google Scholar] [CrossRef]
- Liu, Z.; Lu, Y.; Peng, Y.; Zhao, L.; Wang, G.; Hu, Y. Estimation of Soil Heavy Metal Content Using Hyperspectral Data. Remote Sens. 2019, 11, 1464. [Google Scholar] [CrossRef]
- Chen, T.; Guestrin, C. XGBoost: A Scalable Tree Boosting System; ACM: New York, NY, USA, 2016; pp. 785–794. [Google Scholar]


| Indicators | Indicator Description | Data Source | Data Acquisition Time |
|---|---|---|---|
| EST | Effective soil layer thickness (cm) | GPKLLUC | Accessed on 6 September 2018 |
| OMC | Organic matter content (%) | GPKLLUC | Accessed on 6 September 2018 |
| PH | Soil pH | GPKLLUC | Accessed on 6 September 2018 |
| TS | Terrain Slope (°) | GPKLLUC | Accessed on 6 September 2018 |
| GWL | Groundwater level (cm) | GPKLLUC | Accessed on 6 September 2018 |
| FS | Field slope (°) | GPKLLUC | Accessed on 6 September 2018 |
| NDVI | Normalized vegetation index | GEE platform Landsat 8 | Accessed on 15 May 2022 |
| DEM | Digital Elevation Model (m) | GEE platform NASADEM | Accessed on 15 May 2022 |
| SLP | Slope (°) | GEE platform NASADEM | Accessed on 15 May 2022 |
| ASP | Aspect | GEE platform NASADEM | Accessed on 15 May 2022 |
| POP | Population density | GEE platform WorldPop | Accessed on 15 May 2022 |
| PH05 | 0–5 cm soil depth soil pH value | http://soil.geodata.cn | Accessed on 12 May 2022 |
| PH515 | 5–15 cm soil depth soil pH value | http://soil.geodata.cn | Accessed on 12 May 2022 |
| CF05 | 0–5 cm soil depth soil gravel content (%) | http://soil.geodata.cn | Accessed on 12 May 2022 |
| CF515 | 5–15 cm soil depth soil gravel content (%) | http://soil.geodata.cn | Accessed on 12 May 2022 |
| TN05 | 0–5 cm soil depth soil total nitrogen content (g/kg) | http://soil.geodata.cn | Accessed on 12 May 2022 |
| TN515 | 5–15 cm soil depth soil total nitrogen content (g/kg) | http://soil.geodata.cn | Accessed on 12 May 2022 |
| TP05 | 0–5 cm soil depth soil total phosphorus content (g/kg) | http://soil.geodata.cn | Accessed on 12 May 2022 |
| TP515 | 5–15 cm soil depth soil total phosphorus content (g/kg) | http://soil.geodata.cn | Accessed on 12 May 2022 |
| TK05 | 0–5 cm soil depth soil total potassium content (g/kg) | http://soil.geodata.cn | Accessed on 12 May 2022 |
| TK515 | 5–15 cm soil depth soil total potassium content (g/kg) | http://soil.geodata.cn | Accessed on 12 May 2022 |
| BD05 | 0–5 cm soil depth soil bulk density (g/cm3) | http://soil.geodata.cn | Accessed on 12 May 2022 |
| BD515 | 5–15 cm soil depth soil bulk density (g/cm3) | http://soil.geodata.cn | Accessed on 12 May 2022 |
| CEC05 | Soil cation exchange capacity of 0–5 cm soil depth (cmol(+)/kg) | http://soil.geodata.cn | Accessed on 12 May 2022 |
| CEC515 | 5–15 cm soil depth soil cation exchange capacity (cmol(+)/kg) | http://soil.geodata.cn | Accessed on 12 May 2022 |
| SOC05 | 0–5 cm soil depth soil organic carbon content (g/kg) | http://soil.geodata.cn | Accessed on 12 May 2022 |
| SOC515 | 5–15 cm soil depth soil organic carbon content (g/kg) | http://soil.geodata.cn | Accessed on 12 May 2022 |
| TKN | Soil thickness (cm) | http://soil.geodata.cn | Accessed on 12 May 2022 |
| TEMM | Annual average temperature (°C) | http://data.cma.cn | Accessed on 18 October 2021 |
| TEMA | >0 °C annual accumulated temperature (°C) | http://data.cma.cn | Accessed on 18 October 2021 |
| PRE | Total annual precipitation (mm) | http://data.cma.cn | Accessed on 18 October 2021 |
| RAD | Annual total solar radiation (MJ/m2) | http://data.cma.cn | Accessed on 18 October 2021 |
| CHFE | Chemical fertilizer application rate of cultivated land per unit area (t/ha) | http://tjj.gz.gov.cn/ | Accessed on 13 March 2022 |
| PSTD | Pesticide application rate of cultivated land per unit area (t/ha) | http://tjj.gz.gov.cn/ | Accessed on 13 March 2022 |
| PLSH | Film usage per unit area of cultivated land (t/ha) | http://tjj.gz.gov.cn/ | Accessed on 13 March 2022 |
| DFRS | Distance from field to rural settlement (m) | https://lbsyun.baidu.com/ | Accessed on 18 May 2022 |
| DFRR | Distance from field to rural road (m) | https://download.geofabrik.de/ | Accessed on 18 May 2022 |
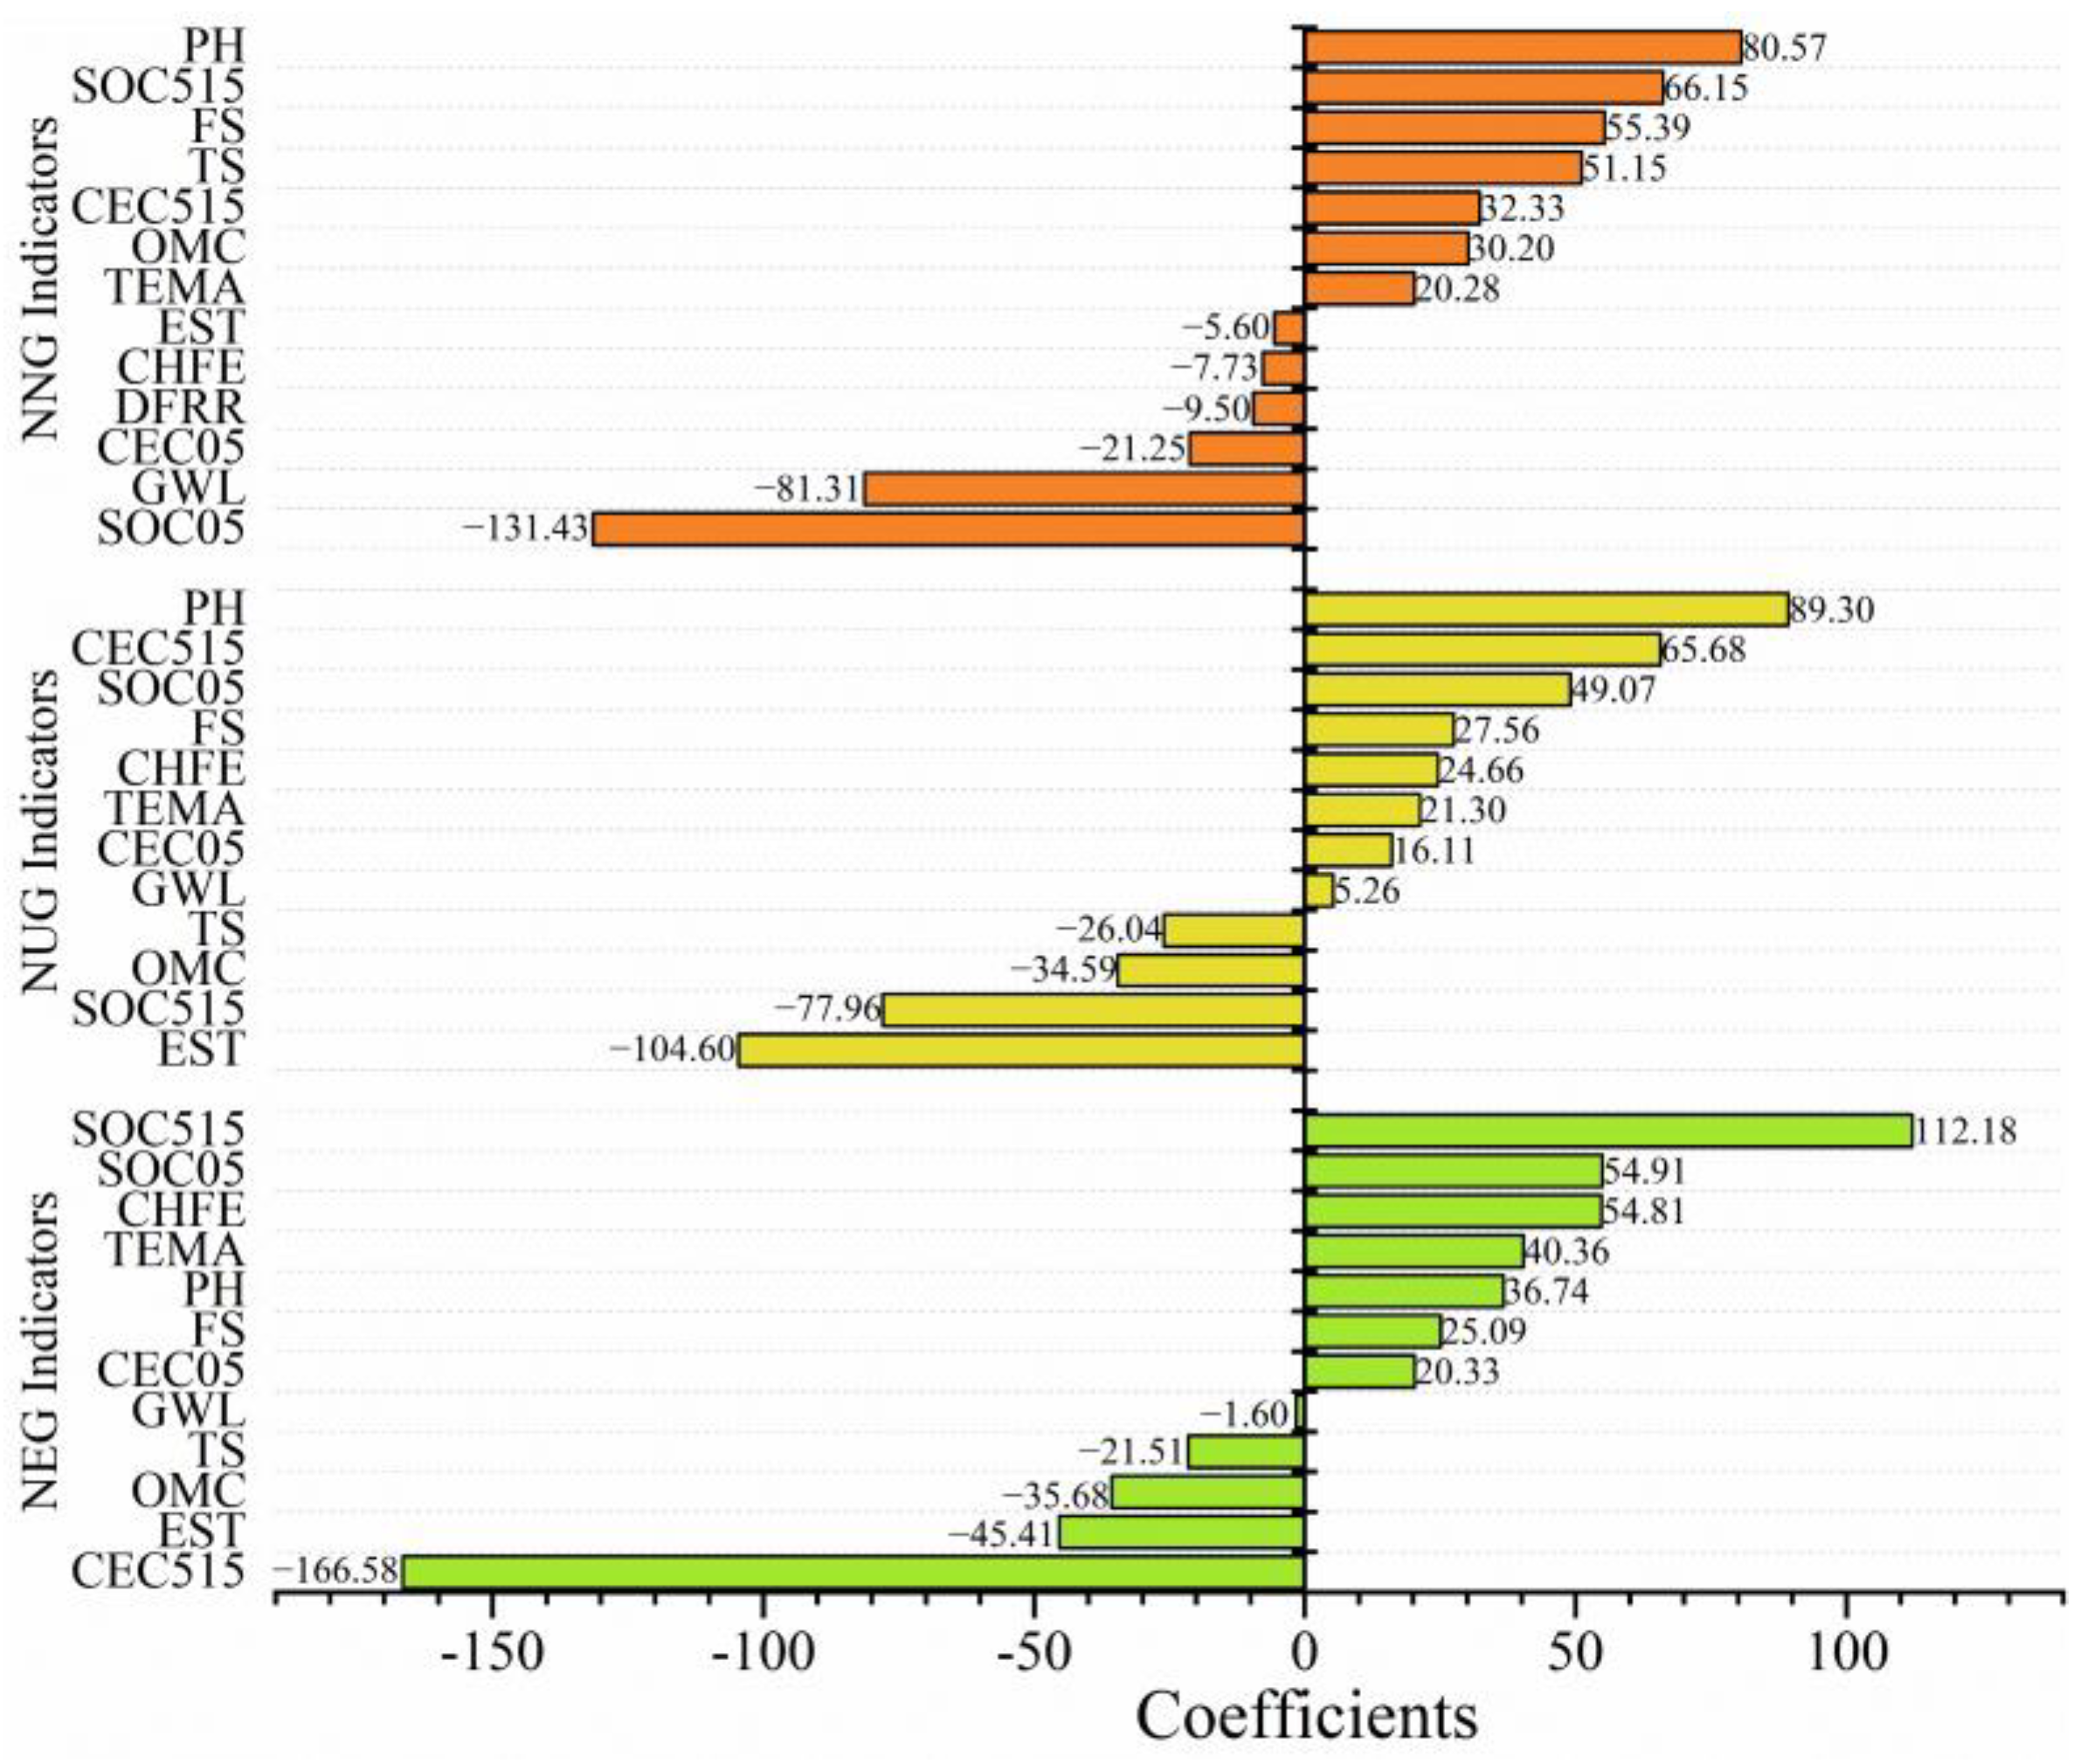
| NNG Indicators | r | NUG Indicators | r | NEG Indicators | r | |||
|---|---|---|---|---|---|---|---|---|
| PH | 0.40 | 80.57 | PH | 0.38 | 89.30 | SOC515 | −0.12 | 112.18 |
| SOC515 | −0.11 | 66.15 | CEC515 | 0.11 | 65.68 | SOC05 | −0.14 | 54.91 |
| FS | −0.13 | 55.39 | SOC05 | −0.14 | 49.07 | CHFE | 0.42 | 54.81 |
| TS | −0.41 | 51.15 | FS | −0.26 | 27.56 | TEMA | 0.17 | 40.36 |
| CEC515 | 0.10 | 32.33 | CHFE | 0.36 | 24.66 | PH | 0.37 | 36.74 |
| OMC | 0.28 | 30.20 | TEMA | 0.16 | 21.30 | FS | −0.23 | 25.09 |
| TEMA | 0.17 | 20.28 | CEC05 | 0.10 | 16.11 | CEC05 | 0.12 | 20.33 |
| EST | 0.35 | −5.60 | GWL | −0.24 | 5.26 | GWL | −0.27 | −1.60 |
| CHFE | 0.32 | −7.73 | TS | −0.32 | −26.04 | TS | −0.29 | −21.51 |
| DFRR | −0.14 | −9.50 | OMC | 0.20 | −34.59 | OMC | 0.21 | −35.68 |
| CEC05 | 0.10 | −21.25 | SOC515 | −0.12 | −77.96 | EST | 0.41 | −45.41 |
| GWL | −0.29 | −81.31 | EST | 0.41 | −104.60 | CEC515 | 0.12 | −166.58 |
| SOC05 | −0.13 | −131.43 |
| NNG | Range | NUG/NEG | Range |
|---|---|---|---|
| Level 1 | NNGI > 5600 | Level 4 | NUGI/NEGI > 2200 |
| Level 2 | 5200 < NNGI ≤ 5600 | Level 5 | 2000 < NUGI/NEGI ≤ 2200 |
| Level 3 | 4800 < NNGI ≤ 5200 | Level 6 | 1800 < NUGI/NEGI ≤ 2000 |
| Level 4 | 4400 < NNGI ≤ 4800 | Level 7 | 1600 < NUGI/NEGI ≤ 1800 |
| Level 5 | 4000 < NNGI ≤ 4400 | Level 8 | 1400 < NUGI/NEGI ≤ 1600 |
| Level 6 | 3600 < NNGI ≤ 4000 | Level 9 | 1200 < NUGI/NEGI ≤ 1400 |
| Gap | No Gap (Gap = 0) | Small Gap (Gap = 1) | Medium Gap (Gap = 2) | Big Gap (Gap = 3) | ||||
|---|---|---|---|---|---|---|---|---|
| Area (ha) | Percent (%) | Area (ha) | Percent (%) | Area (ha) | Percent (%) | Area (ha) | Percent (%) | |
| NNG | 67,658.204 | 80.697 | 16,077.018 | 19.175 | 103.654 | 0.124 | 3.308 | 0.004 |
| NUG | 69,511.871 | 82.908 | 13,907.437 | 16.588 | 403.803 | 0.482 | 19.072 | 0.023 |
| NEG | 64,069.628 | 76.417 | 18,902.307 | 22.545 | 838.513 | 1.000 | 31.735 | 0.038 |
Publisher’s Note: MDPI stays neutral with regard to jurisdictional claims in published maps and institutional affiliations. |
© 2022 by the authors. Licensee MDPI, Basel, Switzerland. This article is an open access article distributed under the terms and conditions of the Creative Commons Attribution (CC BY) license (https://creativecommons.org/licenses/by/4.0/).
Share and Cite
Zhou, W.; Zhao, L.; Hu, Y.; Liu, Z.; Wang, L.; Ye, C.; Mao, X.; Xie, X. Cultivated Land Quality Evaluated Using the RNN Algorithm Based on Multisource Data. Remote Sens. 2022, 14, 6014. https://doi.org/10.3390/rs14236014
Zhou W, Zhao L, Hu Y, Liu Z, Wang L, Ye C, Mao X, Xie X. Cultivated Land Quality Evaluated Using the RNN Algorithm Based on Multisource Data. Remote Sensing. 2022; 14(23):6014. https://doi.org/10.3390/rs14236014
Chicago/Turabian StyleZhou, Wu, Li Zhao, Yueming Hu, Zhenhua Liu, Lu Wang, Changdong Ye, Xiaoyun Mao, and Xia Xie. 2022. "Cultivated Land Quality Evaluated Using the RNN Algorithm Based on Multisource Data" Remote Sensing 14, no. 23: 6014. https://doi.org/10.3390/rs14236014
APA StyleZhou, W., Zhao, L., Hu, Y., Liu, Z., Wang, L., Ye, C., Mao, X., & Xie, X. (2022). Cultivated Land Quality Evaluated Using the RNN Algorithm Based on Multisource Data. Remote Sensing, 14(23), 6014. https://doi.org/10.3390/rs14236014