Article

The Potential of UAV Data as Refinement of Outdated Inputs for Visibility Analyses

1
Department of Forest Management and Applied Geoinformatics, Faculty of Forestry and Wood Technology, Mendel University in Brno, 613 00 Brno, Czech Republic
2
Department of Landscape Management, Faculty of Forestry and Wood Technology, Mendel University in Brno, 613 00 Brno, Czech Republic
3
Department of Regional Development, Faculty of Regional Development and International Studies, Mendel University in Brno, 613 00 Brno, Czech Republic
*
Author to whom correspondence should be addressed.
Remote Sens. 2023, 15(4), 1028; https://doi.org/10.3390/rs15041028
Submission received: 9 January 2023 / Revised: 7 February 2023 / Accepted: 9 February 2023 / Published: 13 February 2023

Abstract

:
Visibility analyses in geographical information systems (GIS) are used to quantify the visible and non-visible parts of the landscape. This study aims to evaluate the changes in viewshed outputs after the unmanned aerial vehicle (UAV) data refinement for the near surroundings of the observer. This research accounts for the influence of data age, mainly due to vegetation growth, and the impact of the input data quality on the final study output. The raw data that were used for UAV refinement were publicly available data (one dataset at the global level, two datasets at the national level of the Czech Republic) and airborne laser scanning (ALS) data. Three localities were selected in order to compare the viewshed evaluation that was processed over ten raster elevation models. The comparison was performed using the kappa coefficient, which considers not only the matching visible pixels, but also false visibility and invisibility. Over the span of five years (2013–2018), the visible area at two sites has decreased by more than 7%. Although with some variations (kappa coefficient varied from 0.02 to 0.92), all the study sites showed a decreasing trend of the visible area with the data aging, which was caused by the vegetation growth or landscape changes. The results showed the effect of data aging in forested areas on the resulting visibility within a couple of years. At all the sites, major changes in visibility were observed after three years (2021 vs. 2018) due to vegetation growth, forest management, and natural phenomena, such as windfalls. This study concludes that UAV data will increase the accuracy of visibility analysis, even when using freely available low-resolution data, and may also help us to update obsolete input data. The results of this research can be used to refine visibility analysis when current digital surface model (DSM) data is not available.

Graphical Abstract

1. Introduction

Visibility is an environmental quality that we evaluate in order to quantify the landscape’s aesthetics [1]. Factors influencing visibility, such as atmospheric clarity, lighting conditions, psychological reactions to visual stimuli, and others, are described, for example, by [2,3]. In the past, the assessment of visual changes was based on expertise and photo-based methods. In more recent studies [4] these photographic methods are used mainly for validation. For visibility analyses, GIS tools are commonly used.
In principle, visibility analyses in GIS can distinguish between the visible and the invisible parts, which are basic binary operations [5]. For this type of calculation, viewshed is often used [6]. It is a tool that is designed to operate on the elevation of the Earth’s land surface data [7] and has been used for more than two decades [8]. The output of the viewshed is the area that is visible from the given observation point [9], which is also known as the viewpoint.
Viewshed, and its extended forms, are used in a wide range of disciplines, starting from military use [10], radiocommunication [11], and archaeology [12,13], through to ecotourism [14,15], animal behavior [16], and forestry [17,18], to urban and landscape planning [19,20,21,22,23].
In addition to the study domain, these analyses can be classified according to the size of the study area. In the context of visibility analyses, Murgoitio et al. [24] used the division of visibility by range, i.e., long-range visibility and short-range visibility. Similarly [25], distinguished the visibility of the fine-scale area (encompassing several to tens of meters) and the landscape scale (several square kilometers). This paper examines the visibility of the landscape scale.
The elevation information of the study area is typically stored in raster data, which is usually the digital elevation model (DEM), which is sometimes called the digital terrain model (DTM) or the DSM. For less detailed analyses, DTM, which contains information about the land relief, can be applied, since the morphology is the primary visibility factor. However, this modelling is inadequate, as the visibility is largely affected by objects lying on the ground surface (esp. buildings and vegetation) and, therefore, these analyses are most often performed on DSM [9]. Since datasets with higher spatial resolution (of 5 m or less) are generally available, it is not reasonable to use other types of elevation data besides DSM for viewshed analyses, primarily because the outcome will be considerably affected by the missing features (vegetation and buildings). Viewshed analyses that are performed on DEM or DTM do not provide a sufficient level of information to be valid for real-world visibility estimation. Besides, this study used data that were obtained by LiDAR, which most of the current studies [9] use for DSM creation.
Some recent studies [26,27] point out that these models, although they contain height information, are not 3D, but only 2.5D, as there is only one Z-value for a single point, and, therefore, the typical tree structure cannot be recorded correctly. Even though there have been some efforts to implement 3D visibility analyses [28,29,30,31], their capabilities are still limited. Three-dimensional modelling is therefore primarily used to visualize the outputs of analyses performed on 2D surface models.
Such surface models are applicable to a landscape-scale area and are usually generated based on remote sensing methods, such as photogrammetric processing of images, RADAR (radio detection and ranging), or LiDAR (light detection and ranging). For visibility analyses, LiDAR data are one of the most common sources [9]. These data can be obtained from either airborne, terrestrial, or unmanned aircraft. ALS has decimetric to centimetric accuracy [32,33,34], relatively rapid acquisition, and the ability to detect multiple surface points from vegetation. It can be used even over a large area [35]. Nevertheless, this type of scanning provides only a vertical perspective of the landscape. This problem could be partially solved by terrestrial laser scanning (TLS), which has even more detailed resolution (in centimeters or millimeters [32]), and the surface is scanned from the ground position. However, the position of the scanner on the ground limits the scanned area considerably and may not always detect the highest parts of the tree canopy [31]. In order to balance the advantages and disadvantages of these two methods, some authors (e.g., [4,36]) have combined data from ALS and TLS, and thus locally improved the resolution up to 2 cm [25].
Another suitable option for data acquisition is the use of UAVs. This type of method can be used for fine-scale areas where scanning from lower altitudes allows higher data resolution (within centimeters) and is both financially affordable and time efficient (in a few tens of minutes) compared to other methods [37]. This type of analysis was performed by Caha and Kačmařík [38], who utilized a large-scale surface model for a detailed visibility analysis of the local-scale riverbank. This paper examines a combination of local data that were obtained from UAVs in order to refine a large-scale model from ALS or other sources that are described in the methodology.
Regardless of the scanning method used, it is apparent that visibility is more affected by the presence of objects that are located closer to the observer [39]. The observer’s immediate surroundings have an enormous impact on the outcomes of viewshed analysis. Even relatively minor objects that are in close proximity to the observer can potentially block a large portion of the viewshed area [40]. The same object, when located further from the observer, blocks a much smaller portion of the area. This is the main reason why a detailed model of the observer’s location is important for the final analysis outcome.
The occurrence of objects and their heights change continuously. In the case of visibility in urban areas, the development of settlements and the construction of new buildings play the greatest role. In open countryside, it is mainly the growth of vegetation. As for forested areas, stands play the main role, alongside forestry management plans and natural disturbances (e.g., fires [18,41] or wind calamities [42]). These factors result in the very rapid removal of forest cover as a visibility obstacle. In general, changes in the observation point’s immediate vicinity have a greater visibility impact. In contrast, changes at greater distances do not affect the extent of the visibility so significantly [40,43].
Unlike stable spatial objects (buildings, terrain etc.), a problem for visibility analysis is presented by objects with changing characteristics (typically vegetation). Rášová [43] divided the vegetation into “obstacles with a known extent being opaque” and “the stand-alone features being partially transparent”. In addition, this author also describes the problem of the different volumes of the crown and the trunk of trees, and the different visibility depending on the type of vegetation and the research season [44]. In this paper, due to the assessed landscape character, we estimate the examined vegetation to be an opaque obstacle without transparency. Moreover, due to changing object heights, the data become outdated quite quickly. Therefore, it is necessary to use the most up-to-date data that are available, depending on the domain and the purpose of the investigation. For large areas, ALS data are applied the most. However, their collection is expensive and, even in the case of developed countries, takes place at intervals of only a few years.
Updating the data is particularly important for the vicinity of the observation point. The height of the vegetation that is located a few meters from the observer can substantially raise the local horizon [45], and thus, more or less conceal the distant views of the landscape. In contrast, a change to the surface objects at a greater distance will not have that much of an influence on the visibility [40]. Therefore, as the distance increases, there is no need to have as detailed data as that near the observation point.
Therefore, this study aims to evaluate the degree of change in the viewshed (which is a binary visibility analysis) output after UAV data refinement of the near surroundings. This study considers the freely available public data, ALS data, and the addition of the UAV data to the initial input data for the viewshed analysis. Moreover, it attempts to account for the impact of the input data quality on the final analysis output and to consider the influence of the data age, particularly due to vegetation growth. Hence, the basic hypotheses are stated as follows: (i) the age of the data collected using different sources affects the visibility analysis, and (ii) updating the data in the near vicinity will increase the visibility accuracy, even when using globally available data.

2. Materials and Methods

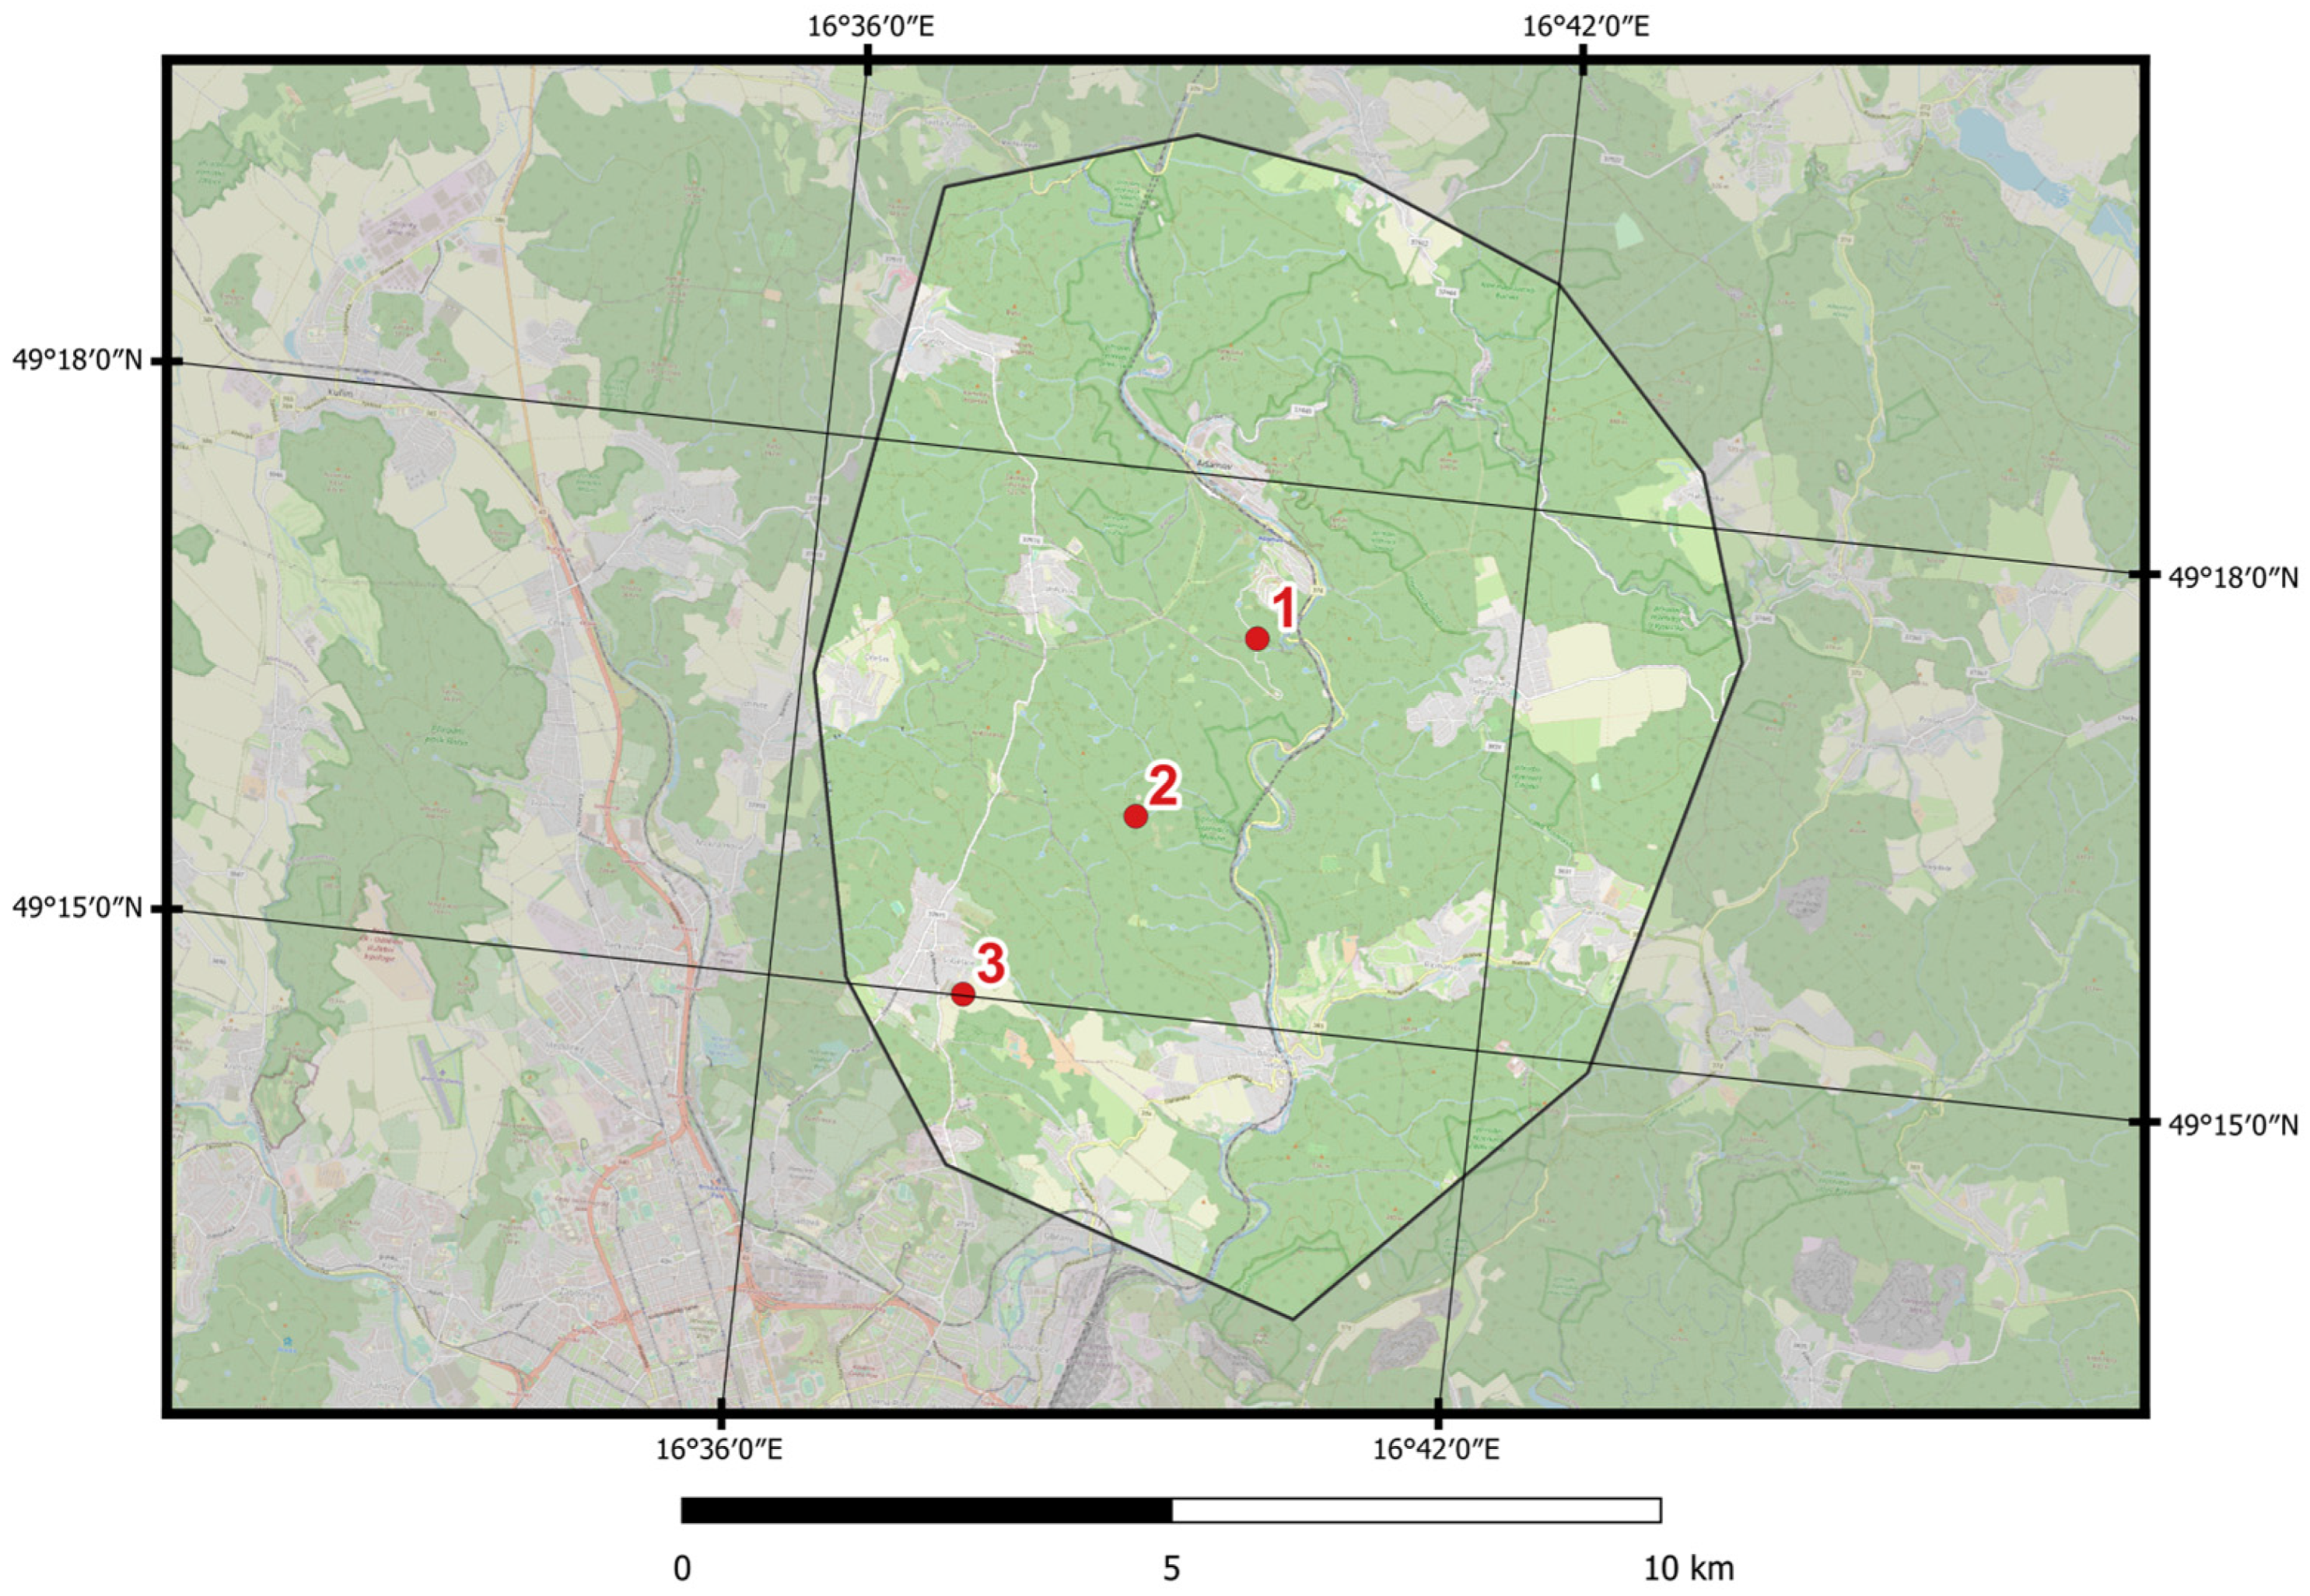
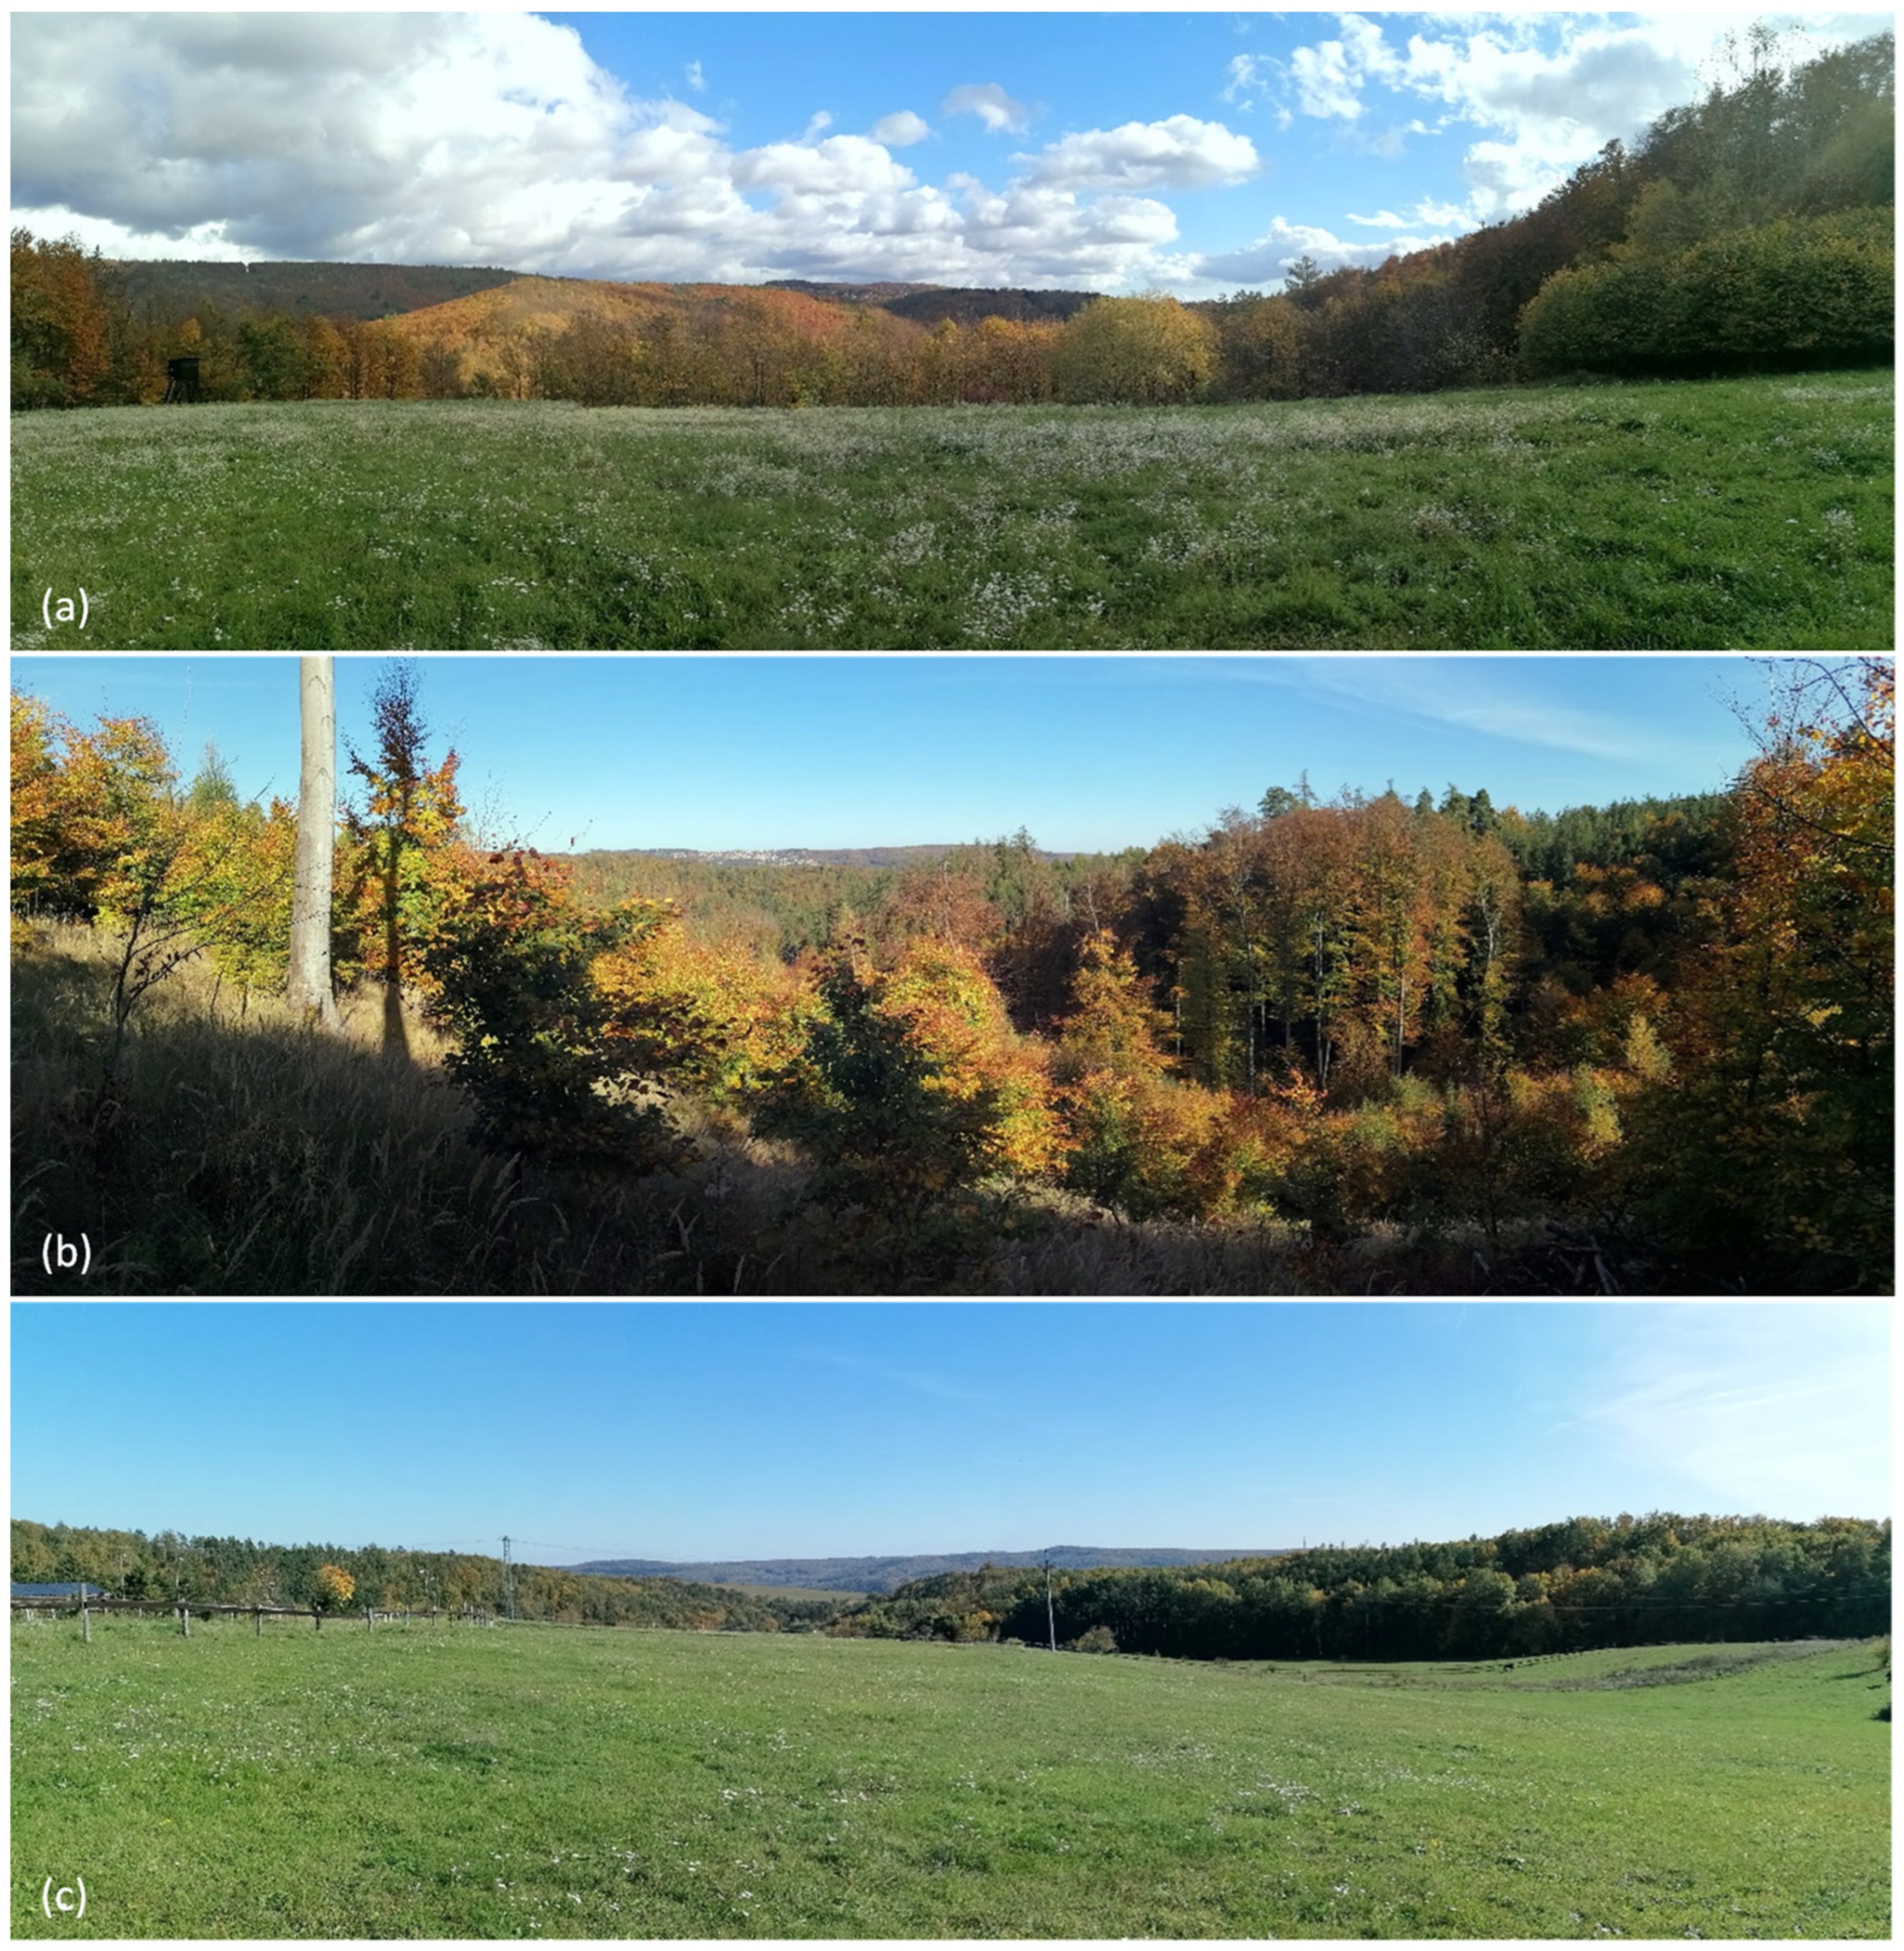
The visibility analyses were carried out within the Training Forest Enterprise Křtiny area northeast of Brno (Figure 1) at 3 selected sites (Figure 2). When selecting the sites, emphasis was placed on the difference in the visibility conditions. Site No. 1 is located in the middle of the valley slope on a meadow surrounded by forest with a view into the valley, site No. 2 is situated on a ridge on a clearcut in the middle of a woodland, and site No. 3 is in the open meadow.
The viewpoint locations also differed in terms of the distance to the nearest obstacles. At site No. 1, the nearest distance to the forest was about 50 m, at site No. 2 it was about 10 m, and at site No. 3 it was more than 150 m. The positions of the viewshed points were located using a GNSS Trimble R12, and panoramic photographs were taken on site of the surrounding area (Figure 3).

2.1. Data Sources

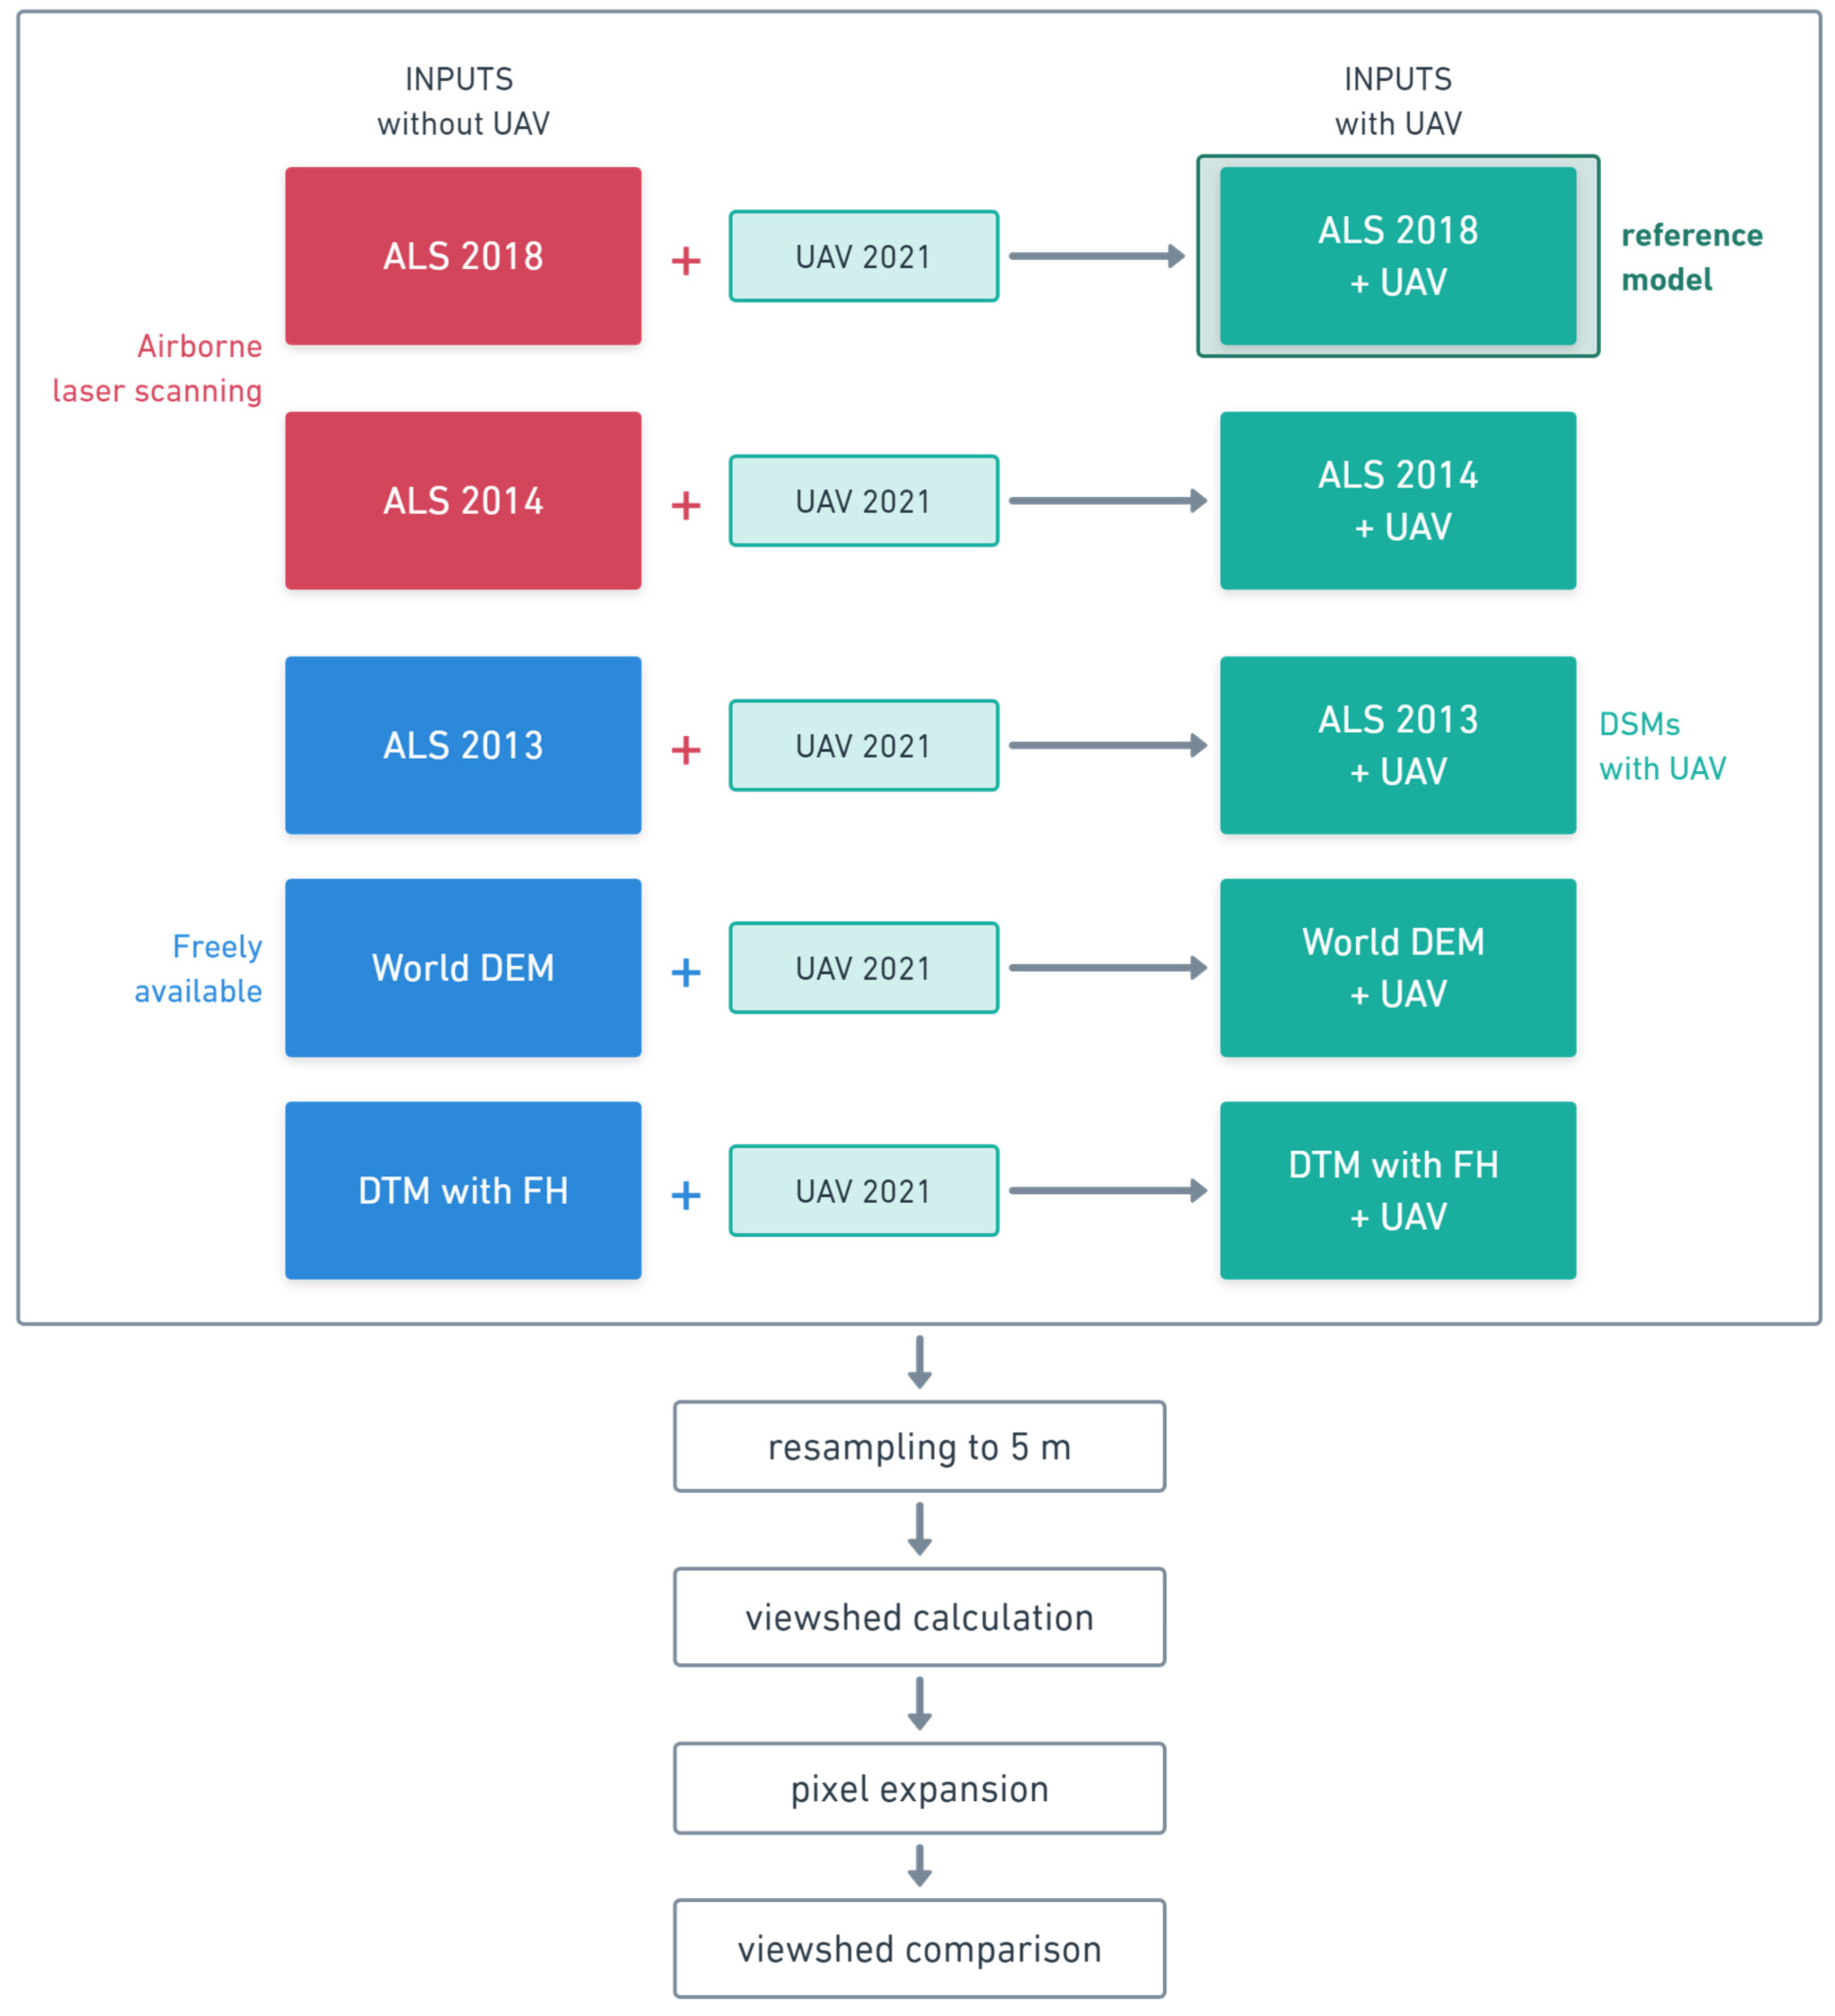
For the visibility calculation, a wider area of interest of about 90 km2 was chosen, where all data sources were available. For detailed information see Table 1 and Figure 4. Specifically, these included ALS data from 2014 and 2018, as well as the freely available DSM of the 1st generation (DMP 1G or ALS 2013). Other public data used are ArcGIS Terrain data (World DEM) and the DTM of the 5th generation (DMR 5G or DTM), complemented by global forest canopy height (FH).
As Table 1 shows, the compared DSMs were acquired by different data collection methods and throughout the various years. In addition, as can be seen from Figure 5 (and more detailed Figure 6), these models differ mainly in the heights of vegetation cover. The lower resolution is apparent in the World DEM model (Figure 5 and Figure 6).
The ALS data from 2014 and 2018 were obtained in the form of point clouds. Subsequently, these point clouds were interpolated with the help of ArcGIS Pro 3.0 software [46] into raster DSMs with a resolution of 5 m. The ALS data from 2013 were created by the Czech Office for Surveying, Mapping, and Cadaster as part of the creation of the new elevation map of the Czech Republic and have the lowest point density of about 1–2 points per m2. Within this ALS 2013 model, some small objects, such as solitary trees or electricity pylons, were automatically removed during processing. The model is thus partially generalized. The data from 2014 and 2018 were generated by a separate data acquisition of the territory of TFE Křtiny and have higher point densities (7 points per m2 and 4 points per m2, respectively). This study did not assess the accuracy of the ALS data. From studies already carried out, a horizontal accuracy of around 0.20 m [47,48,49,50] and a vertical accuracy of 0.15 m can be assumed [47,51,52,53,54,55,56]. Only the first return was used in the processing of the ALS data, therefore, the resulting models reflect the maximum surface height in each pixel. All the ALS datasets were interpolated to the DSMs with a resolution of 1 m and, subsequently, resampled to 5 m. The resampling was necessary to reduce the computation time of the viewshed analysis, as well as for the comparison with other lower resolution data sources.
The ArcGIS Terrain data were downloaded using ArcGIS Online service. The terrain layer has different data sources and different resolutions depending on the territory. In the case of the Czech Republic, the data come from AirBus WorldDEM4Ortho data with a spatial resolution of 24 m. The data acquisition started in January 2011 and was completed by mid-2015 [57,58]. Based on the studies that have been carried out, the data have a horizontal accuracy of 2 m and a vertical accuracy of 4 m [59,60]. The original data with spatial resolution of 24 m were resampled to 5 m.
The forest height information was obtained from the global forest canopy height layer (hereinafter referred to as FH), which was created by analyzing data from the global ecosystem dynamics investigation (GEDI) scanner. The NASA GEDI is a spaceborne LiDAR instrument operating onboard the international space station since April 2019. A 30 m spatial resolution global forest canopy height map was developed through the integration of GEDI [61]. Based on the studies that have been carried out, the data have a horizontal and vertical accuracy of approximately 4 m [61,62,63,64,65,66,67]. To assess the use of these data for viewshed analysis, the FH layer was combined with the digital terrain model of the fifth generation of the Czech Republic, created by ALS. The combined layer was again resampled to 5 m resolution.
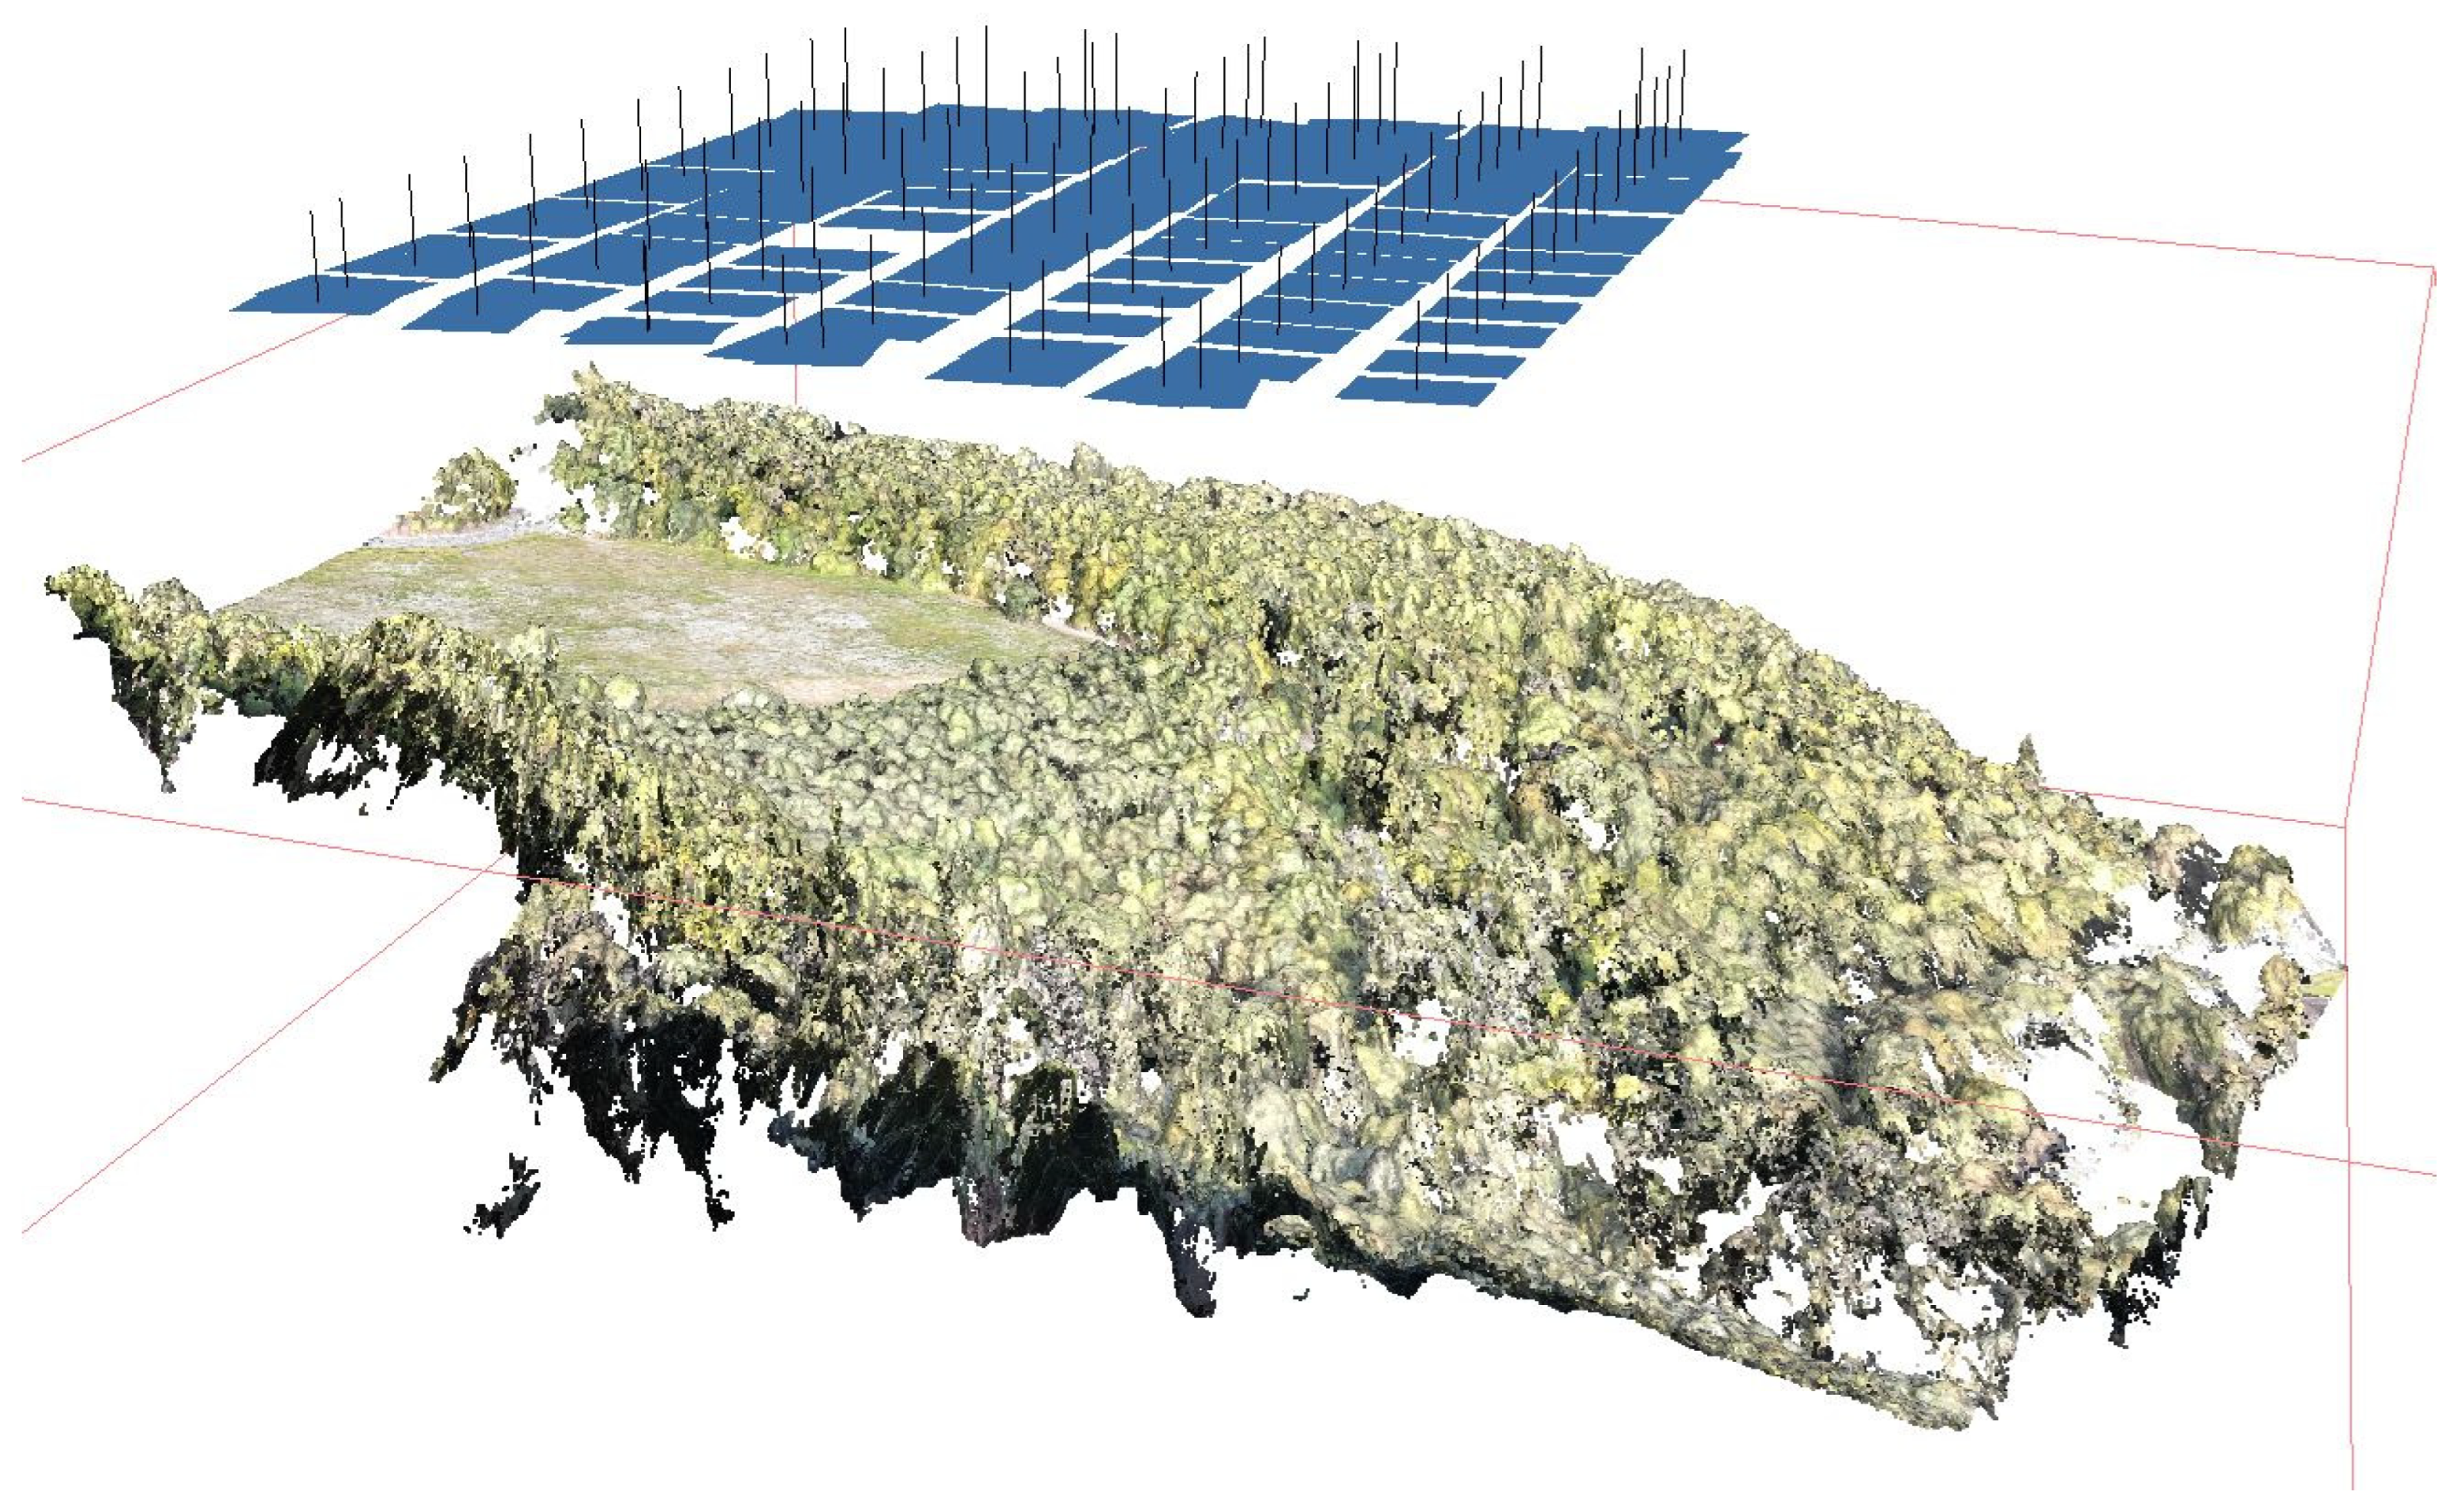
The surroundings of the selected viewshed locations were imaged in September 2021 using UAV DJI Mavic 2 Enterprise with a digital RGB camera with 12Mpix resolution from the height of 100 m above ground. During imaging, the longitudinal and lateral overlaps of the photos were set to 80% to ensure the accurate alignment of the images. Consistent imaging parameter settings were used to guarantee the same accuracy and point cloud density for all sites. At each site, the aim was to capture data for the nearest horizon surrounding the viewpoint: therefore, the area and number of images are different. Together, 93 images were acquired for the location No. 1 (area of 9 ha), 122 images for location No. 2 (area of 14 ha) and 152 images for location No. 3 (area of 16 ha). For each site, four ground control points (GCPs) were selected and targeted for subsequent accurate georeferencing of the models. The positions of the GCPs were located using the Trimble R12 global navigation satellite system with the real-time kinematic (RTK) method with centimeter accuracy. The acquired images were processed into the form of the photogrammetric point cloud and digital surface model with a resolution of 0.15 m by the structure-from-motion (Sfm) algorithm in AGISOFT Metashape Professional software [68] (Figure 7). The accuracy of the created DSMs was determined based on the report from the AGISOFT Metashape Professional software [68], and, for all sites, the vertical accuracy of the model was within 0.10 m and the horizontal accuracy was within 0.05 m. The further viewshed analysis included DSMs for all sites resampled to 5 m resolution.
Table 1. Data sources with parameters.
DEMData ProducerData Collection MethodAccessibilityYear of
Acquisition
Original Spatial
Resolution
Vertical AccuracyHorizontal Accuracy
ALS 2013Czech Office for Surveying, Mapping and, Cadastre [33]ALSPublic20131 m0.40–0.70 m0.70 m
ALS 2014CzechGlobe [69]ALSPrivate20141 m0.15 m0.20 m
ALS 2018CzechGlobe [69]ALSPrivate2018
World DEM Airbus n.d. [58]combination of methodsPublic2011–201524 m4 m2 m
DTMCzech Office for Surveying, Mapping, and Cadastre [34]ALSPublic20131 m0.18–0.30 m0.30 m
FHThe Global Land Analysis and Discovery (GLAD) [70]GEDI scannerPublic201930 m4 m4 m
UAVAuthor’s data UAVPrivate20210.15 m0.10 m0.05 m

2.2. Visibility Calculation

Subsequent processing and analyses were performed in ArcGIS Pro 3.0 software. The visibility calculation was performed with the visibility tool, which allows one to set visibility parameters, including observer height. The calculation also accounts for the curvature of the Earth’s surface (observer height set to 2 m above the Earth’s surface).
Before calculating visibility, the elevation differences between the newest ALS 2018 data and the other digital surface models were first determined and expressed in terms of maxima, minima, mean, standard deviation, and root mean square error (RMSE). To determine not only the differences caused by object height variations across models, but also the spatial congruence among models, these differences were computed for the randomly selected forest area (about 200 ha, 80,000 pixels) and the non-forest areas (again about 200 ha, 80,000 pixels without buildings and other objects).
To compare changes in the landscape (mainly vegetation growth and forest management activities), the visibility calculation was first performed over the following datasets:
  • ALS data from 2013 (ALS 2013);
  • ALS data from 2014 (ALS 2014);
  • ALS data from 2018 (ALS 2018);
  • World DEM from ArcGIS Terrain (World DEM);
  • Digital terrain model of Czech Republic with global forest height (DTM with FH).
The generated DSMs were further combined with data from the vicinity of the view locations obtained by photogrammetric processing from UAVs. This resulted in 5 additional DSMs that combine UAV data for the fine scale and previous DSM data for the landscape scale.
6.
ALS data from 2013 combined with UAV data (ALS 2013 + UAV);
7.
ALS data from 2014 combined with UAV data (ALS 2014 + UAV);
8.
ALS data from 2018 combined with UAV data (ALS 2018 + UAV);
9.
World DEM from ArcGIS Terrain combined with UAV data (World DEM + UAV);
10.
Digital terrain model of Czech Republic with global forest height combined with UAV data (DTM with FH + UAV).
The visibility calculation was performed individually for each viewshed location and data layer (3 viewpoints and 10 available data sources, i.e., 30 viewshed analyses).
The evaluation of the results is partly subjective, as it is not always possible to work with the actual data for a given period and always work with DSM data with a certain delay. However, for the purpose of the evaluation, the 2018 DSM combined with the UAV data were considered as a reference, as it combines the current data for the near surroundings (fine scale) with the newest data for the distant surroundings (landscape scale). This DSM could be considered as the most accurate because it combines the newest data sources with the highest accuracy (Table 1).
The varying quality, extent, and especially the detail of the input data required the precision of the viewshed analysis outputs to be aggregated so that the outputs could be compared consistently across models. Aggregation was deemed necessary, particularly because there is greater elevation variability in the ALS data, as it captures more detail than the globally available data. This level of detail resulted in partial occlusion of the tree crowns located on hillsides, which would not be apparent in less detailed data. Therefore, all viewshed analysis outputs were adjusted with the expand tool to expand the viewshed pixels by 2 pixels on each side before evaluating the match (Figure 8).
The generated visibility layers were compared with the reference visibility calculated from the ALS 2018+UAV DSM, and then the visibility match in the pixel count and percentage was calculated. However, the visibility per pixel matches itself does not reflect the accuracy of the determination, as a higher match in some cases can be influenced by the overall high visibility of the surroundings. A more accurate assessment is provided by the so-called Cohen’s kappa coefficient, which evaluates the occurrence of not only the matching pixels (true positive), but also the number of pixels, true negative, false negative, and false positive [71]. In the traditional 2 × 2 confusion matrix employed in machine learning and statistics to evaluate binary classifications, the Cohen’s kappa formula can be written as follows [72]:
k = 2 × T P × T N F N × F P T P + F P × F P + T N + T P + F N × F N + T N
where TP are the true positives, FP are the false positives, TN are the true negatives, and FN are the false negatives.

3. Results

A comparison of the DSMs that have been used shows that the differences between the object heights in the models gradually increase with the age of the data compared to the newest ALS 2018 data. In the case of the non-forested areas, the RMSE for the height differences does not exceed 1 m anywhere, and all the models in the non-forested areas are approximately equal (Table 2). In the forest stands, the RMSE of the height differences are higher than those in the non-forested parts, due to the forest growth, harvesting, and other natural disturbances. Surprisingly, there is a very small RMSE in the forest cover heights differences for the World DEM model that was created between 2011 and 2016. This error is likely random and due to the originally larger pixel size and subsequent smoothing of the model. The relatively large RMSE value for the ALS data is due to the resampling of the original raster and possible outliers.
After the input data comparison in terms of the height differences and the data structure, the visibility analysis was performed with the viewshed tool. Based on the comparison with the reference model (which was created by combining the 2018 ALS data with UAV data), it was found that, for sites No. 1 and No. 3, the match of visibility results decreased with the age of the data. Site No. 3 did not confirm this influence, due to the landscape changes that occurred during the temporal period that was examined (Table 3, Table 4 and Table 5).
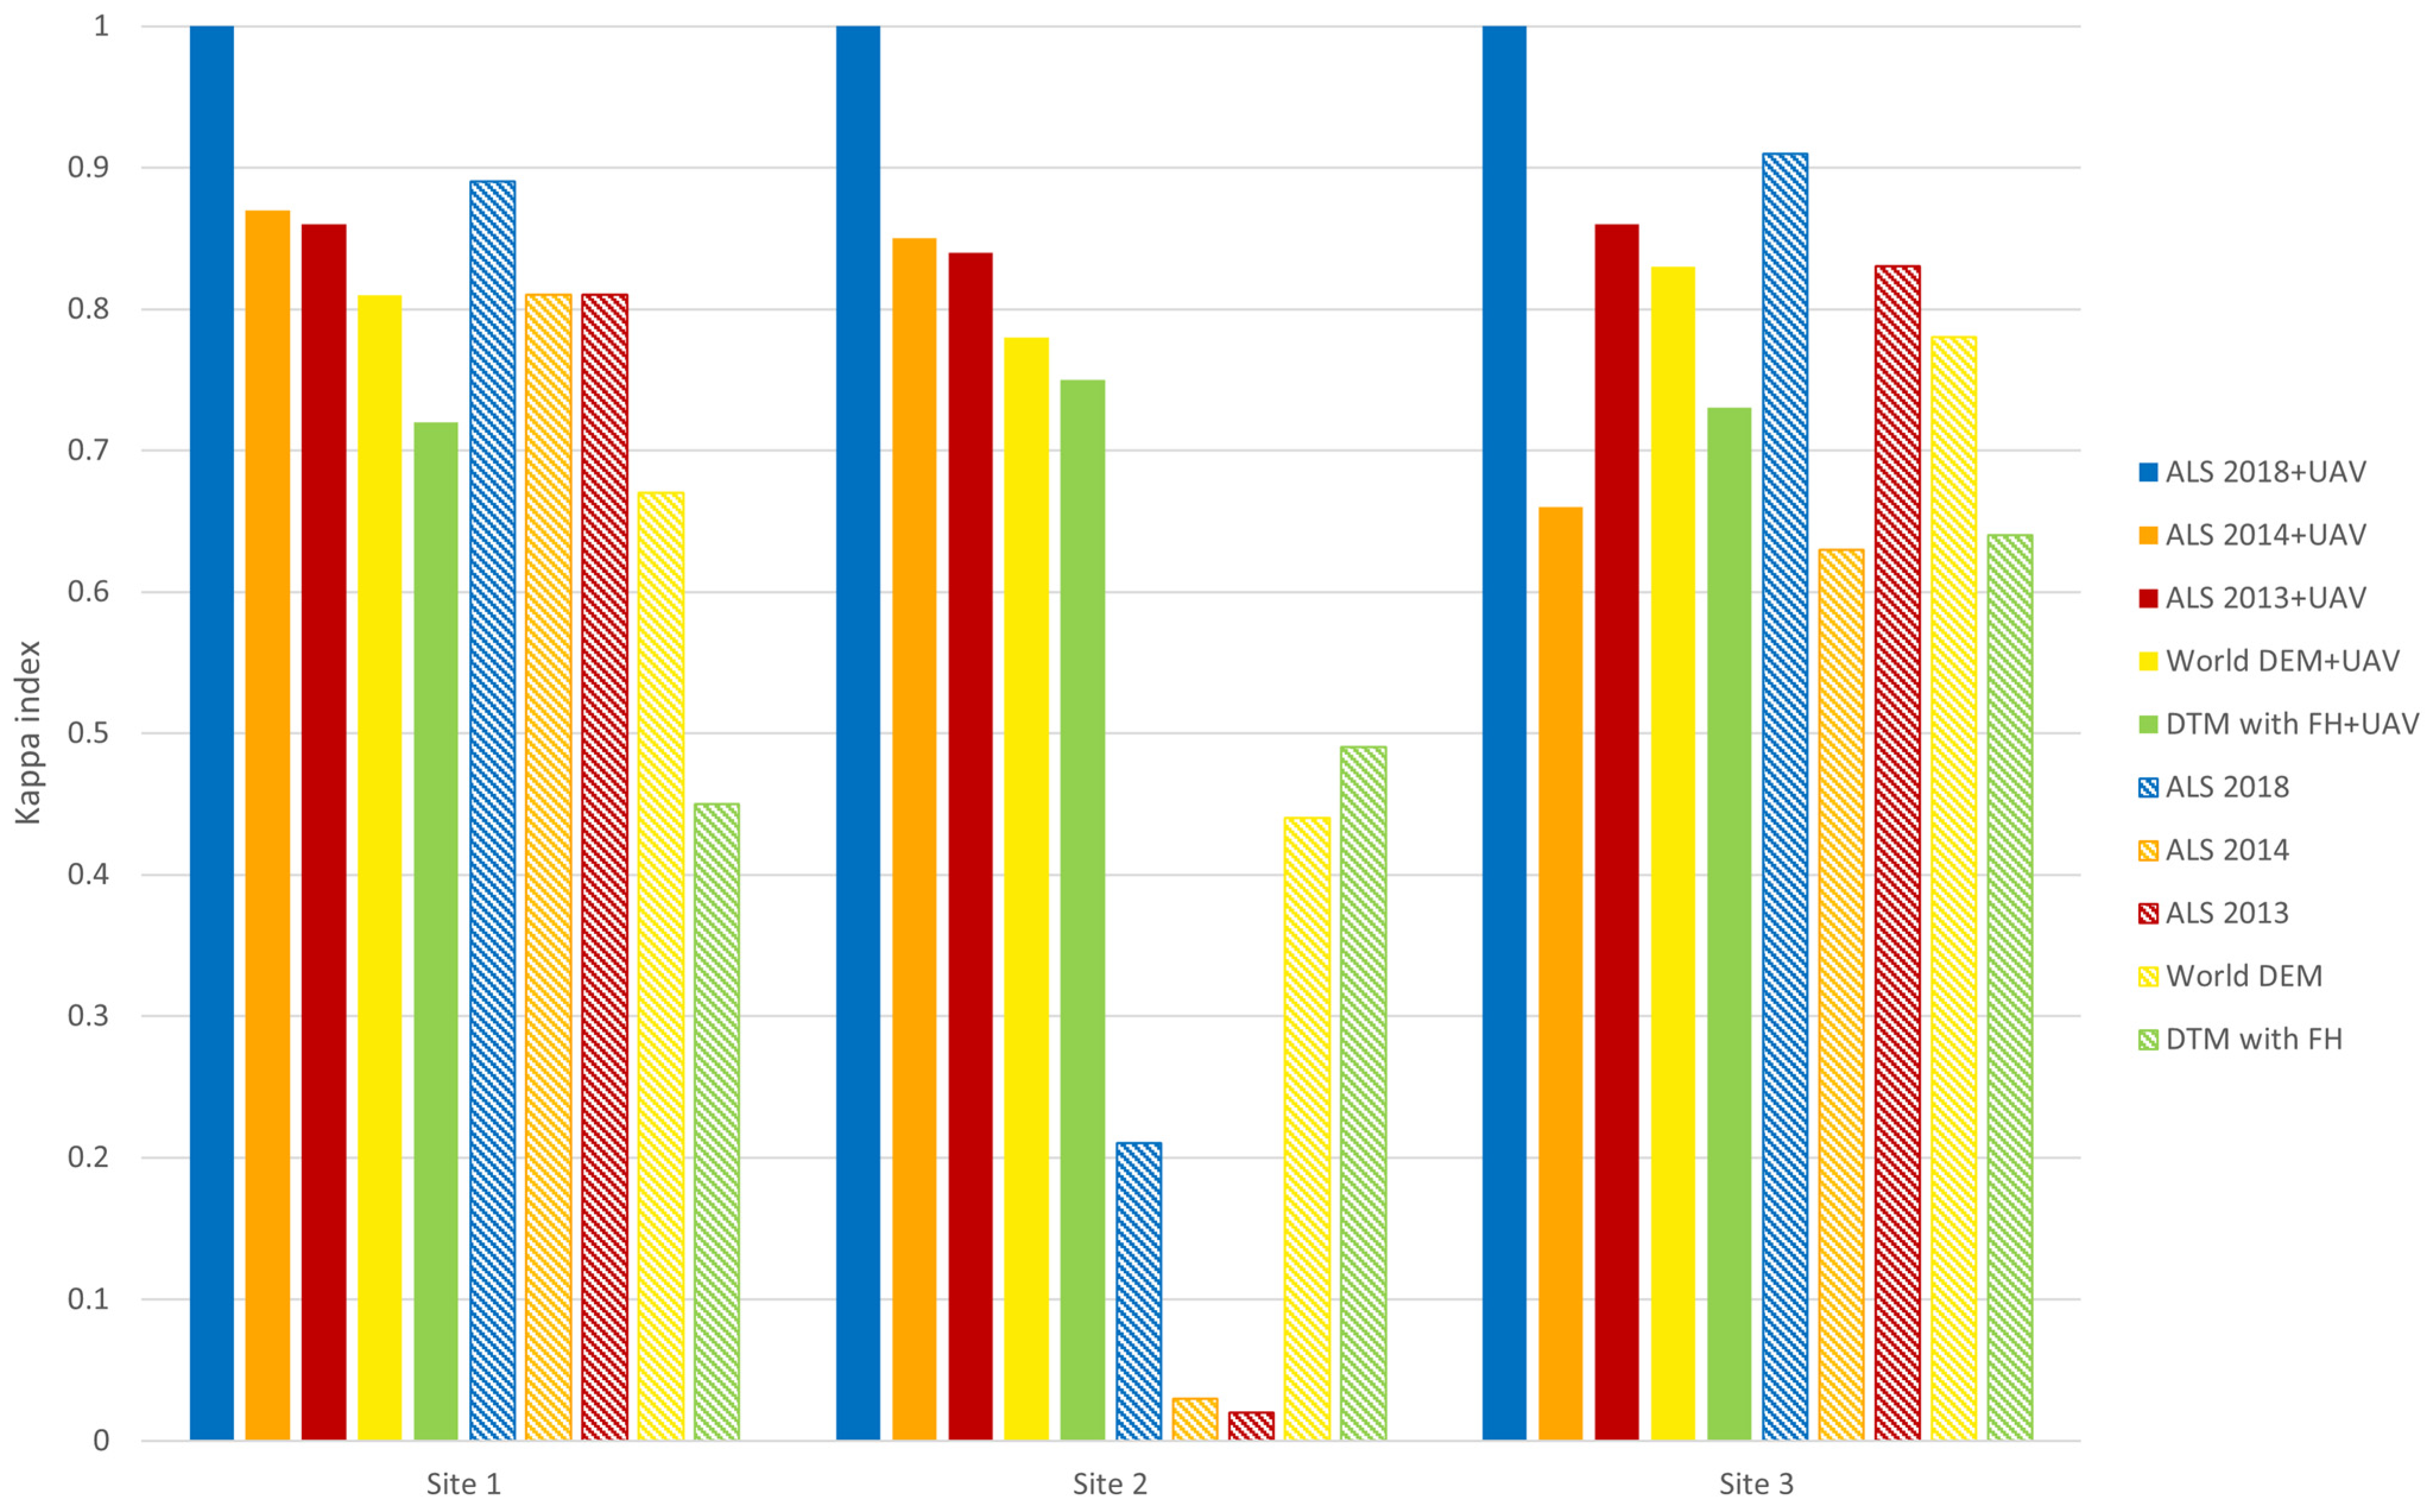
The kappa indexes for all the viewsheds are also demonstrated in Figure 9. This figure showcases the effect of the data age, particularly on the ALS data for 2013, 2014, and 2018, which were collected by the same collection method and, hence, are comparable. However, for ALS 2014 for site No. 3, where a different method of filtering the data was used in the DSM processing, the data show a trend of a decreasing visible area. Over the five years (2013–2018), the visible area at sites No. 1 and No. 3 has decreased by more than 7% (Table 3, Table 4 and Table 5).
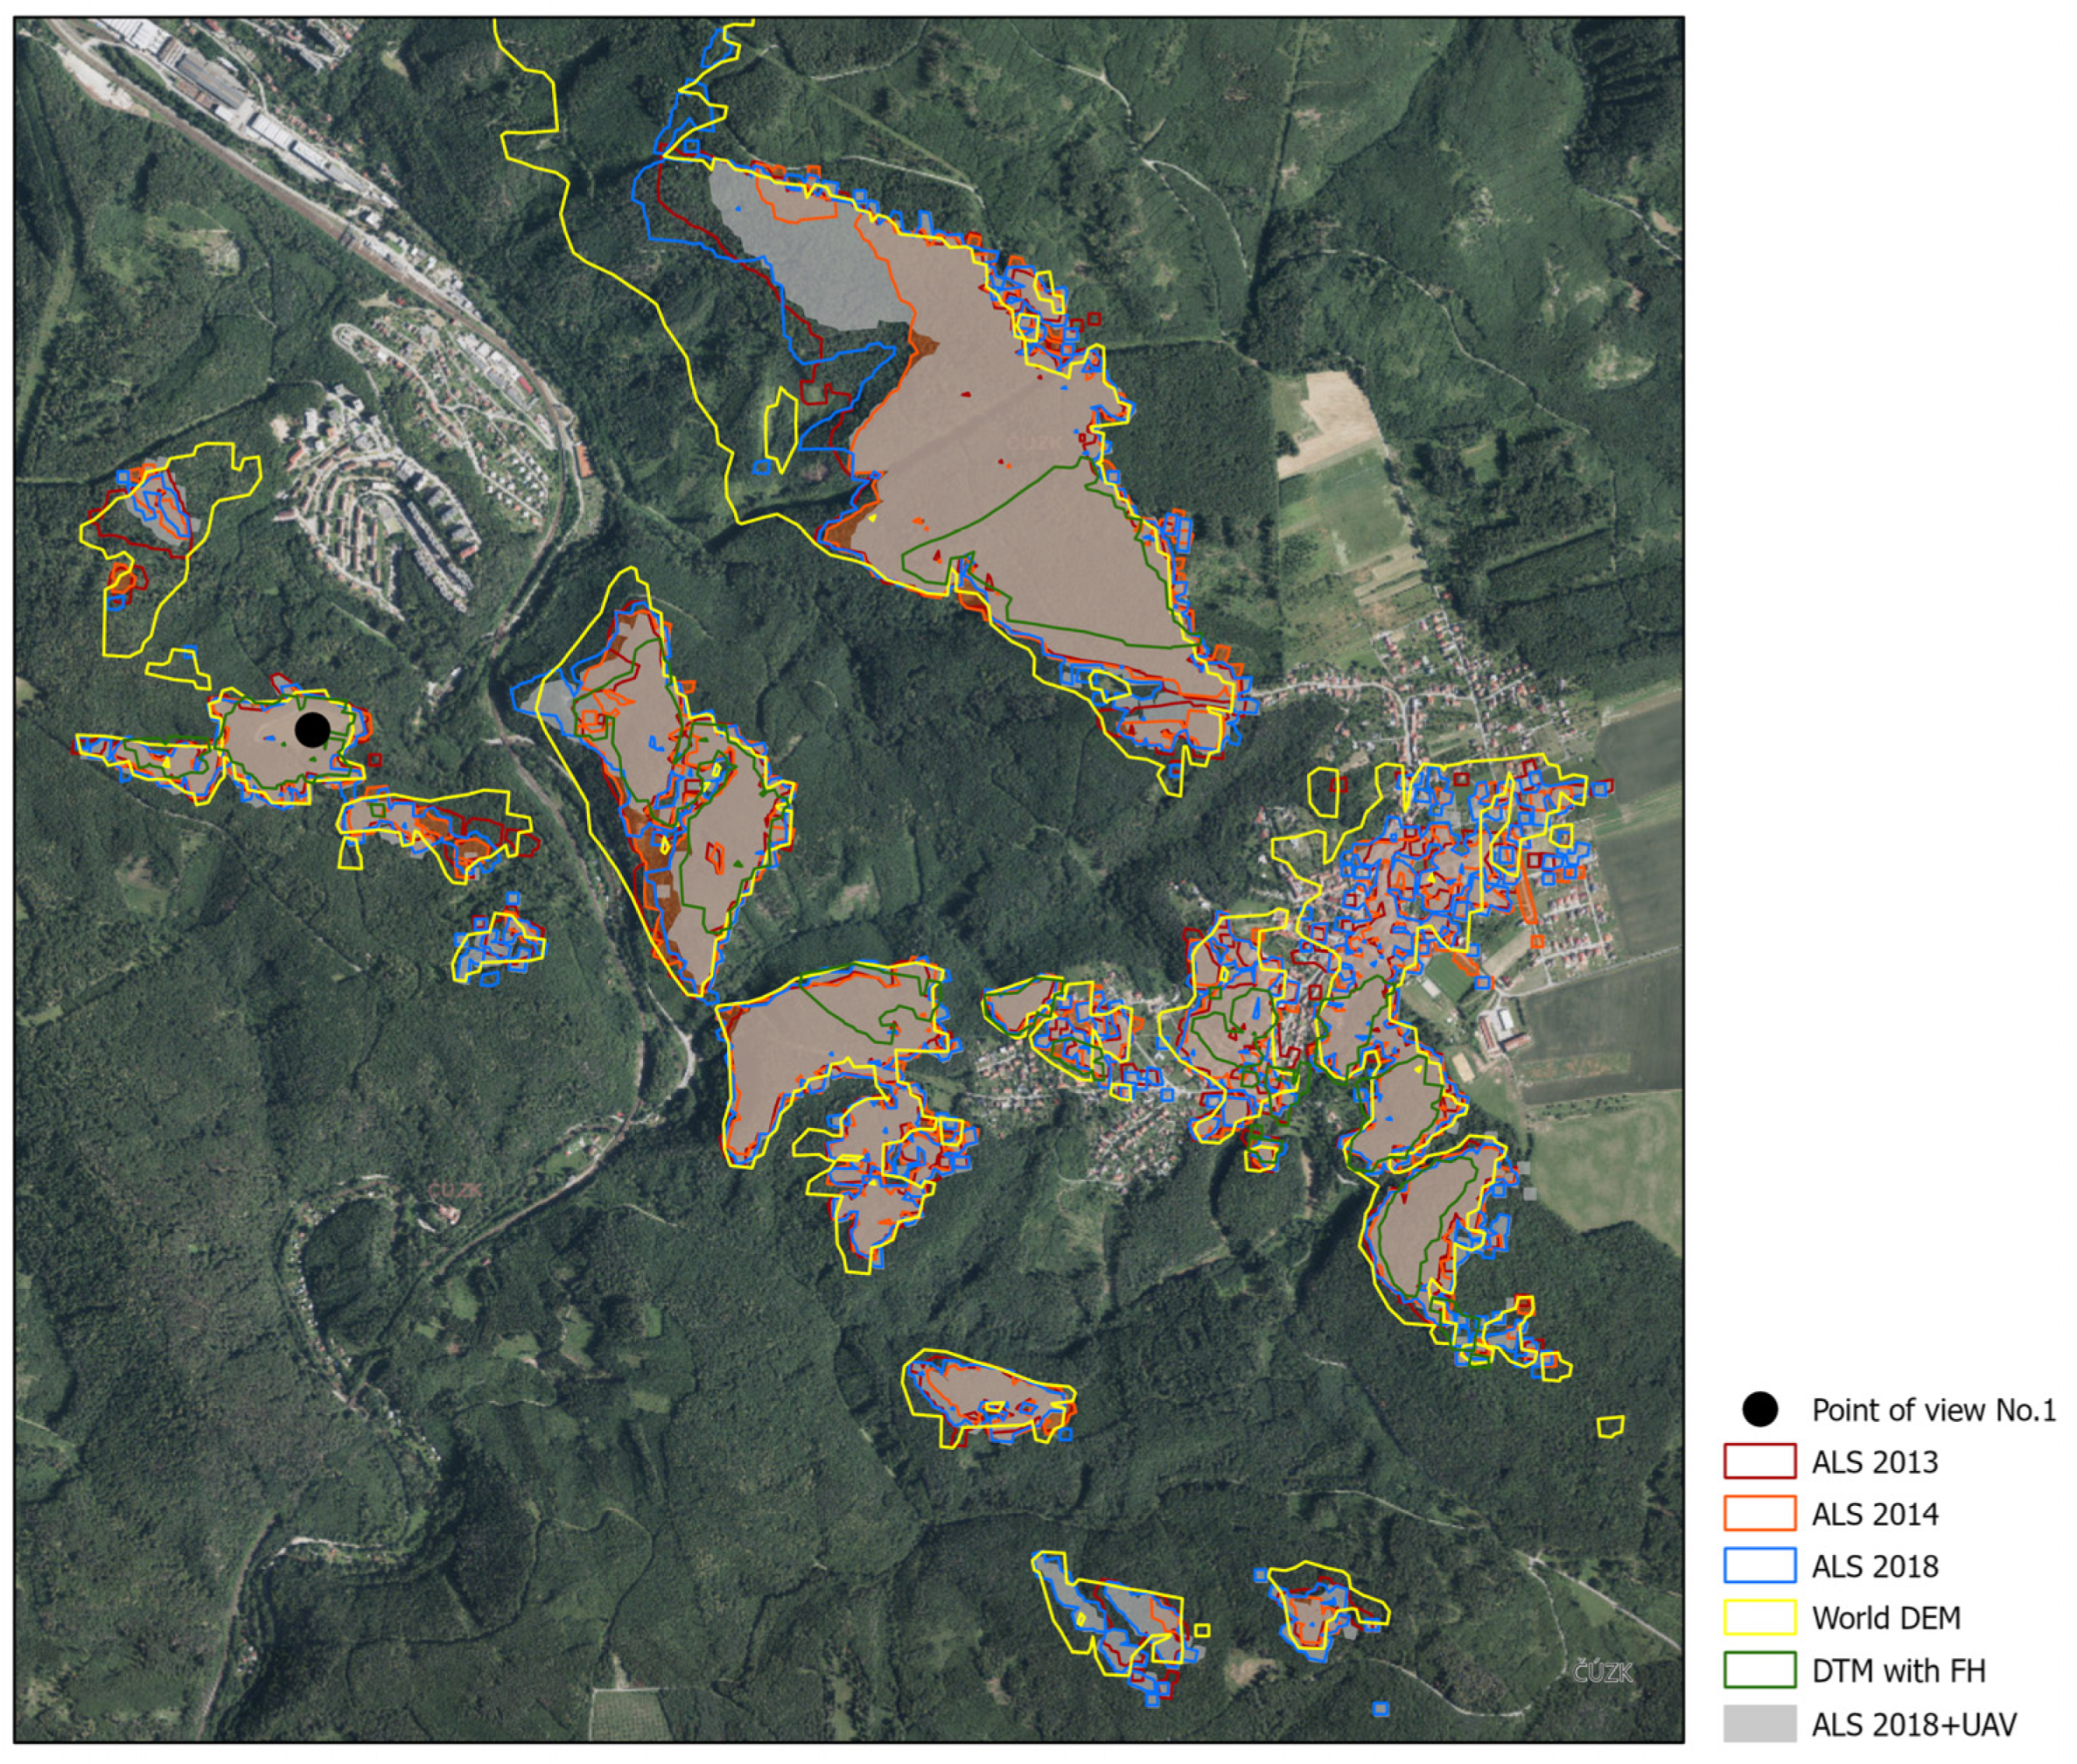
The effect of the age of the data is most visible at site No. 1, where the nearest obstacles (forest cover) were about 50 m apart. The visibility from the ALS 2018 data reached a kappa index value of 0.89, and, quite logically, is the closest to the visibility from the ALS 2018 + UAV reference model (Figure 9 and Table 3). The trend has not been fully confirmed in other locations.
At site No. 2, the nearest forest cover was only about 10 m from the viewpoint. Thus, in 2013, 2014, and 2018, the viewpoint was obscured by the surrounding forest, and conversely, after 2018, logging occurred, which increased visibility.
In the case of site No. 3, the effect of the data age on visibility change is only partially demonstrated, as the ALS 2014 data show the lowest agreement with the reference model. The reasons for this error were searched for in the source point cloud and it was found that the data also contain electricity pylons that were close to the observation point, and, in some locations, the wires themselves. The occurrence of these objects in the DSM thus resulted in an apparent change in visibility. This is proven by the low concordance (the kappa index reached only 0.6) with the reference model in 2014. This occurred regardless of whether the model was refined by drone or not. As expected, the model from the World DEM data achieved the lowest fit, but surprisingly, the worst results were achieved by the DSM that was created by combining the DTM and the forest heights data.
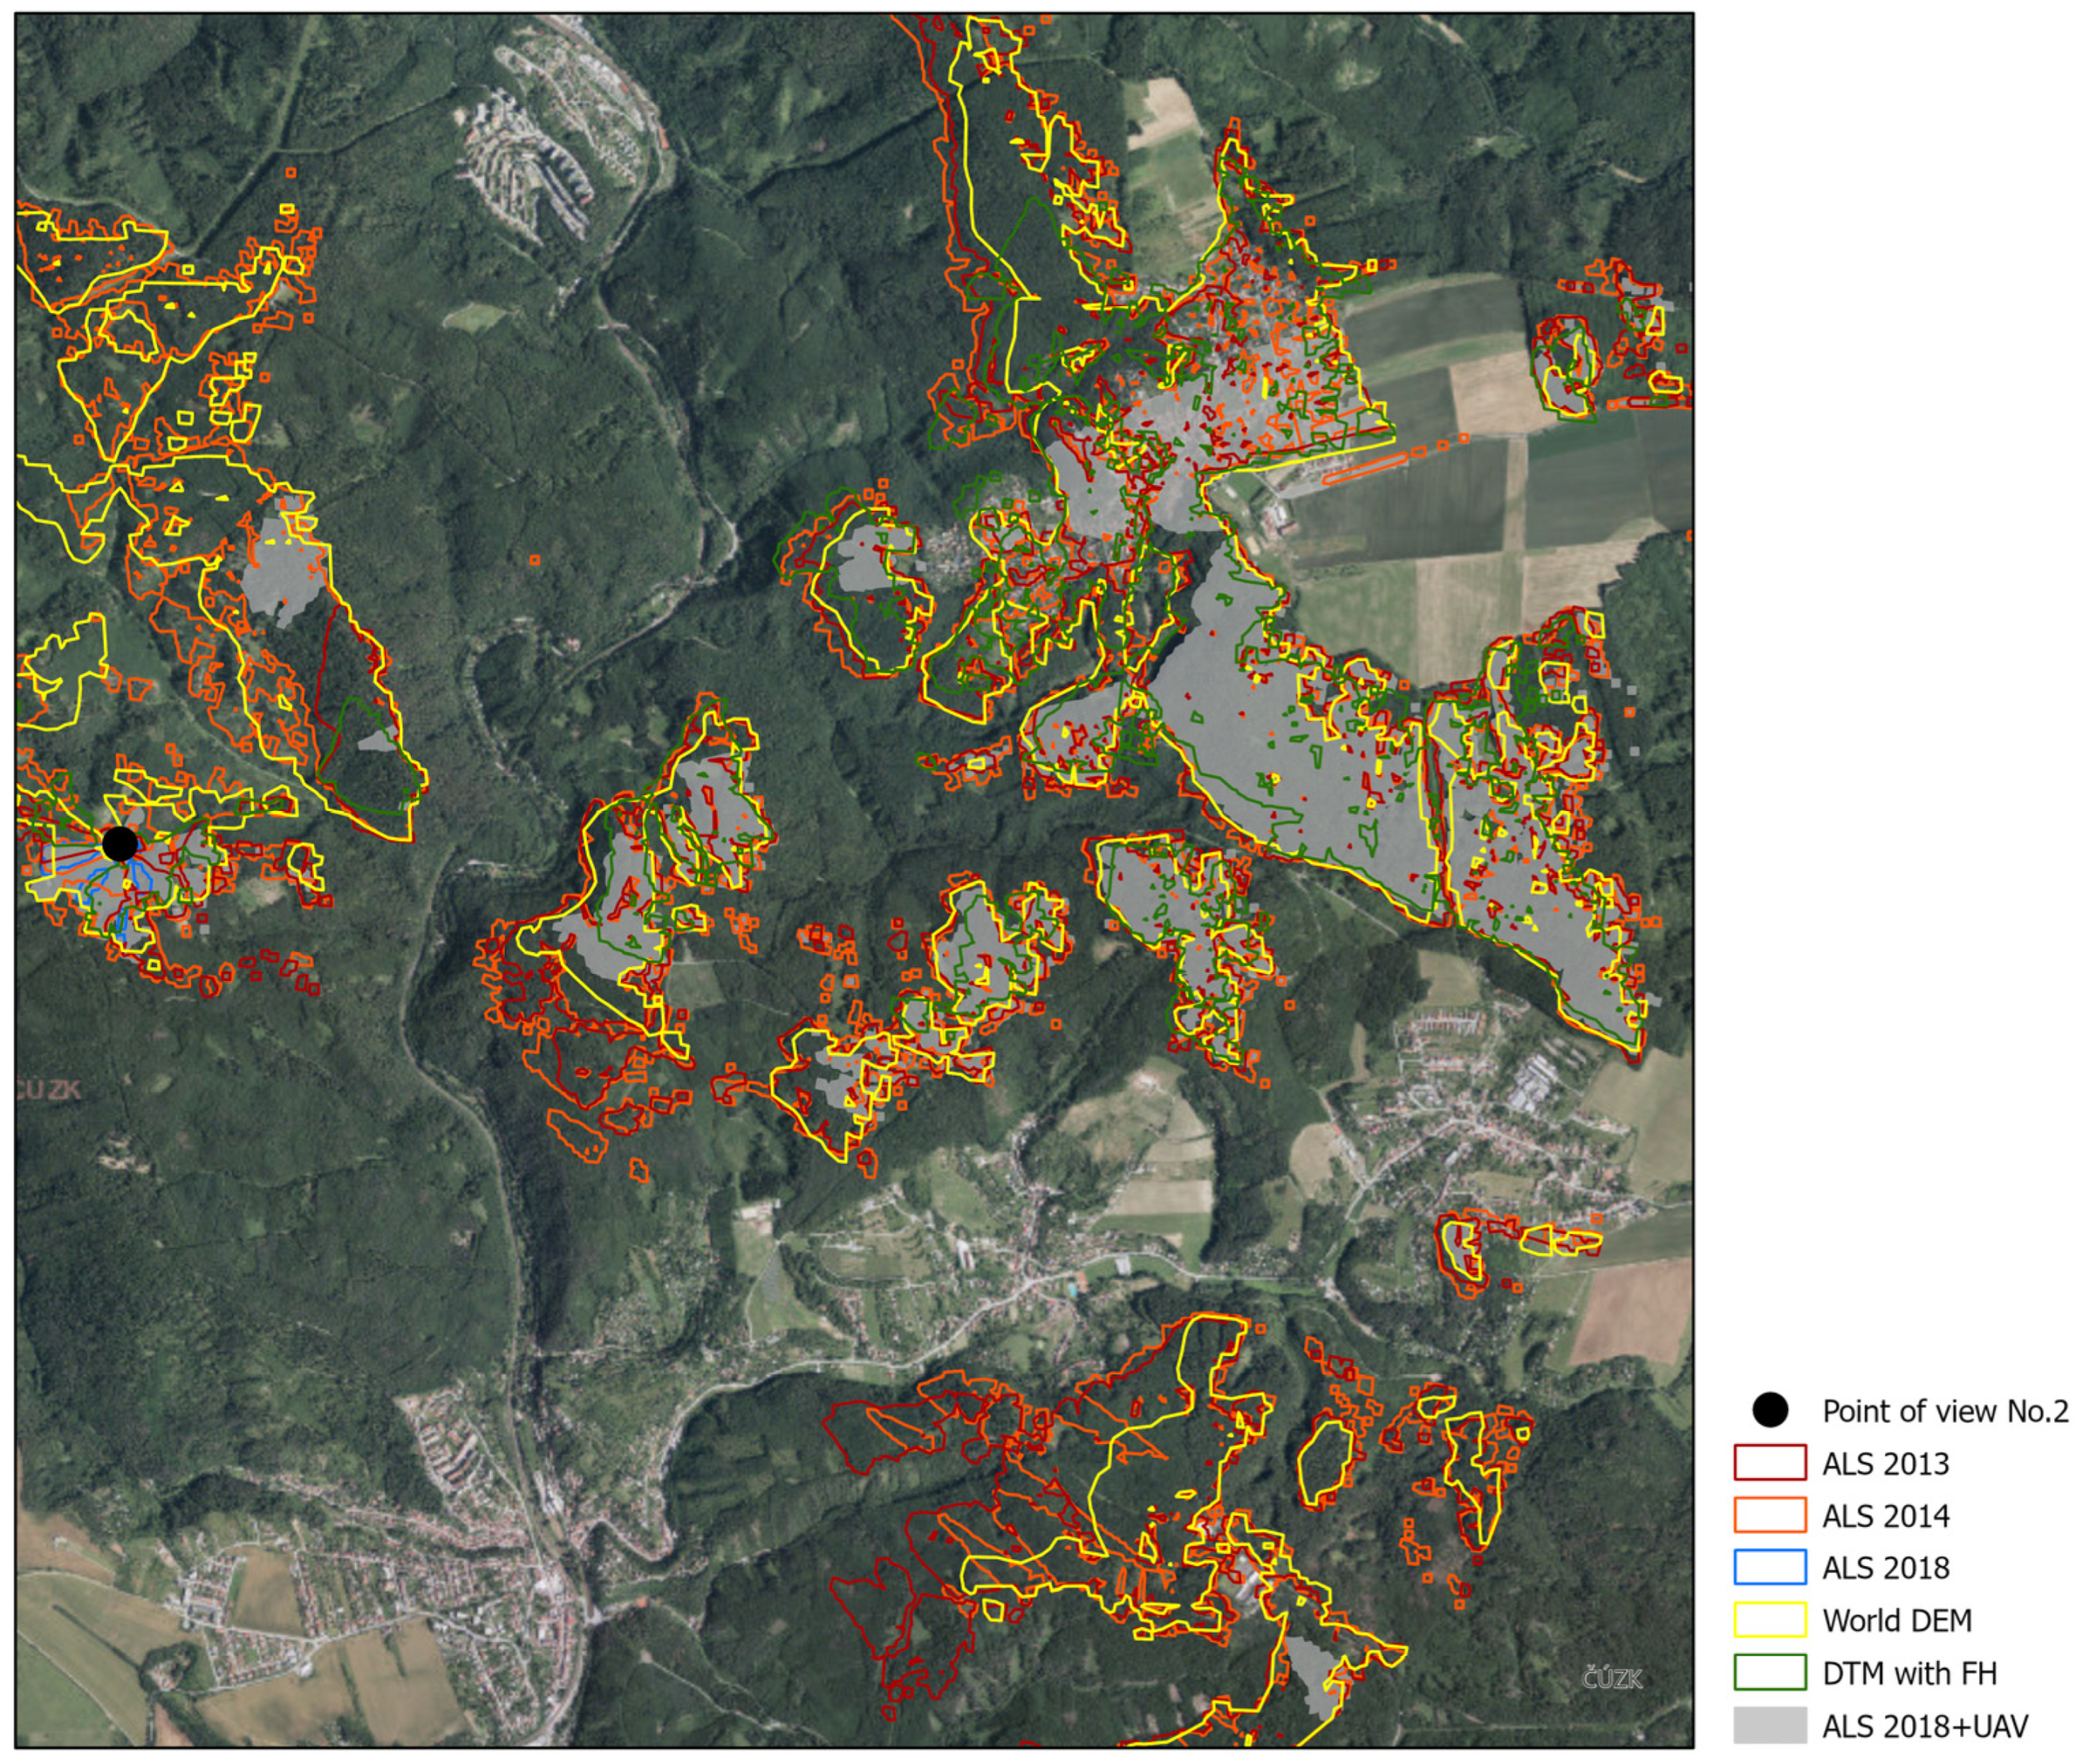
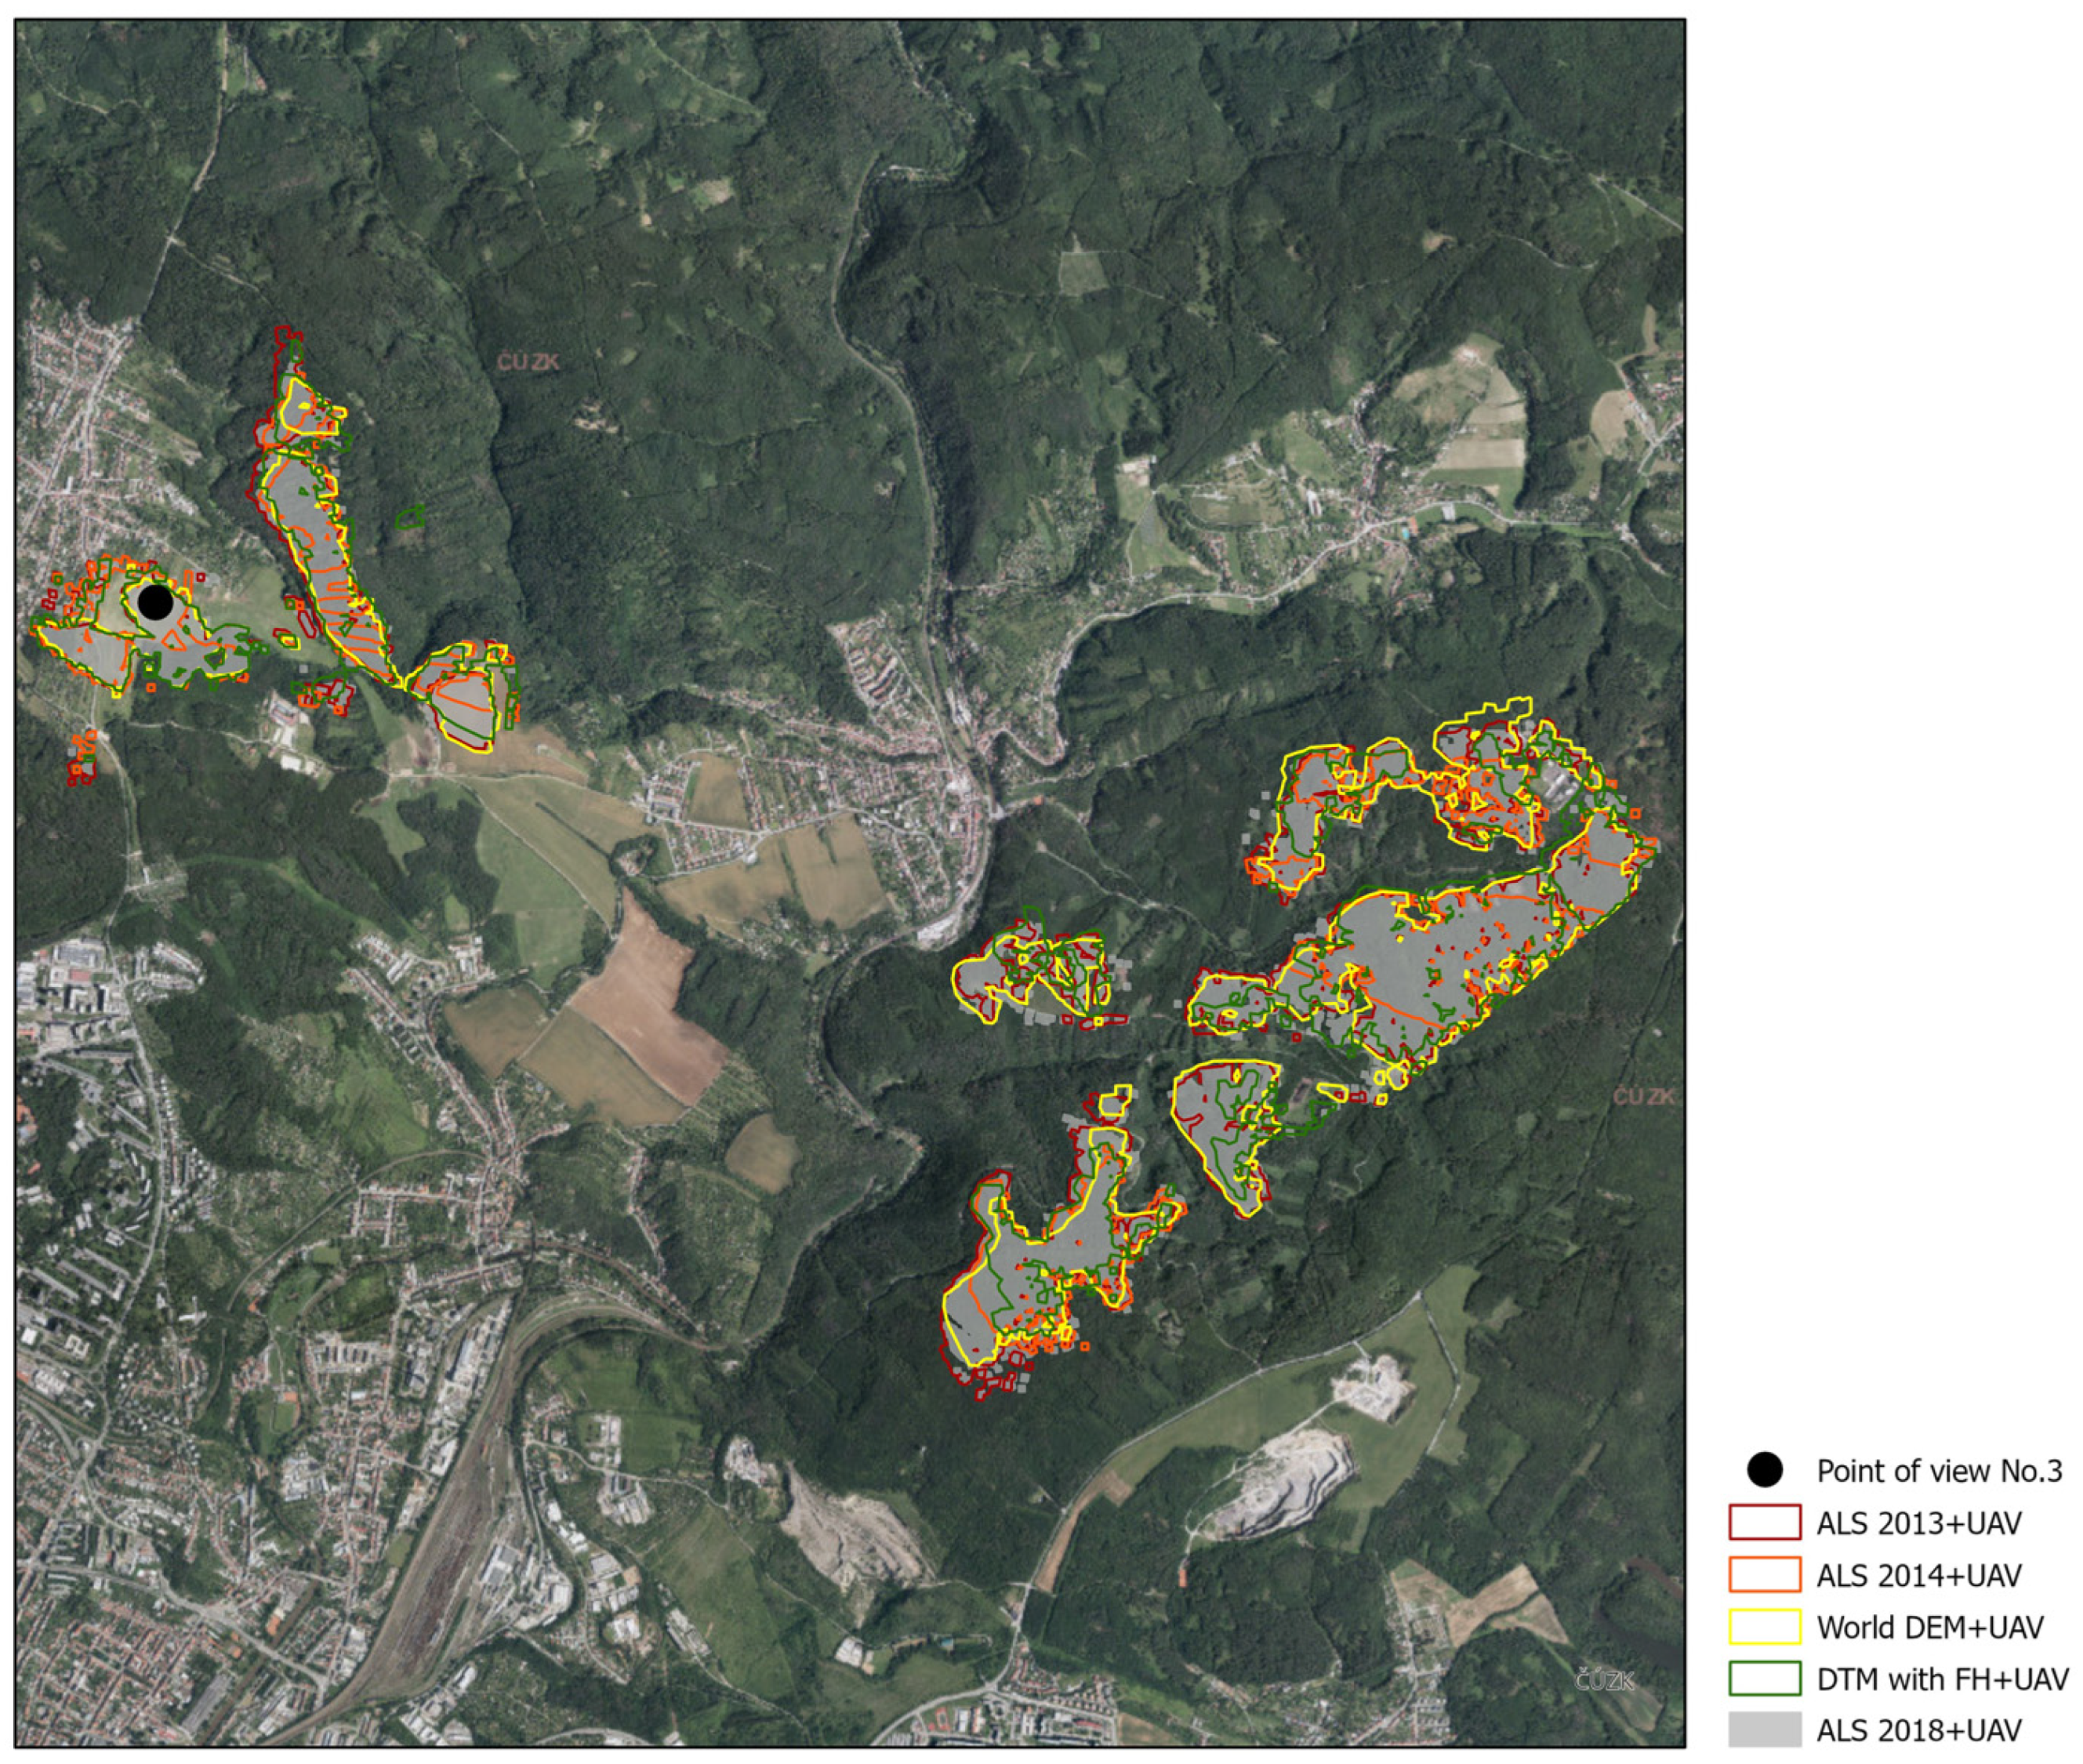
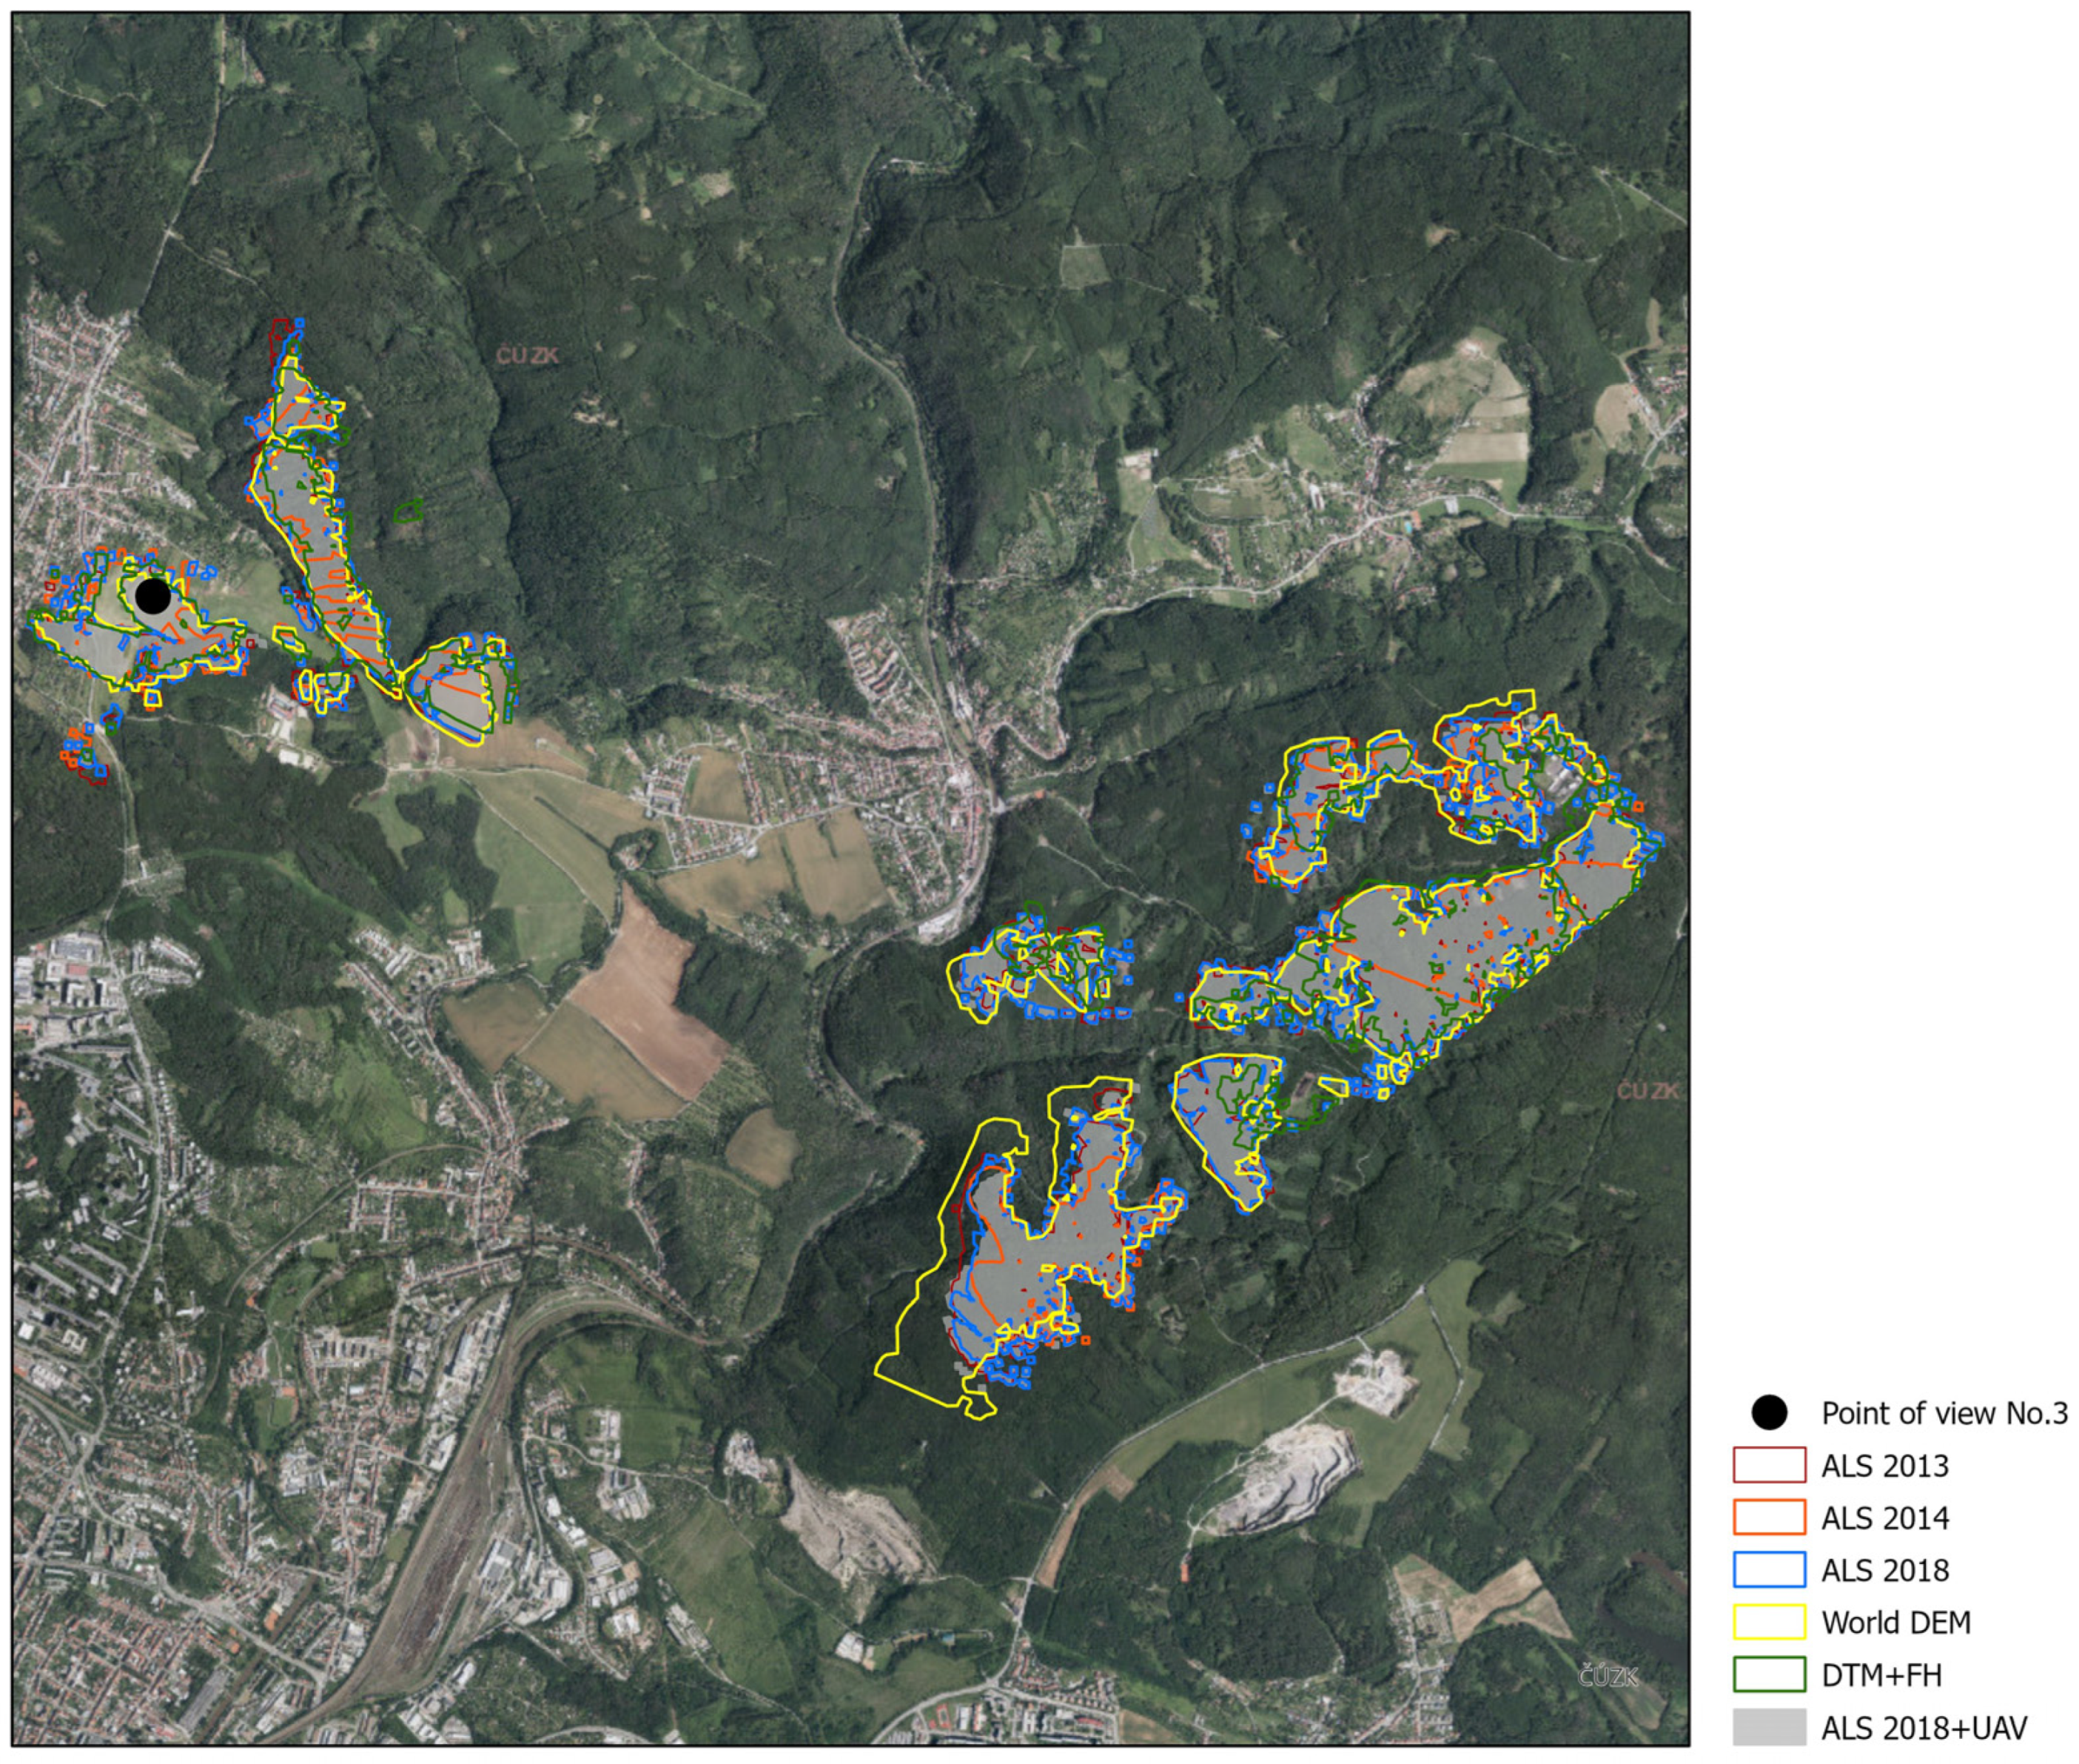
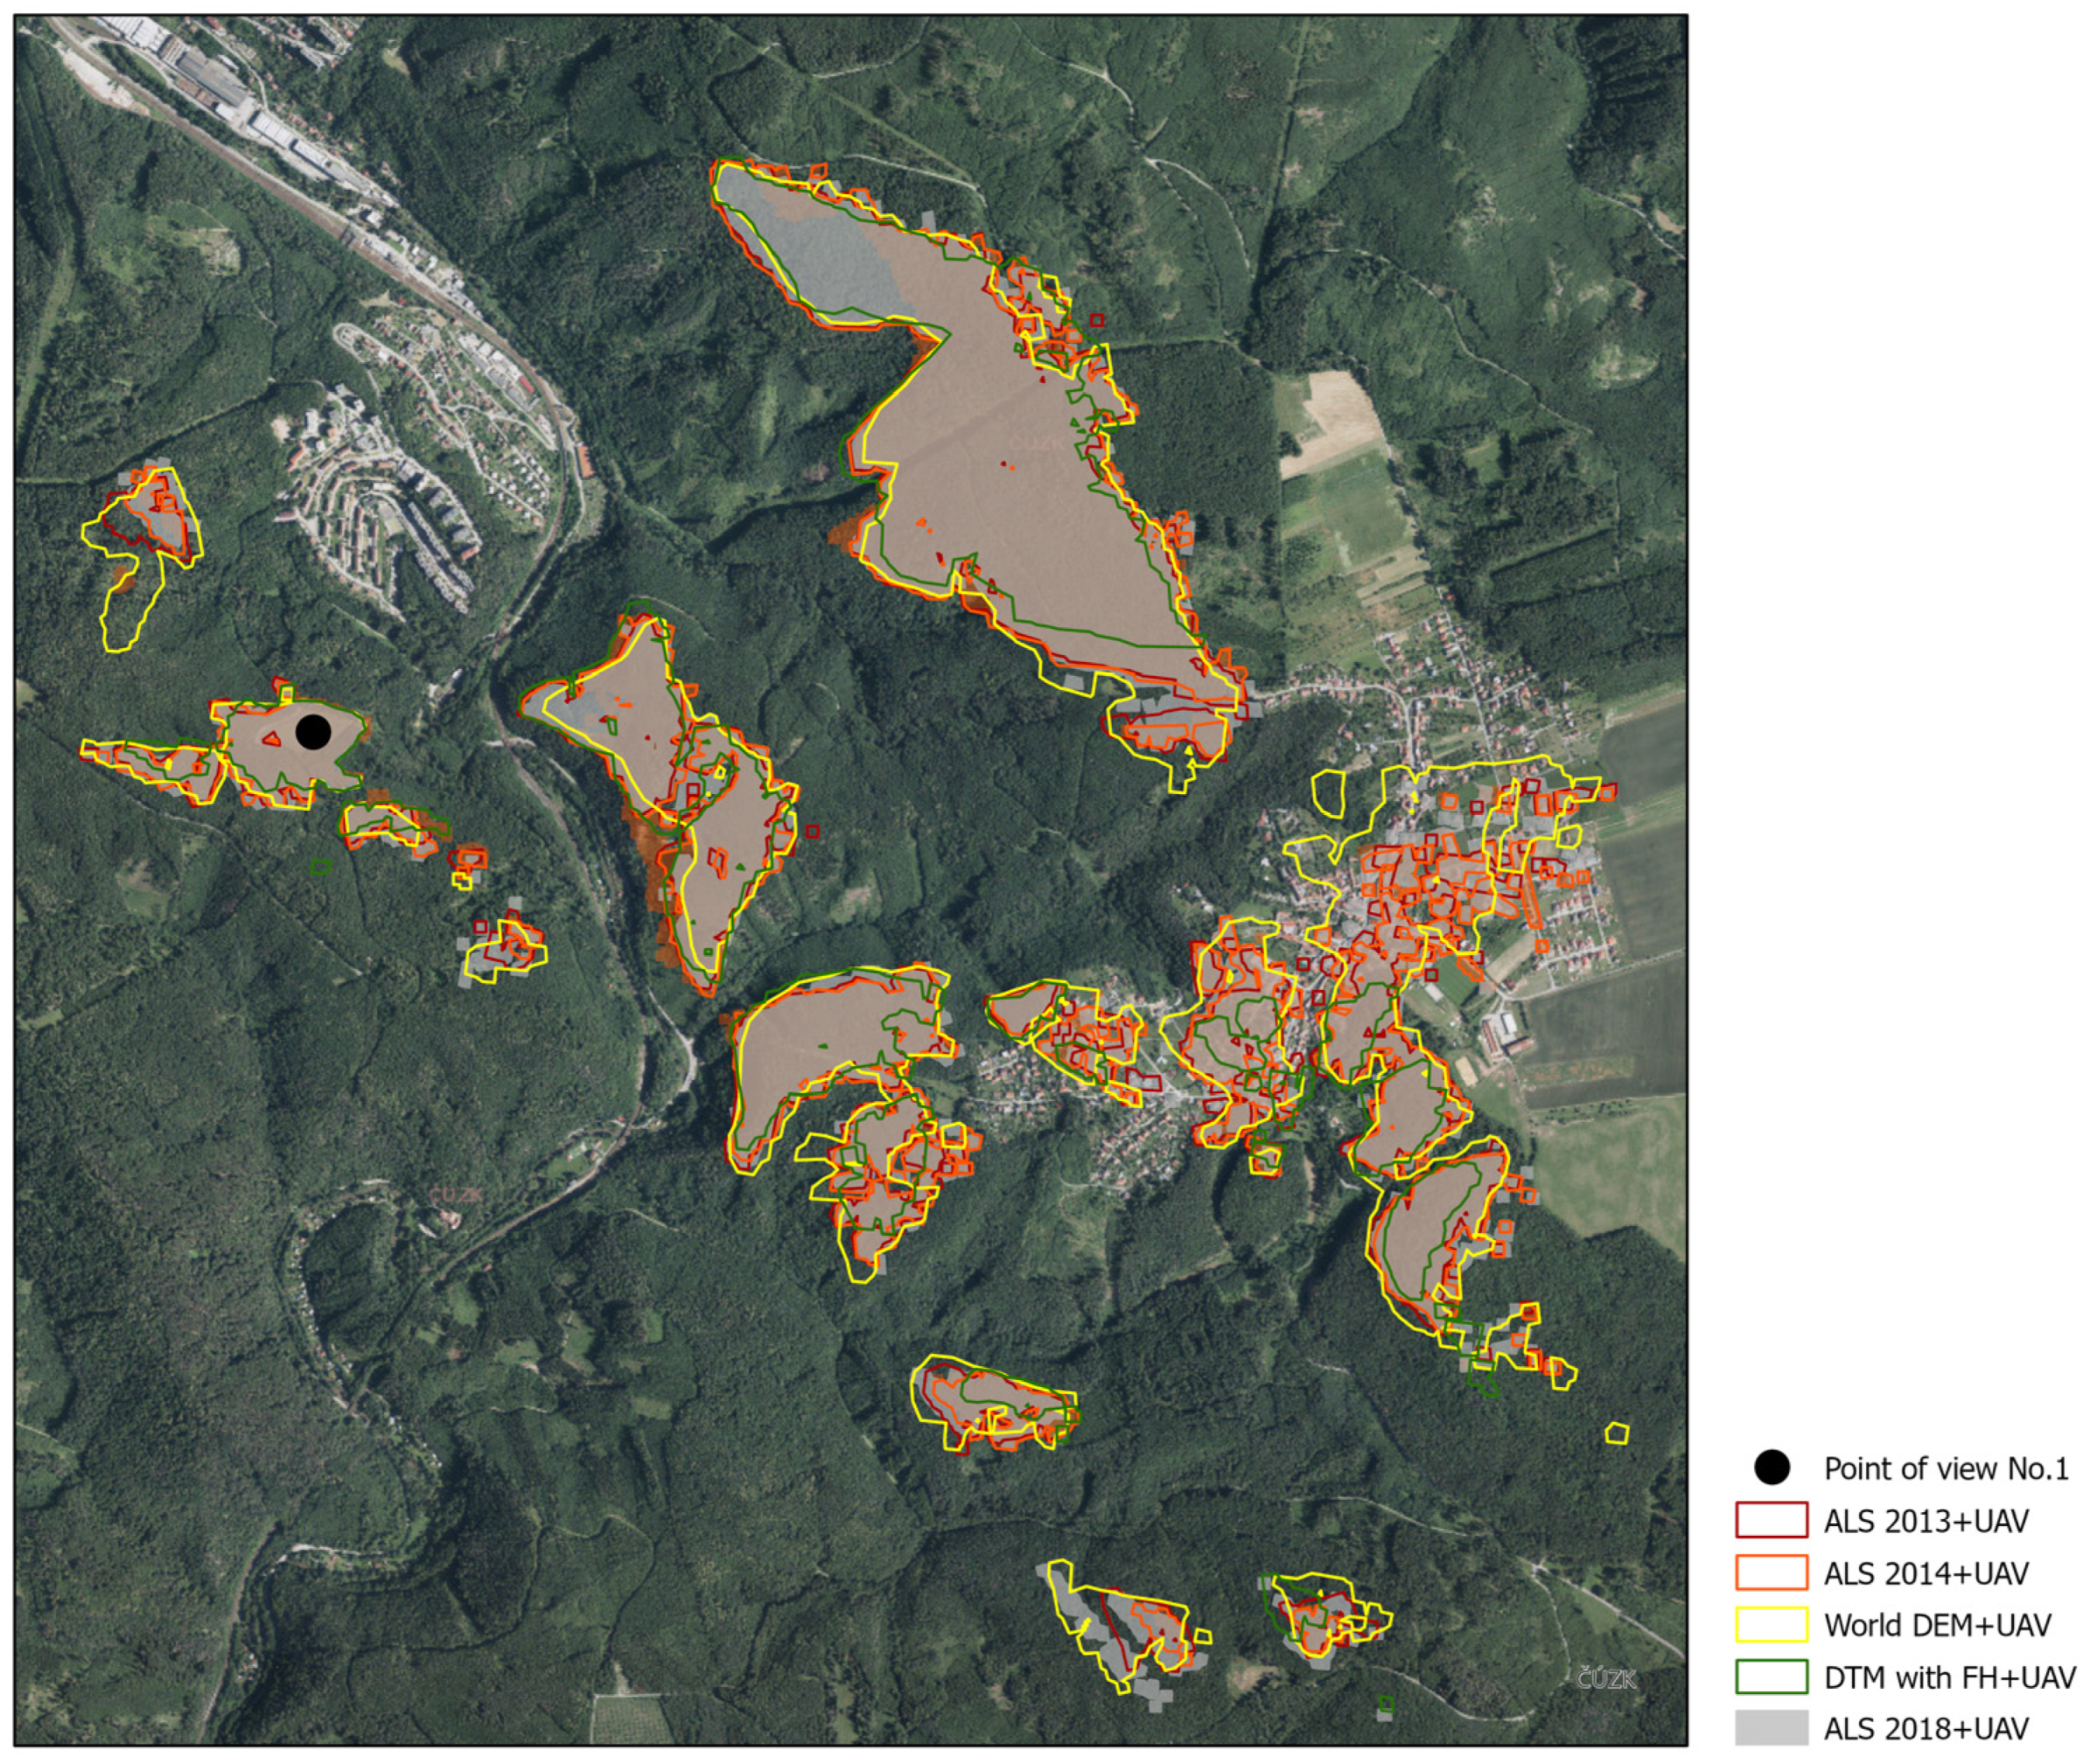
In the second step, the same models were compared, combined with the DSM from the UAV data for fine scale in the vicinity of the viewshed locations. The results show that it is the actuality of the data that has the greatest impact on the overall visibility, as the fusion of the ALS data with the UAV model resulted in a remarkable increase in accuracy in all cases (compare Figure 10 and Figure 11). In all the sites, after three years (2021 vs. 2018) there is a noticeable change in visibility, due to vegetation growth and especially forest management and natural phenomena, such as windfalls. The results of visibility for sites No. 2. and 3. Can be seen in Figure A1, Figure A2, Figure A3 and Figure A4 within the Appendix A.
Again, this accuracy of visibility determination decreases with the age of the data. The most distinctive refinement occurred at site No. 2, where the observation point was located in a forest clearcut that was a close distance to a forest stand that had been recently logged. Therefore, from the ALS data from 2013, 2014, and 2015, the calculated visibility was only minimal, whereas after the logging (recorded using UAV data), the visibility increased dramatically.
Conversely, the lowest refinement was achieved at site No. 3, where the nearest horizon (forest cover) was approximately 100 m away. At this site, there was a distinct spatial difference between the 2014 ALS data and the 2013 and 2018 ALS data. After a detailed examination of the raster data, it was found that the change is attributable to the different filtering of the 2014 ALS data. The change was particularly caused by the electric poles that were encountered on the 2014 raster, while these features were filtered out in the 2013 and 2018 ALS data.
The results confirm both hypotheses, i.e., the effect of the data age on the visibility calculation and the possibility of refining the analysis using UAV data for fine-scale territory. All the visibility maps with higher resolution are in Appendix A.

4. Discussion

The results confirmed that, for a valid and accurate visibility calculation, up-to-date data are essential, because, as the data ages, the validity of the visibility calculation decreases (kappa index in Table 3, Table 4 and Table 5). This obsolescence plays a role, especially in places where the visibility may be affected by growing vegetation and in forest areas where logging may be carried out as part of the forest management operations. The time variation of the visibility in forested areas was also investigated by [73], who examined the degree of visibility change due to reforestation with the help of historical topographic maps. The study of temporal development is particularly important for archaeology [12,13,44,74,75]. Ref. [76] utilized LiDAR data to map the evolution of vegetation in Oslo in 2011, 2014, and 2017, which was similar to [77] in the 20th century. In contrast to these papers, we used the examination of the temporal evolution of visibility mainly for comparing the reliability of the input data and for detecting the differences from the reference model, i.e., the most up-to-date and accurate model that was available.
This study offers options that can be used for visibility analysis in various domains where vegetation should be considered. Relatively accurate data are needed for example in the case of the visibility of commercial billboards [78] and small natural areas [38,79]. In contrast, some disciplines have very limited possibilities to obtain detailed data, whether for financial, computational, temporal, or other reasons. Especially large regional analyses [14,80] and historical analyses [81] where more precise data cannot be obtained. Computational difficulties in visibility analyses can be encountered in locations where visibility is affected by stand-alone trees and the permeability of trees [26]. Therefore, depending on the specification and the desired accuracy of the analysis outputs, different input DSMs might be applied.
The choice of the appropriate spatial resolution of the DSM has an indicative impact on the viewshed outcomes [82]. Ref. [8] compared the quality of input data for visibility analyses, focusing on comparisons by various levels of detail, although not focusing on the time factor of the data. Ref. [82] examined the accuracy of input data for visibility analyses for the process of an environmental impact assessment (EIA), and confirmed that the greater the accuracy of the data, the better the quality of the analysis output. They also recommend the use of DSM instead of DTM for the EIA process. This research operated with data that were collected at different input resolutions (0.15 m–30 m, see Table 1). For the ALS data, a pixel size of 1 m could be considered, which would make the visibility result more accurate, but simultaneously would increase the calculation time significantly [83]. Due to the speed of the calculation, and the possibility of raster comparison, a uniform spatial resolution of 5 m was used.
This 5 m resolution could be used as we were investigating the visibility in a landscape where forest growth played a role, particularly at sites No. 1 and No. 3. Site No. 2 was partly affected by forestry activities at the time of the research. In all the sites we can observe the overall trend of the decrease in visibility, which was probably caused by the growth of vegetation. The malformation of this trend can be seen in site No. 2 in the case of ALS 2018, 2014, and 2013, where different filtering of data was applied (for further details, see the description in Section 2.1). This poses an important issue for the viewshed analysis. An inappropriate omission or inclusion of small-scale features, in this case, electricity pylons, can make it difficult, or even impossible, to compare calculated viewsheds. Users should be aware of this concern and its potential effect on the analysis results.
The effect of vegetation on visibility was also discussed by [84] based on removing trees from the LiDAR DSM for the purpose of mobile visibility querying. Ref. [82] took a similar approach to assessing the influence of vegetation. The interest in incorporating vegetation into visibility analyses has increased several-fold in the last two decades [9]. For further research see [4,24,31,36,43,44,85,86,87]. Given this increased interest, we sought to include publicly available data that was ideally accessible globally, comparing it to input data for visibility analyses. As a representative model, we chose the globally available World DEM [58]. The visibility results of this model showed an obvious overestimation of the visible areas. This data source, therefore, might be used in justified cases and is more suitable for a very coarse analysis of visible areas or for the preselection of suitable areas for viewpoint placement [88] within a reverse visibility analysis [21,89]. Ref. [90] analyzed the accuracy of other freely available sources, which were originally investigated for geomorphometry, but could also potentially be used for visibility analysis. We can state that the results that are acquired by World DEM cannot be considered to be entirely accurate.
One option that might be expected when seeking data sources for visibility analysis is a combination of data for the Earth’s surface and data for objects above that surface. For this purpose, we used DMR 5G data (i.e., DTM), similarly to [13], which are the most up-to-date publicly available national-level data that are provided by the Czech Survey and Cadastral Office [34]. The data were captured 10 years ago, which may indicate the outdatedness of the publicly available data in the Czech Republic. To these terrain data, the forest height [70] data were added. Although these data are relatively recent, the spatial resolution is very low (30 m). Given the forest character of the study landscape, this option might seem appropriate; however, the results of the visibility analysis showed that the compliance with the reference model achieved the lowest accuracy at all the study sites. In contrast to World DEM, the combination of DTM and forest heights causes the visible areas to be significantly underestimated (the maximal kappa coefficient value for this model was only 0.75). This is probably caused by over-generalization of the data (the original GEDI data resolution was 30 m). The vegetation height is determined for the entire pixel at this low resolution, and the resulting DSM has distinct edges that apparently reduce the visible extent (Figure 9). Therefore, the authors do not recommend using a composition of data sources at such low resolution for visibility analyses.
For the same year as the DTM, the ALS 2013 data [33] were also collected. These 10-year-old data probably no longer correspond to reality in many locations, which may indicate a problem with the availability of up-to-date data at the national level in the Czech Republic. The solution to this would therefore seem to be the acquisition of new ALS data; however, for such large areas, this is financially demanding. Another option is to acquire custom ALS data, which also involves some financial investment, but has many advantages [91] and can reflect observable landscape changes.
Landscape changes are more salient to the observer in the near surroundings than at great distances [92]. In other words, the same vertical change will have a higher impact on the visibility at the vicinity of the observer than at further distances. Though there may be exceptions [93], and many visibility factors should be considered [2,3,39,94], the major reason for the decrease in the visibility is often caused by the vertical change of some objects (increase in the foreground or conversely, decrease in the background), thus, potentially changing the visual horizon [39,86,95] and the visible area. The trees may hide more distant landscapes (beyond the so-called local horizon [45]) as they grow. This implies that the change in vegetation affecting the visibility may not be solely caused by human intervention (i.e., deforestation [96] or reforestation [73]).
Therefore, it could be recommended to refine the surroundings of the observation point with data from a drone, as we have tested in this paper. Moreover, as confirmed by [97], the UAV data are more precise than the ALS data, and the use of more detailed data for the fine-scale area is recommended [12,24]. The use of UAVs is common nowadays [12,98,99]; however, restrictions exist on flying in many countries [100]. In Europe, there is a maximum flight height limit of 120 m above the ground, a ban on operating over built-up areas and people, and the need to register the drone, as well as the pilot. However, for the refinement of DSM data beyond populated areas, UAVs are a very valuable tool for data collection, as they are capable of rapid data collection (in the order of tens of minutes). Once they are processed into DSM form, they provide accurate information about object heights.
The use of UAVs is common, especially for fine-scale areas or as complementary to a larger and less accurate model. Ref. [38] used a UAV to scan and subsequently analyze a small area (2.25 ha), including a river, the surrounding vegetation, and fields. With extended visibility tools [45], the authors analyzed not only the viewshed, but also the trees and the other vegetation that comprised the visual horizon. A more recent study [12] utilized UAVs for visibility analysis in order to explore more profound archaeological contexts within the historical locality of Argentina. For the analysis, they used ASTER Global DEM data at 30 m resolution and UAV-derived (multiscale) data that were acquired at 0.2–0.3 m resolution. The models were analyzed separately and, subsequently, the findings from both models were synthesized.
In this study, we employed only DSM data in raster format, which was created by the interpolation of the collected elevation points of the surface. Some authors also use other data formats for visibility analysis, such as directly derived point clouds from LiDAR [31], though it was necessary to increase the perimeter of the points in order to ensure line-of-sight intersection. Some other papers [73,101,102] have used vector data, but with it there is a higher probability of false positive visibility, whereas, for LiDAR data, the probability of false negative visibility is higher [101]. In order to account for the false positivity or negativity factor in the evaluation of viewshed results, similarly to [103], we used the kappa index to compare the viewshed results.
In order to ensure the comparability of the viewshed outputs, we have also attempted to account for possible biases caused by the different spatial and temporal resolutions of the input data. For this reason, we have expanded the resulting pixels of the viewshed (see Figure 8). This aggregation of the viewshed pixels solved the problem of the different primary data detail and the variability of the heights. In the more accurate models, there was partial occlusion of the tree canopy that was not visible in the more generalized models, thereby affecting the total number of visible pixels.
The data in Figure 9 support the theory that UAV data, having a higher spatial resolution and capturing the vicinity of the observation point, improve the accuracy of the visibility analysis outputs, even when refining the low-resolution World DEM data. Based on this study, more generalized data should be sufficient for the more distant visible landscape. However, the outputs of visibility analyses are always slightly affected by data obsolescence. Furthermore, when the data are not acquired over the same time period, they can potentially be altered by spatial or vertical changes in the landscape.

5. Conclusions

Visibility analyses provide information about the visible and the invisible parts of the landscape that are relevant to a wide range of disciplines. Each domain requires a different level of detail and timeliness of input data, both of which affect the reliability of the resulting visibility output. This article has offered a comparison of some possible input data sources, specifically in (partially) forested areas where the visibility is affected by the presence and the development of vegetation.
This study confirms both of the following hypotheses: (i) the age of the data that are collected using different sources affects the visibility analysis, and (ii) updating the data in the near vicinity will increase the visibility accuracy, even when using globally available data.
This paper showed that data that are refined near the observer by the addition of UAV data will increase the accuracy of the visibility analysis output. The refinement applies even to low-resolution models (30 m resolution, World DEM) that can be freely accessed at a global level. Although its accuracy is still relatively low compared to ALS data. The combination of DTM and FH is not recommended because the model that is generated is not precise. Based on the finding that the data refinement by UAVs will improve the results of the visibility analysis, the authors recommend the use of freely available data for areas that are further than several kilometers away from the observer, supplemented by UAV data in the area nearby the observer.
The results have also revealed that the aging of the input data substantially affects the analysis output. The landscape changes that have occurred may be neglected in the case of obsolete data. In the case of our study area, these could be forest management interventions or simply vegetation growth that reduces the visible area. A change at the vicinity of the observer might have a greater impact on the local visual horizon than the same change at a greater distance from the observer, as several studies [39,86,95] have shown. Therefore, we suggest that the method of UAV data addition might substantially refine the resulting visibility, even on relatively outdated spatial data.
In order to evaluate the current state of visibility in a forested area, it is necessary to possess data that are not older than several years, depending on the study requirements. The global public data (World DEM) are outdated (up to 10 years), as are the public national ALS data. Hence, ALS data are not easily accessible in the Czech Republic, although each country has different national data and utilization options. The results of this research may be useful when considering the source and the parameters of input data for visibility analysis.

Author Contributions

T.M. initiated this study, the methodology, and the discussion, carried out and reviewed the statistical analysis, and drafted the manuscript. L.J. prepared the abstract, introduction, discussion, and conclusion, and contributed to the methodology. J.C. and E.A. revised the text and the manuscript. All authors have read and agreed to the published version of the manuscript.

Funding

This research was funded by the Internal Grant Agency of the Faculty of Forestry and Wood Technology, Mendel University, in Brno, Czech Republic, grant number IGA-LDF-22-IP-030 “Mapping abrasion manifestations using unmanned aerial vehicles and laser scanning.”

Data Availability Statement

Data contained within the article are available on request from the corresponding author.

Conflicts of Interest

The authors declare no conflict of interest.

Appendix A

Figure A1. Visibility for site No. 2—with fusion with UAV data.
Remotesensing 15 01028 g0a1
Figure A2. Visibility for site No. 2—without fusion with UAV data.
Remotesensing 15 01028 g0a2
Figure A3. Visibility for site No. 3—with fusion with UAV data.
Remotesensing 15 01028 g0a3
Figure A4. Visibility for site No. 3—without fusion with UAV data.
Remotesensing 15 01028 g0a4

References

  1. Hyslop, N.P. Impaired visibility: The air pollution people see. Atmos. Environ. 2009, 43, 182–195. [Google Scholar] [CrossRef]
  2. Schwartz, M.; Vinnikov, M.; Federici, J. Adding Visibility to Visibility Graphs: Weighting Visibility Analysis with Attenuation Coefficients. arXiv 2021, arXiv:2108.04231. [Google Scholar]
  3. Malm, W.C. Visibility metrics. In Visibility: The Seeing of Near and Distant Landscape Features; Elsevier: Amsterdam, The Netherlands, 2016; pp. 93–115. [Google Scholar] [CrossRef]
  4. Campbell, M.J.; Dennison, P.E.; Hudak, A.T.; Parham, L.M.; Butler, B.W. Quantifying understory vegetation density using small-footprint airborne LiDAR. Remote Sens. Environ. 2018, 215, 330–342. [Google Scholar] [CrossRef]
  5. Fisher, P.F. An exploration of probable viewsheds in landscape planning. Environ. Plan. B Plan. Des. 1995, 22, 527–546. [Google Scholar] [CrossRef]
  6. Wu, Z.; Wang, Y.; Gan, W.; Zou, Y.; Dong, W.; Zhou, S.; Wang, M. A Survey of the Landscape Visibility Analysis Tools and Technical Improvements. Int. J. Environ. Res. Public. Health 2023, 20, 1788. [Google Scholar] [CrossRef]
  7. Achilleos, G.; Tsouchlaraki, A. Visibility and Viewshed Algorithms in an Information System for Environmental Management. In Management Information Systems; McGraw-Hill: New York, NY, USA, 2004; pp. 109–121. [Google Scholar]
  8. Lagner, O.; Klouček, T.; Šímová, P. Impact of input data (in)accuracy on overestimation of visible area in digital viewshed models. PeerJ 2018, 6, e4835. [Google Scholar] [CrossRef]
  9. Inglis, N.C.; Vukomanovic, J.; Costanza, J.; Singh, K.K. From viewsheds to viewscapes: Trends in landscape visibility and visual quality research. Landsc. Urban Plan. 2022, 224, 104424. [Google Scholar] [CrossRef]
  10. VanHorn, J.E.; Mosurinjohn, N.A. Urban 3D GIS Modeling of Terrorism Sniper Hazards. Soc. Sci. Comput. Rev. 2010, 28, 482–496. [Google Scholar] [CrossRef]
  11. Mlynek, P.; Misurec, J.; Fujdiak, R.; Kolka, Z.; Pospichal, L. Heterogeneous Networks for Smart Metering—Power Line and Radio Communication. Elektron. Elektrotech. 2015, 21, 85–92. [Google Scholar] [CrossRef]
  12. Orsini, C.; Benozzi, E.; Williams, V.; Rossi, P.; Mancini, F. UAV Photogrammetry and GIS Interpretations of Extended Archaeological Contexts: The Case of Tacuil in the Calchaquí Area (Argentina). Drones 2022, 6, 31. [Google Scholar] [CrossRef]
  13. Kuna, M.; Novák, D.; Rášová, A.B.; Bucha, B.; Machová, B.; Havlice, J.; John, J.; Chvojka, O. Computing and testing extensive total viewsheds: A case of prehistoric burial mounds in Bohemia. J. Archaeol. Sci. J. Archaeol. Sci. 2022, 142, 105596. [Google Scholar] [CrossRef]
  14. Fadafan, F.K.; Soffianian, A.; Pourmanafi, S.; Morgan, M. Assessing ecotourism in a mountainous landscape using GIS—MCDA approaches. Appl. Geogr. 2022, 147, 102743. [Google Scholar] [CrossRef]
  15. Demir, S. Determining suitable ecotourism areas in protected watershed area through visibility analysis. J. Environ. Prot. Ecol. 2019, 20, 214–223. [Google Scholar]
  16. BParsons, M.; Coops, N.C.; Stenhouse, G.B.; Burton, A.C.; Nelson, T.A. Building a perceptual zone of influence for wildlife: Delineating the effects of roads on grizzly bear movement. Eur. J. Wildl. Res. 2020, 66, 53. [Google Scholar] [CrossRef]
  17. Chamberlain, B.C.; Meitner, M.J.; Ballinger, R. Applications of visual magnitude in forest planning: A case study. For. Chron. 2015, 91, 417–425. [Google Scholar] [CrossRef]
  18. Sivrikaya, F.; Sağlam, B.; Akay, A.; Bozali, N. Evaluation of Forest Fire Risk with GIS. Pol. J. Environ. Stud. 2014, 23, 187–194. [Google Scholar]
  19. Lee, J. Zoning scenic areas of heritage sites using visibility analysis: The case of Zhengding, China. J. Asian Archit. Build. Eng. 2023, 22, 1–13. [Google Scholar] [CrossRef]
  20. Zorzano-Alba, E.; Fernandez-Jimenez, L.A.; Garcia-Garrido, E.; Lara-Santillan, P.M.; Falces, A.; Zorzano-Santamaria, P.J.; Capellan-Villacian, C.; Mendoza-Villena, M. Visibility Assessment of New Photovoltaic Power Plants in Areas with Special Landscape Value. Appl. Sci. Switz. 2022, 12, 703. [Google Scholar] [CrossRef]
  21. Ioannidis, R.; Mamassis, N.; Efstratiadis, A.; Koutsoyiannis, D. Reversing visibility analysis: Towards an accelerated a priori assessment of landscape impacts of renewable energy projects. Renew. Sustain. Energy Rev. 2022, 161, 112389. [Google Scholar] [CrossRef]
  22. Amiri, T.; Shafiei, A.B.; Erfanian, M.; Hosseinzadeh, O.; Heidarlou, H.B. Using forest fire experts’ opinions and GIS/remote sensing techniques in locating forest fire lookout towers. Appl. Geomat. 2022. [Google Scholar] [CrossRef]
  23. Tabrizian, P.; Baran, P.; Van Berkel, D.; Mitasova, H.; Meentemeyer, R. Modeling restorative potential of urban environments by coupling viewscape analysis of LiDAR data with experiments in immersive virtual environments. Landsc. Urban Plan. 2020, 195, 103704. [Google Scholar] [CrossRef]
  24. Murgoitio, J.J.; Shrestha, R.; Glenn, N.; Spaete, L.P. Improved visibility calculations with tree trunk obstruction modeling from aerial LiDAR. Int. J. Geogr. Inf. Sci. 2013, 27, 1865–1883. [Google Scholar] [CrossRef]
  25. Zong, X.; Wang, T.; Skidmore, A.; Heurich, M. Estimating fine-scale visibility in a temperate forest landscape using airborne laser scanning. Int. J. Appl. Earth Obs. Geoinf. 2021, 103, 102478. [Google Scholar] [CrossRef]
  26. Ruzickova, K.; Ruzicka, J.; Bitta, J. A new GIS-compatible methodology for visibility analysis in digital surface models of earth sites. Geosci. Front. 2021, 12, 101109. [Google Scholar] [CrossRef]
  27. Pedrinis, F.; Samuel, J.; Appert, M.; Jacquinod, F.; Gesquière, G. Exploring Landscape Composition Using 2D and 3D Open Urban Vectorial Data. ISPRS Int. J. Geo-Inf. 2022, 11, 479. [Google Scholar] [CrossRef]
  28. Fisher-Gewirtzman, D.; Shashkov, A.; Doytsher, Y. Voxel based volumetric visibility analysis of urban environments. Surv. Rev. 2013, 45, 451–461. [Google Scholar] [CrossRef]
  29. Fisher-Gewirtzman, D.; Natapov, A. Different approaches of visibility analyses applied on hilly urban environment. Surv. Rev. 2014, 46, 366–382. [Google Scholar] [CrossRef]
  30. Cervilla, A.R.; Tabik, S.; Vías, J.; Mérida, M.; Romero, L.F. Total 3D-viewshed Map: Quantifying the Visible Volume in Digital Elevation Models. Trans. GIS 2017, 21, 591–607. [Google Scholar] [CrossRef]
  31. Zhang, G.-T.; Verbree, E.; Oosterom, P.V. A Study of Visibility Analysis Taking into Account Vegetation: An Approach Based on 3 D Airborne Point Clouds. 2017. Available online: https://www.semanticscholar.org/paper/A-Study-of-Visibility-Analysis-Taking-into-Account-Zhang-Verbree/d25cdf214d4289a9bc88178291bf5b579376bad5 (accessed on 18 October 2022).
  32. Shan, J.; Toth, C.K. (Eds.) Topographic Laser Ranging and Scanning, 2nd ed.; CRC Press: Boca Raton, FL, USA, 2017. [Google Scholar] [CrossRef]
  33. Czech Office for Surveying, Mapping and Cadastre. ZABAGED®—Altimetry—DMP 1G.Digital Surface Model of the Czech Republic of the 1st Generation (DMP 1G). 1 January 2013. Available online: https://geoportal.cuzk.cz/(S(fcavlupr3vyjkldocxkjhp5j))/Default.aspx?mode=TextMeta&metadataID=CZ-CUZK-DMP1G-V&metadataXSL=Full&side=vyskopis (accessed on 13 December 2022).
  34. Czech Office for Surveying, Mapping and Cadastre. ZABAGED®—Altimetry—DMR 5G. Digital Terrain Model of the Czech Republic of the 5th Generation (DMR 5G). Czech Office for Surveying, Mapping and Cadastre, 1 September 2020. Available online: https://geoportal.cuzk.cz/(S(fcavlupr3vyjkldocxkjhp5j))/Default.aspx?mode=TextMeta&metadataXSL=full&side=vyskopis&metadataID=CZ-CUZK-DMR5G-V (accessed on 13 December 2022).
  35. Pyka, K.; Piskorski, R.; Jasińska, A. LiDAR-based method for analysing landmark visibility to pedestrians in cities: Case study in Kraków, Poland. Int. J. Geogr. Inf. Sci. 2022, 36, 476–495. [Google Scholar] [CrossRef]
  36. Murgoitio, J.; Shrestha, R.; Glenn, N.; Spaete, L. Airborne LiDAR and Terrestrial Laser Scanning Derived Vegetation Obstruction Factors for Visibility Models. Trans. GIS 2014, 18, 147–160. [Google Scholar] [CrossRef]
  37. Bhagat, V.; Kada, A.; Kumar, S. Analysis of Remote Sensing based Vegetation Indices (VIs) for Unmanned Aerial System (UAS): A Review. Remote Sens. Land 2019, 3, 58–73. [Google Scholar] [CrossRef]
  38. Caha, J.; Kačmařík, M. Utilization of large scale surface models for detailed visibility analyses. ISPRS-Int. Arch. Photogramm. Remote Sens. Spat. Inf. Sci. 2017, XLII-2/W8, 53–58. [Google Scholar] [CrossRef]
  39. Felleman, J.P. Landscape Visibility Mapping: Theory and Practice; School of Landscape Architecture, State University of New York, College of Environmental Science and Forestry: New York, NY, USA, 1979. [Google Scholar]
  40. Domingo-Santos, J.M.; de-Villarán, R.F. Visibility Analysis. In International Encyclopedia of Geography: People, the Earth, Environment and Technology; Richardson, D., Castree, N., Goodchild, M.F., Kobayashi, A., Liu, W., Marston, R.A., Eds.; John Wiley & Sons, Ltd.: Oxford, UK, 2017; pp. 1–14. [Google Scholar] [CrossRef]
  41. Fantini, S.; Fois, M.; Secci, R.; Casula, P.; Fenu, G.; Bacchetta, G. Incorporating the visibility analysis of fire lookouts for old-growth wood fire risk reduction in the Mediterranean island of Sardinia. Geocarto Int. 2022, 1–11. [Google Scholar] [CrossRef]
  42. Kozumplikova, A.; Schneider, J.; Mikita, T.; Celer, S.; Kupec, P.; Vyskot, I. Usage possibility of GIS (Geographic Information System) for ecological damages evaluation on example of wind calamity in National Park High Tatras (TANAP), November 2004. Folia Oecol. 2007, 34, 125–145. [Google Scholar]
  43. Rášová, A. Vegetation modelling in 2.5D visibility analysis. Cartogr. Lett. 2018, 26, 10–20. [Google Scholar]
  44. Doneus, M.; Banaszek, Ł.; Verhoeven, G.J. The Impact of Vegetation on the Visibility of Archaeological Features in Airborne Laser Scanning Datasets from Different Acquisition Dates. Remote Sens. 2022, 14, 858. [Google Scholar] [CrossRef]
  45. Caha, J.; Rášová, A. Line-of-Sight Derived Indices: Viewing Angle Difference to a Local Horizon and the Difference of Viewing Angle and the Slope of Line of Sight. In Surface Models for Geosciences; Springer: Cham, Switzerland, 2015; pp. 61–72. [Google Scholar] [CrossRef]
  46. ESRI. ArcGIS Pro; Environmental Systems Research Institute Inc. (ESRI): Redlands, CA, USA, 2022. [Google Scholar]
  47. Elaksher, A.; Ali, T.; Alharthy, A. A Quantitative Assessment of LIDAR Data Accuracy. Remote Sens. 2023, 15, 442. [Google Scholar] [CrossRef]
  48. Maas, H. Least-Squares Matching with Airborne Laserscanning Data in a TIN Structure. IAPRS 2000, XXXIII, 548–555. Available online: https://www.semanticscholar.org/paper/Least-Squares-Matching-with-Airborne-Laserscanning-Maas/ea580fa9bf723c359fb32e50d8ea44a4e473cdc8 (accessed on 3 February 2023).
  49. Mostafa, M.; Hutton, J.; Reid, B.; Hill, R. GPS/IMU Products—The Applanix Approach. December 2003. [Google Scholar]
  50. Vosselman, G.; Maas, H.-G. Adjustment and filtering of raw laser altimetry data. In Proceedings of the OEEPE Workshop on Airborne Laserscanning and Interferometric SAR for Detailed Digital Terrain Models, Stockholm, Sweden, 1–3 March 2001. [Google Scholar]
  51. Burman, H. Laser Strip Adjustment for Data Calibration and Verification. IAPRS 2002, 34, 67. [Google Scholar]
  52. Crombaghs, M.; Brgelmann, R.; de Min, E. On the adjustment of overlapping strips of laser altimeter height data. IAPRS 2000, 33, 230–237. [Google Scholar]
  53. Huising, E.J.; Pereira, L.M.G. Errors and accuracy estimates of laser data acquired by various laser scanning systems for topographic applications. ISPRS J. Photogramm. Remote Sens. 1998, 53, 245–261. [Google Scholar] [CrossRef]
  54. Maas, H.-G. Methods for Measuring Height and Planimetry Discrepancies in Airborne Laserscanner Data. Photogramm. Eng. Remote Sens. 2002, 68, 933–940. [Google Scholar]
  55. Maas, H.-G. Planimetric and height accuracy of airborne laserscanner data: User requirements and system performance. In Proceedings of the 49th Photogrammetric Week, Stuttgart, Germany, 15 September 2003. [Google Scholar]
  56. Sabatini, R.; Richardson, M.; Gardi, A.; Ramasamy, S. Airborne laser sensors and integrated systems. Prog. Aerosp. Sci. 2015, 79, 15–63. [Google Scholar] [CrossRef]
  57. DLR Document: TD-GS-PS-0021; DEM Products Specification Document, Version 3.1; 2016.
  58. Airbus. ArcGIS Terrain Data: AirBus WorldDEM4Ortho data.Earth Observation Center, Airbus n.d. 2016. Available online: https://api.oneatlas.airbus.com/documents/2018-07_WorldDEM4Ortho_TechnicalSpec_Version1.4_I1.0.pdf (accessed on 5 October 2022).
  59. Becek, K.; Koppe, W.; Kutoğlu, Ş.H. Evaluation of Vertical Accuracy of the WorldDEMTM Using the Runway Method. Remote Sens. 2016, 8, 934. [Google Scholar] [CrossRef]
  60. Koppe, W.; Henrichs, L.; Hummel, P. Assessment of WorldDEMTM global elevation model using different references. In Proceedings of the 2015 IEEE International Geoscience and Remote Sensing Symposium (IGARSS), Milan, Italy, 26–31 July 2015; pp. 5296–5299. [Google Scholar] [CrossRef]
  61. Potapov, P.; Li, X.; Hernandez-Serna, A.; Tyukavina, A.; Hansen, M.C.; Kommareddy, A.; Pickens, A.; Turubanova, S.; Tang, H.; Silva, C.E.; et al. Mapping global forest canopy height through integration of GEDI and Landsat data. Remote Sens. Environ. 2021, 253, 112165. [Google Scholar] [CrossRef]
  62. Dorado-Roda, I.; Pascual, A.; Godinho, S.; Silva, C.; Botequim, B.; Rodríguez-Gonzálvez, P.; González-Ferreiro, E.; Guerra-Hernández, J. Assessing the Accuracy of GEDI Data for Canopy Height and Aboveground Biomass Estimates in Mediterranean Forests. Remote Sens. 2021, 13, 2279. [Google Scholar] [CrossRef]
  63. Fayad, I.; Baghdadi, N.; Alvares, C.A.; Stape, J.L.; Bailly, J.S.; Scolforo, H.F.; Zribi, M.; Le Maire, G. Estimating Canopy Height and Wood Volume of Eucalyptus Plantations in Brazil Using GEDI LiDAR Data. In Proceedings of the 2021 IEEE International Geoscience and Remote Sensing Symposium IGARSS, Brussels, Belgium, 11–16 July 2021; pp. 5941–5944. [Google Scholar] [CrossRef]
  64. Hancock, S.; Armston, J.; Hofton, M.; Sun, X.; Tang, H.; Duncanson, L.I.; Kellner, J.R.; Dubayah, R. The GEDI Simulator: A Large-Footprint Waveform Lidar Simulator for Calibration and Validation of Spaceborne Missions. Earth Space Sci. 2019, 6, 294–310. [Google Scholar] [CrossRef]
  65. Lang, N.; Kalischek, N.; Armston, J.; Dubayah, R.; Wegner, J. Global canopy height estimation with GEDI LIDAR waveforms and Bayesian deep learning. arXiv 2021, arXiv:2103.03975. [Google Scholar]
  66. Silva, C.A.; Saatchi, S.; Garcia, M.; Labriere, N.; Klauberg, C.; Ferraz, A.; Meyer, V.; Jeffery, K.J.; Abernethy, K.; White, L.; et al. Comparison of Small- and Large-Footprint Lidar Characterization of Tropical Forest Aboveground Structure and Biomass: A Case Study From Central Gabon. IEEE J. Sel. Top. Appl. Earth Obs. Remote Sens. 2018, 11, 3512–3526. [Google Scholar] [CrossRef]
  67. Adam, M.; Urbazaev, M.; Dubois, C.; Schmullius, C. Accuracy Assessment of GEDI Terrain Elevation and Canopy Height Estimates in European Temperate Forests: Influence of Environmental and Acquisition Parameters. Remote Sens. 2020, 12, 3948. [Google Scholar] [CrossRef]
  68. Agisoft Metashape Professional Software; Agisoft LLC.: Saint Petersburg, Russia, 2022.
  69. CzechGlobe (Global Change Research Institute). Airborne Laser Scanned Data; CzechGlobe (Global Change Research Institute): Brno, Czech Republic, 2022. [Google Scholar]
  70. GLAD. Global Forest Canopy Height. The Global Land Analysis and Discovery (GLAD) Laboratory, University of Maryland. 2019. Available online: https://glad.umd.edu/dataset/gedi (accessed on 14 December 2022).
  71. Cohen, J. A Coefficient of Agreement for Nominal Scales. Educ. Psychol. Meas. 1960, 20, 37–46. [Google Scholar] [CrossRef]
  72. Chicco, D.; Warrens, M.; Jurman, G. The Matthews Correlation Coefficient (MCC) is More Informative Than Cohen’s Kappa and Brier Score in Binary Classification Assessment. IEEE Access 2021, 9, 78368–78381. [Google Scholar] [CrossRef]
  73. Sobala, M.; Myga-Piątek, U.; Szypuła, B. Assessment of Changes in a Viewshed in the Western Carpathians Landscape as a Result of Reforestation. Land 2020, 9, 430. [Google Scholar] [CrossRef]
  74. Štular, B.; Lozić, E.; Eichert, S. Airborne LiDAR-Derived Digital Elevation Model for Archaeology. Remote Sens. 2021, 13, 1855. [Google Scholar] [CrossRef]
  75. Ďuračiová, R.; Rasova, A.; Lieskovský, T. Fuzzy Similarity and Fuzzy Inclusion Measures in Polyline Matching: A Case Study of Potential Streams Identification for Archaeological Modelling in GIS. Rep. Geod. Geoinform. 2018, 104, 115–130. [Google Scholar] [CrossRef]
  76. Hanssen, F.; Barton, D.; Venter, Z.; Nowell, M.; Cimburova, Z. Utilizing LiDAR data to map tree canopy for urban ecosystem extent and condition accounts in Oslo. Ecol. Indic. 2021, 130, 108007. [Google Scholar] [CrossRef]
  77. Gaspar, J.; Fidalgo, B.; Miller, D.; Pinto, L.; Salas, R. Visibility analysis and visual diversity assessment in rural landscapes. In Proceedings of the IUFRO Landscape Ecology Working Group International Conference, Bragança, Portugal, 21–27 September 2010. [Google Scholar]
  78. Chmielewski, S. Towards managing visual pollution: A 3D isovist and voxel approach to advertisement billboard visual impact assessment. ISPRS Int. J. Geo-Inf. 2021, 10, 656. [Google Scholar] [CrossRef]
  79. Cimburova, Z.; Blumentrath, S. Viewshed-based modelling of visual exposure to urban greenery—An efficient GIS tool for practical planning applications. Landsc. Urban Plan. 2022, 222, 104395. [Google Scholar] [CrossRef]
  80. Quinn, S.D. What can we see from the road? Applications of a cumulative viewshed analysis on a US state highway network. Geogr. Helvetica 2022, 77, 165–178. [Google Scholar] [CrossRef]
  81. Tsilimigkas, G.; Derdemezi, E.-T. Spatial Planning and the Traditional Settlements Management: Evidence from Visibility Analysis of Traditional Settlements in Cyclades, Greece. Plan. Pract. Res. 2020, 35, 86–106. [Google Scholar] [CrossRef]
  82. Cilliers, D.; Cloete, M.; Bond, A.; Retief, F.; Alberts, R.; Roos, C. A critical evaluation of visibility analysis approaches for visual impact assessment (VIA) in the context of environmental impact assessment (EIA). Environ. Impact Assess. Rev. 2023, 98, 106962. [Google Scholar] [CrossRef]
  83. Labib, S.M.; Huck, J.J.; Lindley, S. Modelling and mapping eye-level greenness visibility exposure using multi-source data at high spatial resolutions. Sci. Total Environ. 2021, 755, 143050. [Google Scholar] [CrossRef] [PubMed]
  84. Meek, S.; Goulding, J.; Priestnall, G. The Influence of Digital Surface Model Choice on Visibility-based Mobile Geospatial Applications. Trans. GIS 2013, 17, 526–543. [Google Scholar] [CrossRef]
  85. Lang, M.; Kuusk, A.; Vennik, K.; Liibusk, A.; Türk, K.; Sims, A. Horizontal Visibility in Forests. Remote Sens. 2021, 13, 4455. [Google Scholar] [CrossRef]
  86. Bartie, P.; Reitsma, F.; Kingham, S.; Mills, S. Incorporating vegetation into visual exposure modelling in urban environments. Int. J. Geogr. Inf. Sci. 2011, 25, 851–868. [Google Scholar] [CrossRef]
  87. Llobera, M. Modeling visibility through vegetation. Int. J. Geogr. Inf. Sci. 2007, 21, 799–810. [Google Scholar] [CrossRef]
  88. Wang, Y.; Dou, W. A fast candidate viewpoints filtering algorithm for multiple viewshed site planning. Int. J. Geogr. Inf. Sci. 2020, 34, 448–463. [Google Scholar] [CrossRef]
  89. Fisher, P.F. Extending the Applicability of Viewsheds in Landscape Planning. PE&RS 1996, 62, 1297–1302. [Google Scholar]
  90. Szypuła, B. Quality assessment of DEM derived from topographic maps for geomorphometric purposes. Open Geosci. 2019, 11, 843–865. [Google Scholar] [CrossRef]
  91. Kovačević, J.; Stančić, N.; Cvijetinović, Ž.; Brodić, N.; Mihajlović, D. Airborne Laser Scanning to Digital Elevation Model—LAStools approach. IPSI Trans. Adv. Res. 2023, 19, 13–17. [Google Scholar]
  92. Nutsford, D.; Reitsma, F.; Pearson, A.; Kingham, S. Personalising the viewshed: Visibility analysis from the human perspective. Appl. Geogr. 2015, 62, 1–7. [Google Scholar] [CrossRef]
  93. Ozkan, K.; Braunstein, M.L. Background surface and horizon effects in the perception of relative size and distance. Vis. Cogn. 2010, 18, 229–254. [Google Scholar] [CrossRef] [PubMed]
  94. Anderson, C.C.; Rex, A. Preserving the scenic views from North Carolina’s Blue Ridge Parkway: A decision support system for strategic land conservation planning. Appl. Geogr. 2019, 104, 75–82. [Google Scholar] [CrossRef]
  95. Bartie, P.; Reitsma, F.; Kingham, S.; Mills, S. Advancing visibility modelling algorithms for urban environments. Comput. Environ. Urban Syst. 2010, 34, 518–531. [Google Scholar] [CrossRef]
  96. Palmer, J.F. The contribution of a GIS-based landscape assessment model to a scientifically rigorous approach to visual impact assessment. Landsc. Urban Plan. 2019, 189, 80–90. [Google Scholar] [CrossRef]
  97. Siwiec, J. Comparison of Airborne Laser Scanning of Low and High Above Ground Level for Selected Infrastructure Objects. J. Appl. Eng. Sci. 2018, 8, 89–96. [Google Scholar] [CrossRef]
  98. Fetai, B.; Račič, M.; Lisec, A. Deep Learning for Detection of Visible Land Boundaries from UAV Imagery. Remote Sens. 2021, 13, 2077. [Google Scholar] [CrossRef]
  99. Govindaraju, V.; Leng, G.; Qian, Z. Visibility-based UAV path planning for surveillance in cluttered environments. In Proceedings of the 2014 IEEE International Symposium on Safety, Security, and Rescue Robotics (2014), Hokkaido, Japan, 27–30 October 2014; pp. 1–6. [Google Scholar] [CrossRef]
  100. Stöcker, C.; Bennett, R.; Nex, F.; Gerke, M.; Zevenbergen, J. Review of the Current State of UAV Regulations. Remote Sens. 2017, 9, 459. [Google Scholar] [CrossRef]
  101. Klouček, T.; Lagner, O.; Šímová, P. How does data accuracy influence the reliability of digital viewshed models? A case study with wind turbines. Appl. Geogr. 2015, 64, 46–54. [Google Scholar] [CrossRef]
  102. Dean, D. Improving the accuracy of forest viewsheds using triangulated networks and the visual permeability method. Can. J. For. Res. 1997, 27, 969–977. [Google Scholar] [CrossRef]
  103. Zhang, X.; Zhang, F.; Qi, Y.; Deng, L.; Wang, X.; Yang, S. New research methods for vegetation information extraction based on visible light remote sensing images from an unmanned aerial vehicle (UAV). Int. J. Appl. Earth Obs. Geoinf. 2019, 78, 215–226. [Google Scholar] [CrossRef]
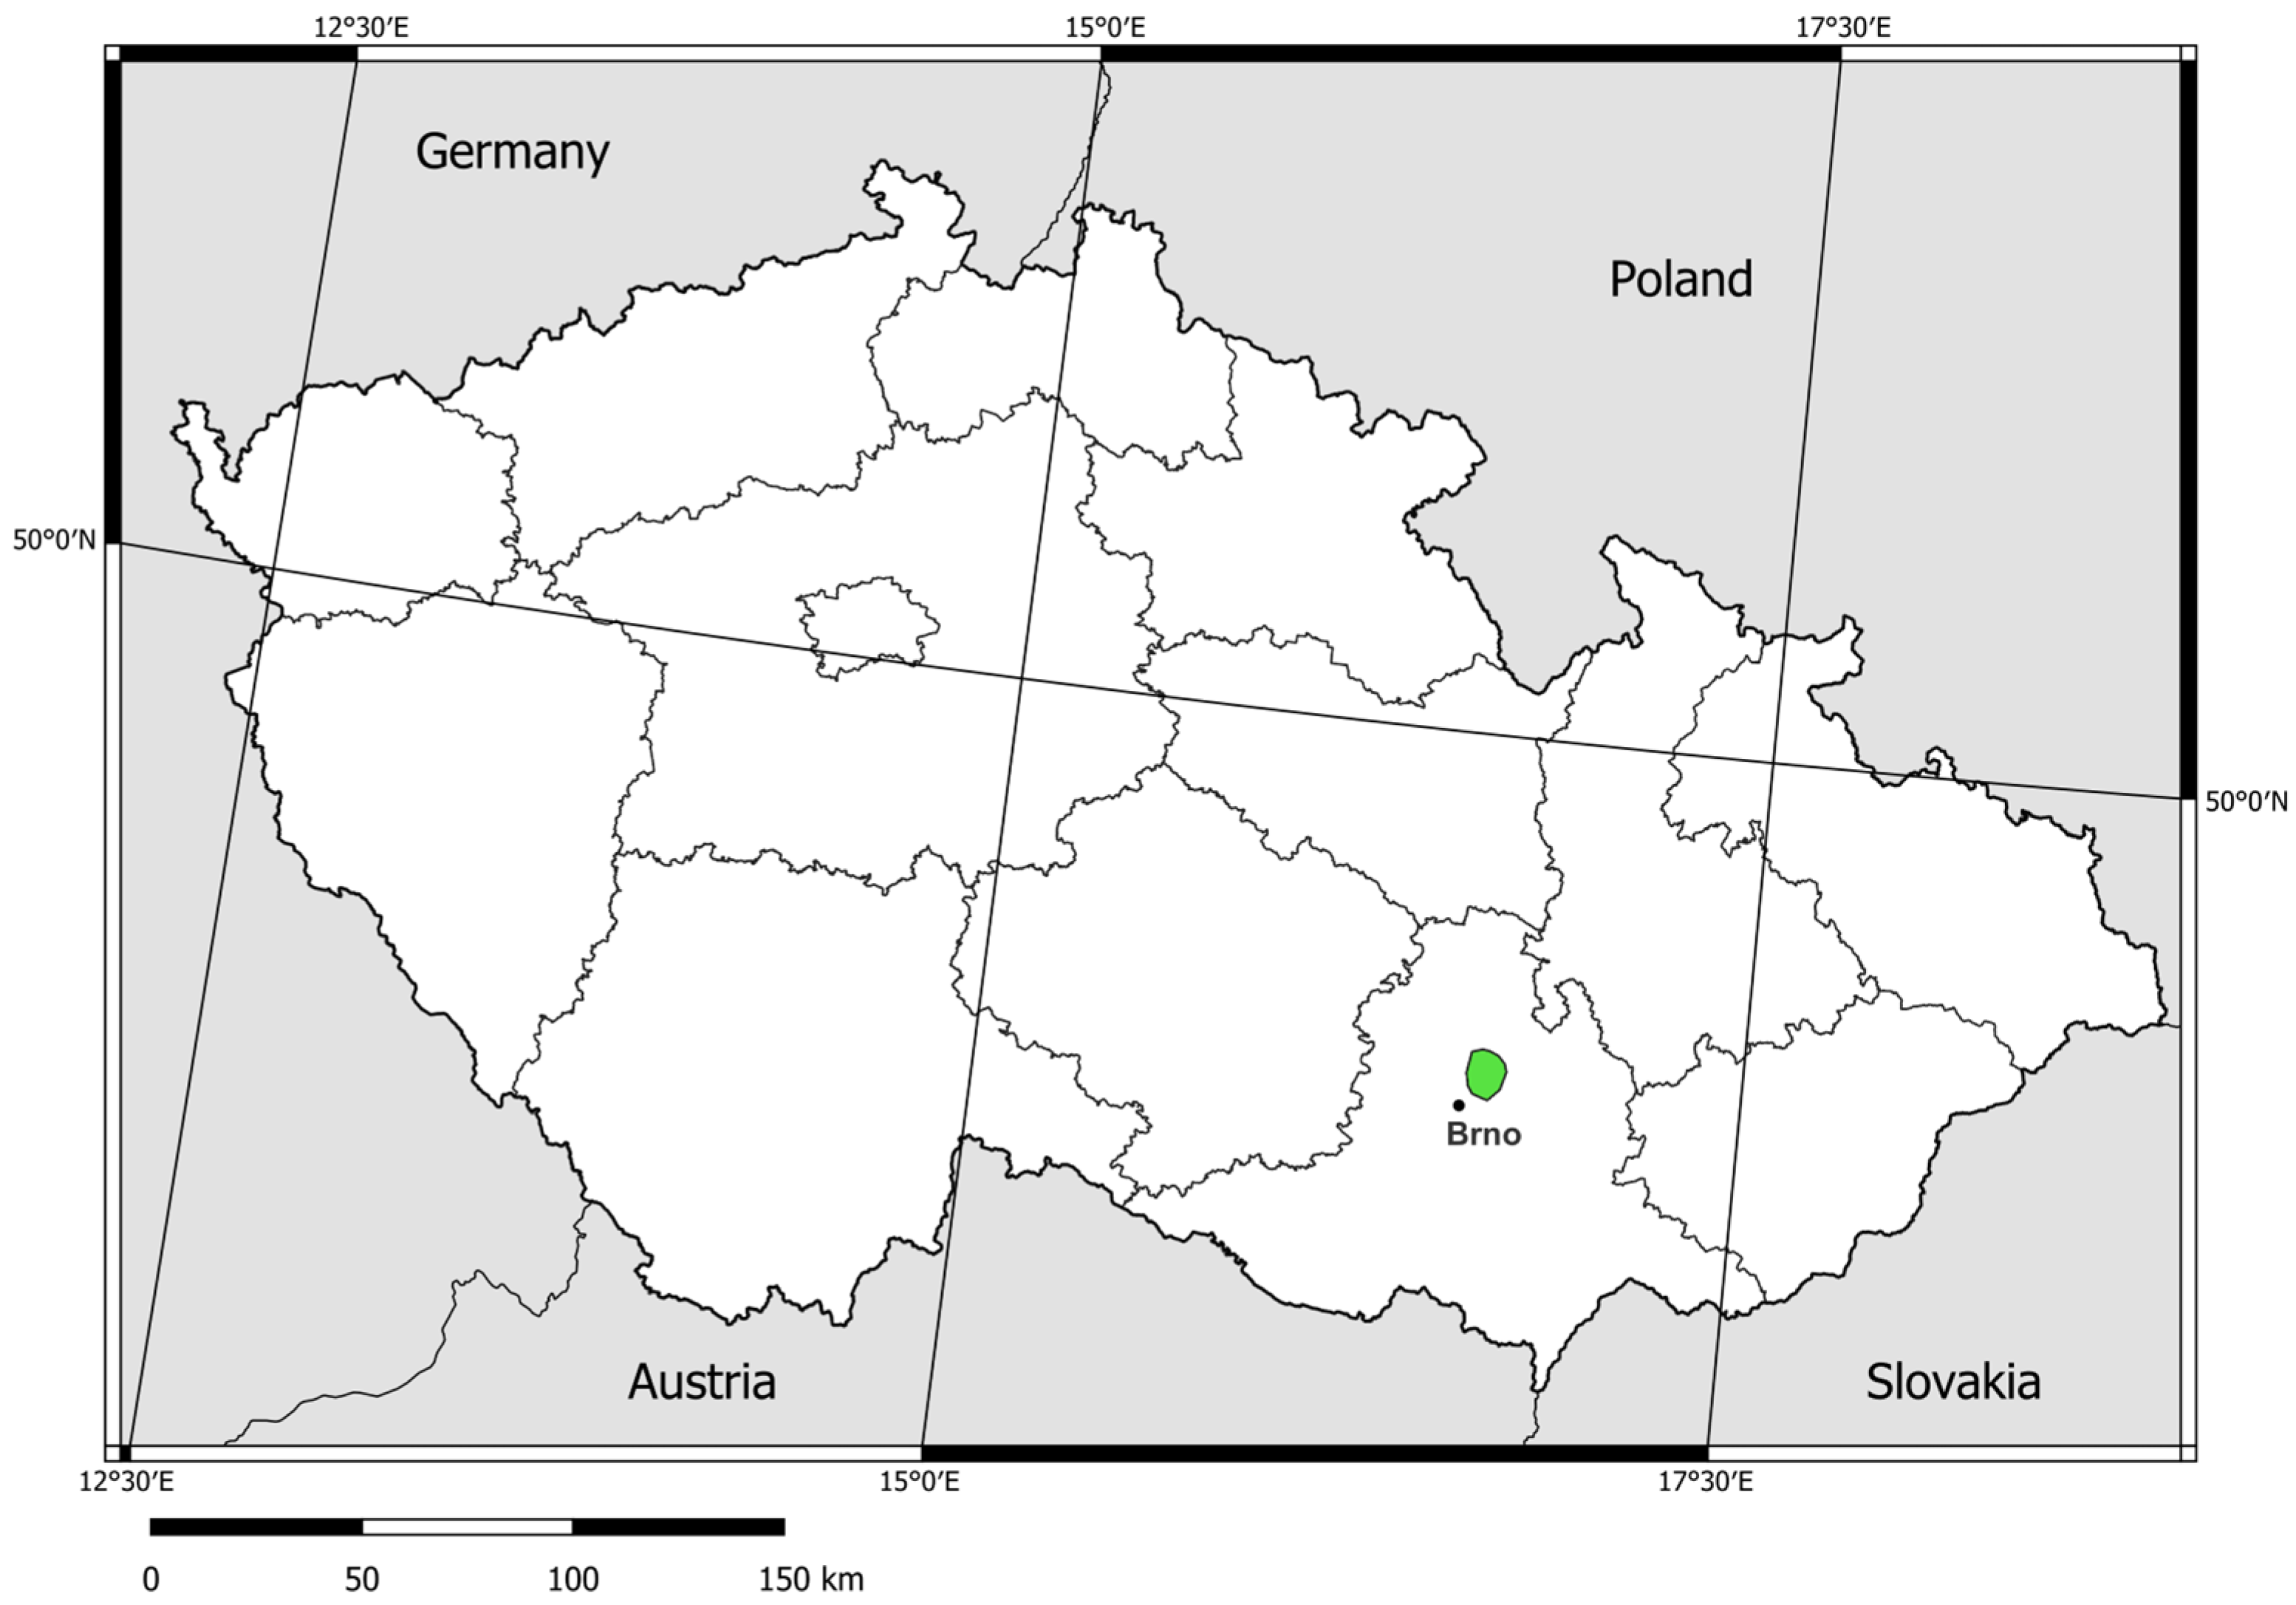
Figure 1. The area of interest (green polygon) within the Czech Republic (data source: Data200, Czech Office for Surveying, Mapping, and Cadastre, 2022).
Remotesensing 15 01028 g001
Figure 2. Locations of all three viewpoints (located at sites No. 1–3) within the area of interest (data source: OpenStreetMap contributors, (2015) Planet dump (Data accessed on 24 January 2023). Retrieved from https://planet.openstreetmap.org)).
Remotesensing 15 01028 g002
Figure 3. Panoramic images of (a) site No. 1; (b) site No. 2; (c) site No. 3.
Remotesensing 15 01028 g003
Figure 4. The simplified research process showing the raster data inputs without the refinement of UAV data and with the addition of UAV data. Data sources are displayed in three color groups.
Remotesensing 15 01028 g004
Figure 5. Comparison of DSMs’ hypsometry with the location of viewpoints at sites No. 1–3.
Remotesensing 15 01028 g005
Figure 6. Comparison of DSMs’ hypsometry, detailed depiction of site No. 1. (out of three study areas).
Remotesensing 15 01028 g006
Figure 7. Example of UAV data processing into DSM in AGISOFT PhotoScan for site No. 1.
Remotesensing 15 01028 g007
Figure 8. Adjusting layer visibility by pixel expansion.
Remotesensing 15 01028 g008
Figure 9. Kappa index resulting from viewshed analysis of each site.
Remotesensing 15 01028 g009
Figure 10. Visibility for site No. 1—without fusion with UAV data.
Remotesensing 15 01028 g010
Figure 11. Visibility for site No. 1—with fusion with UAV data.
Remotesensing 15 01028 g011
Table 2. Height differences in meters of the newest ALS 2018 DSM with other datasets.
Height Differences (m)MeanStd.Dev.RMSE
ALS 2018 × ALS 2014All pixels−4.197.118.25
Selection: forest−4.035.616.91
Selection: non-forest−0.030.500.50
ALS 2018 × ALS 2013All pixels−4.418.669.72
Selection: forest−3.935.857.05
Selection: non-forest−0.310.200.37
ALS 2018 × World DEMAll pixels−1.658.298.45
Selection: forest−0.205.665.66
Selection: non-forest−0.230.710.75
ALS 2018 × DTM + FHAll pixels−7.118.8711.37
Selection: forest−7.497.5710.65
Selection: non-forest−0.290.510.59
Table 3. Evaluation of visibility analysis, site No. 1. (On the left—comparison of DSMs with reference visibility. On the right—comparison of the UAV refined DSMs with reference visibility.)
DSMAll PixelsTrue PositiveKappa Index DSMAll
Pixels
True PositiveKappa
Index
Pixels%Pixels%
ALS 201871,37560,53293.860.89 ALS 2018 + UAV64,49164,491100.001.00
ALS 201456,14949,03276.030.81 ALS 2014 + UAV58,59253,92683.620.87
ALS 201365,78453,02782.220.81 ALS 2013 + UAV58,57553,15382.420.86
World DEM100,97256,22287.180.67 World DEM + UAV70,92755,14085.500.81
DTM with FH21,02019,36830.030.45 DTM with FH + UAV43,29538,83260.210.72
Table 4. Evaluation of visibility analysis, site No. 2. (On the left—comparison of DSMs with reference visibility. On the right—comparison of the UAV refined DSMs with reference visibility.)
DSMAll PixelsTrue PositiveKappa Index DSMAll
Pixels
True PositiveKappa
Index
Pixels%Pixels%
ALS 201812,71512,08311.670.21 ALS 2018 + UAV105,553105,553100.001.00
ALS 2014139712481.210.03 ALS 2014 + UAV95,51185,63783.250.85
ALS 201310147650.740.02 ALS 2013 + UAV96,42785,12880.940.84
World DEM61,45898989.560.44 World DEM + UAV109,60084,87383.050.78
DTM with FH90,45198989.560.49 DTM with FH + UAV86,64172,36674.490.75
Table 5. Evaluation of visibility analysis, site No. 3. (On the left—comparison of DSMs with reference visibility. On the right—comparison of the UAV refined DSMs with reference visibility.)
DSMAll PixelsTrue PositiveKappa Index DSMAll
Pixels
True PositiveKappa
Index
Pixels%Pixels%
ALS 201898,52787,54792.810.91 ALS 2018 + UAV94,32594,325100.001.00
ALS 201451,79446,49949.300.63 ALS 2014 + UAV53,04849,19052.150.66
ALS 201391,50677,77782.460.83 ALS 2013 + UAV90,40779,31484.090.86
World DEM103,16877,30681.960.78 World DEM + UAV86,14574,84179.340.83
DTM with FH61,46850,34453.370.64 DTM with FH + UAV71,78060,76164.420.73
Disclaimer/Publisher’s Note: The statements, opinions and data contained in all publications are solely those of the individual author(s) and contributor(s) and not of MDPI and/or the editor(s). MDPI and/or the editor(s) disclaim responsibility for any injury to people or property resulting from any ideas, methods, instructions or products referred to in the content.