Abstract
Constraining the age of formation and repeated movements along fault arrays in superimposed rift basins helps us to better unravel the kinematic history as well as the role of inherited structures in basin evolution. The Inner Moray Firth Basin (IMFB, western North Sea) overlies rocks of the Caledonian basement, the pre-existing Devonian–Carboniferous Orcadian Basin, and a regionally developed Permo–Triassic North Sea basin system. IMFB rifting occurred mainly in the Upper Jurassic–Lower Cretaceous. The rift basin then experienced further regional tilting, uplift and fault reactivation during the Cenozoic. The Devonian successions exposed onshore along the northwestern coast of IMFB and the southeastern onshore exposures of the Orcadian Basin at Sarclet preserve a variety of fault orientations and structures. Their timing and relationship to the structural development of the wider Orcadian and IMFB are poorly understood. In this study, drone airborne optical images are used to create high-resolution 3D digital outcrops. Analyses of these images are then coupled with detailed field observations and U-Pb geochronology of syn-faulting mineralised veins in order to constrain the orientations and absolute timing of fault populations and decipher the kinematic history of the area. In addition, the findings help to better identify deformation structures associated with earlier basin-forming events. This holistic approach helped identify and characterise multiple deformation events, including the Late Carboniferous inversion of Devonian rifting structures, Permian minor fracturing, Late Jurassic–Early Cretaceous rifting and Cenozoic reactivation and local inversion. We were also able to isolate characteristic structures, fault kinematics, fault rock developments and associated mineralisation types related to these events
1. Introduction
The IMFB is a superimposed rift basin that has experienced a complex structural history with many deformation episodes of regional or local extent. Strictly, the IMFB rift is thought to have formed during the Late Jurassic–Early Cretaceous as the western arm of the intra-continental North Sea trilete rift system (Figure 1; e.g., [1,2,3]). However, the basin is superimposed on post-orogenic Devonian–Carboniferous sedimentary rocks related to the Orcadian Basin and a large Permian to possibly mid-Jurassic basin, widely characterised by thermal subsidence ([1,2,4]; see also [3,5] and references therein). Post-rift, the basin experienced subsequent regional tilting, uplift and fault reactivation episodes during the Cenozoic [2,4,6].
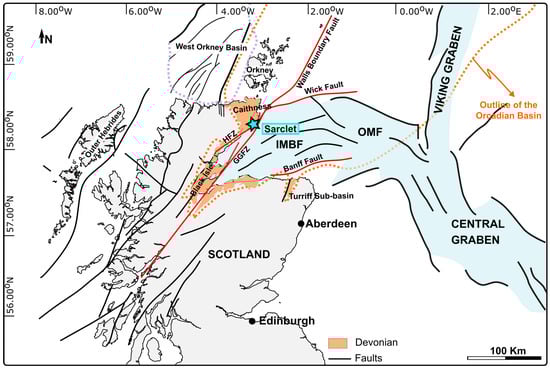
Figure 1.
Generalised tectonic map of Scotland and the northern North Sea region showing the main Mesozoic rift systems (after [5]). The faults mentioned in the text are shown in red. GGFZ, Great Glen Fault Zone, HFZ, Helmsdale Fault Zone. Outline of the Orcadian Basin marked in dotted orange line, and outline of the West Orkney Basin is marked in dotted purple line.
The resulting multiple, superimposed structures can be challenging to separate and characterise. Offshore, the basin fills provide some constraints over the timing of events [1,2,3]. However, observations are limited by the scale resolution of seismic reflection datasets and also by the fact that fault kinematics can be difficult to ascertain. Onshore, these aspects are well preserved, but limitations arise due to restricted exposure, complex kinematic histories and a lack of information concerning the absolute (as opposed to relative) timing of fault movements. In many cases, however, the deformation episodes may be associated with diagnostic syn-tectonic mineral fills (e.g., calcite, zeolite or base metal sulphides). Some of these can be dated using radiometric methods (e.g., U-Pb calcite, Re-Os sulphides) to constrain the absolute timing (e.g., see the approaches used by [5,7,8]).
The present study focuses on the timing, nature and regional significance of tectonic structures preserved in the onshore Devonian successions of the northwestern IMFB and southeastern Orcadian Basin (Figure 1). New detailed field observations coupled with drone airborne optical images and the creation of high-resolution 3D digital outcrops, together with Pb geochronology of syn-faulting mineralised veins, are used to constrain the orientations and absolute timing of fault populations and decipher the kinematic history of the area. We also explore how these tectonic events in the IMFB may be correlated with those seen in northern Caithness [7,9], with offshore structures to the southeast and those seen onshore along the southern coast of the basin [3,5].
These findings reveal hitherto unrecognised constraints for the timing and kinematic history of faulting and fault reactivation, providing a potential new structural template for the interpretation of the subsurface basin architecture in the offshore IMFB. The findings also have important potential applications in other superimposed rift basin settings worldwide and also in areas of regionally contemporaneous onshore–offshore basin development.
2. Geological Overview
The Mesozoic IMFB is a superimposed rift basin developed on the Precambrian to Caledonian metamorphic basement and the Carboniferous–Devonian successions occupying the southern part of the Orcadian Basin (Figure 1; [10,11]). The IMFB is bounded by the Banff Fault to the south, the Helmsdale and Great Glen (GGF) faults to the northwest and the Wick fault to the north (Figure 1). The IMFB transitions eastwards into the Outer Moray Firth Basin, which links into the Central and Viking grabens in the central part of the North Sea. (Figure 1). The underlying Orcadian Basin belongs to an older, regionally linked system of Devonian basins that extends northwards into Shetland, western Norway and eastern Greenland [12,13,14].
2.1. Stratigraphic Framework
The stratigraphy of the exposed rocks (Figure 2a), forming the northwestern margin of the IMFB, is predominantly Middle Devonian with minor Lower Devonian deposits of the Orcadian Basin, unconformably overlying Moine and Lewisian metamorphic basement and Helmsdale granite. Limited Permo–Triassic to Upper Jurassic strata crop out in the hangingwall of the Helmsdale Fault and to the southwest in the Black Isle, while the Lower Cretaceous strata only subcrops offshore.
Our area of interest lies onshore in the northwestern IMFB and southeastern onshore exposures of the Orcadian Basin in Caithness (Figure 1).
In southeastern Caithness, the Lower Devonian strata belong to the Basement (Barren/Sarclet) Group (e.g., [15]; Figure 2b). The succession comprises predominantly fluvial conglomerates, which contain rounded clasts of granite, schist and gneiss (Sarclet Conglomerate Formation), overlain by thick medium-grained red/brown sandstones (Sarclet Sandstone Formation). The Sarclet formations are overlain by a rhythmic lacustrine sequence of green mudstones and marly siltstones with some interbedded fluvial red sandstones. These represent the main basin depocenter succession and form the Ulbster Formation [15,16,17]. The Sarclet and Ulbster formations are thought to be laterally equivalent to the Ousdale/Braemore Formation (Figure 2b), a mainly conglomeratic unit that crops out immediately north and south of the Helmsdale granite. These rocks are thought to represent the deposits of an at least partially isolated sub-basin from the main Orcadian depocenter to the north [15].

Figure 2.
(a) Summary of onshore stratigraphy (modified after [18]). Not to scale, with relative thicknesses shown in a notional fashion. ORS—Old Red Sandstone. (b) Simplified stratigraphy of the Lower to Upper Devonian from Caithness (compiled after [10,15,19]).
The overlying rocks of the Middle Devonian are generally dominated by flagstones (grey-green shales, fine-grained laminated sandstone and dark-grey organic-rich shales) deposited in a cyclic lacustrine environment within the Orcadian Lake [15,16]. The Lower Caithness Flagstone and Upper Caithness Flagstone groups are separated by Achanarras and Niandt limestone beds with abundant fish fauna, forming a regional marker horizon. The overlying John O’Groats and Upper Devonian Dunnet Head groups are represented by fluviatile red/yellow cross-bedded sandstones interbedded with lacustrine mudstones with fish fauna and do not crop out in the study area.
2.2. Structural Framework
Devonian-age faults and fracture systems, usually sinistral strike-slip to dip-slip NW–SE- to NNE–SSW-trending faults, are thought to have formed during the regional transtensional opening of the Orcadian Basin (Figure 1) during the Early- to mid-Devonian [9,12,20,21,22]. They have been recognised both in the outcrops of Caithness (e.g., [7,9,22], in their Group 1 structures) and in the southern coastal region of the IMFB, in the Turriff Sub-basin [5].
In north Caithness, Orkney and Shetland, these rift-related structures are locally overprinted by later N–S trending folds and thrusts of (possible) Late Carboniferous–Early Permian age (Group 2 structures of [9], see also [23,24,25,26]). These E–W shortening structures have been generally interpreted to have formed due to a Late Carboniferous–Early Permian inversion event during dextral strike-slip reactivation of the Great Glen Fault [9,12,21,22,27,28], possibly a far-field effect of the Variscan orogenic episode in northern Europe.
The Devonian structures in Caithness and Orkney are also widely overprinted by NE–SW to ESE–WNW trending Permo–Triassic dextral and sinistral transtensional faults, respectively (Group 3 structures; [9]), related to the formation of the West Orkney Basin further to the north (Figure 1; [7]).
The Permo–Triassic history of the IMFB is thought by most authors to be characterised by thermal subsidence and passive infill of the pre-existing topography, although Permo–Triassic rifting occurred in the other parts of the North Sea (see [3] and references therein). The mainly Jurassic rifting, which led to the opening of the IMFB, is widely characterised by the development of km-long, predominantly NE–SW-trending growth faults. Onshore, Late Jurassic to Early Cretaceous rifting was associated with sinistral and dextral transtensional faulting along the Helmsdale and splays related to the Great Glen Fault, respectively [29]. In the Turriff Sub-basin, the Devonian N–S to NNE–SSW trends are also locally dextrally reactivated during Lower Cretaceous rifting [5].
Late Cretaceous- to Cenozoic-age regional uplift and faulting in the IMFB are thought to have led to widespread but localised fault reactivation, including dextral reactivation of the Great Glen fault in offshore regions [2,4,6]. While the timing of this reactivation is traditionally viewed as Cenozoic, this is commonly just assumed based on indirect evidence and correlation with regional events [3,6,29].
It is important to note that the post-Devonian faulting histories on either side of the Helmsdale fault appear to differ significantly, suggesting that the fault acts as a regional boundary restricting the effects of Mesozoic faulting to the IMFB [7].
3. Materials and Methods
3.1. Structural Fieldwork and Sampling
The structural fieldwork and sampling described in this study focus on the brittle deformation recorded in the Devonian strata located along the coastal cliffs, ~500 m east of Sarclet village [Grid Reference: ND 343 439] (Figure 1).
Detailed observations and structural measurements were recorded during fieldwork using both a Suunto geological compass/clino and the FieldMove™ digital mapping application on an Apple iPad™ (6th Generation).
Structural data processing and visualisation were carried out using Stereonet 10 (lower hemisphere, equal-area projections; [30,31]). Fault-slip slickenline data were collected in order to perform palaeostress inversions. The analysis assumes that slip on a fault surface occurs in the direction of the maximum resolved shear stress [32,33]. In this study, the fault data were analysed using the Angelier [34] direct inversion method (INVD) implemented using the SG2PS software [35]. This method estimates the reduced stress tensor and the shear stress magnitudes from the fault-slip data [34].
Structurally oriented samples of fault rocks and mineral fills associated with specific fault zones were collected for microscopic and geochronological analysis. Calcite mineral fills associated with faults or fractures were specifically collected for U-Pb geochronology. A key requirement in the field was to first recognise the presence of carbonate in order to make it suitable for collecting and dating. For that, a diluted solution of hydrochloric acid was used, together with analysing physical properties like colour, cleavage, or hardness.
3.2. Photogrammetry
The UAV photogrammetry data were collected and used to create 3D digital outcrops, digital elevation models and high-resolution orthomosaic maps. These data were then used for visualisation and structural data extraction.
Photogrammetry, especially UAV-based photogrammetry, is a valuable and increasingly used technique (e.g., [36,37,38,39]) that allows a visual assessment of the spatial distribution of structures across a wide range of scales (cm to km). It also gives greater access to otherwise inaccessible parts of the outcrop in high cliffs and allows the routine extraction of structural observations and data from 3D digital outcrop models (DOM). In this case, UAV photography was acquired using a DJI Mavic Air drone, which has a digital camera with a 12-megapixel image sensor.
Manual photograph acquisition was used for the southern outcrop (The Haven), while for the northern outcrop (Muiri Geo), both manual flight paths and automated flight paths were used. The automated acquisition flight paths were flown as a double grid (two orthogonal flight grids). For the automated data acquisition, Pix4Dcapture was used with a front overlap of 80%, a side overlap of 70% and a 70° camera angle. When flying the manual flight paths, similar or better photograph overlaps as with the automated acquisition are desired. All areas of the presented 3D outcrops have a final image overlap of more than nine images.
The creation of the DOM and orthomosaics was performed at Babes-Bolyai University, Romania, using Agisoft Metashape Professional. The first step in the process involves aligning the photographs and generating a sparse point cloud. Both models were aligned with the highest alignment accuracy setting, a key point limit of 40,000, and a tie point limit of 4000. After alignment, the next step was to adjust the shape of the region so that the following stages would generate and process data only in the region of interest, thus reducing processing time. The following step involved the generation of a dense point cloud using the ‘high quality’ setting, which is a time- and resource-consuming process. The ‘calculate point confidence’ option was enabled during this process as it was later used to filter out the highly uncertain points and areas with low overlap during the cleaning of the dense point cloud data. From the cleaned dense point cloud, both the DEM and the mesh (which was later textured; 20 × 8000 pixel texture) were generated (Figure 3).

Figure 3.
Photogrammetry workflow from photographs acquisition to generating texture meshes.
A total of 984 images were used for the generation of the southern DOM (The Haven), reaching a resolution of 1.78 cm/pixel, a point density of 0.316 points/cm2 and 980 images for the northern outcrop (Muiri Geo), generating models with a resolution of 1.5 cm/pixel and point density of 0.442 points/cm2. The high-resolution DOM and orthomosaic files are provided in the Supplementary Material as 3D PDF (Supplementary files A and B) and OBJ files (Supplementary files C and D) for the DOM, and GeoTiff files for the orthomosaics (Supplementary files E and F).
3.3. Microscopy
Oriented thin sections were made from samples collected in the field. These were studied and photographed using an optical transmitted light microscope to ascertain the relative age of the mineral fills, any fault-related displacements and any deformation. For calcite samples, a key requirement was to demonstrate whether the growth of calcite could be shown to be synchronous with fault displacements recognised during fieldwork [40]. This was critical for interpreting the results of the geochronology data. Representative thin sections of photomicrographs were used to illustrate the findings.
3.4. Geochronology
Thick sections of two calcite-filled fractures (Sa01 and SaN06) were analysed using laser ablation–inductively coupled plasma–mass spectrometry (LA-ICP-MS) at the University of Hull (UK) using established methods for calcite U-Pb geochronology [41]. Analytical conditions and data are provided in Supplementary Material—Supplementary file G. The samples had low U and Pb concentrations and thus yielded low areas on the low-sensitivity quadrupole instrumentation at Hull University. Data below with reliable detection limits, as well as data with uncertainties larger than 20% 2s on the 238U/206Pb ratios and 10% 2s on the 207Pb/206Pb ratios, were not considered in date determinations. This did not have a significant effect on the final dates. The dates are lower intercept ages quoted at the 2s level and include propagation of systematic uncertainties, which includes the 2.5% uncertainty of the WC1 reference material. Date calculations were performed using IsoplotR [42], with uncertainty ellipses plotted at the 2s level.
4. Results
4.1. Onshore Fieldwork Observations
The Sarclet locality [Grid Reference: ND 35096 43332] is located in the cliffs ~500 m east of Sarclet village [Grid Reference: ND 343 439] (Figure 4a).
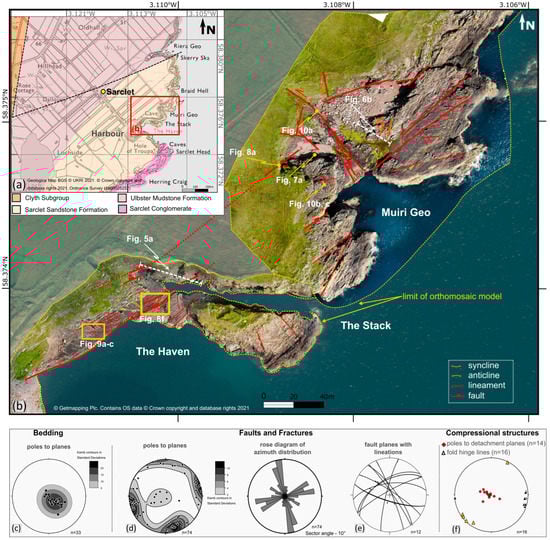
Figure 4.
(a) Geological map of Sarclet area (using EdinaDigimap service and BGS 1985) showing the location of (b)—the studied exposure. (b) Orthomosaic model obtained from UAV (Unmanned Aerial Vehicle) photography overlapped on aerial map (using EdinaDigimap service© Getmapping Plc) showing the main structural trends. The locations of Figure 5a, Figure 6b, Figure 7a, Figure 8a,f, Figure 9a–c and Figure 10a–c are also shown. (c–f) Stereonets and rose plots of structural data collected in the field. Lower hemisphere, equal-area projections.
The investigated exposure extends about 300 m north along the coast from the natural harbor known as the Haven until the cliffs at Muiri Geo (Figure 4b). A large orthorectified model across the entire area was obtained from the UAV to enable data visualisation, interpretation, and display (Figure 4b), especially as most of the cliffs are inaccessible due to their height and the presence of deep sub-vertical gullies. The Lower Devonian Sarclet Sandstone Formation (Figure 4a, BGS 1985) of the Sarclet Group (Figure 2b) is well exposed here in the 20–30 m high cliffs and on a series of flat-lying rock platforms about 20–30 m wide (Figure 4b). The succession conformably overlies the Sarclet Conglomerate Formation, which crops out further to the south of our area of interest (Figure 4a). Sarclet Sandstone Formation comprises cm- to m-scale beds (10 cm to 4 m thick) of red-coloured, well-cemented medium-grained sandstones showing parallel laminations and local cross-bedding. Previous authors have interpreted these as braided river/meandering river deposits [10] with aeolian influences [18].
Overall, the beds are typically sub-horizontal to gently dipping (02° to 30°) predominantly to the NW (Figure 4c). The stratigraphy is crosscut by numerous, commonly closely spaced (decimetre to metre separation) shallowly-dipping to high-angle faults, fractures/fracture corridors and veins of multiple orientations and kinematics (e.g., Figure 4d,e). The dominant set trends broadly NNW–SSW (~20° scatter), dipping both E and W. A second set trends NE–SW to E–W (~40° scatter), while a third (less well represented) is NW–SE trending (Figure 4d). The fault planes typically have high dips (55°–89°), but less common, shallowly dipping (of about 3°–36°) detachment faults and thrusts are also encountered locally, usually associated with folds (Figure 4f in yellow).
These shallow dipping (often bedding-parallel) compressional detachment planes are generally N–S- to NNE–SSW-trending (Figure 4f) and display top-to-the-WNW movements. These compressional structures are rarely accessible and are mostly seen high in the cliffs.
One good example can be observed in the high cliff face immediately north of the harbor (Figure 5a,b). In the middle section and to the east of the cliff, a large fold (of about 13 m amplitude) can be observed. The layers in the core of the fold (Figure 5b) are truncated against a sub-horizontal detachment plane dipping 3°–5° to the E, subparallel to the underlying beds (Figure 5b). The outer zone of the fold (Figure 5b in green) extends to the west, where it forms small-scale west-verging imbricates (Figure 5b). This structure formed most likely as part of a ‘staircase’ thrust system with a ramp–flat–ramp geometry (Figure 5c). The large fold seen in Figure 5b most likely represents a fault-bend fold developed over the ramp, which cuts through the lower stratigraphy (Figure 5c in grey). With further shortening, more thrusts appear to have developed in the upper stratigraphy forming the imbricate thrusts (Figure 5c in green). The hanging wall of these imbricates is later truncated against a top-to-the-E backthrust (Figure 5c).
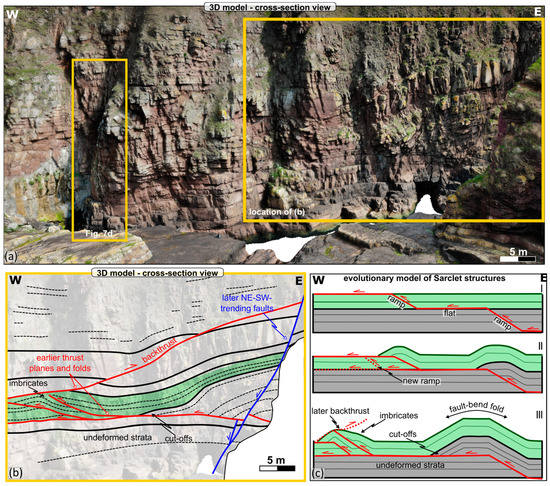
Figure 5.
(a) Three-dimensional digital outcrop model of the cliff exposure at Sarclet Haven (see location in Figure 4b) showing the folded and faulted Devonian strata. The location of (b) and Figure 7d are indicated on the 3D outcrop. (b) Line drawing showing the interpreted early detachment-related structures offset by later NE–SW-trending faults. (c) Forward model explaining the possible evolution of the detachment structures.
Top-to-the-WNW thrust and folded structures of a smaller scale are also present at Muiri Geo (Figure 6). The syncline in the footwall is NE–SW trending, while the hangingwall anticline and syncline are NNE–SSW-trending (Figure 6b). Where accessible, these detachment planes are associated with fault breccia that consistently show no associated mineralisation (Figure 6c).
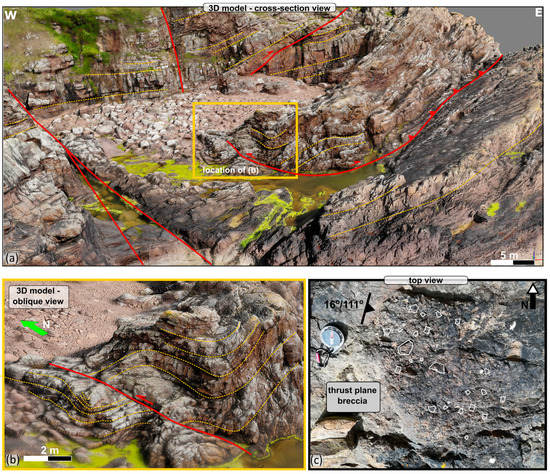
Figure 6.
(a) Three-dimensional digital outcrop model of the Muiri Geo outcrop (see location on Figure 4b) showing (b) fold and thrusted structures. (c) Field photograph showing the low-angle thrust plane associated with non-mineralised fault breccia.
Two different types of later mineralised structures have been identified at Sarclet. In the field, the mineralisation reacted with hydrochloric acid, indicating that calcium carbonate (most likely mainly calcite) was present, making it suitable for sampling and potential dating. An earlier N–S-trending set of translucent/white calcite tensile veins (Figure 7a–c) is developed, whilst later, pink-coloured zeolite and white calcite mineralisation are associated with NE–SW- to E–W-trending fault planes and fractures (Figure 7d,e). The N–S-trending veins, which are locally well displayed at Muiri Geo (Figure 4), are typically mm to c. 5 cm wide tensile veins containing jigsaw inclusions of the Devonian host rock (Figure 7a–c). One sample, SaN06, was selected from this type of vein for microstructural and geochronological analysis (Figure 7a).
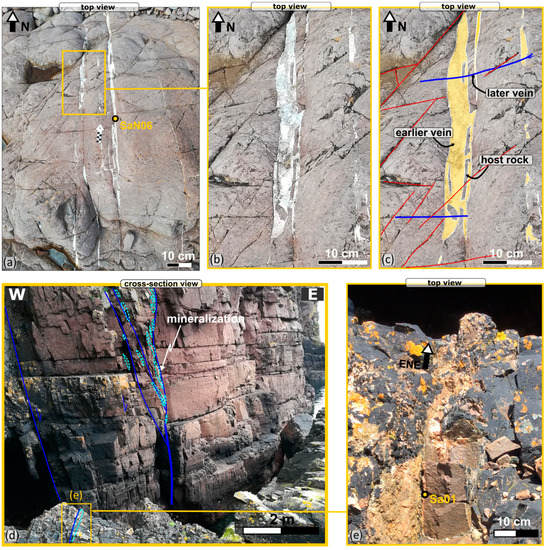
Figure 7.
(a,b) Field photographs and (c) line drawing snowing the N–S-trending calcite mineralised veins with location of sample SaN01 indicated on (a). Note the N–S-trending vein is crosscut by a later ENE–WSW-trending vein. (d,e) Field photographs showing the later NE–SW-trending faults which are associated with pink-coloured zeolite-calcite-quartz mineralisation. Location of sample Sa01 is indicated in (e).
The N–S-trending veins are crosscut by E–W-trending zeolite and calcite veins and NE–SW-trending fractures (Figure 7b,c). These zeolite and calcite mineralised faults are best observed in the cliffs at the Haven, where the mineralisation seems to fill tension gashes (Figure 7d). Locally, they are accessible in the flat rock platform, forming 1 to 7 cm wide ENE–WSW-trending tensile veins (Figure 7e). One sample from such a mineralisation, Sa01, was selected for microstructural and geochronological study (Figure 7e). These later NE–SW- to E–W-trending faults are usually the most prominent features in outcrops (e.g., Figure 7d and Figure 8). In addition to zeolite and calcite mineralisation, these faults are usually associated with m-wide damage zones (Figure 8a and Figure 9).
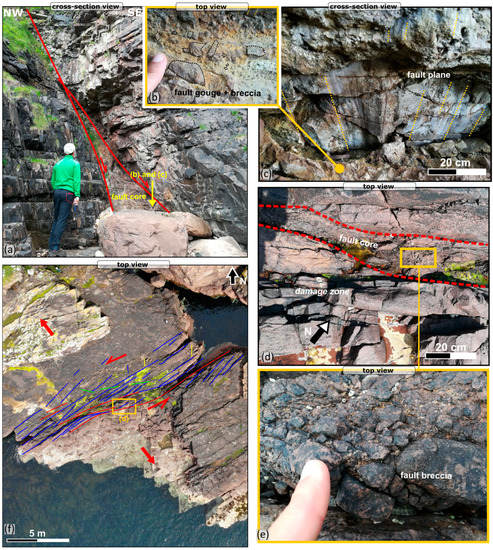
Figure 8.
Field photographs of (a) a major NE–SW-trending fault present in the cliffs at Muiri Geo (see location on Figure 4b); (b,c) detailed view of the associated fault rock; and dip-slip lineations and grooves (yellow dotted lines) on the NE–SW-trending fault. (d) Fault core and (e) detail of fault breccia associated with (f) a major NE–SW-trending fault present at The Haven, note the wide highly damaged zone with en-echelon fractures array showing sinistral shear.
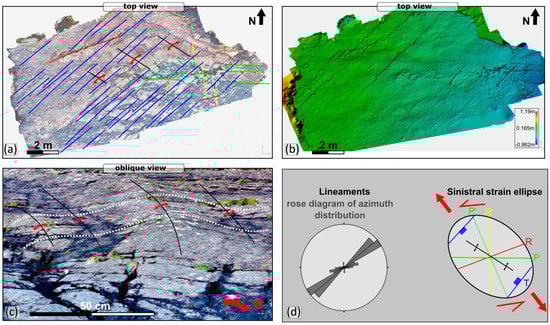
Figure 9.
(a) Orthomosaic and (b) DEM model along strike of Figure 8f (see location on Figure 4b) showing en-echelon fractures array and small-scale folds also shown in oblique view in (c). (d) Rose diagram of azimuth distributions and strain ellipse showing fault array geometry suggesting a component of sinistral shear movement. Colours match the colours in (a) and (Figure 8f).
These later NE–SW- to E–W-trending faults everywhere crosscut the earlier low-angle detachments and folds (Figure 5a,b). The NE–SW- to E–W-trending faults show a significant component of normal to sinistral oblique-slip movement based on offsets of bedding markers and kinematic indicators showing dip-slip normal (e.g., Figure 8b,c) to oblique sinistral normal slip (62° to 84° pitch) lineations. The faults usually have well-developed fault cores 20 cm to 1 m thick (Figure 8a,d) formed by a well- to poorly-cemented fault gouge and breccia (Figure 8b,e). Some of these faults are also surrounded by an m-wide damage zone dominated by a network of closely spaced (cm to dm) fractures which decrease in density away from the fault core. This fracture system in the damage zone is best exposed at The Haven, close to a generally ENE–WSW-trending fault (Figure 8f and Figure 9) with a 6 to 10 m-wide damage zone (Figure 8f). The associated fracture populations here are dominantly trending NE–SW (Figure 8f, Figure 9a in blue, and Figure 9d) but ENE–WSW (Figure 8f and Figure 9a in red), N–S to NNW–SSE (Figure 8f and Figure 9a in yellow), E–W (Figure 8f and Figure 9a in green) and NW–SE (Figure 8f and Figure 9a in dotted green) trends are also distinguishable.
In addition, small-scale shallowly plunging and generally ESE–WNW-trending folds (Figure 4f fold hinge lines in black, Figure 9c) of about 20–30 cm amplitude also develop in the damage zone, up to about 9 m away from the fault trace. These fault and fold populations are consistent with a sinistral strike-slip Riedel system developed during NW–SE extension (Figure 9d). We suggest that the NE–SW-trending faults correspond to tensile fractures/normal faults (Figure 9d T, in blue), the ENE–WSW-trending correspond to synthetic Riedel structures (Figure 9d R, in red), the N–S- to NNW–SSE-trending correspond to antithetic Riedel structures (Figure 9d R’, in yellow) and the E–W- and NW–ES-trending correspond to P shear and antithetic P shear structures, respectively (Figure 9d P and P’, in green). The ESE–WNW-trending folds (Figure 9c) are also consistent with the proposed sinistral shear model (Figure 9d).
A different, and possibly the latest (see Discussions section), set of strike-slip faults and en-echelon fracture systems resembling Riedel shear structures are also present at Muiri Geo locality (Figure 10). Here, steeply dipping (80° to 90°) NW–SE-trending fault planes show strike-slip kinematics (e.g., Figure 9a). Where exposed on bedding planes, NW–SE-trending faults are associated with small-scale (cm to dm) en-echelon fracture systems resembling Riedel shear structures showing sinistral slip (Figure 10c). Likewise, ENE–WSW-trending faults are associated with en-echelon fracture systems resembling Riedel shear structures showing dextral slip (Figure 10b). Those two sets, dextral and sinistral, developed at about 60° to each other (Figure 10d). They can represent the first-order Riedel shear structures developing simultaneously, as part of the same strike-slip system, during NNE–SSW extension and WNW–ESE compression, while the smaller scale Riedel shear fractures associated with their movement are most likely second-order Riedel shear fractures (Figure 10d).
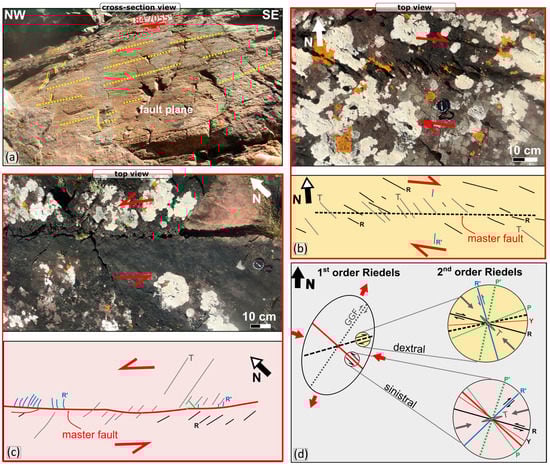
Figure 10.
(a) Field photographs of an NW–SE-trending fault plane showing sub-horizontal slickenline lineations (pitch 10°NW) suggesting strike-slip kinematics. (b) Field photograph and interpreted fracture network of a small-scale dextral fault. (c) Field photograph and interpreted fracture network of a small-scale sinistral fault. (d) Strain ellipse showing the predicted fault orientation and associated second-order structures matching the two Riedel shear sets in (b,c). GGF = Great Glen Fault.
4.2. Microscopy
Two different vein samples from the Sarclet locality have been investigated for microstructural characteristics and dating: Sa01 and SaN06 (Figure 11).
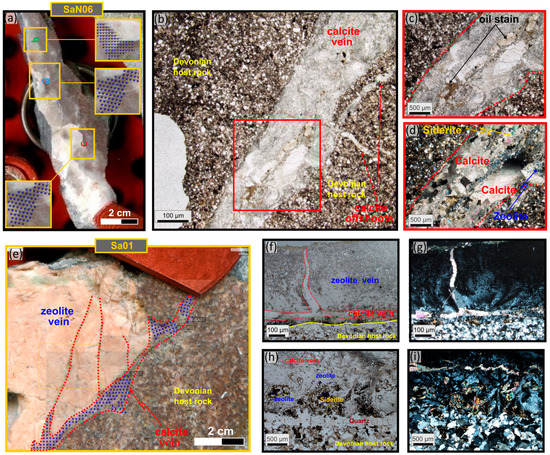
Figure 11.
(a) Polished thick section of SaN06 sample showing the laser ablation spots (blue dots). (b) Microphotograph and detail of the calcite vein showing (c) oil stains and (d) occurrence of associated intergrown siderite and zeolite. (e) Polished thick section of mainly zeolite (pink) and calcite (grey) Sa01 sample also showing the laser ablation spots (blue dots). (f–i) Representative thin section microphotographs of Sa01 sample showing (f) in plane polarised light and (g) crossed polarised light the vein formed almost entirely of zeolite with thin calcite vein present at the boundary with Devonian host rock and as offshoots in the main zeolite vein. (h) in plane polarised light and (i) crossed polarised light, rare occurrence of early formed siderite and quartz along vein margins.
The SaN06 sample (Figure 11a) was taken from an N–S-trending white calcite vein (Figure 7a and Figure 11a), which on the basis of observed crosscutting relationships, appears to be the earliest vein set seen in the outcrops. In the thin section, the veins are curviplanar and have local mesh-like offshoots (Figure 11b). Larger veins are composite and likely syntaxial with finer calcite outer zones, coarser sparry calcite inner zones and locally, a fine central mixture of calcite, zeolite and local siderite (Figure 11d). Most offshoots are the sparry variety of calcite (Figure 11b). The youngest fills—including zeolite and siderite in places—are lightly oil-stained, notably in the region adjacent to the contact region of the zeolite-bearing fill (Figure 11c).
The Sa01 sample (Figure 7e and Figure 11e) was collected from a dilational jog associated with an ENE–WSW-trending fault (Figure 7e), which is best observed in the cliffs (Figure 7d). The vein is characterised by dominantly pink-coloured zeolite and pink calcite mineralisation (Figure 11e). These pink veins, mm- to cm-thick, crosscut older white calcite vein sets in outcrops of Lower Devonian sandstone/siltstone (Figure 7b,c). Thin sections of the Sa01 vein show that the mineral fill is composite, predominantly zeolite (Figure 11e–g), with marginal quartz (only preserved on one vein margin, Figure 11h,i). This zone is followed by a mixture of zeolite and siderite (seen on both sides of the vein), followed by a central domain of pure zeolite, which forms about 80% of the total vein (Figure 11h,i). This appears to be the relative age sequence (oldest to youngest), e.g., syntaxial growth. All are then crosscut by a mesh of later thin white calcite veins (Figure 11e–i), some of which are parallel to earlier vein contacts (Figure 11h,i), with high-angle offshoots locally intruding into the central part of the zeolite vein (Figure 11e–g). The white calcite fill was the dated mineralisation (Figure 11e).
4.3. Geochronology
The 238U and 206Pb concentrations were determined for the Sa01 and SaN06 calcite-bearing samples.
From the Sa01 sample, the later calcite veins that crosscut the zeolite fills were targeted for dating (Figure 11e; see locations of ablation sites on the thick section). For SaN06, three sites in the calcite were chosen for analysis (SaN06a, SaN06b and SaN06c; see ablation sites in Figure 11a). Both analysed samples contained sufficient amounts of 238U (and low enough concentrations of common Pb) to yield accurate and precise dates.
For sample Sa01 (Figure 11e), 139 spots were ablated, with 54 spots omitted due to excess common Pb or poor ablation. The remaining spot data (n = 85) were plotted on a Tera–Wasserberg U-Pb plot using IsoplotR [42], which yielded a 238U/206Pb age of 134.50 ± 19.4 Ma (2σ, initial 207Pb/206Pb (Pbinitial) = 0.6793 ± 0.0077, MSWD = 2.3; Figure 12a).
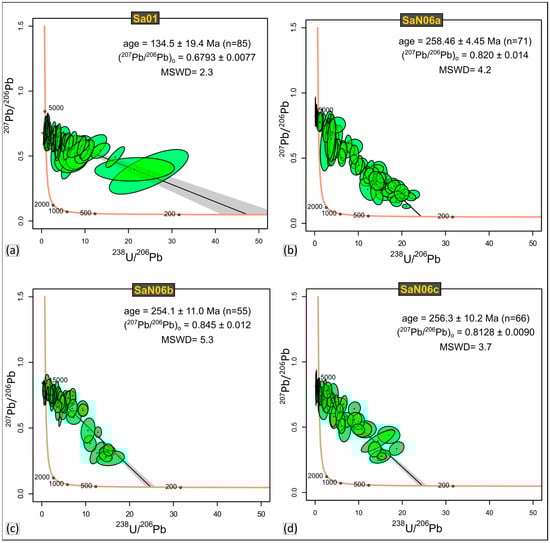
Figure 12.
Tera–Wasserburg diagram of measured in situ calcite 207Pb/206Pb and 238U/206Pb ratios (no common lead correction) from (a) sample SaN06a, (b) sample SaN06b, (c) sample SaN06c, (d) sample Sa01 Error ellipsoids of spot analysis are plotted in green and represent 2σ uncertainties. MSWS = mean standard weighted deviation.
For SaN06a (Figure 11a), 71 spots were ablated and plotted on a Tera–Wasserberg U-Pb plot which yielded a 238U/206Pb age of 258.46 ± 4.45 (2σ, Pbinitial = 0.820 ± 0.014, MSWD = 4.2; Figure 12b).
5. Discussion
The deformation in the Devonian rocks exposed at Sarclet is complex and characterised by multiple episodes of faulting, fracturing and local folding of different orientations and kinematics. The highly deformed nature of the rocks at this exposure has been attributed tentatively by some authors (e.g., [18]) to its proximity with the converging HF, GGF and Wick Fault immediately offshore (c. 1 km). The combination of outcrop-based structural observations, microstructures and geochronology, integrated with pre-existing studies across the Orcadian and IMFB, aid in establishing the possible geological relationships between the structures seen at Sarclet and link them to the wider regional events.
The calcite ages obtained suggest that there are two distinct episodes of calcite mineralisation (c. 256 and 134 Ma), respectively, pre-dating and synchronous with a phase of zeolite (+/− siderite and minor hydrocarbon) mineralisation. Importantly, the ages obtained are wholly consistent with the observed crosscutting and contact relationships in the field and thin section.
The N–S-trending veins (Figure 7a) are the earliest mineralised structures to yield an absolute U-Pb date (c. 254–258 Ma, Late Permian age). In the offshore IMFB, the Permo–Triassic history is widely characterised by parallel seismic reflectors and onlaps related to subsidence and passive infill of the Variscan palaeotopography [3]. Permo–Triassic rifting occurred further to the east in the Central/Viking graben area (Figure 1) during E–W extension (e.g., [43]). It is possible that the N–S veins at Sarclet formed in response to the far-field stress related to that rifting episode. This date is also close to being within error of Re-Os pyrite age for veins in northern Caithness (c. 267 Ma; [7]). Those veins in northern Caithness formed as a result of the Permian NW–SE extension related to the opening of the offshore West Orkney Basin (Group 3 structures; [9]).
The NE–SW- to ENE–WSW-trending veins predominantly containing pink zeolite and lesser amounts of calcite are, at least in part, Lower Cretaceous (Valanginian; c. 134 Ma). These faults have the same orientation as the offshore structures associated with the opening of the IMFB during the Late Jurassic–Early Cretaceous [1,2,3]. It is, therefore, likely that both onshore and offshore faults formed during an earlier Late Jurassic to Early Cretaceous NW–SE rifting episode. This episode possibly led to the formation of the fault core breccia and wide damage zone, indicating oblique sinistral slip, and could have been associated with the zeolite/siderite mineralisation. Repetitive later motions may have led to fault reactivation. This episode was associated with calcite mineralisation, which was dated and yielded Valanginian age (134.50 ± 19.76 Ma).
Two sets of structures remain unresolved by absolute dating as they are not associated with mineralisation; the compressional folds associated with the detachments (Figure 5 and Figure 6) and the complex strike-slip Riedel shear system observed at the Muiri Geo locality (Figure 10).
The folds and thrusts at Sarclet are possibly the earliest structures identified as they are crosscut by later (Early Cretaceous), steeply-dipping ENE–WSW- to NE–SW-trending faults. Similar structures have been previously described from Sarclet Haven (e.g., [9,18,23,44]). Enfield and Coward [23] suggest that contractional structures showing a transport direction dominantly to the WNW, observed in Orkney and Caithness (including those at Sarclet Haven), formed sometime during Late Devonian–Late Permian as they pre-date a phase of Permian dyke intrusion. Similar N–S-trending compressional structures with movement towards the west to west–northwest have been described by Parnell et al. [25] in western Orkney. There, the compressional structures commonly reactivate earlier extensional structures (Devonian rift-related faults), particularly on low-angle decollement planes. Thus, listric normal faults become later low-angle thrust ramps, sometime during the Late Carboniferous–Early Permian, a process facilitated by the presence of hydrocarbons along slip planes [25]. Compressional structures characterised by m- to km-scale N–S-trending folds and thrusts are widely developed close to earlier Devonian syn-rift faults on the Scottish mainland, Orkney and Shetland (e.g., [9,24,26,28]). Overall, these structures are interpreted as the result of a Late Carboniferous–Early Permian east–west inversion possibly related to dextral strike-slip reactivation of the Great Glen Fault (e.g., [9,12,21,22,27,28]) due to the far-field effects of the Variscan orogenic event. These are the so-called Group 2 structures as defined by Dichiarante et al. [9]. It seems most likely that the folds and detachment faults seen at Sarclet also belong to this set of Late Carboniferous–Early Permian structures, formed in a similar manner as those described by Parnell et al. [25] in west Orkney. However, the timing and nature of these folds and detachment faults are not fully understood. Note that it is now proposed that these folds and detachment faults belong to Group 2 and that the suggestion made by Dichiarante et al. [9] that they are Group I gravity-driven slump folds formed in response to the local basin topography is possibly incorrect.
The timing of the strike-slip Riedel shear system observed at Muiri Geo locality (Figure 10), which includes NW–SE-trending sinistral and dextral ENE–WSW-trending faults, is more difficult to constrain. If those structures formed simultaneously, as suggested, during NNE–SSW extension, then their timing could be Cenozoic. This is due to a good correlation of this stress regime with both local stress regimes interpreted onshore and offshore along the southern coast of IMFB and inferred as Cenozoic [3]. Moreover, their proximity to the GGF would favor such an interpretation with dextral ENE–WSW-trending representing synthetic Riedel shear structures to the GGF and the NW–SE-trending sinistral, representing antithetic Riedel shear structures formed during Cenozoic dextral reactivation on the GGF (Figure 10).
6. Conclusions
The Devonian rock’s location along the northern margin of the IMFB record a complex structural history due to multiple faulting episodes with associated local reactivation of structures. In onshore areas of this kind, the U-Pb dating of syn-faulting calcite-mineralised veins has proved to be a very successful tool and gives important opportunities to assess the absolute timing of faulting and improve understanding of the complex tectonic history of the region. The geochronology results yielded date populations of:
- -
- c. 258–254 Ma (Lopingian, late Permian).
- -
- c. 134 Ma (Valanginian, Early Cretaceous).
When combined with the findings of fieldwork, high-resolution UAV-based photogrammetry and microstructural studies of up to four deformation events can be identified, characterised and correlated with regional events. These are:
Late Carboniferous–Early Permian (Variscan) inversion—characterised by N–S-trending folds and thrusts. The compressional structures most likely reactivate earlier (Devonian rift-related faults) extensional structures, including low-angle decollement planes.
Late Permian minor fracturing—associated with N–S-trending calcite mineralised tensile veins (c. 258–255 Ma; Late Permian age). These fractures are possibly related to the early rifting event in the Central/Viking graben of the North Sea or formed as a result of the opening of the offshore West Orkney Basin.
Late Jurassic—Early Cretaceous rifting—typically characterised by dip-slip to normal-sinistral oblique E–W to NE–SW-trending faults. Most of these faults and fractures are widely associated with syntectonic calcite mineralisation, which could be dated and yielded c. 134 Ma.
Cenozoic—This faulting episode was not confirmed by calcite dating; however, several structures recognised onshore can be attributed to this event. These generally include strike-slip fault arrays, including the strike-slip Riedel shear system observed at Muiri Geo locality. These faults are most likely related to the dextral reactivation of the GGF.
In conclusion, the geological setting described in this paper, where an older rift basin fill is affected by a younger rift-related deformation event (or events), is likely to be very common in the geological record. This situation will be most often preserved in areas where an old basin exposed at the surface in an onshore, coastal location lies adjacent to a superimposed, younger rift basin developed immediately offshore. In the region of the British Isles—which is surrounded by younger offshore basins—this is a common situation (e.g., see [14]), and it is likely also found in many other regions worldwide.
Supplementary Materials
The following supporting information can be downloaded at: https://doi.org/10.5281/zenodo.7491695 (accessed on 28 December 2022), Supplementary files A–G.
Author Contributions
Conceptualization, A.T. and R.E.H.; methodology, A.T., R.E.H., D.M.T., E.D.D., K.H. and A.B.; software, D.M.T., E.D.D., K.H. and A.B.; validation, R.E.H., J.R.U., D.M., K.J.W.M. and D.S.; formal analysis, A.T., R.E.H., D.M.T. and E.D.D.; writing—original draft preparation, A.T.; writing—review and editing, R.E.H.; D.M. and D.S. visualization, A.T.; supervision, R.E.H., J.R.U., D.M., K.J.W.M. and D.S. All authors have read and agreed to the published version of the manuscript.
Funding
This work is based on the Ph.D. work of AT undertaken as part of the Natural Environment Research Council (NERC) Centre for Doctoral Training (CDT) in Oil and Gas [grant number NEM00578X/1] and was funded by Durham University and British Geological Survey (BGS) via the British University Funding Initiative (BUFI), whose support is gratefully acknowledged.
Data Availability Statement
All data generated or analyzed during this study are included in this published article and its supplementary material.
Acknowledgments
Many thanks to Nick Roberts, who, over the years, provided valuable insights that improved geochronology data analysis. Ian Chaplin and Sophie Edwards are thanked for the thin-section preparation. We would also like to thank two anonymous reviewers for their comments.
Conflicts of Interest
The authors declare no conflict of interest. The funders had no role in the design of the study; in the collection, analyses, or interpretation of data; in the writing of the manuscript; or in the decision to publish the results.
References
- Andrews, I.J.; Long, D.; Richards, P.D.; Thomson, A.R.; Brown, S.; Chester, J.A.; McCormac, M. The Geology of the Moray Firth; United Kingdom offshore regional report; British Geological Survey: London, UK, 1990; ISBN 978-0-11-884379-9.
- Underhill, J.R. Implications of Mesozoic—Recent Basin Development in the Western Inner Moray Firth, UK. Mar. Pet. Geol. 1991, 8, 359–369. [Google Scholar] [CrossRef]
- Tamas, A.; Holdsworth, R.E.; Underhill, J.R.; Tamas, D.M.; Dempsey, E.D.; McCarthy, D.J.; McCaffrey, K.J.W.; Selby, D. Correlating Deformation Events Onshore and Offshore in Superimposed Rift Basins: The Lossiemouth Fault Zone, Inner Moray Firth Basin, Scotland. Basin Res. 2022, 34, 1314–1340. [Google Scholar] [CrossRef]
- Thomson, K.; Underhill, J.R. Controls on the Development and Evolution of Structural Styles in the Inner Moray Firth Basin. PGC 1993, 4, 1167–1178. [Google Scholar] [CrossRef]
- Tamas, A.; Holdsworth, R.E.; Underhill, J.R.; Tamas, D.M.; Dempsey, E.D.; Hardman, K.; Bird, A.; McCarthy, D.; McCaffrey, K.J.W.; Selby, D. New Onshore Insights into the Role of Structural Inheritance during Mesozoic Opening of the Inner Moray Firth Basin, Scotland. J. Geol. Soc. 2022, 179, jgs2021-066. [Google Scholar] [CrossRef]
- Le Breton, E.; Cobbold, P.R.; Zanella, A. Cenozoic Reactivation of the Great Glen Fault, Scotland: Additional Evidence and Possible Causes. JGS 2013, 170, 403–415. [Google Scholar] [CrossRef]
- Dichiarante, A.M.; Holdsworth, R.E.; Dempsey, E.D.; Selby, D.; McCaffrey, K.J.W.; Michie, U.M.; Morgan, G.; Bonniface, J. New Structural and Re–Os Geochronological Evidence Constraining the Age of Faulting and Associated Mineralization in the Devonian Orcadian Basin, Scotland. JGS 2016, 173, 457–473. [Google Scholar] [CrossRef]
- Roberts, N.M.W.; Drost, K.; Horstwood, M.S.A.; Condon, D.J.; Chew, D.; Drake, H.; Milodowski, A.E.; McLean, N.M.; Smye, A.J.; Walker, R.J.; et al. Laser Ablation Inductively Coupled Plasma Mass Spectrometry (LA-ICP-MS) U–Pb Carbonate Geochronology: Strategies, Progress, and Limitations. Geochronology 2020, 2, 33–61. [Google Scholar] [CrossRef]
- Dichiarante, A.M.; Holdsworth, R.E.; Dempsey, E.D.; McCaffrey, K.J.W.; Utley, T.A.G. Outcrop-Scale Manifestations of Reactivation during Multiple Superimposed Rifting and Basin Inversion Events: The Devonian Orcadian Basin, Northern Scotland. JGS 2021, 178, jgs2020-089. [Google Scholar] [CrossRef]
- Johnstone, G.S.; Mykura, W. British Regional Geology. The Northern Highlands of Scotland, 4th ed.; British Geological Survey; Her Majesty’s Stationery Office: London, UK, 1989; Volume 2, ISBN 978-0-85272-465-1. [Google Scholar]
- Friend, P.F.; Williams, B.P.J.; Ford, M.; Williams, E.A. Kinematics and Dynamics of Old Red Sandstone Basins. SP 2000, 180, 29–60. [Google Scholar] [CrossRef]
- Seranne, M. Devonian Extensional Tectonics versus Carboniferous Inversion in the Northern Orcadian Basin. JGS 1992, 149, 27–37. [Google Scholar] [CrossRef]
- Duncan, W.I.; Buxton, N.W.K. New Evidence for Evaporitic Middle Devonian Lacustrine Sediments with Hydrocarbon Source Potential on the East Shetland Platform, North Sea. JGS 1995, 152, 251–258. [Google Scholar] [CrossRef]
- Woodcock, N.; Strachan, R. (Eds.) Geological History of Britain and Ireland, 1st ed.; Wiley: Hoboken, NJ, USA, 2012; ISBN 978-1-4051-9382-5. [Google Scholar]
- Trewin, N.H.; Thirlwall, M.F. Old Red Sandstone. In The Geology of Scotland; Geological Society: London, UK, 2002; pp. 213–249. [Google Scholar]
- Donovan, R.N.; Foster, R.J.; Westoll, T.S. 8.—A Stratigraphical Revision of the Old Red Sandstone of North-Eastern Caithness. Trans. R. Soc. Edinb. 1974, 69, 167–201. [Google Scholar] [CrossRef]
- Crampton, C.B.; Carruthers, R.G. Geological Map, Latheron, Scotland Sheet 110, 1:50.000 1985; Her Majesty’s Stationery Office: London, UK, 1914. [Google Scholar]
- Trewin, N.H. The Triassic and Lower Jurassic of Golspie. In Excursion Guide to the Geology of East Sutherland and Caithness; Trewin, N.H., Hurst, A.R., Eds.; Dunedin Academic Press: Edinburgh, UK, 2009; Volume 147, pp. 798–799. ISBN 978-1-906716-01-1. [Google Scholar]
- Fletcher, T.P.; Auton, C.A.; Highton, A.J.; Merritt, J.W.; Robertson, S.; Rollin, K.E.; Graham, C.C.; Robins, N.S. Geology of Fortrose and Eastern Inverness District: Memoir for 1:50000 Geological Sheet 84W (Scotland); Memoirs of the Geological Survey of Great Britain (Scotland) (Sheet); HMSO: London, UK, 1996. [Google Scholar]
- Dewey, J.F.; Strachan, R.A. Changing Silurian–Devonian Relative Plate Motion in the Caledonides: Sinistral Transpression to Sinistral Transtension. JGS 2003, 160, 219–229. [Google Scholar] [CrossRef]
- Watts, L.M.; Holdsworth, R.E.; Sleight, J.A.; Strachan, R.A.; Smith, S.A.F. The Movement History and Fault Rock Evolution of a Reactivated Crustal-Scale Strike-Slip Fault: The Walls Boundary Fault Zone, Shetland. JGS 2007, 164, 1037–1058. [Google Scholar] [CrossRef]
- Wilson, R.W.; Holdsworth, R.E.; Wild, L.E.; McCaffrey, K.J.W.; England, R.W.; Imber, J.; Strachan, R.A. Basement-Influenced Rifting and Basin Development: A Reappraisal of Post-Caledonian Faulting Patterns from the North Coast Transfer Zone, Scotland. SP 2010, 335, 795–826. [Google Scholar] [CrossRef]
- Enfield, M.A.; Coward, M.P. The Structure of the West Orkney Basin, Northern Scotland. JGS 1987, 144, 871–884. [Google Scholar] [CrossRef]
- Underhill, J.R.; Brodie, J.A. Structural Geology of Easter Ross, Scotland: Implications for Movement on the Great Glen Fault Zone. JGS 1993, 150, 515–527. [Google Scholar] [CrossRef]
- Parnell, J.; Carey, P.; Monson, B. Timing and Temperature of Decollement on Hydrocarbon Source Rock Beds in Cyclic Lacustrine Successions. Palaeogeogr. Palaeoclimatol. Palaeoecol. 1998, 140, 121–134. [Google Scholar] [CrossRef]
- Armitage, T.B.; Watts, L.M.; Holdsworth, R.E.; Strachan, R.A. Late Carboniferous Dextral Transpressional Reactivation of the Crustal-Scale Walls Boundary Fault, Shetland: The Role of Pre-Existing Structures and Lithological Heterogeneities. JGS 2021, 178, jgs2020-078. [Google Scholar] [CrossRef]
- Coward, M.P.; Enfield, M.A.; Fischer, M.W. Devonian Basins of Northern Scotland: Extension and Inversion Related to Late Caledonian—Variscan Tectonics. SP 1989, 44, 275–308. [Google Scholar] [CrossRef]
- Dichiarante, A.M.; McCaffrey, K.J.W.; Holdsworth, R.E.; Bjørnarå, T.I.; Dempsey, E.D. Fracture Attribute Scaling and Connectivity in the Devonian Orcadian Basin with Implications for Geologically Equivalent Sub-Surface Fractured Reservoirs. Solid Earth 2020, 11, 2221–2244. [Google Scholar] [CrossRef]
- Tamas, A.; Holdsworth, R.E.; Tamas, D.M.; Dempsey, E.D.; Hardman, K.; Bird, A.; Roberts, N.M.W.; Lee, J.K.; Underhill, J.R.; McCarthy, D.J.; et al. Older than You Think: Using U-Pb Calcite Geochronology to Better Constrain Basin-Bounding Fault Reactivation, Inner Moray Firth Basin, W North Sea 2023. in review.
- Allmendinger, R.W.; Cardozo, N.C.; Fisher, D.M. Structural Geology Algorithms | Structural Geology, Tectonics and Geodynamics; Cambridge University Press: Cambridge, UK, 2012; ISBN 978-1-107-40138-9. [Google Scholar]
- Cardozo, N.; Allmendinger, R.W. Spherical Projections with OSXStereonet. Comput. Geosci. 2013, 51, 193–205. [Google Scholar] [CrossRef]
- Wallace, R.E. Geometry of Shearing Stress and Relation to Faulting. J. Geol. 1951, 59, 118–130. [Google Scholar] [CrossRef]
- Bott, M.H.P. The Mechanics of Oblique Slip Faulting. Geol. Mag. 1959, 96, 109–117. [Google Scholar] [CrossRef]
- Angelier, J. Inversion of Field Data in Fault Tectonics to Obtain the Regional Stress-III. A New Rapid Direct Inversion Method by Analytical Means. Geophys. J. Int. 1990, 103, 363–376. [Google Scholar] [CrossRef]
- Sasvári, Á.; Baharev, A. SG2PS (Structural Geology to Postscript Converter)—A Graphical Solution for Brittle Structural Data Evaluation and Paleostress Calculation. Comput. Geosci. 2014, 66, 81–93. [Google Scholar] [CrossRef]
- McCaffrey, K.J.W.; Jones, R.R.; Holdsworth, R.E.; Wilson, R.W.; Clegg, P.; Imber, J.; Holliman, N.; Trinks, I. Unlocking the Spatial Dimension: Digital Technologies and the Future of Geoscience Fieldwork. J. Geol. Soc. 2005, 162, 927–938. [Google Scholar] [CrossRef]
- Weismüller, C.; Urai, J.L.; Kettermann, M.; von Hagke, C.; Reicherter, K. Structure of Massively Dilatant Faults in Iceland: Lessons Learned from High-Resolution Unmanned Aerial Vehicle Data. Solid Earth 2019, 10, 1757–1784. [Google Scholar] [CrossRef]
- Tamas, D.M.; Tamas, A.; Barabasch, J.; Rowan, M.; Schleder, Z.; Krézsek, C.; Urai, J. Low-Angle Shear within the Exposed Manzalesti Diapir, Romania: Salt Decapitation in the Eastern Carpathians Fold-and-Thrust Belt. Tectonics 2021, 40, e2021TC006850. [Google Scholar] [CrossRef]
- Adamuszek, M.; Tămaş, D.M.; Barabasch, J.; Urai, J.L. Rheological Stratification in Impure Rock Salt during Long-Term Creep: Morphology, Microstructure, and Numerical Models of Multilayer Folds in the Ocnele Mari Salt Mine, Romania. Solid Earth 2021, 12, 2041–2065. [Google Scholar] [CrossRef]
- Roberts, N.M.W.; Holdsworth, R.E. Timescales of Faulting through Calcite Geochronology: A Review. J. Struct. Geol. 2022, 158, 104578. [Google Scholar] [CrossRef]
- Holdsworth, R.E.; McCaffrey, K.J.W.; Dempsey, E.; Roberts, N.M.W.; Hardman, K.; Morton, A.; Feely, M.; Hunt, J.; Conway, A.; Robertson, A. Natural Fracture Propping and Earthquake-Induced Oil Migration in Fractured Basement Reservoirs. Geology 2019, 47, 700–704. [Google Scholar] [CrossRef]
- Vermeesch, P. IsoplotR: A Free and Open Toolbox for Geochronology. Geosci. Front. 2018, 9, 1479–1493. [Google Scholar] [CrossRef]
- Fazlikhani, H.; Aagotnes, S.S.; Refvem, M.A.; Hamilton-Wright, J.; Bell, R.E.; Fossen, H.; Gawthorpe, R.L.; Jackson, C.A.-L.; Rotevatn, A. Strain Migration during Multiphase Extension, Stord Basin, Northern North Sea Rift. Basin Res 2021, 33, 1474–1496. [Google Scholar] [CrossRef]
- Utley, T.A.G. Basement-Cover Relationships and Regional Structure in the Transtensional Orcadian Basin. Ph.D. Thesis, Durham University, Durham, UK, 2020. [Google Scholar]
Disclaimer/Publisher’s Note: The statements, opinions and data contained in all publications are solely those of the individual author(s) and contributor(s) and not of MDPI and/or the editor(s). MDPI and/or the editor(s) disclaim responsibility for any injury to people or property resulting from any ideas, methods, instructions or products referred to in the content. |
© 2023 by the authors. Licensee MDPI, Basel, Switzerland. This article is an open access article distributed under the terms and conditions of the Creative Commons Attribution (CC BY) license (https://creativecommons.org/licenses/by/4.0/).