Article

Assessment of GCOM-C Satellite Imagery in Bloom Detection: A Case Study in the East China Sea

1
School of Geography Science and Geomatics Engineering, Suzhou University of Science and Technology, Suzhou 215009, China
2
Key Laboratory of Marine Ecosystem Dynamics, Second Institute of Oceanography, Ministry of Natural Resources, Hangzhou 310012, China
3
College of Marine Ecology and Environment, Shanghai Ocean University, Shanghai 201306, China
4
State Key Laboratory of Satellite Ocean Environment Dynamics, Second Institute of Oceanography, Ministry of Natural Resources, Hangzhou 310012, China
5
National Satellite Ocean Application Service, Ministry of Natural Resources of the People’s Republic of China, Beijing 100081, China
*
Author to whom correspondence should be addressed.
Remote Sens. 2023, 15(3), 691; https://doi.org/10.3390/rs15030691
Submission received: 29 November 2022 / Revised: 17 January 2023 / Accepted: 18 January 2023 / Published: 24 January 2023
(This article belongs to the Special Issue Remote Sensing for Monitoring Harmful Algal Blooms)

Abstract

:
The coast of the East China Sea (ECS) is one of the regions most frequently affected by harmful algal blooms in China. Remote sensing monitoring could assist in understanding the mechanism of blooms and their associated environmental changes. Based on imagery from the Second-Generation Global Imager (SGLI) conducted by Global Change Observation Mission-Climate (GCOM-C) (Japan), the accuracy of satellite measurements was initially validated using matched pairs of satellite and ground data relating to the ECS. Additionally, using SGLI data from the coast of the ECS, we compared the applicability of three bloom extraction methods: spectral shape, red tide index, and algal bloom ratio. With an RMSE of less than 25%, satellite data at 490 nm, 565 nm, and 670 nm showed good consistency with locally measured remote sensing reflectance data. However, there was unexpected overestimation at 443 nm of SGLI data. By using a linear correction method, the RMSE at 443 nm was decreased from 27% to 17%. Based on the linear corrected SGLI data, the spectral shape at 490 nm was found to provide the most satisfactory results in separating bloom and non-bloom waters among the three bloom detection methods. In addition, the capability in harmful algae distinguished using SGLI data was discussed. Both of the Bloom Index method and the green-red Spectral Slope method were found to be applicable for phytoplankton classification using SGLI data. Overall, the SGLI data provided by GCOM-C are consistent with local data and can be used to identify bloom water bodies in the ECS, thereby providing new satellite data to support monitoring of bloom changes in the ECS.

1. Introduction

Anomalous aggregation of phytoplankton, known as a bloom event, has negative impacts on the coastal fishing industry and marine ecosystems. According to previous research, bloom frequency has increased in recent decades because of excess nutrients input resulting from human activities [1,2,3,4]. The East China Sea (ECS), one of China’s most important marginal seas, is abundant in fishery resources. Because of the interaction of freshwater from the Yangtze River, the Taiwan Warm Current, the Kuroshio Current, and monsoons, this region is favorable for growth of phytoplankton and is consequently susceptible to occurrence of blooms [5,6]. In the past decade, there have been numerous reports of Prorocentrum donghaiense blooms, which are known to have harmful impacts on marine ecosystem health by causing mortality of fishes and other marine organisms [7,8,9]. Comprehensive and detailed monitoring, including both spatial and temporal distribution of blooms, can assist in understanding the occurrence and evolution of blooms and also clarify the distribution characteristics of blooms in the ECS.
In general, bloom waters exhibit increased chlorophyll concentrations, with strong reflectance peaks in the green and red wavebands, as well as considerable changes in absorption and scattering properties [10,11,12]. Bloom detection methods based on remote sensing techniques have, therefore, been established using the distinct remote sensing reflectance R r s λ characteristic of bloom waters. At present, there are several methods for bloom detection using satellite imagery, including methods based on anomalous chlorophyll a concentration (Chl-a), R r s λ spectrum variation, and the inherent optical properties of blooms.
Based on anomalous Chl-a in bloom waters, Stumpf et al. (2003) [13] detected Karenia brevis blooms in the Gulf of Mexico using Chl-a data derived from SeaWiFS; Sun et al. (2012) [14] extracted blooms along the ECS coast using MODIS data by comparing the Chl-a with the monthly averaged value; He et al. (2013) [1] explored the long-term bloom changes in the ECS using satellite-derived Chl-a data with a threshold of 10µg/L. However, Chl-a-based approaches remain challenging in coastal regions because satellite estimations of Chl-a are often overestimates because of high levels of resuspended sediments and colored dissolved organic matter in nearshore areas [15,16]. Further, these approaches may fail if the phytoplankton cells have a low Chl-a content. Consequently, when using Chl-a as a bloom indicator, false-positive detections may occur in coastal regions.
Other studies have been conducted that directly apply the R r s λ spectrum rather than the satellite-derived Chl-a. Lou et al. (2014) [17] developed an improved red tide index (RI) for bloom detection in ECS by utilizing Geostationary Ocean Color Imager (GOCI) imagery; Tao et al. (2015) [18] successfully extracted P. donghaiense and diatom bloom waters in the ECS using the algal bloom ratio ( R a b ) with Moderate Resolution Imaging Spectroradiometer (MODIS) satellite data; Shin et al. (2018) [19] extracted Margalefidinium bloom waters by calculating the spectral slope change at 490 nm and successfully applied to GOCI, Sentinel-3 Ocean, Land Color Instrument (OLCI), and Landsat Operational Land Imager (OLI) data. Other algorithms also detect bloom species by utilizing the inherent optical features of phytoplankton. Shang et al. (2014) [11] distinguished P. donghaiense and diatom blooms in the ECS using MODIS data by taking advantage of the higher absorption coefficient at 443 nm in P. donghaiense bloom waters; Cannizzaro et al. (2008) [20] detected Karenia brevis blooms in the Gulf of Mexico using the lower particle backscattering signal of bloom waters on MODIS imagery; Shen et al. (2019) [9] used Medium Resolution Imaging Spectrometer (MERIS) imagery to differentiate P. donghaiense and diatom blooms by analyzing the absorption spectrum of algae species at green–red bands; Qi et al. (2019) [21] detected Noctiluca scintillans blooms in the ECS based on its distinctive absorption and scattering properties using MODIS data from 2000 to 2017.
In summary, various approaches based on specific ocean color satellites have been developed. However, applicability of different bloom identification methods varies across study regions, as does efficiency of one bloom extraction approach on a different sensor. As a result, it is necessary to validate and analyze input threshold values and extraction results using historical field bloom data when applied on different satellites.
In December 2017, Japan launched the Global Change Observation Mission-Climate (GCOM-C) satellite with the Second-Generation Global Imager (SGLI) sensor, which provides spectral data in 19 channels ranging from near-ultraviolet to thermal infrared (380 nm–12 m) with a bandwidth of 10 nm and a temporal resolution of 1–2 days. The visible bands are 412 nm, 443 nm, 490 nm, 530 nm, 565 nm, and 670 nm, respectively. It is known that various phytoplankton have distinct spectral differences in the blue–green bands of R r s λ ; thus, species such as diatoms or dinoflagellates can be differentiated based on spectral morphology of satellite R r s λ [12,22,23]. Therefore, inclusion of a band at 530 nm is critical for bloom monitoring and algae species classification.
In this study, we evaluated the SGLI data for detecting blooms along the coast of the ECS with three objectives. The first task was to validate satellite R r s λ data by comparing them to in situ measured R r s λ data because accuracy of satellite data is crucial to reliability of bloom detection results. The second objective was to evaluate the applicability of bloom extraction using SGLI data by comparing various bloom detection methods. On this basis, the effect of different remote sensing techniques for distinguishing harmful algae in the ECS based on SGLI images was also discussed.

2. Materials and Methods

2.1. Study Area and Bloom Records

The study area covers the northwestern part of the East China Sea, including the mouth of the Yangtze River, Hangzhou Bay, and Zhejiang Coast (27°N–32°N, 120°E–123°E) (see Figure 1). The study area is located in a subtropical region with frequent monsoon activities, abundant precipitation, and temperature and humidity conditions that make it a "high-risk" location for bloom disasters. Since 2011, outbreaks of P. donghaiense bloom have occurred frequently along the ECS coast. The deterioration of water quality and the decrease of dissolved oxygen in the water during bloom periods have seriously affected the coastal ecological health. In this study, bloom records for the study area from 2019 to 2020 were collected from the Wenzhou Marine Environmental Monitoring Center Station of State Oceanic Administration (China) and the China Marine Disaster Bulletin (https://www.nmdis.org.cn/hygb/zghyzhgb/, accessed on 18 January 2018, in Chinese). The bloom records were used as the ground truth for comparison of bloom detection methods. The data include information such as bloom location, occurrence time, and algal species (Table 1). As a result of a lack of in situ measured R r s λ data for bloom waters, satellite R r s λ was matched with the bloom locations to assess the performance of the bloom detection methods. Details regarding the matching methods can be found in Section 2.3.

2.2. In Situ R r s λ

From September 2019 to September 2021, in situ measured R r s λ data were collected from the Dongou Ocean Observing Platform (27.675°N, 121.355°E, indicated by a red star in Figure 1). The observation platform was constructed as part of the Dongou Comprehensive Ocean Observation Platform Project, which was managed by the Wenzhou Marine Environment Monitoring Center of the State Oceanic Administration (China). The observation platform combines the functions of marine observation, instrument experiments, and scientific research. The implementation of the platform is significant in terms of improving observation ability relating to marine hazards and providing comprehensive coverage of major marine disasters along the ECS.
The offshore observation platform employs a Sea-Viewing Wide Field-of-View Sensor Photometer Revision for Incident Surface Measurements (SeaPRISM) autonomous measurement system, with measurements every 30 min from 8:00 am to 4:00 pm each day. The system collects radiometric data from the water surface and sky. After processing to obtain the normalized water-leaving radiance L w n , it is divided by the solar irradiance ( F 0 ) in the corresponding band to obtain the remote sensing reflectance R r s λ . The SeaPRISM system comprises 11 upper spectrum observation channels ranging from 400 nm to 1020 nm. To assess the accuracy of satellite GCOM-C, local measured R r s λ data at the central wavelengths of 412 nm, 443 nm, 490 nm, 560 nm, and 667 nm were collected corresponding with the bands of SGLI data.

2.3. SGLI Imagery Processing

The purpose of the Global Change Observation Mission-Climate (GCOM-C) project is to conduct long-term worldwide observations of the Earth’s environment. The GCOM-C is expected to play an important role in monitoring both global water circulation and climate change from space. The Second-Generation Global Imager (SGLI) carried on the GCOM-C conducts observations related to land, ocean, cryosphere, atmosphere, and so on (details of SGLI data are summarized in Table 2). Of the SGLI visible channels, 490 nm, 565 nm, and 670 nm are high signal-to-noise channels for retrieval of ocean color variables, such as Chl-a, total suspended matter, and gelbstoff [24].
The SGLI provides three levels of data: L1, L2, and L3. Among them, L2 and L3 can provide radiometer products with a spatial resolution of 250 m, and ocean water color product data with a spatial resolution of 1 km, respectively. The SGLI products were downloaded via FTP from the Satellite Monitoring for Environmental Studies (JASMES) data center of the Japan Aerospace Exploration Agency (ftp.gportal.jaxa.jp, accessed on 18 January 2018).
Specifically, the L2 data contain three radiometer products: normalized water leaving radiance n L w at 380–670 nm, aerosol optical thickness (AOT) at 670–865 nm, and photosynthetically available radiation (PAR). The SGLI ocean color atmospheric correction algorithm is basically same as those of MODIS and VIIRS [25] (the details could be checked at https://suzaku.eorc.jaxa.jp/GCOM_C/data/, accessed on 18 January 2018). Specifically, the n L w is derived by correcting the directional dependency of in-water and water-surface reflectance using the Look Up Table (LUT) developed by Morel and Maritorena (2001) [26]. In the L3 data, the satellite Chl-a product was derived using the OCx algorithm with an empirical exponential power algorithm for the remote sensing reflectance ratio in the blue–green band (details of SGLI Chl-a retrieval can be found in Murakami, 2020 [27]).
To obtain the satellite R r s λ , the n L w data in L2 were converted to R r s λ using the following Equation (1):
R r s λ i = D N × R r s _ s l o p e λ i + R r s _ o f f s e t λ i
Here, R r s λ i denotes the remote sensing reflectance of band i; DN denotes the n L w value; R r s _ s l o p e λ i and R r s _ o f f s e t λ i denote the slope and intercept, respectively, when transferring the n L w value to satellite R r s λ of band i. The conversion parameters for the different bands can be found in the SGLI attributes file.
The SGLI satellite images obtained in this study were divided into two parts. The first part of the data was used to verify the satellite R r s λ accuracy, and the second part was used to compare the effectiveness of bloom detection methods in the ECS.
The first part of the satellite data was chosen based on the in situ measured R r s λ by Dongou Observation Platform with a time window of ±1 h. Because the spatial reference of the original SGLI L2 images is a user-defined geographic coordinate system, it cannot be spatially matched with the local measured R r s λ data. Therefore, the original image data were converted to a projection of equal longitude and latitude with WGS84 using MATLAB 2021b. In addition, the SGLI data were checked using the satellite flag attribute data to eliminate abnormal or invalid pixels (conditions such as haze cover, atmospheric correction errors, etc.). Then, the nearest neighbor pixels were selected to be matched with the local R r s λ data using a 3 × 3 pixels window. The pixel closest to the target location was chosen if there were invalid satellite pixels in the local measurement. Finally, 32 pairs of satellite R r s λ data were matched with the local observations for the satellite R r s λ accuracy assessment. To evaluate the accuracy of SGLI R r s λ , the coefficient of determination (R2), root mean square error (RMSE), and mean absolute percentage error (MAPE) were calculated. R2 was used to measure the consistency of variation between satellite data and local measured data; RMSE was used to evaluate the uncertainty of satellite data; MAPE was used to evaluate the deviation of satellite data from local measured data. R2 was obtained by linear regression from the matched pairs of satellite and in situ measured data. The RMSE and MAPE were defined as follows:
R M S E = i = 1 N y s a t e l l i t e y i n s i t u 2 N
M A P E = 100 % N i = 1 N y s a t e l l i t e y i n s i t u y i n s i t u
where y s a t e l l i t e and y i n s i t u denote the satellite-derived and local measured R r s λ data, respectively. N represents the number of matched pairs.
For the comparison of bloom detection methods, another set of SGLI L2 images were processed to collect the satellite R r s λ during local bloom surveys in 2020 (Table 1). The SGLI L2 R r s λ data were matched with the bloom occurrence locations using a time window of ± 2 h. Finally, five pairs of matched R r s λ from P. Donghaiense bloom locations were obtained (from four SGLI images). In addition, four pairs of satellite R r s λ data on non-bloom days (14 April 2020) were chosen to assess the ability of bloom detection methods to differentiate bloom waters from turbid or clear waters. To analyze the spatial distribution extracted by different bloom detection methods, three additional SGLI images were also processed using the R r s λ conversion method mentioned above (including SGLI images on 24 May 2019; 29 April 2020; 7 June 2021).

2.4. Bloom Detection Methods

Algal blooms are commonly accompanied by accumulation of pigments, resulting in strong absorption in the range of blue to green bands. In contrast, turbid water scatters light at all visible bands, whereas clear water absorbs light at all wavebands [28,29]. These features enable detection of bloom waters via satellite R r s λ . In this study, three existing approaches, the spectral shape (SS) algorithms [30], the red tide index (RI) [17], and the algal bloom ratio ( R a b ) [18], were compared for their ability to detect blooms using SGLI data. The SS algorithms are defined methods as shown below:
S p e c t r a l   S h a p e   S S = R r s λ R r s λ R r s λ + R r s λ × λ λ ( λ + λ )
where λ denotes the position of the central band; λ and λ+ denote the positions of the two bands closest to the central band; and R r s λ , R r s λ , and R r s λ + correspond to the remotely sensed reflectance on band positions. Based on the spectral characteristics of the SGLI data in the blue–green band, calculation of spectral shapes was performed on 490 nm and 530 nm. A pixel was flagged as bloom water when SS(490) < 0 or SS(530) < 0.
The RI and R a b are defined by the satellite R r s λ in the blue and green bands as follows:
R I = R r s 550 R r s 443 R r s 490 R r s 443
R a b = R r s 550 R r s 531  
where R r s 443 , R r s 490 , R r s 531 , and R r s 550 denote the remote sensing reflectance at 443 nm, 490 nm, 530 nm, and 550 nm of satellite data, respectively. It should be noted that R r s 565 and R r s 530 were used instead of R r s 550 and R r s 530 to match the wavebands in SGLI data. A pixel was flagged as bloom water when RI > 2.8 or R a b > 1.25 [17,18]. Furthermore, the R a b algorithm excluded turbid water by judging the distribution range of the green band as follows: (1) if R r s 555 < 0.014 sr−1, the R a b is calculated to determine the location of blooms; (2) if R r s 555 > 0.014 sr−1, it is directly flagged as turbid water. Because SGLI lacks the 555 nm band, the R r s 555 was replaced by R r s 565 from the SGLI data.
Following the comparison of bloom detection methods, species identification of P. donghaiense and diatom blooms using SGLI data were investigated using the bloom index (BI) and a green-red spectral shape ( R s l o p e ) algorithms (developed by Shang et al. (2014) [11] and Shen et al. (2019) [9], respectively). The algorithms were described as follows:
(1)
If 0 < BI = R r s 488 R r s 443 / 488 443 R r s 555 R r s 531 / 555 531 < 0.3, the pixel was classified as P. donghaiense bloom water or diatom bloom water.
(2)
If R s l o p e = t a n 1 ( 100 × 1 R r s 667 R r s 550 / 667 550 > 0.4, the pixel was classified as P. donghaiense bloom water or diatom bloom water.
Note that the R r s 488 , R r s 531 , R r s 555 , and R r s 667 in the equations of BI and R s l o p e were replaced as R r s 490 , R r s 530 , R r s 565 , and R r s 670 , respectively. The BI method was developed to describe the steep slope of R r s λ in the blue–green bands based on the strong pigment absorption of P. donghaiense bloom waters. Satellite pixels with a BI range of 0–0.3 were classified as P. donghaiense bloom waters. The R s l o p e was calculated to represent the R r s (λ) variation in spectral morphology in the green–red band, and a pixel with R s l o p e > 0.4 was considered to have a high probability of P. donghaiense bloom occurrence.

3. Results

3.1. Validation of SGLI R r s λ

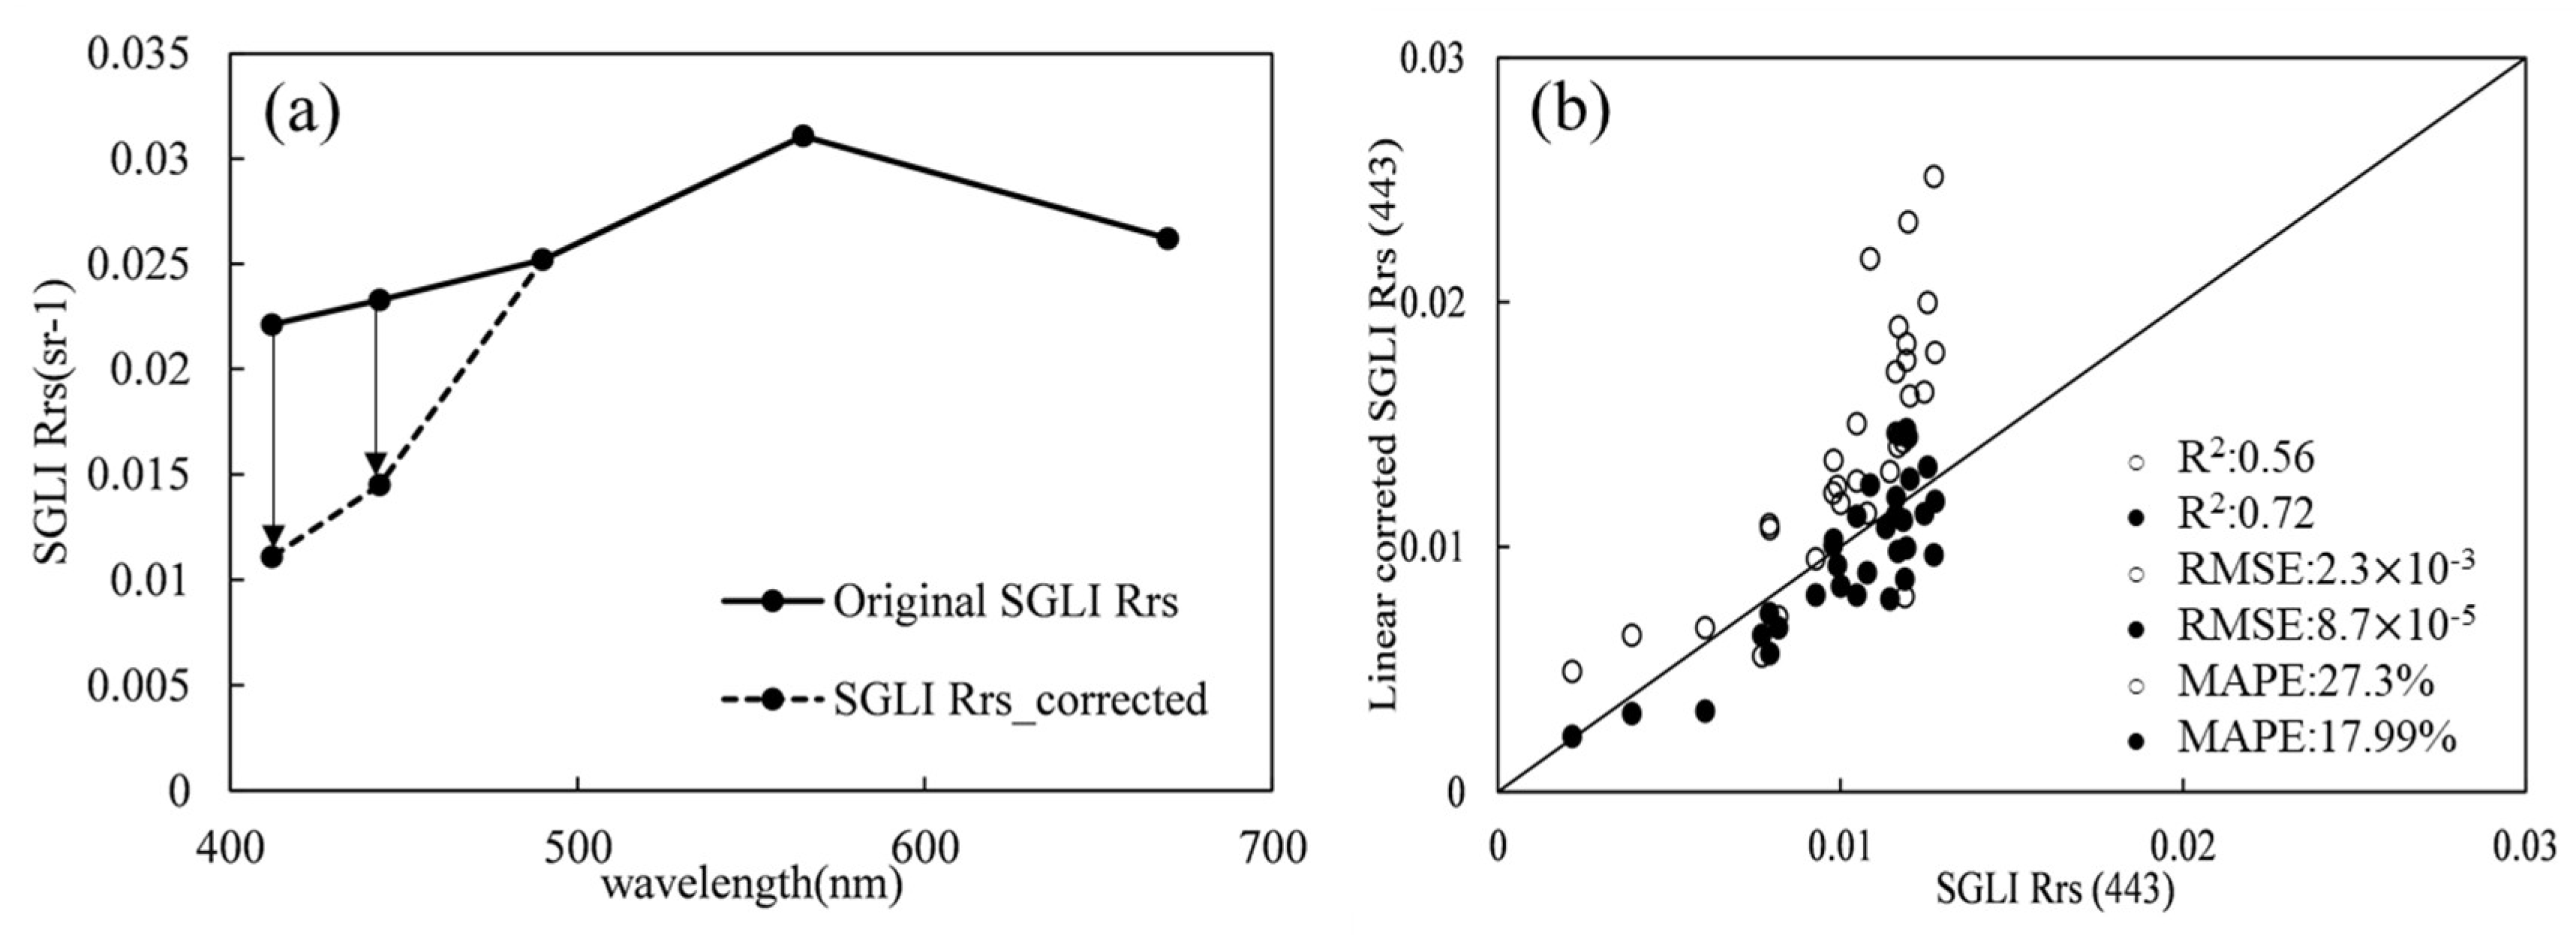
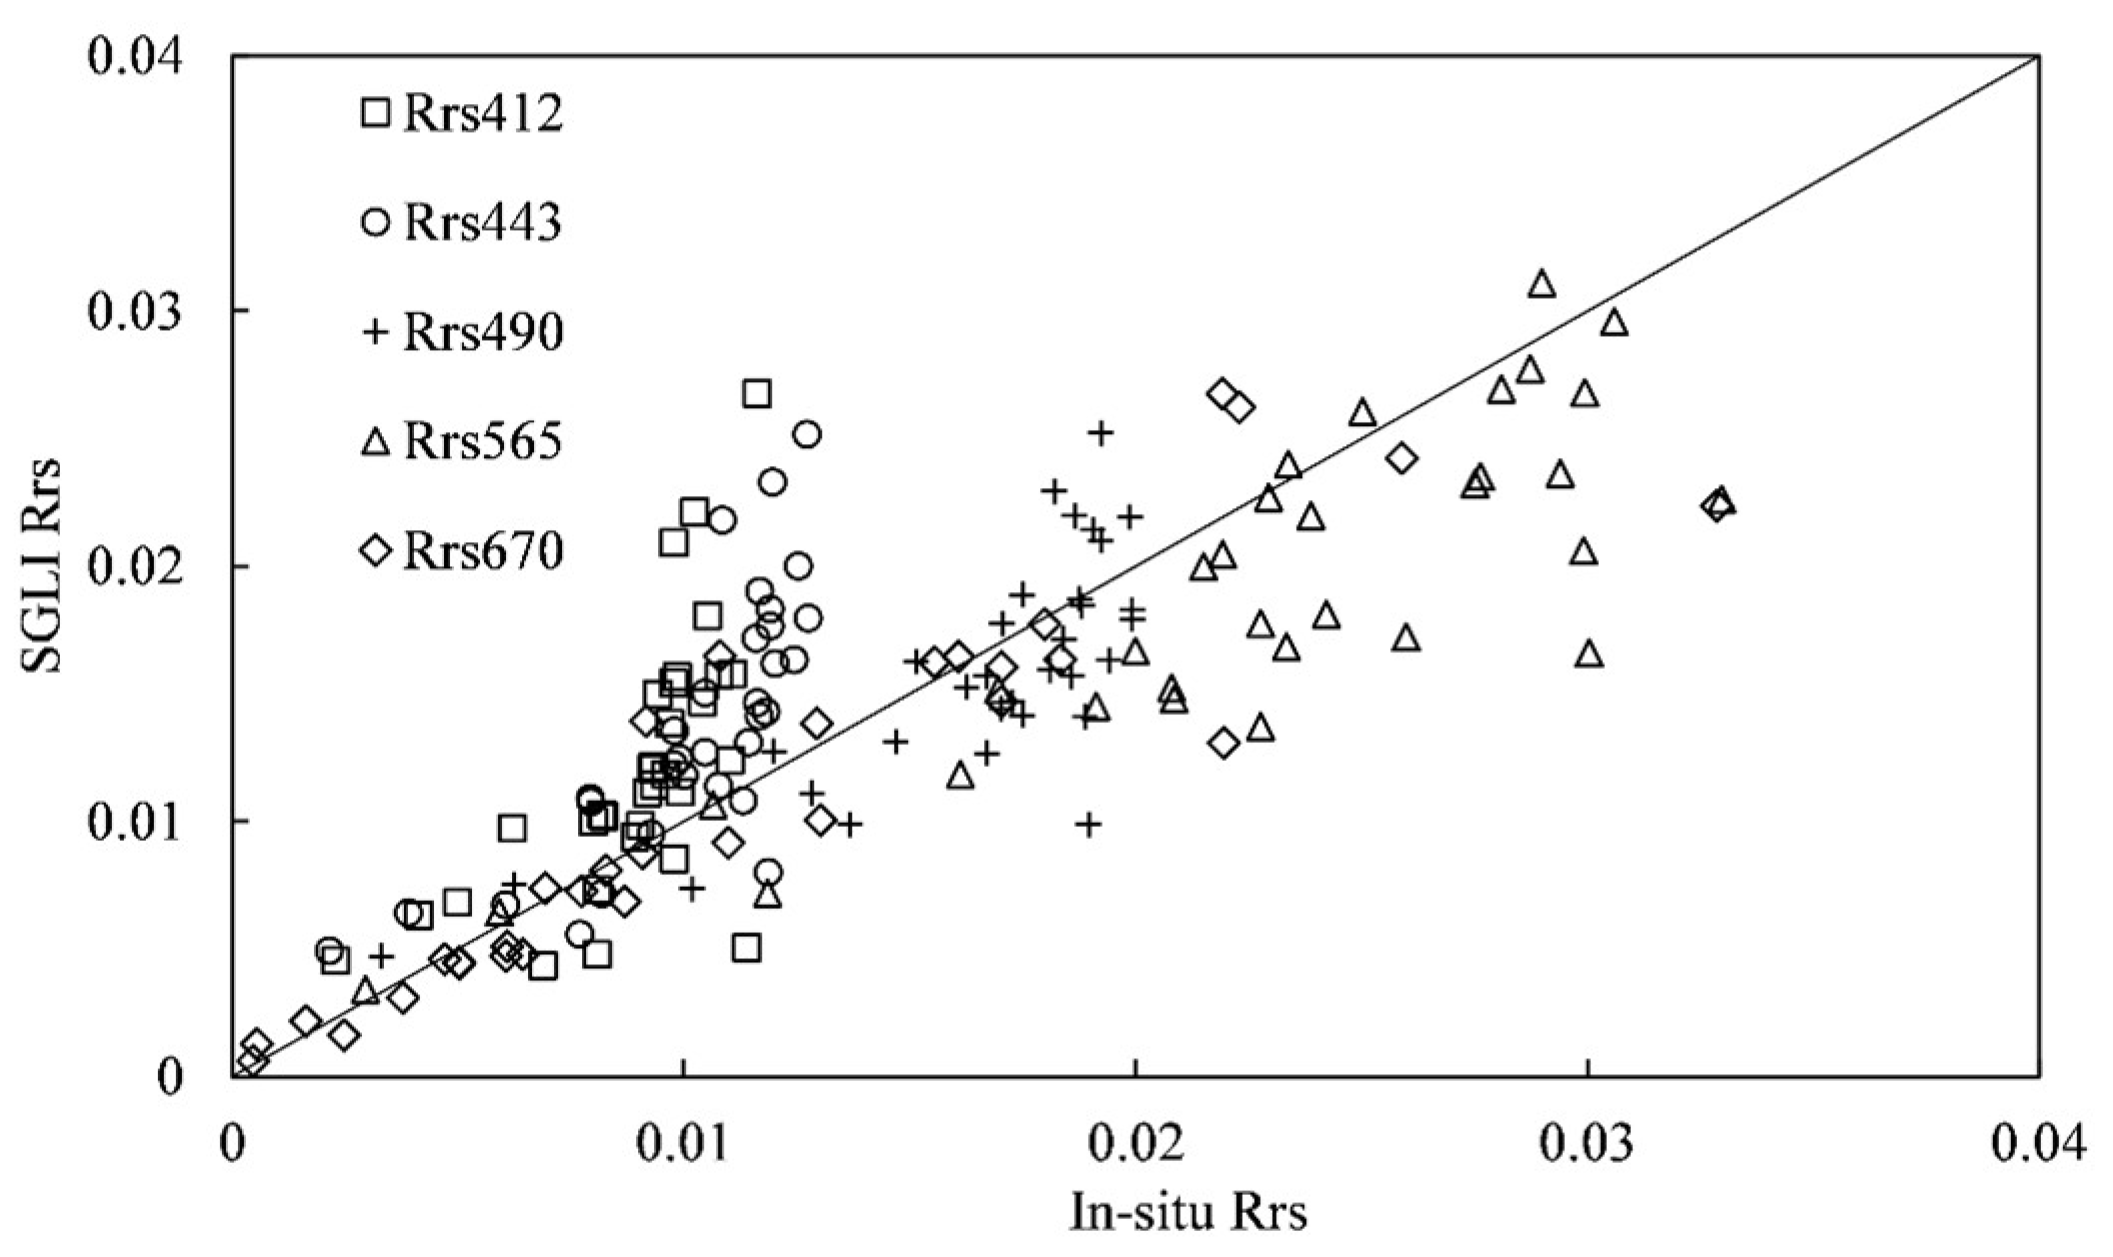
Figure 2 shows the performance of SGLI R r s λ data compared with local measurements. The accuracy of satellite R r s λ varied across bands. The lowest R2 was found at 412 nm and the highest at 670 nm. The short bands of 412 nm and 443 nm were significantly overestimated, whereas the SGLI data at 490 nm, 565 nm, and 670 nm showed a better correlation with in situ R r s λ , with the data concentrated at the 1:1 line. The MAPE in each band was 33.01% (412 nm), 27.3% (443 nm), 18.02% (490 nm), 24.26% (565 nm), and 20.67% (670 nm), respectively (Table 3). Because the 443 nm band is important for determining bloom waters when using the bloom detection methods, as mentioned in Section 2.4, the SGLI R r s λ at this band was further corrected using a linear correction method based on in situ R r s λ measurement.
Because there was a good correlation at 565 nm between satellite R r s λ and in situ data (as shown in Table 3), satellite R r s 412 was rebuilt using the linear relationship between 412 nm and 565 nm from local measurements. Thus, the error of satellite R r s 412 could be calculated as the difference between linear retrieved R r s 412 and satellite R r s 412 . Then, the error of satellite R r s 443 could be calculated from the linear function between 412 nm and 443 nm. In detail, the linear corrected reflectance at 412 nm was obtained as follows:
R r s L C 412 = 0.3811 × R r s S G L I 565
Here, R r s L C 412 denotes the linearly corrected remote sensing reflectance at 412 nm; R r s S G L I 565 denotes the remote sensing reflectance of SGLI satellite data at 565 nm. The parameter 0.3811 is empirically derived from the linear relationship between in situ R r s 412 and R r s 565 . The remote sensing reflectance at 443 nm is then rectified by the corrected R r s L C 412 as:
R r s _ L C 443 = R r s _ S G L I 443 + ( R r s _ L C 412 R r s S G L I 412 ) × 565 443 565 412
Here, R r s _ L C 443 denotes the corrected SGLI R r s 443 ; R r s _ L C 412 and R r s S G L I 412 denote the linear corrected R r s 412 and the original satellite R r s 412 , respectively. By Figure 3, it was shown that the overestimation of SGLI R r s 443 is suppressed after linear correction. The MAPE is reduced from 27.3% to 17.99%, and the RMSE is reduced from 2.3 × 10⁻³ to 8.7 × 10⁻⁵. It should be noted that the observation platform is located near the area where bloom occurs frequently, and some of the matched data were acquired during the bloom period. Therefore, it is believed that this linear correction method is also suitable for correction of SGLI R r s 443 for bloom waters. The corrected SGLI R r s 443 was then used in place of the original data to analyze the performance of bloom detection methods in the following step.

3.2. Bloom Detection Based on Matched Pairs

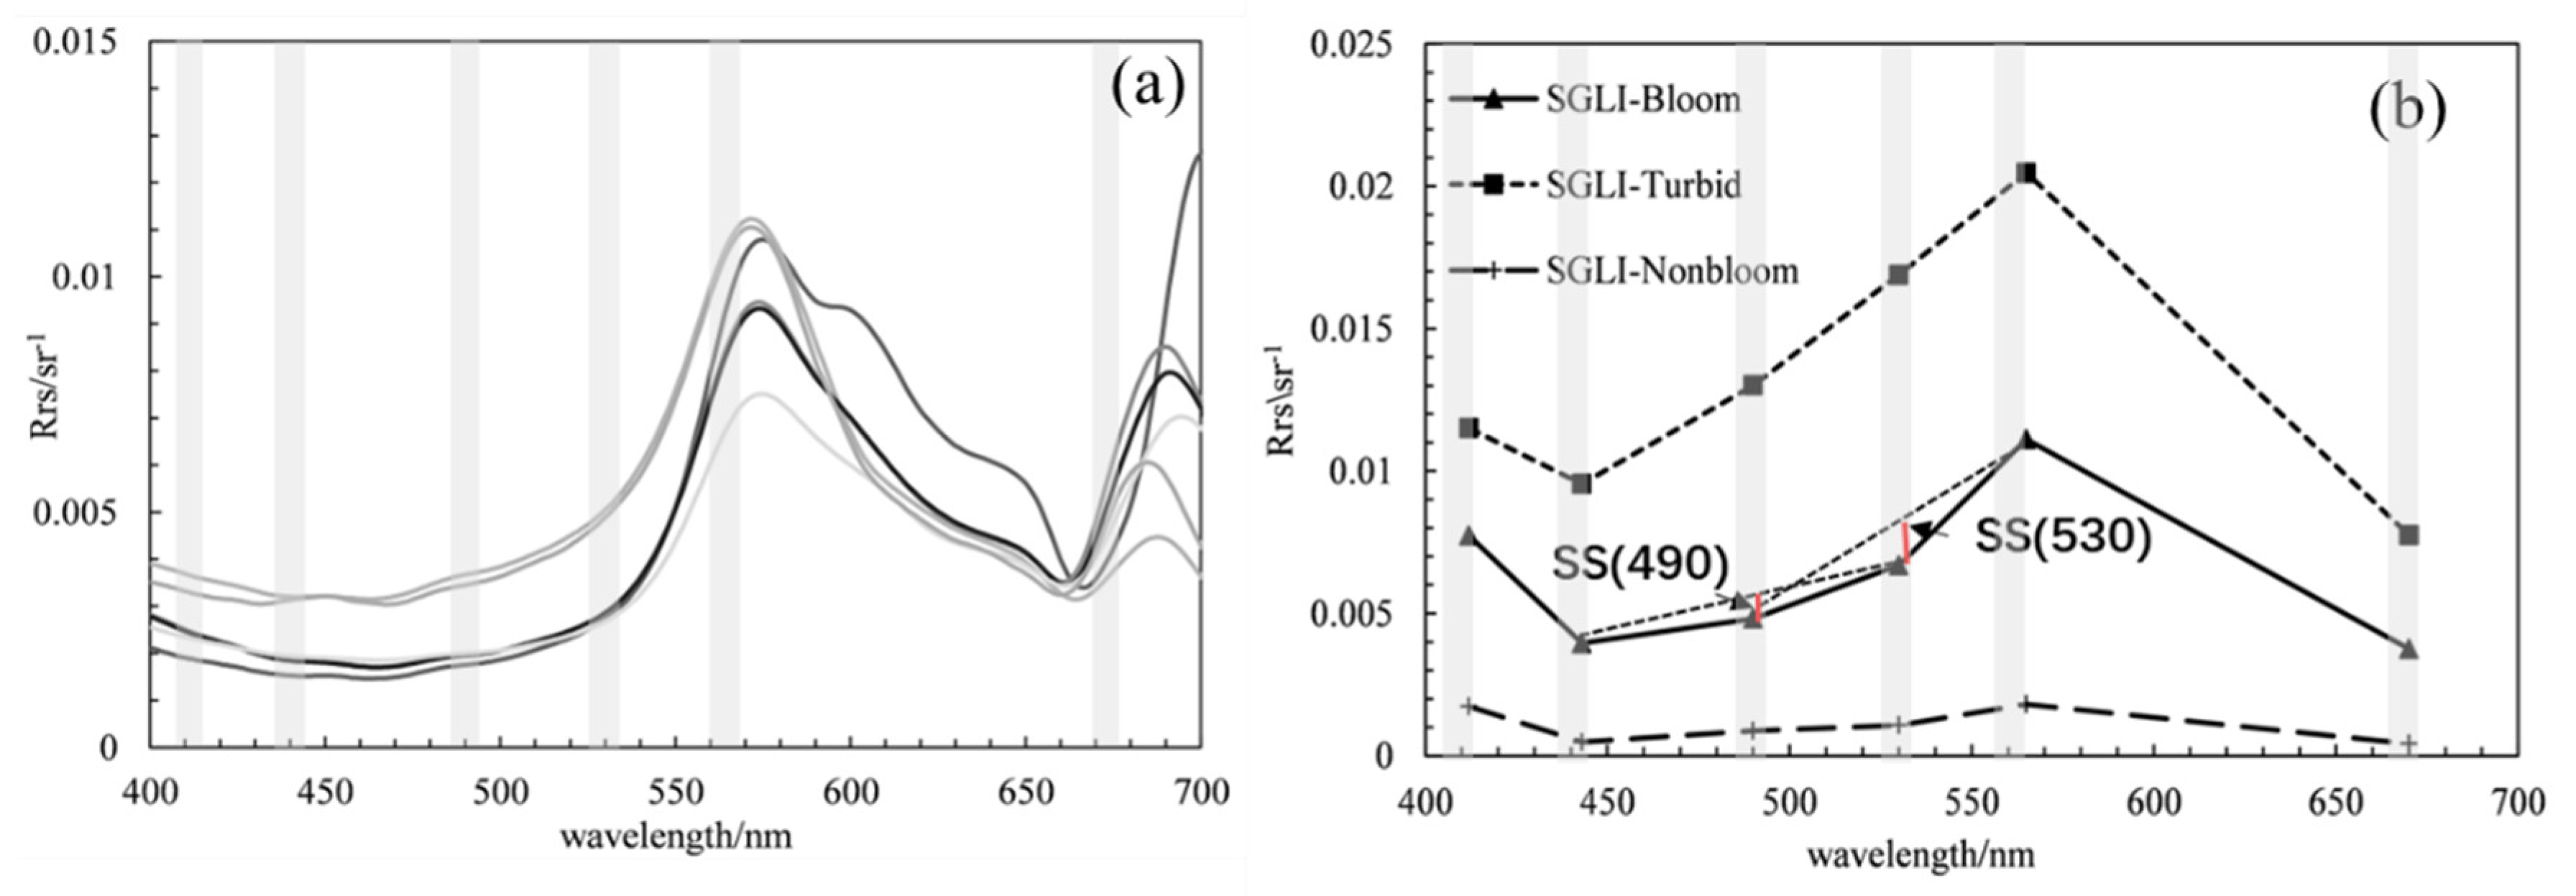
Figure 4 depicts the satellite spectrum of bloom waters obtained through in situ matching in the summer of 2020. For comparison, the R r s λ spectra of turbid and clear waters extracted on a non-bloom day (14 April 2020) were also shown. It can be clearly seen that the bloom water body exhibits a distinct R r s λ spectrum when compared with turbid water and clean water. First, the R r s λ of bloom waters demonstrated obvious absorption characteristics in the short bands of 443 nm and 490 nm, as well as a clear reflection peak at 565 nm, which is consistent with the bloom spectral curves measured in the ECS [9,11]. Although turbid waters also have reflectance peaks in the green waveband, they could be differentiated from the bloom waters by limiting the R r s λ range of green peaks. On the other hand, the reflectance peaks of clear waters are mainly located in the blue bands, and the spectrum reflectance gradually decreases with increasing wavelength.
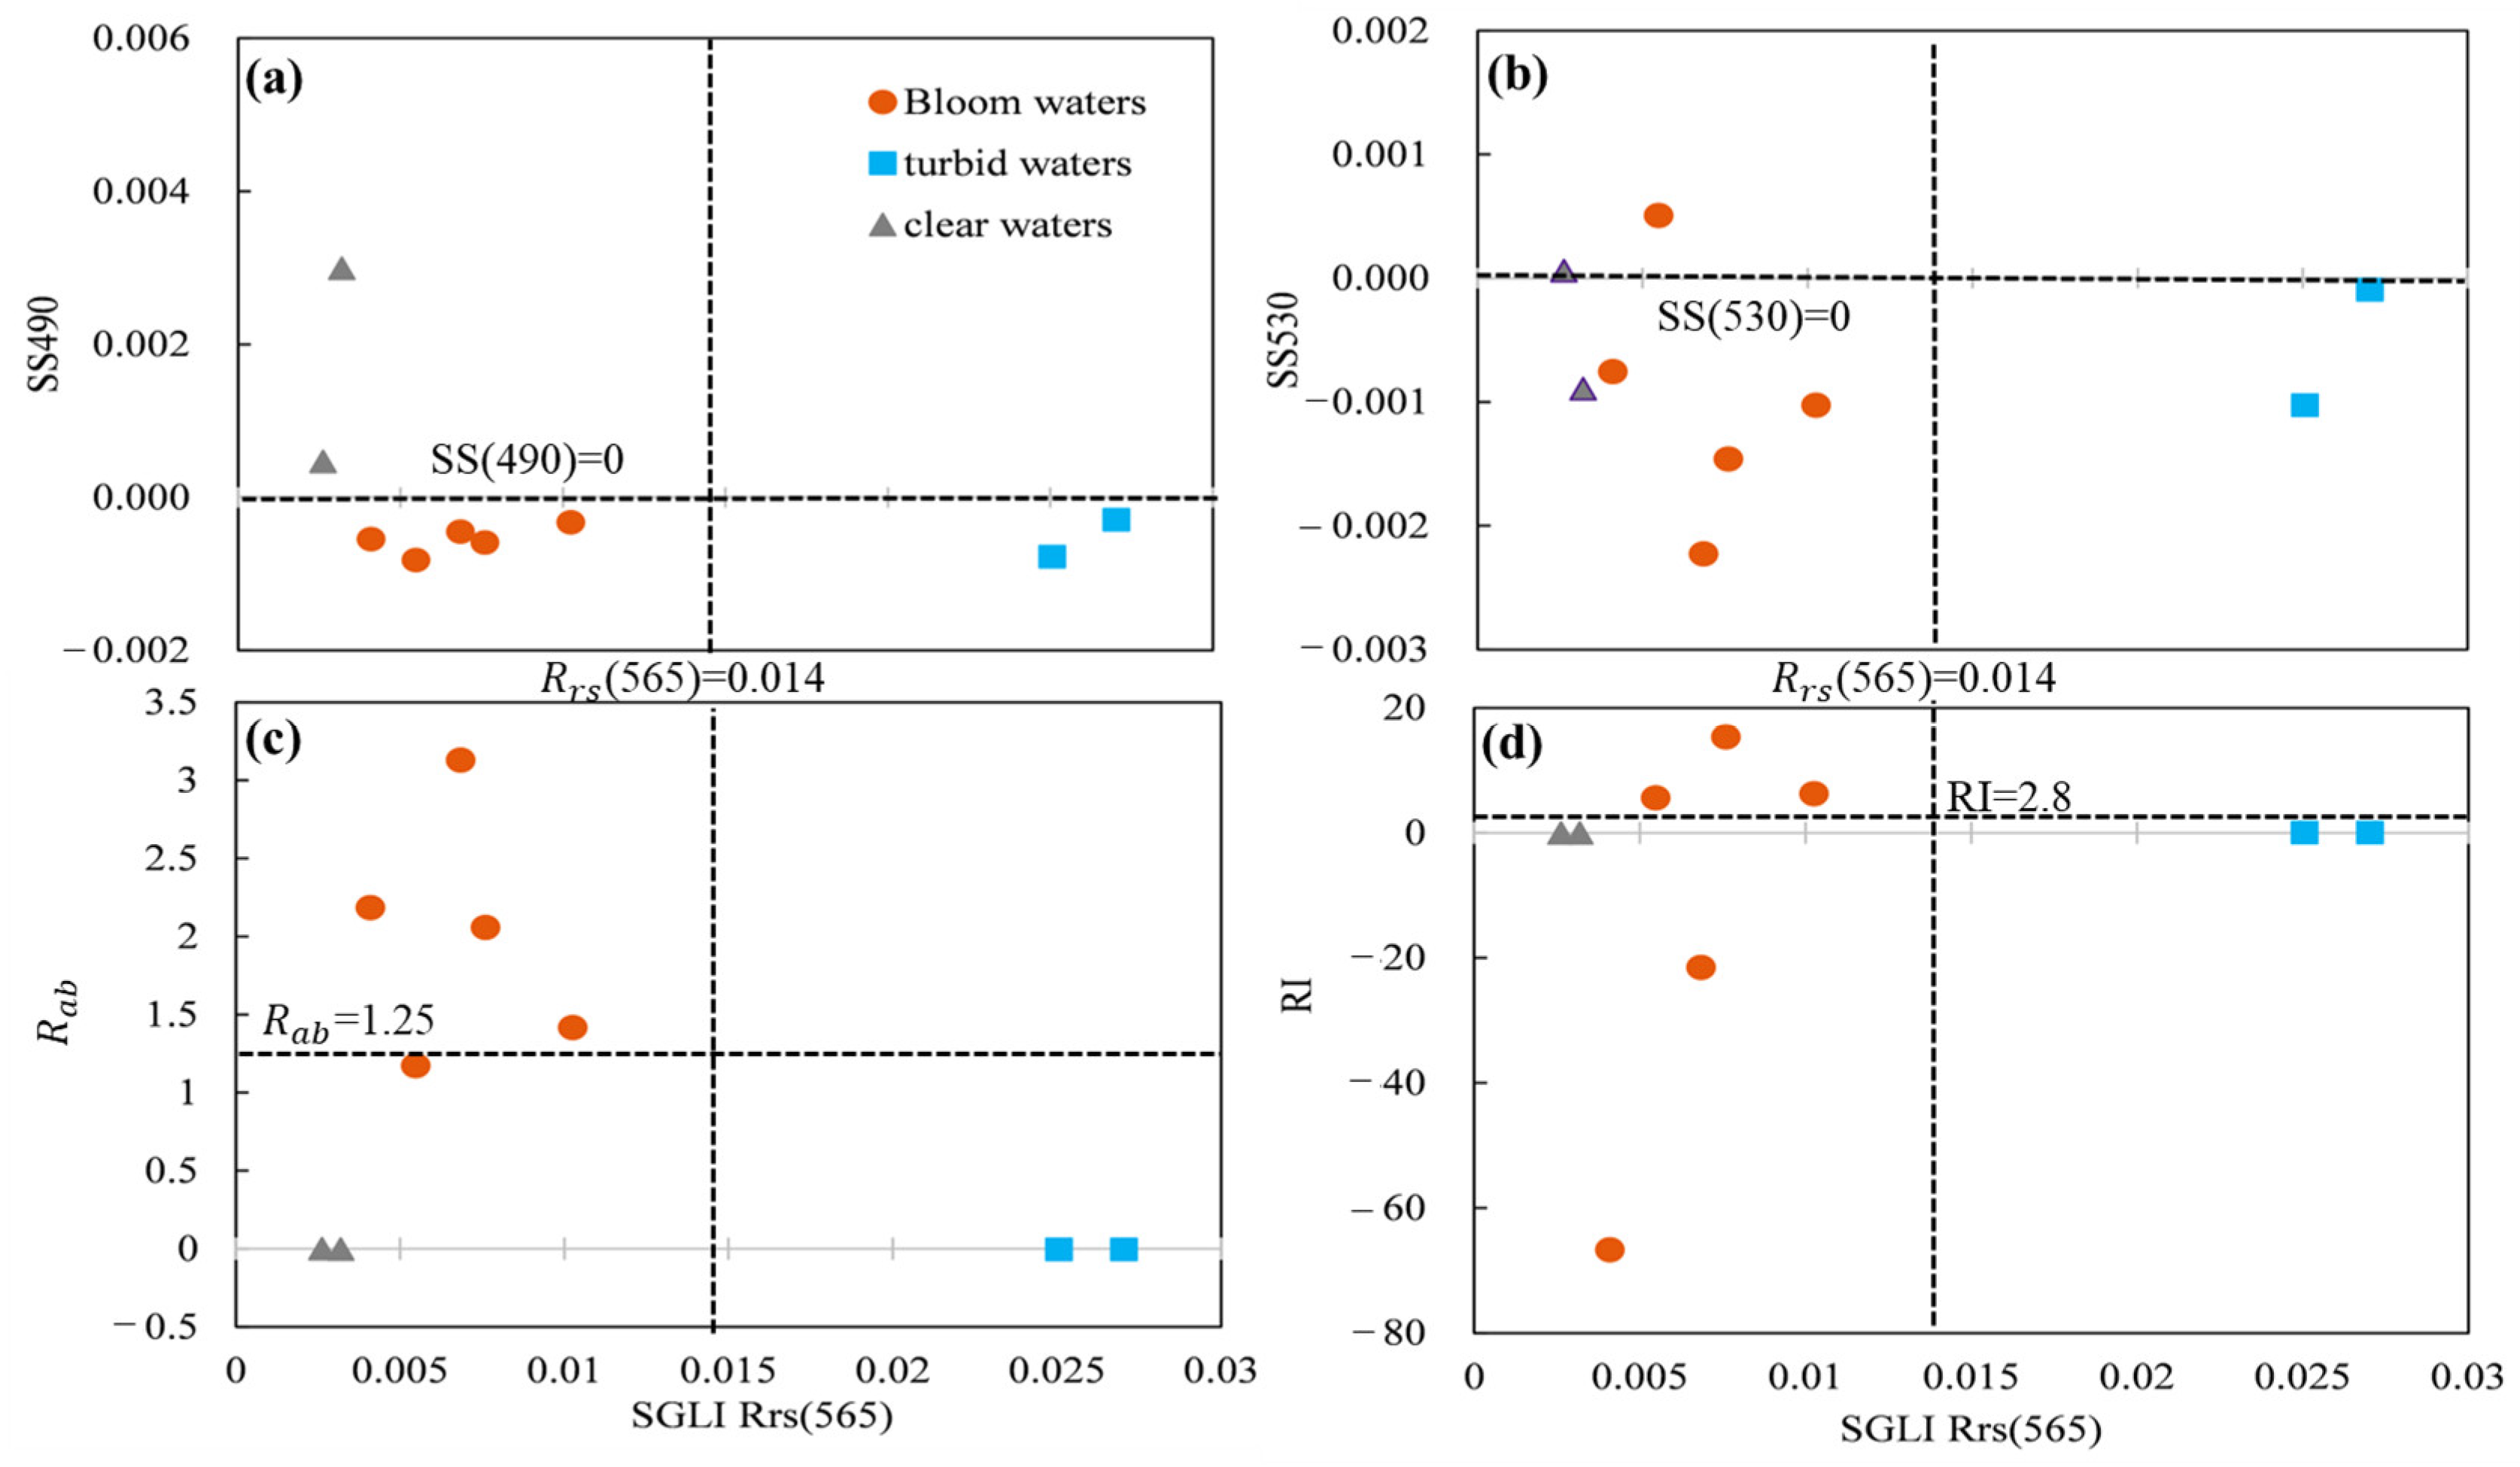
Figure 5 shows the scatterplots of the three bloom extraction methods obtained by local matches, which were derived from the satellite R r s λ data in Figure 4. Even though the SGLI satellite reflectance data are in good agreement with the ground observations after linear correction, the bloom detection methods calculated by satellite reflectance did show some variability. In terms of spectral shape, SS(490) and SS(530) (Figure 5a,b), a cut-off line centered on 0 can effectively distinguish the bloom and clear waters. Although turbid waters also showed negative SS(490) values, they can be differentiated from bloom waters by limiting the range of R r s 565 . In terms of the R a b results, both clear and turbid waters exhibited lower R a b than bloom waters. Most of the bloom waters showed values of R a b   > 1.25, which were consistent with the results in Tao et al. (2015) [18]. In contrast, the RI detection results were insufficient for bloom detection. Although previous studies demonstrated that a threshold of RI > 2.8 was useful for detecting bloom in the ECS [17,23], the scatterplot of RI in Figure 5d shows two outliers from bloom waters with an RI < 0. Although the overestimation at R r s 443 of SGLI data has been corrected using the linear correction method, there are still uncertainties at short bands, resulting in negative RI values. In conclusion, the scatterplots obtained by matched pairs demonstrated that the spectral shape method and the R a b method can achieve better extraction results for bloom waters than the RI method. The success can be attributed to the steeper slope between 430 nm and 565 nm caused by pigment absorption by phytoplankton. In addition, a threshold of R r s 565 is important for differentiation between turbid water and bloom water.

3.3. Bloom Detection Based on SGLI Images

To further assess the performance of bloom detection methods, the SGLI image from 29 April 2020 was selected as an example to compare the spatial distribution characteristics extracted by the different bloom detection methods. Figure 6 shows the SGLI false-color composite image and its corresponding SGLI Chl-a distribution map on 29 April 2020. The nearshore waters of the Zhejiang Coast exhibited higher Chl-a than other areas, which corresponded to the locations of bloom observations.
Figure 7a,b illustrates the bloom regions estimated by SS(490) < 0 and SS(530) < 0, respectively. The Zhejiang Coast region had the lowest value of SS (490) in Figure 7a. In contrast, the offshore region had a relatively high SS(490) of around zero. Observations of local blooms were matched with the lowest SS(490) area. Although the SS(530) map also displays the confirmed bloom area with the lowest value of SS(530), negative SS(530) values of −0.001 were also found in the eastern offshore of Yangtze River Estuary, where blooms were not observed.
The regional distribution of RI > 2.8 is illustrated in Figure 7c. Consistent with the local observations, the majority of Zhejiang Coast regions exhibited somewhat higher values compared to offshore regions. However, in the regions between 27°N and 27.5°N, RI values were unexpectedly high where bloom events were not reported in the summer of 2020. In comparison with Figure 6a, this region was covered by thin clouds, which may have impacted the accuracy of atmospheric correction. Although the pixels in this region had RI > 2.8, additional data checking indicated that there were extremely low values in the blue bands here, which were substantially responsible for the unexpected high RI values. Consequently, it is deduced that the RI method cannot detect bloom waters accurately using SGLI data when there is cloud coverage.
The spatial distribution of blooms using R a b > 1.25 was comparable with SS(530) and RI. However, the highest R a b values were not detected in local observations but rather in the offshore region, where no bloom events were reported. Since there is good consistence of R r s 565 between in situ and satellite data, the uncertainties of R r s 530 were thought to be responsible for false-positive bloom detection results in the offshore region. Because there is no band of 530 nm for the local measurement, the SGLI R r s (530) was compared with MODIS R r s (531) on the same day (not shown here). It is found that there was notable underestimation in the offshore region at 530 nm on the observation day, which may, therefore, account for the high R a b values in the area. Therefore, it can be concluded that the R a b method is inadequate for identification of blooms when using SGLI data unless the uncertainties at 530 nm are appropriately addressed.
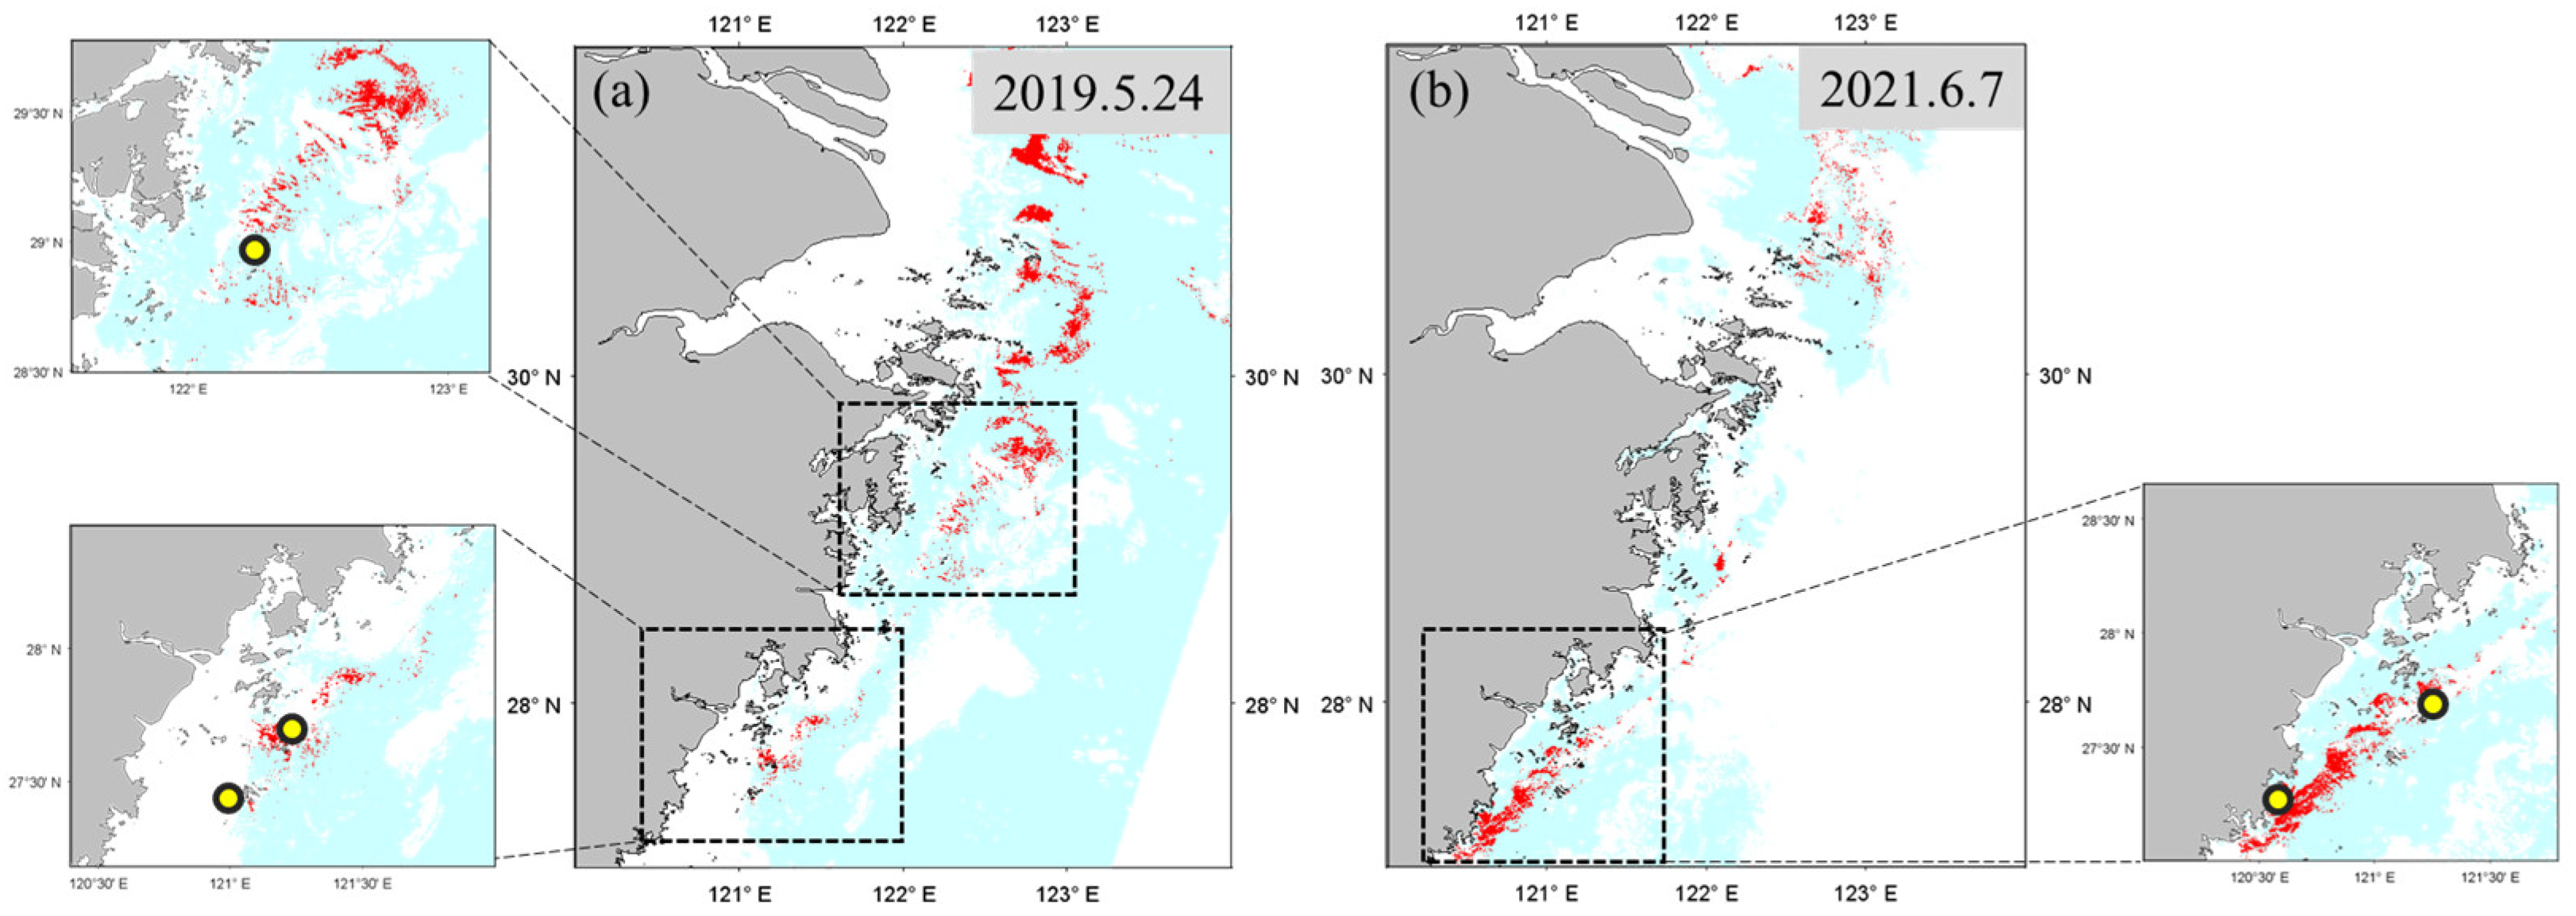
Combining the results from Figure 5 and Figure 7, the SS(490) shows the most satisfactory separation between confirmed bloom waters and non-bloom waters, with a threshold of −0.0005. To further evaluate the efficacy of the refined SS(490) on SGLI images for ECS bloom identification, satellite images acquired on 24 May 2019 and 7 June 2021 were used (Figure 8). It was found that the SS(490) detected blooms effectively on these two bloom days. Furthermore, the enhanced SS(490) method can accurately extract even the extremely nearshore blooms, as shown in Figure 8b.

3.4. Discrimination of Harmful Bloom Species

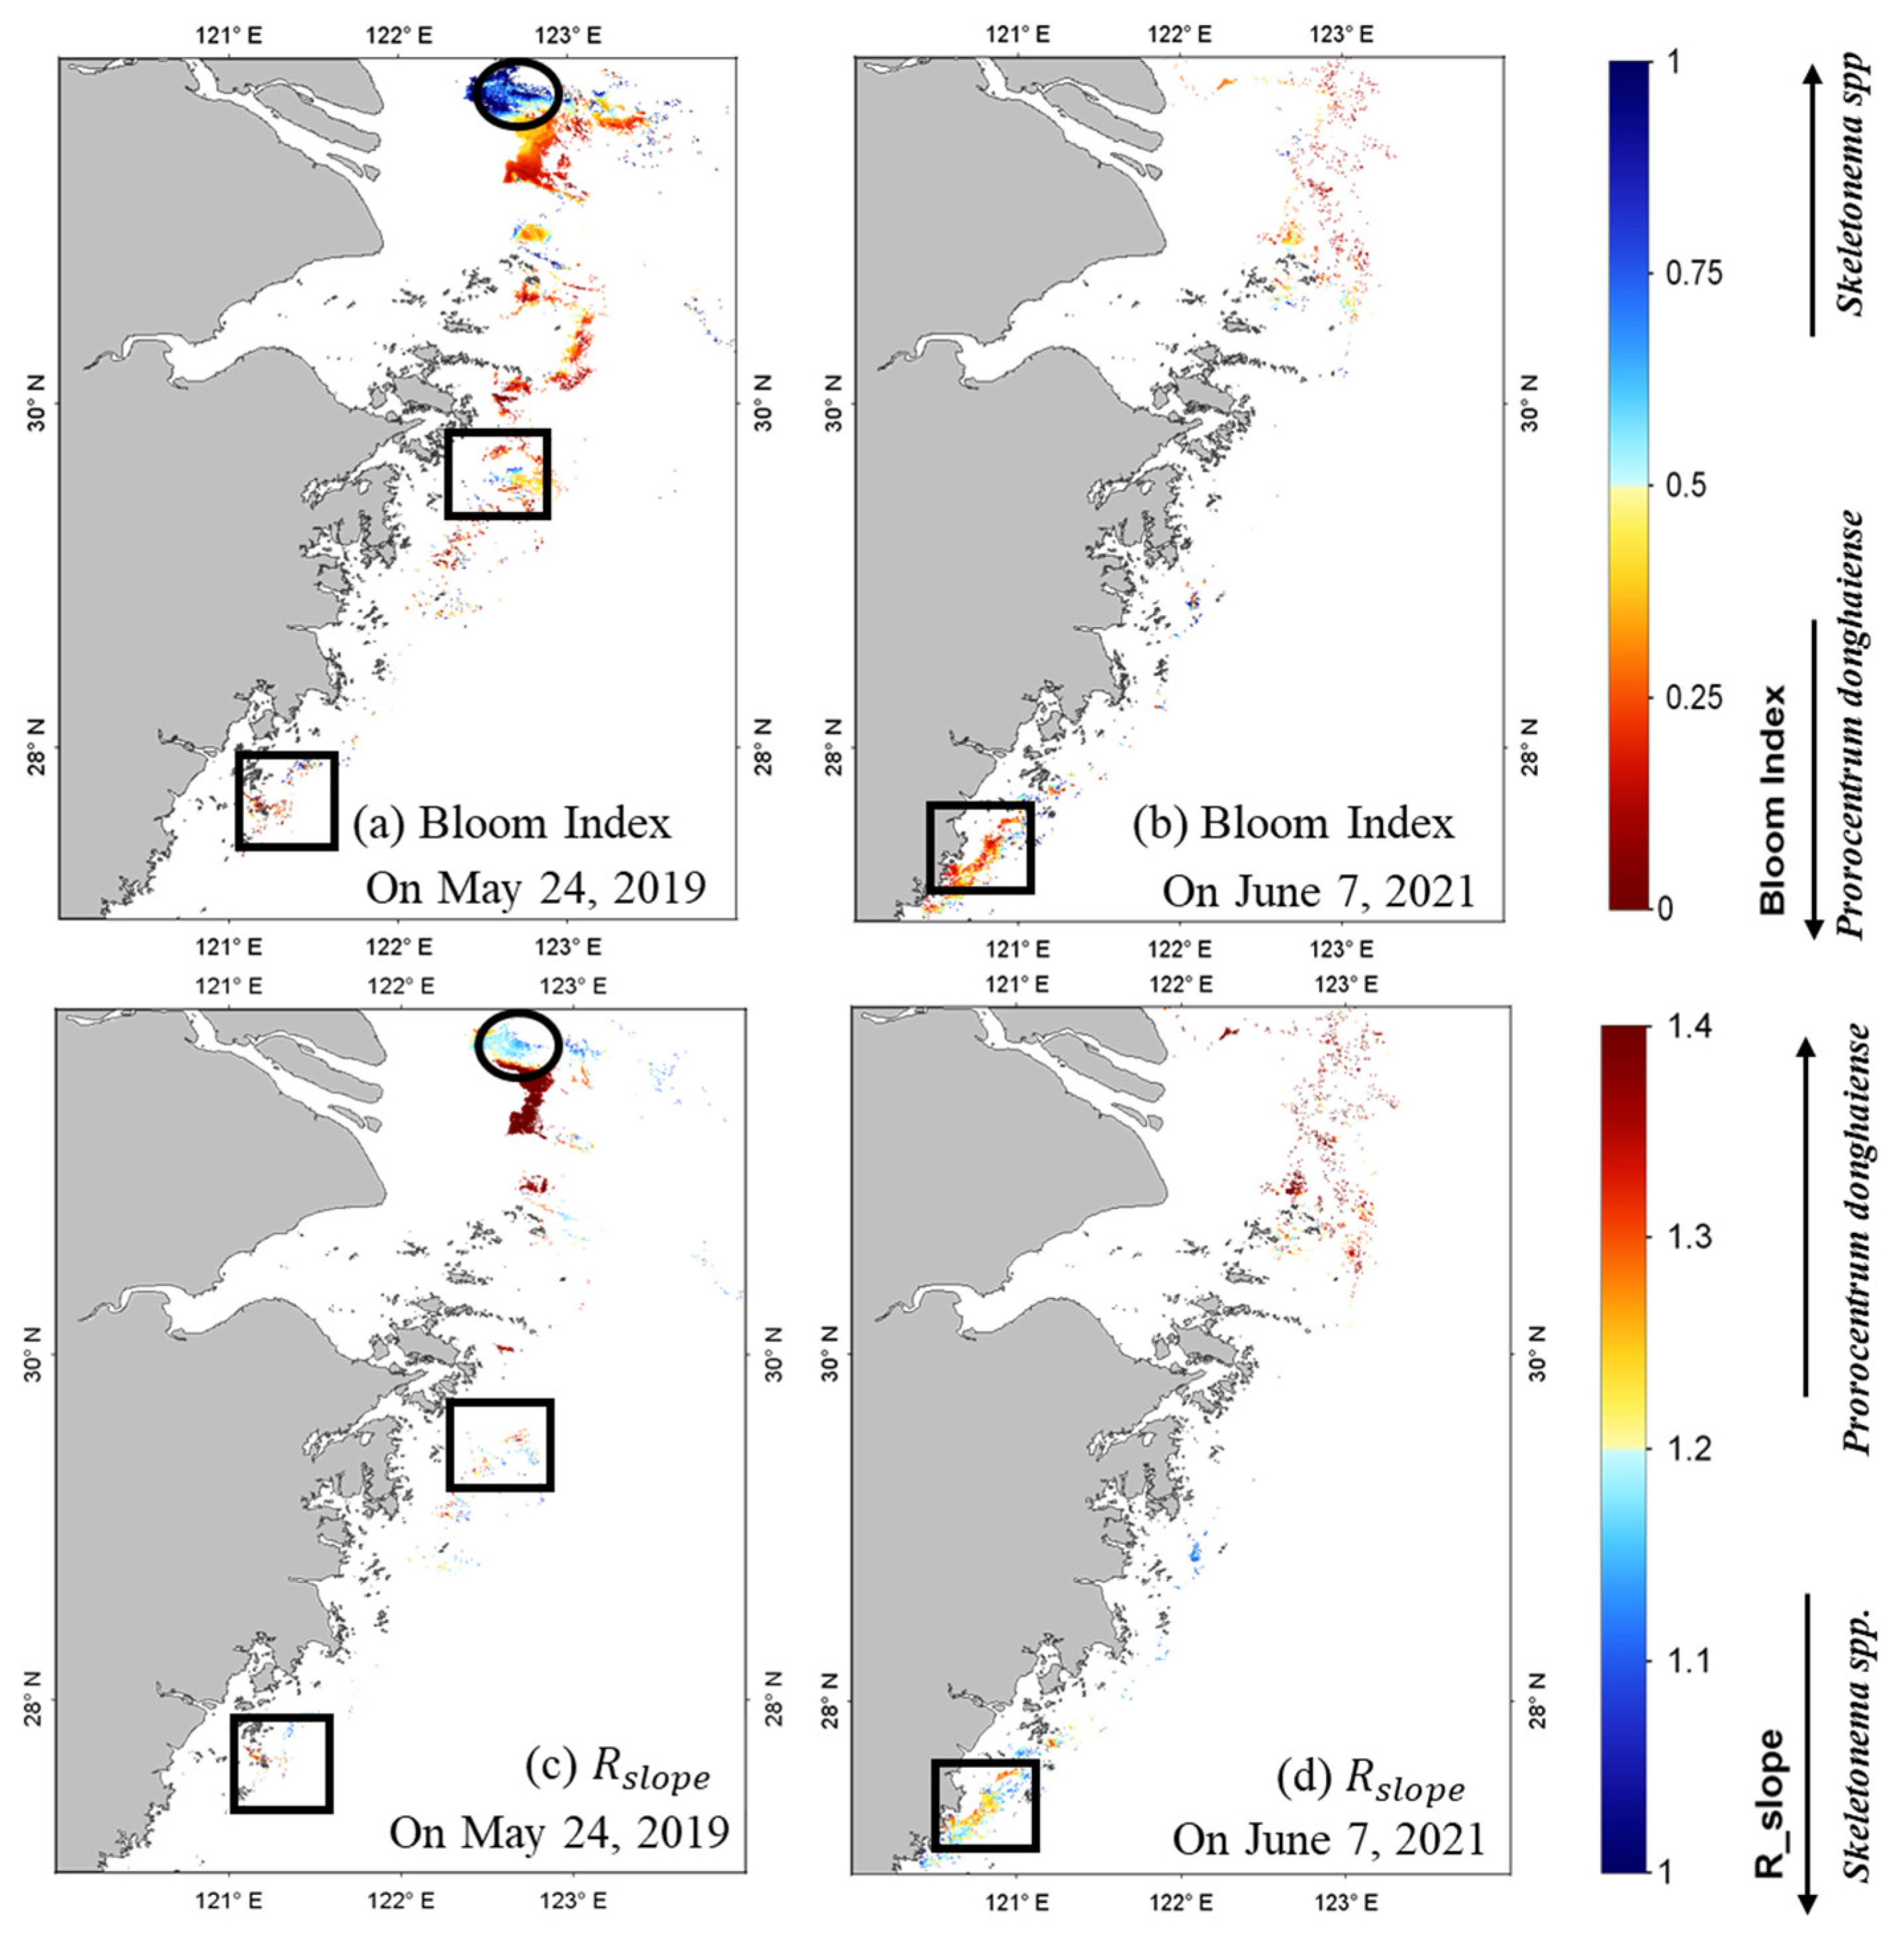
The effectiveness of the BI and R s l o p e algorithm in algal species classification was evaluated based on the bloom detection results for 24 May 2019 and 7 June 2021, as shown in Figure 9. Blooms of P. donghaiense and diatoms both occurred on 24 May 2019, whereas only P. donghaiense blooms were reported on 7 June 2021. According to Shang et al. (2014) [11], the MODIS-derived BI yields reliable results for distinguishing diatom and P. donghaiense blooms. It was found that the BI of diatom bloom waters was never below 0.3, whereas the BI of bloom waters dominated by P. donghaiense was generally below 0.3. Differences in phytoplankton absorption and backscattering are probably responsible for the discrepancy in BI values between the two algae species. Figure 9a,b demonstrate that the P. donghaiense bloom zone had a low BI value, whereas pixels with high BI values were detected in the region of the Yangtze River Estuary where diatom bloom occurred. In contrast with the classification threshold identified by Shang et al. (2014) [11], classification of diatom and P. donghaiense bloom waters was generally separated by a BI threshold of 0.5 on SGLI images.
It Is also possible to classify d”atom’ and P. donghaiense using the R s l o p e approach. Previous studies have shown that P. donghaiense bloom waters have a steeper R s l o p e than diatoms in the green–red bands in local measured R r s λ , which assists differentiation between diatom and P. donghaiense blooms. However, in the study by Shen et al. (2019) [9], it was found that the difference in R s l o p e between P. donghaiense and diatoms might be suppressed when the red band was far from the green band. Nevertheless, the R s l o p e algorithm performed well on SGLI data for identifying harmful algae. Despite the fact that the bands in R s l o p e calculation using SGLI data differed from those of Shen et al. (2019) [9], pixels with R s l o p e   > 1.2 were discovered in the region of P. donghaiense bloom waters. In contrast, the bloom area of diatoms exhibited lower R s l o p e values.

4. Discussion

In this study, three kinds of bloom detection algorithms were compared to explore their ability in bloom extraction on SGLI data along the ECS coast. Bloom detection results from local match-up pairs and SGLI imagery showed that the SS(490) outperformed the the SS(530), R a b , and RI methods. The reasons for the unsatisfactory bloom detection results could be different among the methods.
Figure 10 depicts the in situ R r s λ associated with P. donghaiense blooms (provided by the data in [18]) and the R r s λ extracted spectrum from the SGLI image on 29 April 2020. It is known that outbreaks of bloom are often accompanied by an increase in pigment concentration, resulting in a reflectance valley in the blue–green band range. Such a feature is indicated by a negative SS(490) or SS(530) value in the spectrum shape method. Although the SS(530) could detect bloom by the local match-up pairs, an unexpected bloom area was found in the offshore region by SGLI image (Figure 7b). Uncertainties in satellite R r s 530 may account for the unsatisfactory results obtained by SS(530) and R a b . Despite the fact that R r s 530 was also used in SS(490), it was only employed as a baseline to describe spectrum curvature at 490 nm. Further accuracy assessment of satellite R r s 530 is recommended when sufficient in situ R r s λ data are available. With regard to the failure of the RI method, it only considers the height difference of satellite R r s λ between blue–green bands rather than the variation in spectral curvature in this range. Although subtraction of R r s 443 could eliminate the influence of non-algal sediments, uncertainty regarding atmospheric correction might still result in high RI values in the non-bloom waters. Thus, utilization of Rayleigh-corrected reflectance could be a preferred choice when dealing with unfavorable sky conditions [17]. In short, uncertainties in atmospheric correction in the offshore regions might be the main reason for the failure in SS(530), R a b , and RI. Even though validation of SGLI R r s λ was evaluated using in situ measurement from the Dongou Ocean Observing Platform (located in the nearshore region), the accuracy of satellite R r s λ in the offshore region remains unknown. Further efforts are required to explore the accuracy of satellite data in the region.
In further steps, an empirical threshold of 0.0005 of SS(490) was established for bloom detection on SGLI data. Although Figure 5a shows that all bloom waters can be accurately determined with a negative SS(490), the local measured R r s λ from bloom waters showed a smaller SS(490) value of −0.00047 ± 0.00011 (calculated from the in situ R r s λ of bloom waters in Figure 10a, provided by Tao et al. (2015)). In fact, it was found that coastal waters with high concentrations of dissolved organic matter will also show negative SS(490) by absorbing strongly in blue–green bands [31]. Therefore, a refined threshold for SS(490) is recommended when applying SS(490) in coastal regions for bloom detection.
In summary, the spectral shape algorithms are outperformed in bloom detection compared to the other two methods in this study when considering the challenge of atmospheric correction in coastal regions. In fact, Blondeau-Patissier et al. (2014) [32] also concluded that band ratio methods related to blue–green bands could be unreliable in coastal waters because of increasing concentrations of sediments and dissolved organic matter. In contrast, the spectral shape method is robust in analyzing satellite R r s λ by capturing increasing pigments absorption from accumulated phytoplankton in bloom waters. Previous methods such as fluorescence line height (FLH), maximum chlorophyll index (MCI), and floating algae index (FAI), which described spectral curvature in red to near-red bands, were also found to work well in detection of bloom waters [33,34,35].
Furthermore, it is suggested that correction for R r s 443 is required when applying certain bloom detection approaches to SGLI images. The linear correction method can assist in reducing overestimation of bloom areas without the need to repeat the atmospheric correction processes. The linear correction approach on satellite R r s was first developed for correction of underestimation from MODIS images in the research area of Ise Bay in Japan [36]. The results of this study demonstrated that the linear correction method could also be applied to correct overestimation of satellite R r s λ (similar results found in [37]). Notably, the parameter used in Equation (7), which describes the relationships between in situ R r s 412 and R r s 565 , is an empirical value. In future studies, the unexpectedly overestimated R r s at short bands was supposed to be more effectively corrected using the locally measured R r s λ from bloom waters to improve the utility on bloom detection by SGLI images.
In the final steps, classification of P. donghaiense and diatom blooms was achieved using both the BI and R s l o p e approaches on SGLI images. Inclusion of 530 nm in the SGLI data enhances their ability to distinguish harmful algal species in the ECS by using the multiple phytoplankton discrimination method. Although the bands use in R s l o p e calculation differs from that described by Shen et al. (2019), the method characterizing the spectral shape in green–red bands of bloom waters remain effective for phytoplankton discrimination. Note that the difference in thresholds of BI and R s l o p e might not only be from bands difference between SGLI and MODIS but also from uncertainties in satellite R r s (λ) retrieval. Further thresholds modifications in BI and R s l o p e are recommended when local measured R r s λ data of P. donghaiense and diatom blooms in ECS are available.

5. Conclusions

In this study, performance of different bloom extraction methods using SGLI imagery was evaluated via comparative analysis. First, the accuracy of SGLI R r s λ was assessed by comparing matched pairs to the locally measured R r s λ . Compared with in situ measured R r s λ , the precision of satellite R r s λ differed between wavebands. Accuracies of 490 nm, 565 nm, and 670 nm were adequate for bloom observation in the ECS, while overestimation was found at 412 nm and 443 nm. By utilizing a linear correction approach, overestimation of R r s λ at 443 nm was reduced. Furthermore, based on local matched data and SGLI images, the spectral shape (SS) method, the red tide index (RI), and the algal bloom ratio ( R a b ) were examined for bloom identification accuracy. The bloom extraction results from SS(490) were better than those obtained using SS(530), R a b , and RI. To remove the potential influence of turbid waters, an empirical criterion for R r s 565 was required. In addition, it was notable that the SGLI data could also help in distinguishing P. donghaiense from diatom blooms. Inclusion of 530 nm accurately described the discrepancy in blue–green absorption between the two species. On the other hand, according to China Marine Disaster Bulletin reports, harmful species other than diatoms and P. donghaiense, such as Akashiwo sanguinea and Ceratium furca, have also emerged in recent years. Therefore, more efforts will be required to establish the ability of current phytoplankton discrimination algorithms to detect other harmful species using SGLI data.

Author Contributions

Conceptualization, C.F.; methodology, C.F.; software, C.F.; validation, C.F.; resources, Y.Z.; writing—original draft preparation, C.F.; writing—review and editing, Y.Z. and A.S.; visualization, C.F.; supervision, Y.Z. and A.S.; data provision, B.T., C.L., Q.S., and J.Z.; funding acquisition, J.Z. and C.F. All authors have read and agreed to the published version of the manuscript.

Funding

This study was supported by the National Key Research & Development Program "Key Processes of Nitrogen and Phosphorus Transport and Transformation and Ecosystem Response" (2021YFC3101702); the Research Funds from Remote Sensing Identification of Red Tide Algae in the East China Sea (332114802); the Zhejiang Provincial Public Welfare Technology Application Research Program of China under Grant No. LGF21D060001; the Zhejiang Provincial Natural Science Foundation (LY20D060004).

Data Availability Statement

The SGLI data may be downloaded through FTP: ftp.gportal.jaxa.jp, accessed on 18 January 2018. The bloom reports may be checked at https://www.nmdis.org.cn/hygb/zghyzhgb/, accessed on 15 November 2022 (In Chinese).

Conflicts of Interest

The authors declare no conflict of interest.

References

  1. He, X.; Bai, Y.; Pan, D.; Chen, C.-T.A.; Cheng, Q.; Wang, D.; Gong, F. Satellite views of the seasonal and interannual variability of phytoplankton blooms in the eastern China seas over the past 14 yr (1998–2011). Biogeosciences 2013, 10, 4721–4739. [Google Scholar] [CrossRef] [Green Version]
  2. Liu, L.; Zhou, J.; Zheng, B.; Cai, W.; Lin, K.; Tang, J. Temporal and spatial distribution of red tide outbreaks in the Yangtze River Estuary and adjacent waters, China. Mar. Pollut. Bull. 2013, 72, 213–221. [Google Scholar] [CrossRef]
  3. Zohdi, E.; Abbaspour, M. Harmful algal blooms (red tide): A review of causes, impacts and approaches to monitoring and prediction. Int. J. Environ. Sci. Technol. 2019, 16, 1789–1806. [Google Scholar] [CrossRef]
  4. Shen, A.; Ishizaka, J.; Yang, M.; Ouyang, L.; Yin, Y.; Ma, Z. Changes in community structure and photosynthetic activities of total phytoplankton species during the growth, maintenance, and dissipation phases of a Prorocentrum donghaiense bloom. Harmful Algae 2019, 82, 35–43. [Google Scholar] [CrossRef]
  5. Yang, Y.; Liu, P.X.; Zhou, H.H.; Xia, L.H. Evaluation of the change trend and health status of marine organisms in the Changjiang estuary in the past 15 years. J. Ecol. 2020, 40, 8892–8904. [Google Scholar]
  6. Zeng, Y.; Lu, D.; Wang, P.; Guo, R.; Guan, W.; Dai, X. Further study on the relationship between the protochlorophyte and Taiwan warm current species in the East China Sea. Oceanogr. Res. 2020, 38, 38–48. [Google Scholar]
  7. Marcarelli, A.M.; Wurtsbaugh, W.A.; Griset, O. Salinity Controls Phytoplankton Response to Nutrient Enrichment in the Great Salt Lake, Utah, USA. Can. J. Fish. Aquat. Sci. 2006, 63, 2236–2248. [Google Scholar] [CrossRef] [Green Version]
  8. Feng, C.; Ishizaka, J.; Wang, S.Q. A simple method for algal species identification in the East China Sea using multiple satellite images. Geosci. Lett. 2022, 9, 12. [Google Scholar] [CrossRef]
  9. Shen, F.; Tang, R.; Sun, X.; Liu, D. Simple methods for satellite identification of algal blooms and species using 10-year time series data from the East China Sea. Remote Sens. Environ. 2019, 235, 111484. [Google Scholar] [CrossRef]
  10. Lei, H.; Pan, D.; Bai, Y.; Chen, X.; Zhou, Y.; Zhu, Q. HAB Detection Based on Absorption and Backscattering Properties of Phytoplankton. In Proceedings of the Remote Sensing of the Ocean, Sea Ice, Coastal Waters, and Large Water Regions, Prague, Czech Republic, 19–22 September 2011; Volume 8175, pp. 403–410. [Google Scholar]
  11. Shang, S.; Wu, J.; Huang, B.; Lin, G.; Lee, Z.; Liu, J.; Shang, S. A new approach to discriminate dinoflagellate from diatom blooms from space in the East China Sea. J. Geophys. Res. Oceans 2014, 119, 4653–4668. [Google Scholar] [CrossRef]
  12. Tao, B.; Mao, Z.; Lei, H.; Pan, D.; Bai, Y.; Zhu, Q.; Zhang, Z. A semianalytical MERIS green-red band algorithm for identifying phytoplankton bloom types in the East China Sea. J. Geophys. Res. Oceans 2017, 122, 1772–1788. [Google Scholar] [CrossRef]
  13. Stumpf, R.P.; Culver, M.E.; Tester, P.A.; Tomlinson, M.; Kirkpatrick, G.J.; Pederson, B.A.; Truby, E.; Ransibrahmanakul, V.; Soracco, M. Monitoring Karenia Brevis Blooms in the Gulf of Mexico Using Satellite Ocean Color Imagery and Other Data. Harmful Algae 2003, 2, 147–160. [Google Scholar] [CrossRef]
  14. Sun, L.; Chen, Y.; Wang, X. Research on the extraction of red tide information from time series MODIS data. Remote Sens. Inf. 2012, 27, 71–77. [Google Scholar]
  15. Kiyomoto, Y.; Iseki, K.; Okamura, K. Ocean Color Satellite Imagery and Shipboard Measurements of Chlorophyll a and Suspended Particulate Matter Distribution in the East China Sea. J. Oceanogr. 2001, 57, 37–45. [Google Scholar] [CrossRef]
  16. Gong, G.-C. Absorption Coefficients of Colored Dissolved Organic Matter in the Surface Waters of the East China Sea. Terr. Atmos. Ocean. Sci. 2004, 15, 75–87. [Google Scholar] [CrossRef] [Green Version]
  17. Lou, X.; Hu, C. Diurnal variation of harmful algal blooms in the East China Sea. Observations from GOCI. Remote Sens. Environ. 2014, 140, 562–572. [Google Scholar] [CrossRef]
  18. Tao, B.; Mao, Z.; Lei, H.; Pan, D.; Shen, Y.; Bai, Y.; Zhu, Q.; Li, Z. A new method for identifying Prorocentrum donghaiense from diatom blooms in the East China Sea using MODIS measurements. Remote Sens. Environ. 2015, 158, 267–280. [Google Scholar] [CrossRef]
  19. Shin, J.; Kim, K.; Min, J.E.; Ryu, J.H. Red tide detection by image fusion of GOCI and Landsat OLI. Korean J. Remote Sens. 2018, 34, 377–391. [Google Scholar]
  20. Cannizzaro, J.P.; Carder, K.L.; Chen, F.R.; Heil, C.A.; Vargo, G.A. A novel technique for detection of the toxic dinoflagellate, Karenia brevis, in the Gulf of Mexico from remotely sensed ocean color data. Cont. Shelf Res. 2008, 28, 137–158. [Google Scholar] [CrossRef]
  21. Qi, L.; Tsai, S.-F.; Chen, Y.; Le, C.; Hu, C. In Search of Red Noctiluca Scintillans Blooms in the East China Sea. Geophys. Res. Lett. 2019, 46, 5997–6004. [Google Scholar] [CrossRef]
  22. Liu, Y.Y.; Shen, F.; Li, X.Z. Analysis of light absorption characteristics of phytoplankton in red tide waters adjacent to the Yangtze estuary. Environ. Sci. 2015, 36, 2019–2027. [Google Scholar]
  23. Li, C.; Tao, B.; Liu, Y.; Zhang, S.; Zhang, Z.; Song, Q.; Jiang, Z.; He, S.; Huang, H.; Mao, Z. Assessment of VIIRS on the Identification of Harmful Algal Bloom Types in the Coasts of the East China Sea. Remote Sens. 2022, 14, 2089. [Google Scholar] [CrossRef]
  24. Hori, M.; Murakami, H.; Miyazaki, R.; Honda, Y.; Nasahara, K.; Kajiwara, K.; Nakajima, T.Y.; Irie, H.; Toratani, M.; Hirawake, T.; et al. GCOM-C Data Validation Plan for Land, Atmosphere, Ocean, and Cryosphere. Trans. Jpn. Soc. Aeronaut. Space Sci. Aerosp. Technol. Jpn. 2018, 16, 218–223. [Google Scholar] [CrossRef] [Green Version]
  25. Gordon, H.R.; Wang, M. Retrieval of water-leaving radiance and aerosol optical thickness over the oceans with SeaWiFS: A preliminary algorithm. Appl. Opt. 1994, 33, 443–452. [Google Scholar] [CrossRef]
  26. MMorel, A.; Maritorena, S. Bio-optical properties of oceanic waters: A reappraisal. J. Geophys. Res. Oceans 2001, 106, 7163–7180. [Google Scholar] [CrossRef]
  27. Murakami, H. ATBD of GCOM-C Ocean Color Atmospheric Correction. Available online: https://archimer.ifremer.fr/doc/00655/76742/77894.pdf (accessed on 24 December 2022).
  28. Zhang, M.; Tang, J.; Dong, Q.; Song, Q.; Ding, J. Retrieval of total suspended matter concentration in the Yellow and East China Seas from MODIS imagery. Remote Sens. Environ. 2010, 114, 392–403. [Google Scholar] [CrossRef]
  29. Siswanto, E.; Ishizaka, J.; Tripathy, S.C.; Miyamura, K. Detection of harmful algal blooms of Karenia mikimotoi using MODIS measurements: A case study of Seto-Inland Sea, Japan. Remote Sens. Environ. 2013, 129, 185–196. [Google Scholar] [CrossRef]
  30. Wynne, T.T.; Stumpf, R.P.; Tomlinson, M.C.; Warner, R.A.; Tester, P.A.; Dyble, J.; Fahnenstiel, G.L. Relating spectral shape to cyanobacterial blooms in the Laurentian Great Lakes. Int. J. Remote Sens. 2008, 29, 3665–3672. [Google Scholar] [CrossRef]
  31. Hoge, F.E.; Vodacek, A.; Blough, N.V. Inherent optical properties of the ocean: Retrieval of the absorption coefficient of chromophoric dissolved organic matter from fluorescence measurements. Limnol. Oceanogr. 1993, 38, 1394–1402. [Google Scholar] [CrossRef]
  32. Blondeau-Patissier, D.; Gower, J.F.R.; Dekker, A.G.; Phinn, S.R.; Brando, V.E. A review of ocean color remote sensing methods and statistical techniques for the detection, mapping and analysis of phytoplankton blooms in coastal and open oceans. Prog. Oceanogr. 2014, 123, 123–144. [Google Scholar] [CrossRef] [Green Version]
  33. Neville, R.A.; Gower, J.F.R. Passive remote sensing of phytoplankton via chlorophyll α fluorescence. J. Geophys. Res. Atmos. 1977, 82, 3487–3493. [Google Scholar] [CrossRef]
  34. Gower, J.; King, S.; Goncalves, P. Global monitoring of plankton blooms using MERIS MCI. Int. J. Remote Sens. 2008, 29, 6209–6216. [Google Scholar] [CrossRef]
  35. Hu, C.; Lee, Z.; Ma, R.; Yu, K.; Li, D.; Shang, S. Moderate Resolution Imaging Spectroradiometer (MODIS) observations of cyanobacteria blooms in Taihu Lake, China. J. Geophys. Res. Atmos. 2010, C04002, 1–20. [Google Scholar] [CrossRef] [Green Version]
  36. Hayashi, M.; Ishizaka, J.; Kobayashi, H.; Toratani, M.; Nakamura, T.; Nakashima, Y.; Yamada, S. Evaluation and Improvement of MODIS and SeaWiFS-derived Chlorophyll a Concentration in Ise-Mikawa Bay. J. Jpn. Soc. Remote Sens. 2015, 35, 245–259. [Google Scholar]
  37. Ishizaka, J.; Yang, M.; Fujii, N.; Katano, T.; Hori, M.; Mine, T.; Saitoh, K.; Murakami, H. Use of AERONET-OC for validation of SGLI/GCOM-C products in Ariake Sea, Japan. J. Oceanogr. 2022, 78, 291–309. [Google Scholar] [CrossRef]
Figure 1. Study area of East China Sea (highlighted circles indicate the in situ observations of blooms; the red star shows the location of in situ R r s λ observation by Dongou Ocean Observing Platform).
Remotesensing 15 00691 g001
Figure 2. Comparison of in situ measured R r s λ with SGLI-derived R r s λ .
Remotesensing 15 00691 g002
Figure 3. (a) Examples of SGLI R r s linear correction in the short bands. (b) Comparison between original SGLI R r s (443) and linear corrected SGLI R r s (443). The solid and dotted black lines in (a) represent the spectrum of original and corrected SGLI R r s 443 , respectively. The hollow and solid black points in (b) indicate the value of SGLI R r s 443 before and after linear correction, respectively.
Remotesensing 15 00691 g003
Figure 4. Satellite R r s λ of match-up pairs with local bloom records. The orange lines indicate values corresponding to bloom waters, whereas blue lines and gray lines represent clear and turbid waters, respectively.
Remotesensing 15 00691 g004
Figure 5. Scatterplots of different water types indicated by (a) SS(490), (b) SS(530), (c) R a b , and (d) RI. The data were derived from the satellite R r s λ in Figure 4. The horizontal black dotted lines represent (a) SS(490) = 0, (b) SS(530) = 0, (c) R a b = 1.25, and (d) RI = 2.8. The vertical broken lines represent R r s 565 = 0.0014 sr−1.
Remotesensing 15 00691 g005
Figure 6. SGLI images of (a) false RGB image and (b) satellite Chl-a map on 29 April 2020. The highlighted circles indicate the location of Prorocentrum donghaiense blooms.
Remotesensing 15 00691 g006
Figure 7. Bloom extraction maps using the methods: (a) SS(490) < 0; (b) SS(530) < 0; (c) R a b > 1.25; and (d) RI > 2.8 from the SGLI image on 29 April 2020. Note that all the bloom pixels were assessed using the criteria of R r s 565 < 0.014 sr−1.
Remotesensing 15 00691 g007
Figure 8. Bloom waters of (a) 24 May 2019 and (b) 7 June 2021 extracted using the adjusted SS(490) method. The areas indicated by the rectangular polygon and the highlighted circles are the main bloom occurrence locations provided by bloom reports from the China Marine Disaster Bulletin.
Remotesensing 15 00691 g008
Figure 9. SGLI-derived (a,b) bloom index (BI) map based on the bloom detection results in Figure 8a,b, respectively; and (c,d) R s l o p e map based on the bloom detection results in Figure 8a,b, respectively. The black circles and rectangles represent the location of diatom and Prorocentrum donghaiense blooms, respectively.
Remotesensing 15 00691 g009
Figure 10. (a) Local measured R r s λ of Prorocentrum donghaiense blooms by Tao et al. (2015); (b) spectrum of different water types from SGLI imagery on 29 April 2020. The gray vertical bars in (a,b) indicate the wavebands of SGLI data. The red vertical lines in (b) describe the values obtained by SS(490) and SS(530).
Remotesensing 15 00691 g010
Table 1. East China Sea summer bloom events 2019–2021.
Data UsageDateLongitude *Latitude *Species
Harmful algae discrimination 122.1229
121.1227.47Prorocentrum donghaiense
2019/5/24121.2427.72
122.5731.67Skeletonema spp.
121.6928.11
Bloom detection2020/4/29121.0827.46Prorocentrum donghaiense
122.1229.09
Bloom detection 121.0427.46Prorocentrum donghaiense
2020/5/13120.6927.36
Bloom detection2020/5/17120.5927.26Prorocentrum donghaiense
Harmful algae discrimination2021/6/7120.5827.21Prorocentrum donghaiense
121.2227.74
* Note that longitude and latitude indicate the center location of bloom occurrences.
Table 2. Main parameters of SGLI L2 in visible bands provided by the satellite GCOM-C.
Data LevelBandsSpatial
Resolution
Observation TimeSwath
SGLI Level 2412 nm, 443 nm, 490 nm, 530 nm, 560 nm, 670 nm250 m2:00–3:00 UTC1150 km
Table 3. Statistics of R r s λ   measurement for in situ and SGLI data. The parameters include R2, RMSE, and MAPE.
Bands (nm)R2RMSE (sr−1)MAPE
4120.392.1 × 10 3 33.01%
4430.562.3 × 10 3 27.3%
4900.612.9 × 10 3 18.02%
530---
5650.744.7 × 10 5 24.26%
6700.848.4 × 10 4 20.67%
Disclaimer/Publisher’s Note: The statements, opinions and data contained in all publications are solely those of the individual author(s) and contributor(s) and not of MDPI and/or the editor(s). MDPI and/or the editor(s) disclaim responsibility for any injury to people or property resulting from any ideas, methods, instructions or products referred to in the content.