Article

Radar Reflectivity Assimilation Based on Hydrometeor Control Variables and Its Impact on Short-Term Precipitation Forecasting

1
Key Laboratory of Meteorological Disaster, Ministry of Education, Joint International Research Laboratory of Climate and Environment Change, Collaborative Innovation Center on Forecast and Evaluation of Meteorological Disasters, Nanjing University of Information Science and Technology, Nanjing 210044, China
2
State Key Laboratory of Severe Weather, Chinese Academy of Meteorological Sciences, Beijing 100081, China
3
Key Laboratory of Mesoscale Severe Weather, Ministry of Education, School of Atmospheric Sciences, Nanjing University, Nanjing 210023, China
4
Center for Analysis and Prediction of Storms, University of Oklahoma, Norman, OK 73072, USA
*
Author to whom correspondence should be addressed.
Remote Sens. 2023, 15(3), 672; https://doi.org/10.3390/rs15030672
Submission received: 25 November 2022 / Revised: 6 January 2023 / Accepted: 18 January 2023 / Published: 23 January 2023
(This article belongs to the Section Atmospheric Remote Sensing)

Abstract

:
Radar reflectivity assimilation is often used to initialize hydrometeors, to which Numerical Weather Prediction (NWP) is highly sensitive. To better initialize hydrometeors, this study further developed the background error covariance (BEC) with vertical and multivariable correlations of hydrometeor control variables (H-BEC) in the WRF three-dimensional variational data assimilation system (WRFDA-3DVar). The impacts of the H-BEC are discussed using single radar reflectivity tests and series of cycling data assimilation and forecasting experiments for five multi-type convective rainfall cases. The conclusions are summarized as follows: (1) The vertical correlations can speed up the minimization of the cost function, whereas the multivariable correlations further accelerate this minimization; (2) The vertical correlations slightly improve the precipitation forecasting and only in the first hour, while multivariate correlations lead to a larger improvement and persist into the third hour; (3) The application of H-BEC leads to a more reasonable thermodynamic and dynamical structure of the initial field, thereby improving the capability of short-term precipitation forecasting.

1. Introduction

Accurate precipitation forecasting, especially convective precipitation, remains challenging in Numerical Weather Prediction (NWP) [1,2]. Due to the cloud microphysical parameterization and the highly nonlinear characteristics of hydrometeors, it is essential to reasonably initialize hydrometeors in NWP models [3,4,5,6,7,8]. Doppler weather radar soundings can provide high spatial and temporal resolution observations and are one of the main sources of falling hydrometeor information, which give useful indications for short-term weather prediction [9,10,11].
Among radar observations, radial velocities and radar reflectivity are widely used in mesoscale data assimilation systems. The assimilation of radial velocities is relatively mature, and it can be very useful for convective weather processes [12,13]. Many studies have pointed out that the assimilation of radial velocities can adjust the dynamical structure of the initial field, which is crucial for the occurrence and development of convective storms [14,15,16,17,18]. The assimilation of radar reflectivity can obtain a more reasonable initial field of hydrometeors and improve the forecasting of thermal and dynamical processes [19,20,21,22,23]. As mentioned by Sun et al. [13] and Wang et al. [21], the assimilation of radar reflectivity can reduce the spin-up time and improve the precipitation forecast skill, at least in the first few hours. In addition, some studies have indicated that convective storm forecasts can be improved in the first 0–6 h when radial velocity and radar reflectivity are used together [14,16,24]. However, the assimilation of radar reflectivity is still challenging in terms of initialization of the hydrometeors.
There are many radar reflectivity assimilation approaches to initialize hydrometeors in numerical weather prediction (NWP) models. For example, cloud analysis [25], variational assimilation [16,20,21], ensemble Kalman filter (EnKF) [26] and hybrid variational and ensemble approaches [8,27]. Among these data assimilation approaches, variational assimilation is still widely used for radar data assimilation at convective scales, due to its relatively mature development and high computational efficiency [13,21,22,28,29,30,31,32,33].
For radar data assimilation in a variational framework, the background error covariance (BEC) plays a crucial role, which reflects the statistical characteristics of the spatial and variational covariances of the error variance [8,34,35,36]. Many studies have highlighted the prospect of the hydrometeor variables in the BEC [37,38,39]. The application of hydrometeors as control variables in BEC is also under development, especially in radar data assimilation. Wang et al. [21] defined background error characteristics for rainwater, the application of which enhanced the ability of indirect radar assimilation on the convective scale. However, this approach does not consider the propagation in vertical space and between multiple variables. Liu et al. [40] improved the vertical correlations of the hydrometeors background error by defining a temperature-dependent hydrometeors vertical profile, but the multivariable correlations are still absent. The multivariable correlations of hydrometeors were considered in data assimilations by Chen et al. [5,6] and Meng et al. [7], but the assimilations were mainly for satellite cloud observations and further practice was needed for radar assimilation. Very recently, Wang and Wang [8] developed a hydrometeors multivariate correlated radar assimilation framework, based on Grid-point Statistical Interpolation (GSI), which has given encouraging results. However, related studies are still relatively few, and need to be further validated in other models.
The Weather Research and Forecasting model data assimilation system (WRFDA) is widely used by lots of operations and studies. Previous studies have shown that WRFDA-based radar variational assimilation resulted in positive effects [16,21,31,32,33]. However, WRFDA-based radar assimilation still lacks multivariate correlations of hydrometeor variables. To better assimilate radar data and analyze the impacts of hydrometeor control variables with multivariate correlations, in the study presented herein. BEC with the vertical and multivariable correlations of hydrometeors (H-BEC) was further developed, based on the WRFDA-3Dvar, and the impacts of H-BEC were analyzed in detail.
This paper is organized as follows. Section 2 introduces the assimilation methods. Section 3 demonstrates the characteristics of the H-BEC, analyzes the vertical and multivariable correlations in detail, and evaluates the observational information spread contributed using single radar observation tests. The configuration of the experimental schemes is also introduced. Section 4 gives a description of the model domain, microphysics schemes, and methodology of radar reflectivity assimilation based on the H-BEC, and evaluates the performance of the hydrometeors vertical and multivariable correlations through cycling assimilation and forecasting experiments. In Section 5, the impacts of vertical and multivariable correlations on convective precipitation forecasting are further investigated. Finally, the summary and conclusions are presented in Section 6.

2. Methods

2.1. H-BEC in Variational Assimilation Framework

The three-dimensional variational assimilation in WRFDA combines background and observations by minimizing a cost function (J), defined as [41]:
J ( x ) = 1 2 ( x x b ) T B 1 ( x x b ) + 1 2 ( H ( x ) y o ) T R 1 ( H ( x ) y o ) .
Here, J is the cost function of the NWP model variables, x is the vector of the NWP model variable, and x b is the background vector. B and R are the background and observation error covariance matrices, respectively. The value y o is the observation vector, and H is the nonlinear observation operator mapping model space to the observation space.
An incremental approach [42] was used in WRFDA to solve the computational and storage costs problems of minimizing the cost function ( J ), which can be expressed in terms of the analysis increment δ x = x x b . As B is symmetric positive definite, it can be partitioned in terms of a lower triangular matrix ( U ) as B = U U T . Here, U T is the transpose of U . Following Derber and Bouttier [43], we defined a set of analysis control variables ( v ) as U v = δ x . Thus, in terms of analysis control variables ( v ), the objective cost function may be written as:
J ( v ) = 1 2 v T v + 1 2 ( d H U v ) T R 1 ( d H U v ) .
Here, d = y o H ( x b ) is the innovation vector, representing the departure between observation and the background, H is the linearized version of the non-linear observation operator ( H ), and v is the analysis control variables (CVs). Most studies for mesoscale weather applications use CV options, such as 7 (CV7), in WRFDA. In CV7, the control variables for v are wind components ( U , V ), temperature ( T ), pseudo relative humidity ( R H s ), and surface pressure ( P s ) [29]:
v o l d = ( U ,     V ,     T ,     P s ,     R H s ) .
In this paper, differing from Equation (3), the control variables were used as follows: longitudinal velocity ( U ), unbalanced latitudinal velocity ( V u ), unbalanced temperature ( T u ), unbalanced pseudo relative humidity ( R H s , u ), unbalanced surface pressure ( P s , u ), unbalanced cloud water mixing ratio ( q c , u ), unbalanced cloud ice mixing ratio ( q i , u ), unbalanced rain mixing ratio ( q r , u ), unbalanced snow mixing ratio ( q s , u ) and unbalanced graupel mixing ratio ( q g , u ). Then, the v in the data assimilation system would be:
v = ( U ,   V u ,     T u ,     P s , u ,   R H s , u ,     q c , u ,   q i , u ,     q r , u ,     q s , u ,     q g , u ) .
In NWP models, the full B is usually a huge matrix ( 10 7 × 10 7 ), which may make it hard to perform matrix operations on B directly [29]. To solve this problem, the B matrix can be transformed from the physical space to the control variable space using the control variable transform ( U ) method to simplify the computation. Typically, the U consists of a sequence of three transforms, the horizontal ( U h ), vertical ( U v ), and physical ( U p ) transforms, defined as:
U = U p U v U h .
B = U p U v U h U h T U v T U p T .
In the three transform operators, U p changes the analysis control variables to model state variables using the statistical balance relationship, U v is the application of vertical correlations through empirical orthogonal functions (EOF) of analysis control variables, and U h is a Laplacian method to impose the horizontal correlations.
For U p , it defines the set of control variables and their relationships, which are used to minimize cross-correlations between model variables. Statistical linear regression is applied to reduce the existing cross-correlations (the balanced part). In this way, the control variables are less correlated with each other; i.e., off-diagonal terms in the lower matrix vanish:
[ U V T P s R H s q c q i q r q s q g ] = [ I 0 0 0 0 0 0 0 0 0 r 2 _ 1 I 0 0 0 0 0 0 0 0 r 3 _ 1 r 3 _ 2 I 0 0 0 0 0 0 0 r 4 _ 1 r 4 _ 2 r 4 _ 3 I 0 0 0 0 0 0 r 5 _ 1 r 5 _ 2 r 5 _ 3 r 5 _ 4 I 0 0 0 0 0 r 6 _ 1 r 6 _ 2 r 6 _ 3 r 6 _ 4 r 6 _ 5 I 0 0 0 0 r 7 _ 1 r 7 _ 2 r 7 _ 3 r 7 _ 4 r 7 _ 5 0 I 0 0 0 r 8 _ 1 r 8 _ 2 r 8 _ 3 r 8 _ 4 r 8 _ 5 0 0 I 0 0 r 9 _ 1 r 9 _ 2 r 9 _ 3 r 9 _ 4 r 9 _ 5 0 0 0 I 0 r 10 _ 1 r 10 _ 2 r 10 _ 3 r 10 _ 4 r 10 _ 5 0 0 0 0 I ] [ U V u T u P s , u R H s , u q c , u q i , u q r , u q s , u q g , u ] .
Here, U ,   V , T   q g are the analysis variables, and V u , T u , P s , u   q g , u are the unbalanced parts of the analysis variables. The r i _ j   ( i : 2, …, 10, and j : 1, …, 9) is balance operator calculated by linear regression, which defines the balance relationship between the i th and j th control variables. In this study, each hydrometeor variable ( q c , u ,   q i , u ,   q r , u ,   q s , u   and   q g , u ) was correlated with the conventional variables ( U ,   V u ,   T u ,   P s , u   a n d   R H s , u ) by the balance relationship [35]. In this way, the analysis of hydrometeors could influence conventional control variables, and vice versa. Notably, differing from Wang and Wang [8], the direct cross-correlations and effects among hydrometeor variables were ignored in Equation (7), due to the nonlinearity of the hydrometeors, but could still affect other hydrometeors indirectly through the updated conventional variables. Take q c for example:
q c , u = q c ( r 6 _ 1 U + r 6 _ 2 V u + r 6 _ 3 T u + r 6 _ 4 P s , u + r 6 _ 5 R H s , u ) .
The other two operators ( U v , U h ) define the spatial auto-correlations of the control variables. The U v defines the vertical auto-correlations for each control variable Empirical Orthogonal Functions (EOF) mode. The BEC matrix is then decomposed into eigenvalues and eigenvectors in the vertical direction. Moreover, U h defines the horizontal auto-correlations for the control variables using the Laplacian method on the EOF modes, and this method can significantly improve the computational efficiency of the horizontal length scale in U h [39,44].

2.2. Hydrometeor Mixing Ratio Retrievals for Indirect Reflectivity Assimilation

In the indirect reflectivity assimilation approach, the hydrometeor mixing ratios retrieved from the reflectivity factor are assimilated [21]. The equivalent radar reflectivity factor ( Z e ) can be obtained by summing the backscattering of the hydrometeor particles [45,46,47,48]:
Z e = Z ( q r ) + Z ( q s ) + Z ( q g ) .
Here, Z ( q r ) , Z ( q s ) , and Z ( q g ) are the reflectivity factor (unit: m m 6 m 3 ) of rain, snow, and graupel, respectively. For each hydrometeor variable x (e.g., “ r ” means rain, “ s ” means snow and “ g ” means graupel), its equivalent radar reflectivity can be calculated using a simplified Z-q relation, which can be expressed as:
Z ( q x ) = a x ( ρ q x ) 1.75 .
Here, ρ is the air density, q x is the mixing ratio of the hydrometeor variable x , and a x is the coefficient of hydrometeor variable x . The values of a x refer to Gao and Stensrud [20].
To retrieve hydrometeor mixing ratios from radar reflectivity data, the total equivalent reflectivity needs to be partitioned to each hydrometeor variable x with its contribution C x :
Z ( q x ) = C x Z e .
In WRFDA, the C x is determined by temperature discrimination. In this scheme, the contribution of rainwater increases linearly from 0 to 1 within −5 °C and 5 °C, while the proportion of snow and graupel is a fixed value, measured by the ratio of their coefficients. Lastly, the hydrometeor mixing ratio can be retrieved from observed reflectivity with:
q x = e x p ( l n ( Z ( q x ) a x ) / 1.75 ) / ρ .

3. Characteristics of H-BEC

To analyze the characteristics in the H-BEC, the National Meteorological Center (NMC) method [49] was used to compute H-BEC, using error samples with different forecast durations (12 and 24 h) at the same times. The period of samples covered the period from 1 to 31 July, 2017. The vertical characteristics and balanced part contribution to hydrometeors is discussed in detail. The propagation characteristics of observational information is investigated using single radar reflectivity observation tests.

3.1. Vertical Correlations of the Hydrometeor Background Errors

In order to analyze the vertical characteristics of the hydrometeor in H-BEC, the hydrometeor vertical background errors are analyzed. The first-mode eigenvectors of the vertical transform represented the main vertical characteristics of the background error in EOF space [6]. The vertical auto-covariance defined the variance among the mode levels, which reflected the vertical propagation characteristics of the observational information [38]. Figure 1 displays vertical eigenvectors and vertical auto-covariance of hydrometeors.
Figure 1a shows that the main error levels of the liquid-phase hydrometeors ( q c and q r ) were lower than the solid-phase hydrometeors ( q i , q s , and q g ). The reason is that lower temperature in the upper troposphere prevents the formation of liquid-phase hydrometeors. At the middle and upper model levels, the background errors of q s and q g span wider vertically than q i (Figure 1a), which allows the analysis of q s and q g to propagate more widely in the vertical direction than the analysis of q i .
The vertical auto-covariance of q c (Figure 1b) and q r (Figure 1d) appeared below the 26th level (~400 hPa), which could limit the analysis of q c and q r to propagate to upper levels. It could be found that the vertical auto-covariance was stronger for q s (Figure 1e) and q g (Figure 1f) than for q i (Figure 1c), which indicated that the analysis of q s and q g were more easily propagated in the vertical direction than the analysis of q i . This phenomenon was consistent with the findings of Descombes et al. [39].

3.2. Multivariable Correlations in the H-BEC

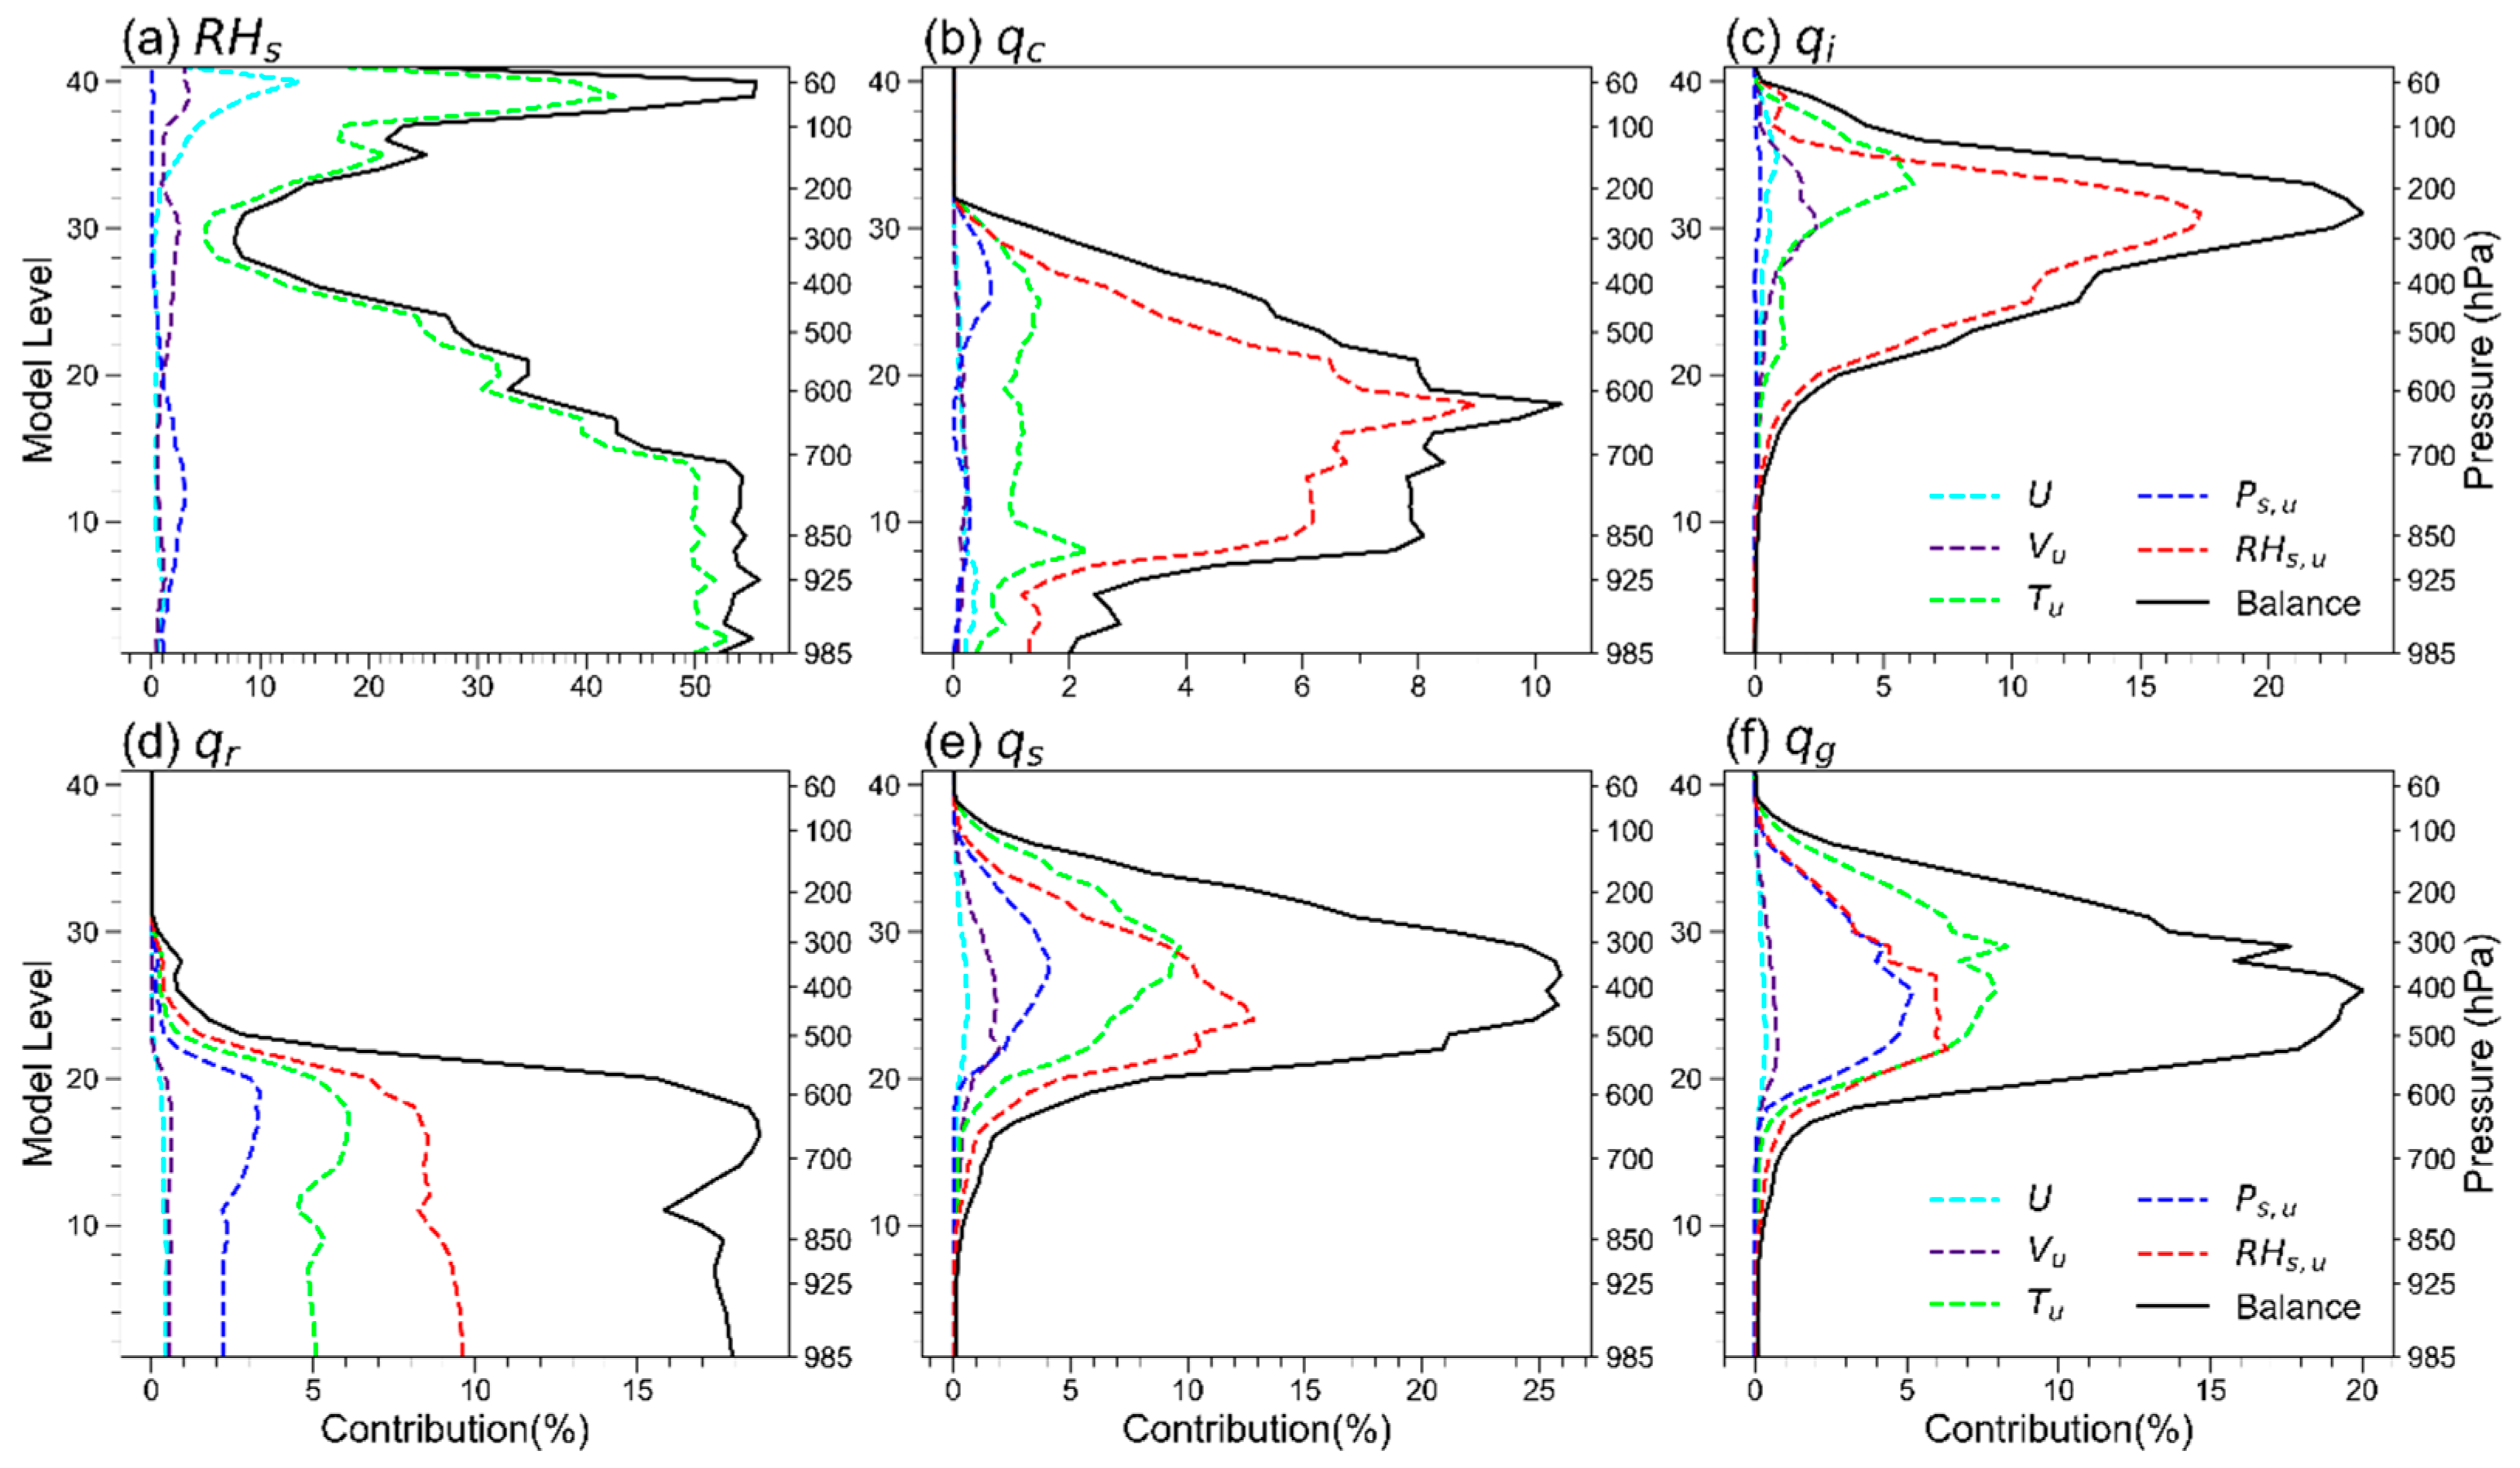
The magnitude arising from the balance part in the physical transform ( U p ) reflects the correlations between two CVs. Figure 2 shows the vertical distribution of the balanced part contribution to pseudo relative humidity ( R H s ) and hydrometeors. The larger the contribution, the stronger were the correlations between the two CVs. The contribution of conventional control variables to the balanced part of the liquid hydrometeors (Figure 2b,d) was located mainly in the middle and lower troposphere, whereas that of the solid hydrometeors were located in the middle and upper troposphere (Figure 2c,e,f). The contributions to hydrometeors came mostly from unbalanced temperature ( T u ), unbalanced pseudo relative humidity ( R H s , u ), and unbalanced surface pressure ( P s , u ). Moisture is the source for hydrometeors, whereas latent heat provides the energy for the moisture’s phase transformation, which can be seen in Figure 2a, where the unbalanced temperature ( T u ) had the greatest contribution to pseudo relative humidity ( R H s ). In addition, unbalanced surface pressure ( P s , u ) was also closely related to hydrometeors, especially the precipitable hydrometeors ( q r , q s , and q g ), which reflected the close connection between low pressure and precipitation. Based on the weak correlations between zonal and meridional wind ( U and V ) and other basic variables that were found by Sun et al. [29], we further found that U and V were also weakly correlated with hydrometeor variables.

3.3. Single Radar Reflectivity Observation Tests

Before applying this H-BEC to real radar reflectivity assimilation, single radar reflectivity observation tests are required to investigate the characteristics of spread of observation information introduced by the BEC [21]. A pseudo radar reflectivity observation was assumed to be located at 26.5°N, 112.5°E at a height of 1500 m (~850 hPa), and the innovation was +5 dBZ. Three schemes were applied to generate the parallel single radar reflectivity observation tests (Table 1). The first experiment was the control run (CTRL), where no vertical or multivariable correlations were introduced into the H-BEC. The vertical correlations were included in the Hydro experiment, and the multivariable correlations were then introduced in the Hydro+reg experiment.
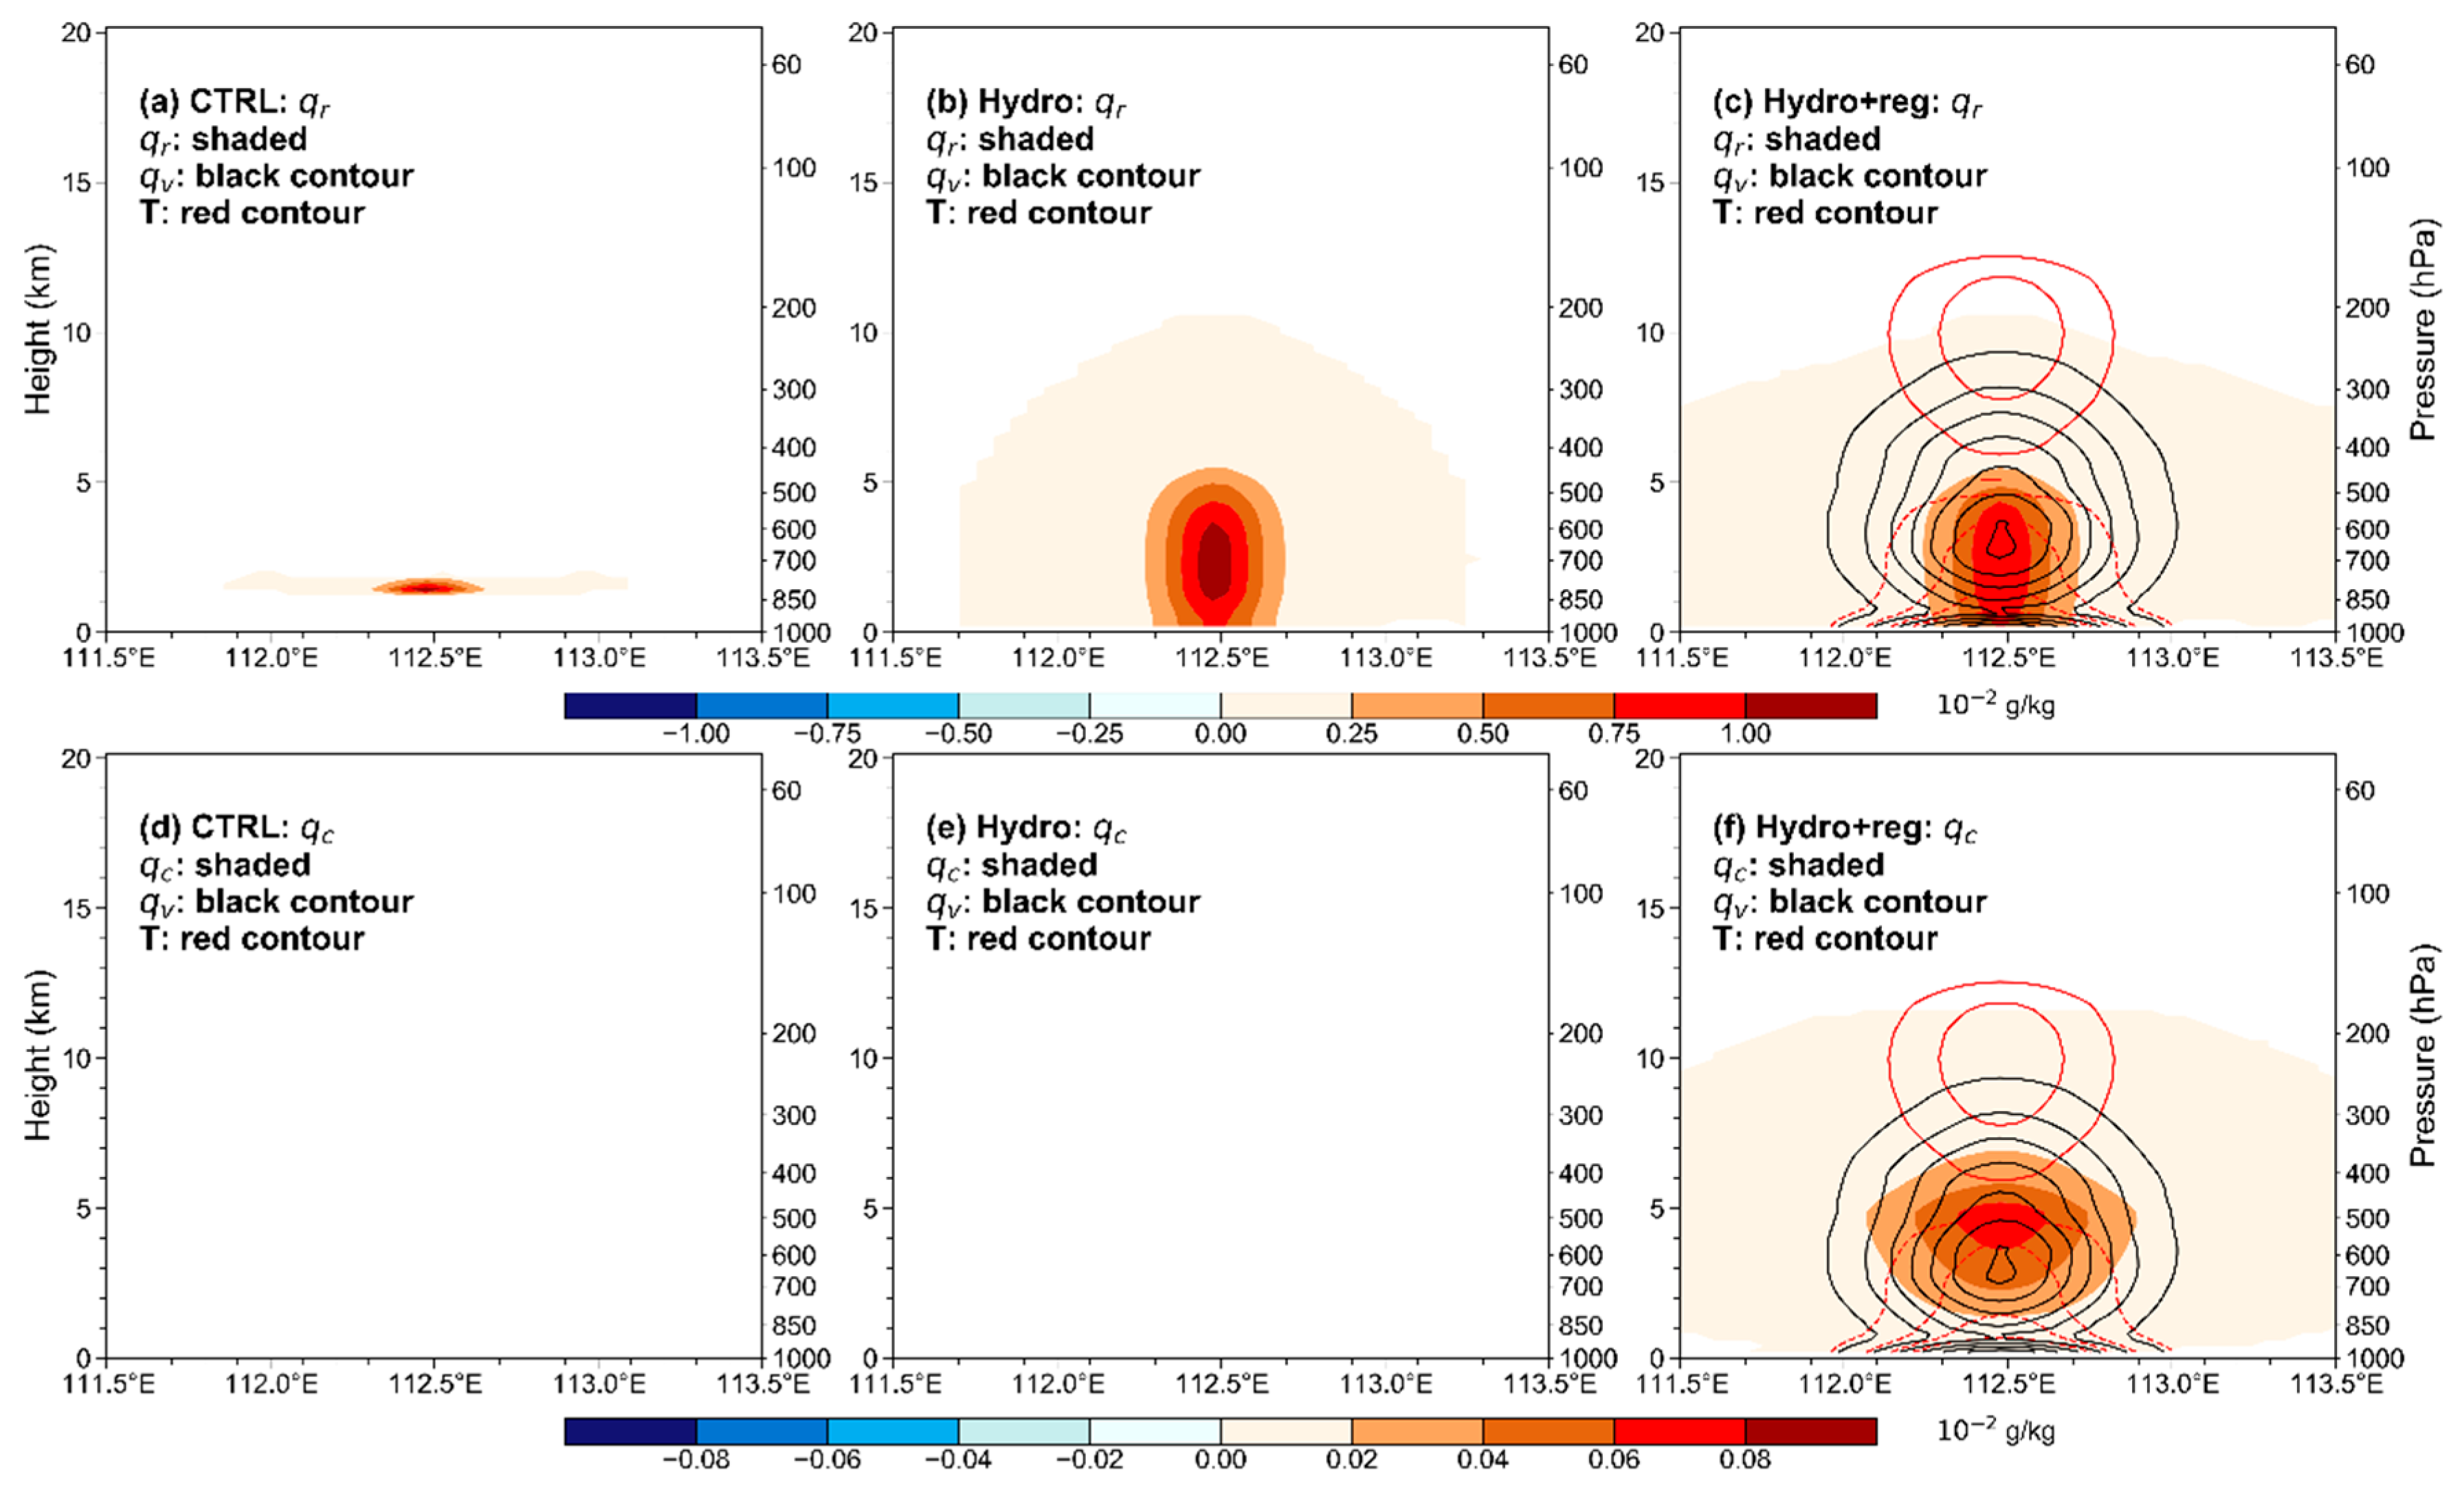
Figure 3 shows the increments of q r , q c , T , and q v after assimilating the pseudo radar reflectivity observation. The assimilation of radar reflectivity could result in increments in q r . In the CTRL experiment, the analysis increment of q r was only around the pseudo-observation point (Figure 3a) without transferring to other levels and variables (Figure 3d,g). Compared with the CTRL experiment, there was clear vertical transfer of the q r analysis increment in the Hydro experiment (Figure 3b) due to the addition of vertical correlations. However, due to the lack of multivariate correlations, there was no increment of T and q v in the Hydro and CTRL experiments (Figure 3a,b). In the Hydro+reg experiment, the analysis increment of q r not only showed a vertical propagation like the Hydro experiment (Figure 3c), but also transferred to T and q v , via multivariable correlations.
In addition, the increments of q r can influence conventional variables via the multivariate correlations between conventional variables and hydrometeor variables, and can also indirectly influence other hydrometeors (e.g., q c and q i ) by the updated conventional variables (Equations (7) and (8)). As Figure 3f shows, the Hydro+reg experiment also had an increment of q c , while the Hydro and CTRL experiments did not (Figure 3d,e). Similar conclusions could be obtained from the analysis of other hydrometeors (not shown). As mentioned above, multivariate correlations could allow the transfer of observational information across more variables, thus leading to a more coordinated analysis of control variables.

4. Evaluation of Cycling Data Assimilation and Forecasting Experiments

4.1. Model, Configurations, and Convective Rainfall Cases

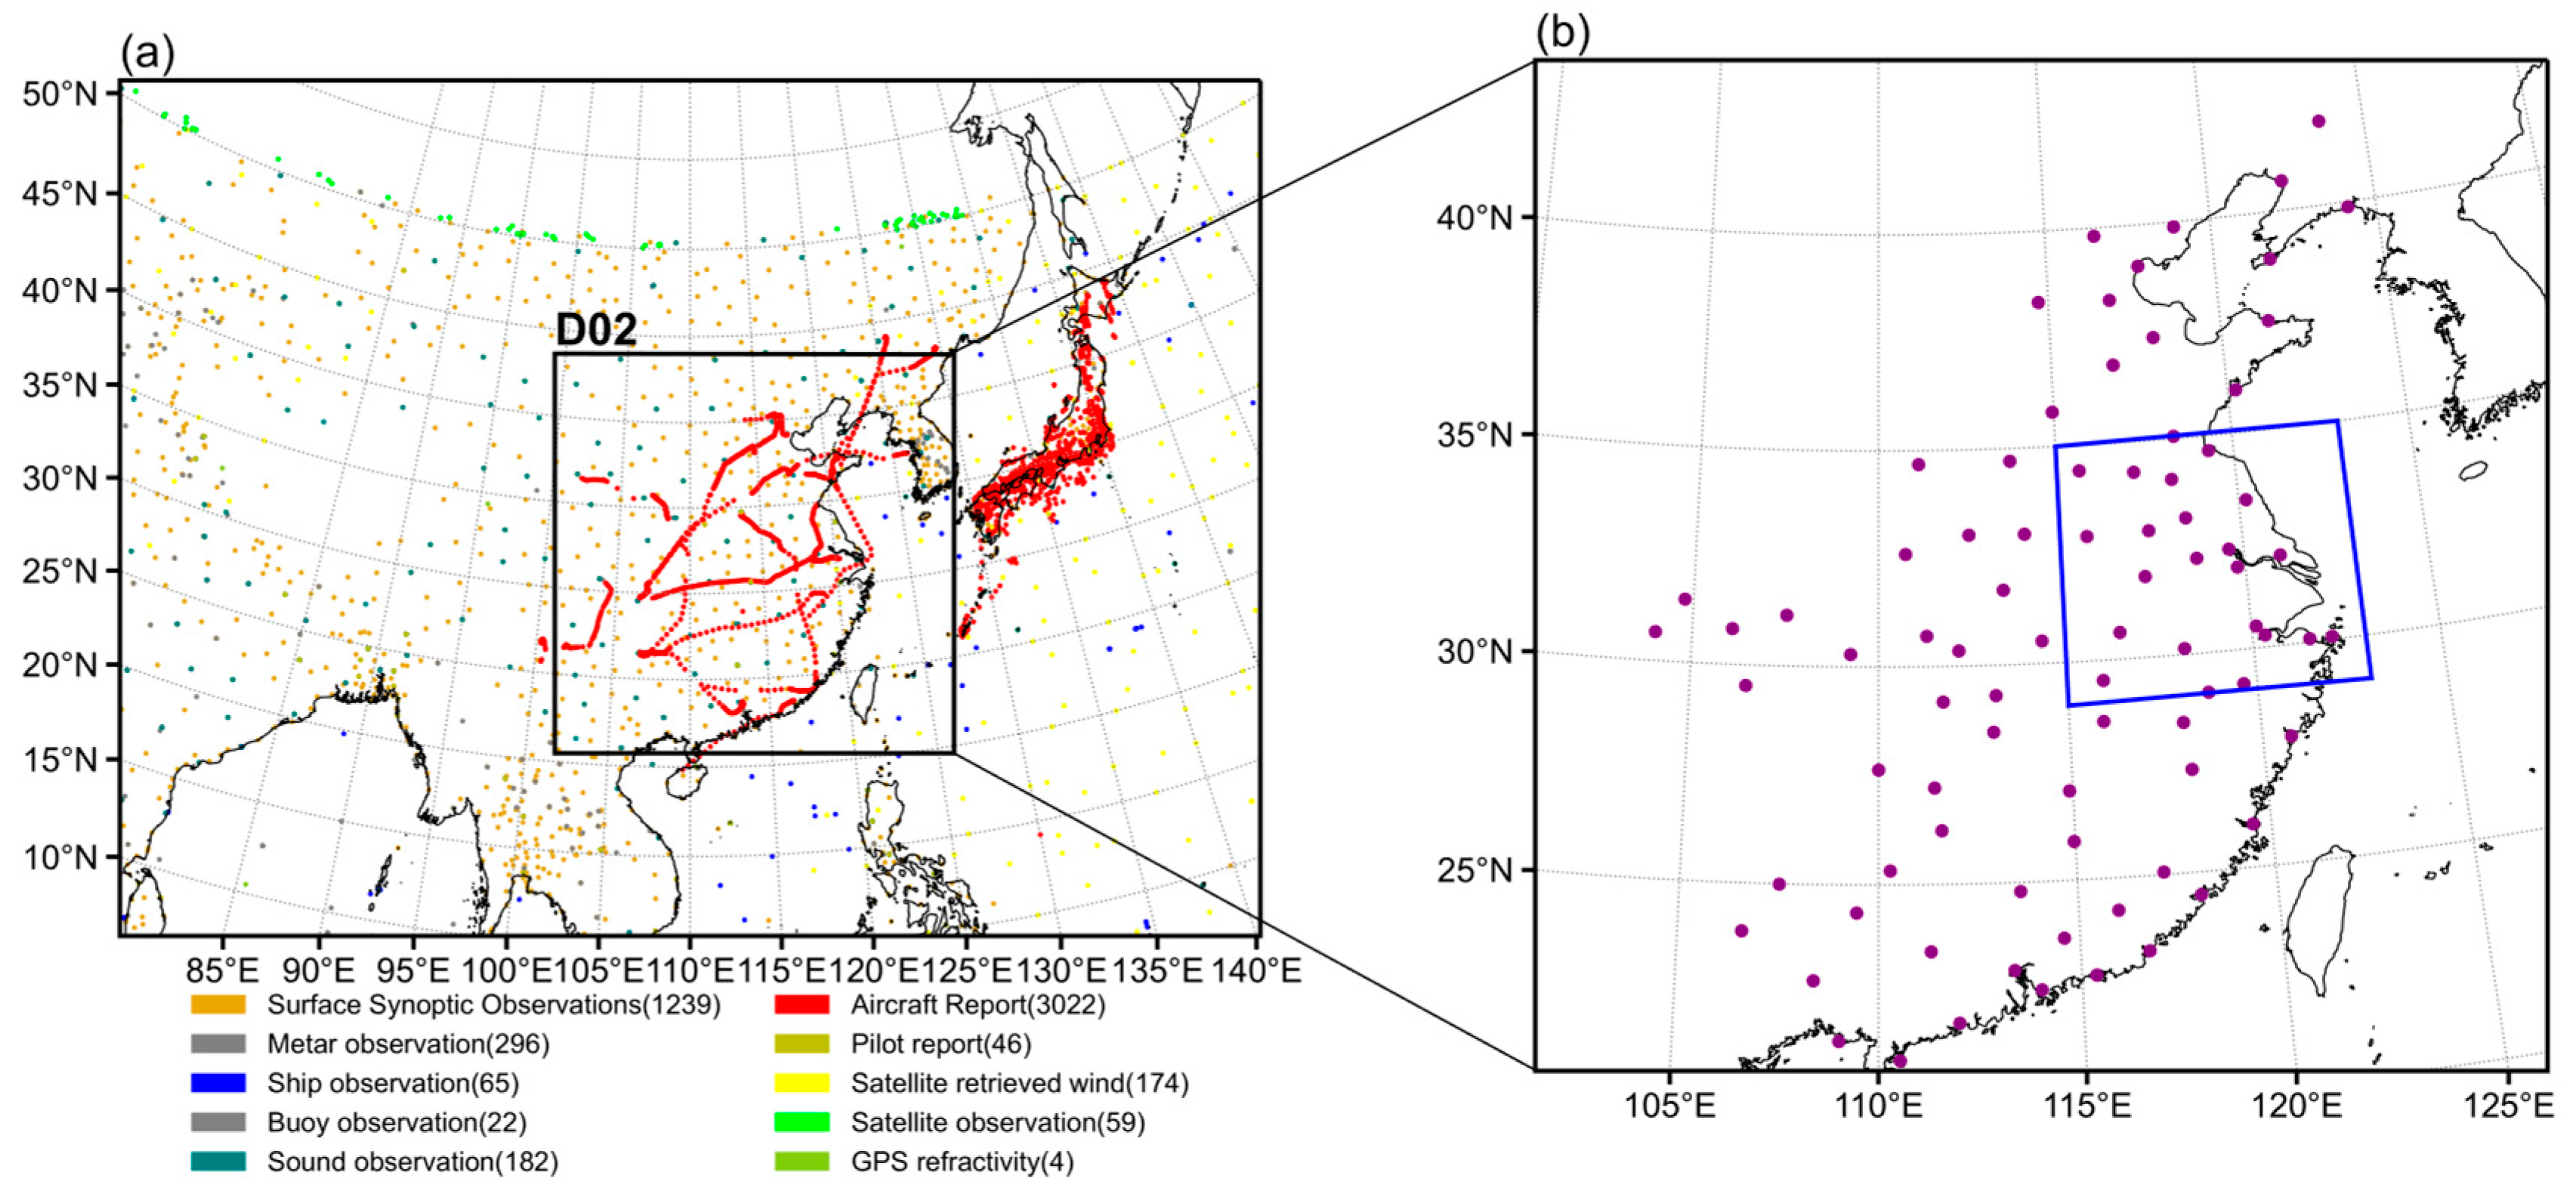
The model grid is shown in Figure 4. Double two-way nested grids (d01 and d02) were configured using 481 × 361 (15 km) and 505 × 505 (5 km) horizontal grid points, respectively. Both domains were configured using 42 vertical levels with a model top of 50 hPa. The Advanced Research WRF model (ARW-WRF) [50] was used as the NWP model, configured using the WRF Single-Moment 6-class (WSM6) microphysics parameterization scheme [51], the Rapid Radiative Transfer Model (RRTM) longwave radiation scheme [52], the Dudhia shortwave radiation scheme [53], the Yonsei University (YSU) boundary layer scheme [54], the Kain-Fritsch cumulus parameterization scheme [55], and the Unified Noah Land Surface Model [56]. Note that the cumulus parameterization scheme was applied only in the coarser grid (d01).
For radar assimilation, the indirect three-dimensional variational (3DVar) method [21] was applied. Following previous studies [8,57], the observation errors of radial velocity and reflectivity were set as 2 m/s and 5 dBZ, respectively.
The three schemes mentioned in Section 3.3 (Table 1) were applied to generate parallel radar data assimilation and forecasting experiments. The procedures followed in these three schemes are shown in Figure 5. A 6-h spin-up was performed using the analysis and forecast field of the Global Forecast System (GFS), then the Global Telecommunication System (GTS) observations (Figure 4a) were assimilated in d01 and d02 at 3 h intervals with an assimilation window of ±1 h. Radar data from 78 stations (Figure 4b) were only assimilated in d02 at 1 h intervals with an assimilation window of ±3 min, and the radar observations were thinned to a resolution of 5 km to reduce correlations among observations. Similar to Sun et al. [23], only reflectivity above 25 dBZ was assimilated.
To evaluate the impacts of vertical and multivariable correlations in the H-BEC on radar reflectivity assimilation and convective precipitation forecasting, five multi-type convective rainfall cases (Table 2), that occurred in the Yangtze-Huaihe basin, were selected for cycling data assimilation and forecasting. All five cases followed the process in Figure 5 for a total of 20 assimilation and forecasting cycles.

4.2. Root Mean Square Error (RMSE)

The 20-cycle-averaged root mean square error (RMSE) of U , V , T , and specific humidity ( Q ) in the main precipitation area (29°–35°N, 115°–123°E; blue box in Figure 4b) of the 3 h forecast was calculated with reference to the 5th generation climate reanalysis dataset from ECMWF (ERA5–0.25o) [58] and is shown in Figure 6. Compared with the CTRL, Hydro had a slightly smaller RMSE at some levels for these four variables, indicating that the propagation of vertical observations could have a slightly positive effect. After considering the multivariable correlations in assimilation, the RMSE of these four variables reduced at most levels. The forecasting capability of the model variables in Hydro+reg were improved, relative to the case with only vertical correlations. However, the low resolution of the reference field (ERA5–0.25°) compared to the model field (5 km) might lead to a dilution of the assimilation effect, resulting in some levels being statistically insignificant. Even so, the Hydro+reg could still show neutral to positive effects.

4.3. Precipitation Score

The fractions skill score (FSS) and bias score (BS) were calculated in the main precipitation area (29°–35°N, 115°–123°E; blue box in Figure 4b), based on the merged precipitation observation data from automatic weather stations in China and Climate Prediction Center morphing technique (CMORPH) satellite data [59],
F S S = 1 N N ( P f P o ) 2 1 N [ N ( P f ) 2 + N ( P o ) 2 ] ,
B S = N A + N B N A + N C .
where N is the number of the field radius space windows in the examination area, P f is the proportion of the events of the forecast in a certain field radius, and P o is the proportion of observation in a certain field radius [60]. The FSS radius was 25 km. N A indicated the number of accurate forecasts in the examination area, N B indicated the number of false alarms in the examination area, and N C indicated the number of misses in the examination area. For FSS, 1 was the best score, and 0 was the worst. For BS, the closer the value was to 1, the smaller the bias. These two precipitation scores have been widely used in similar studies [7,21,22,27].
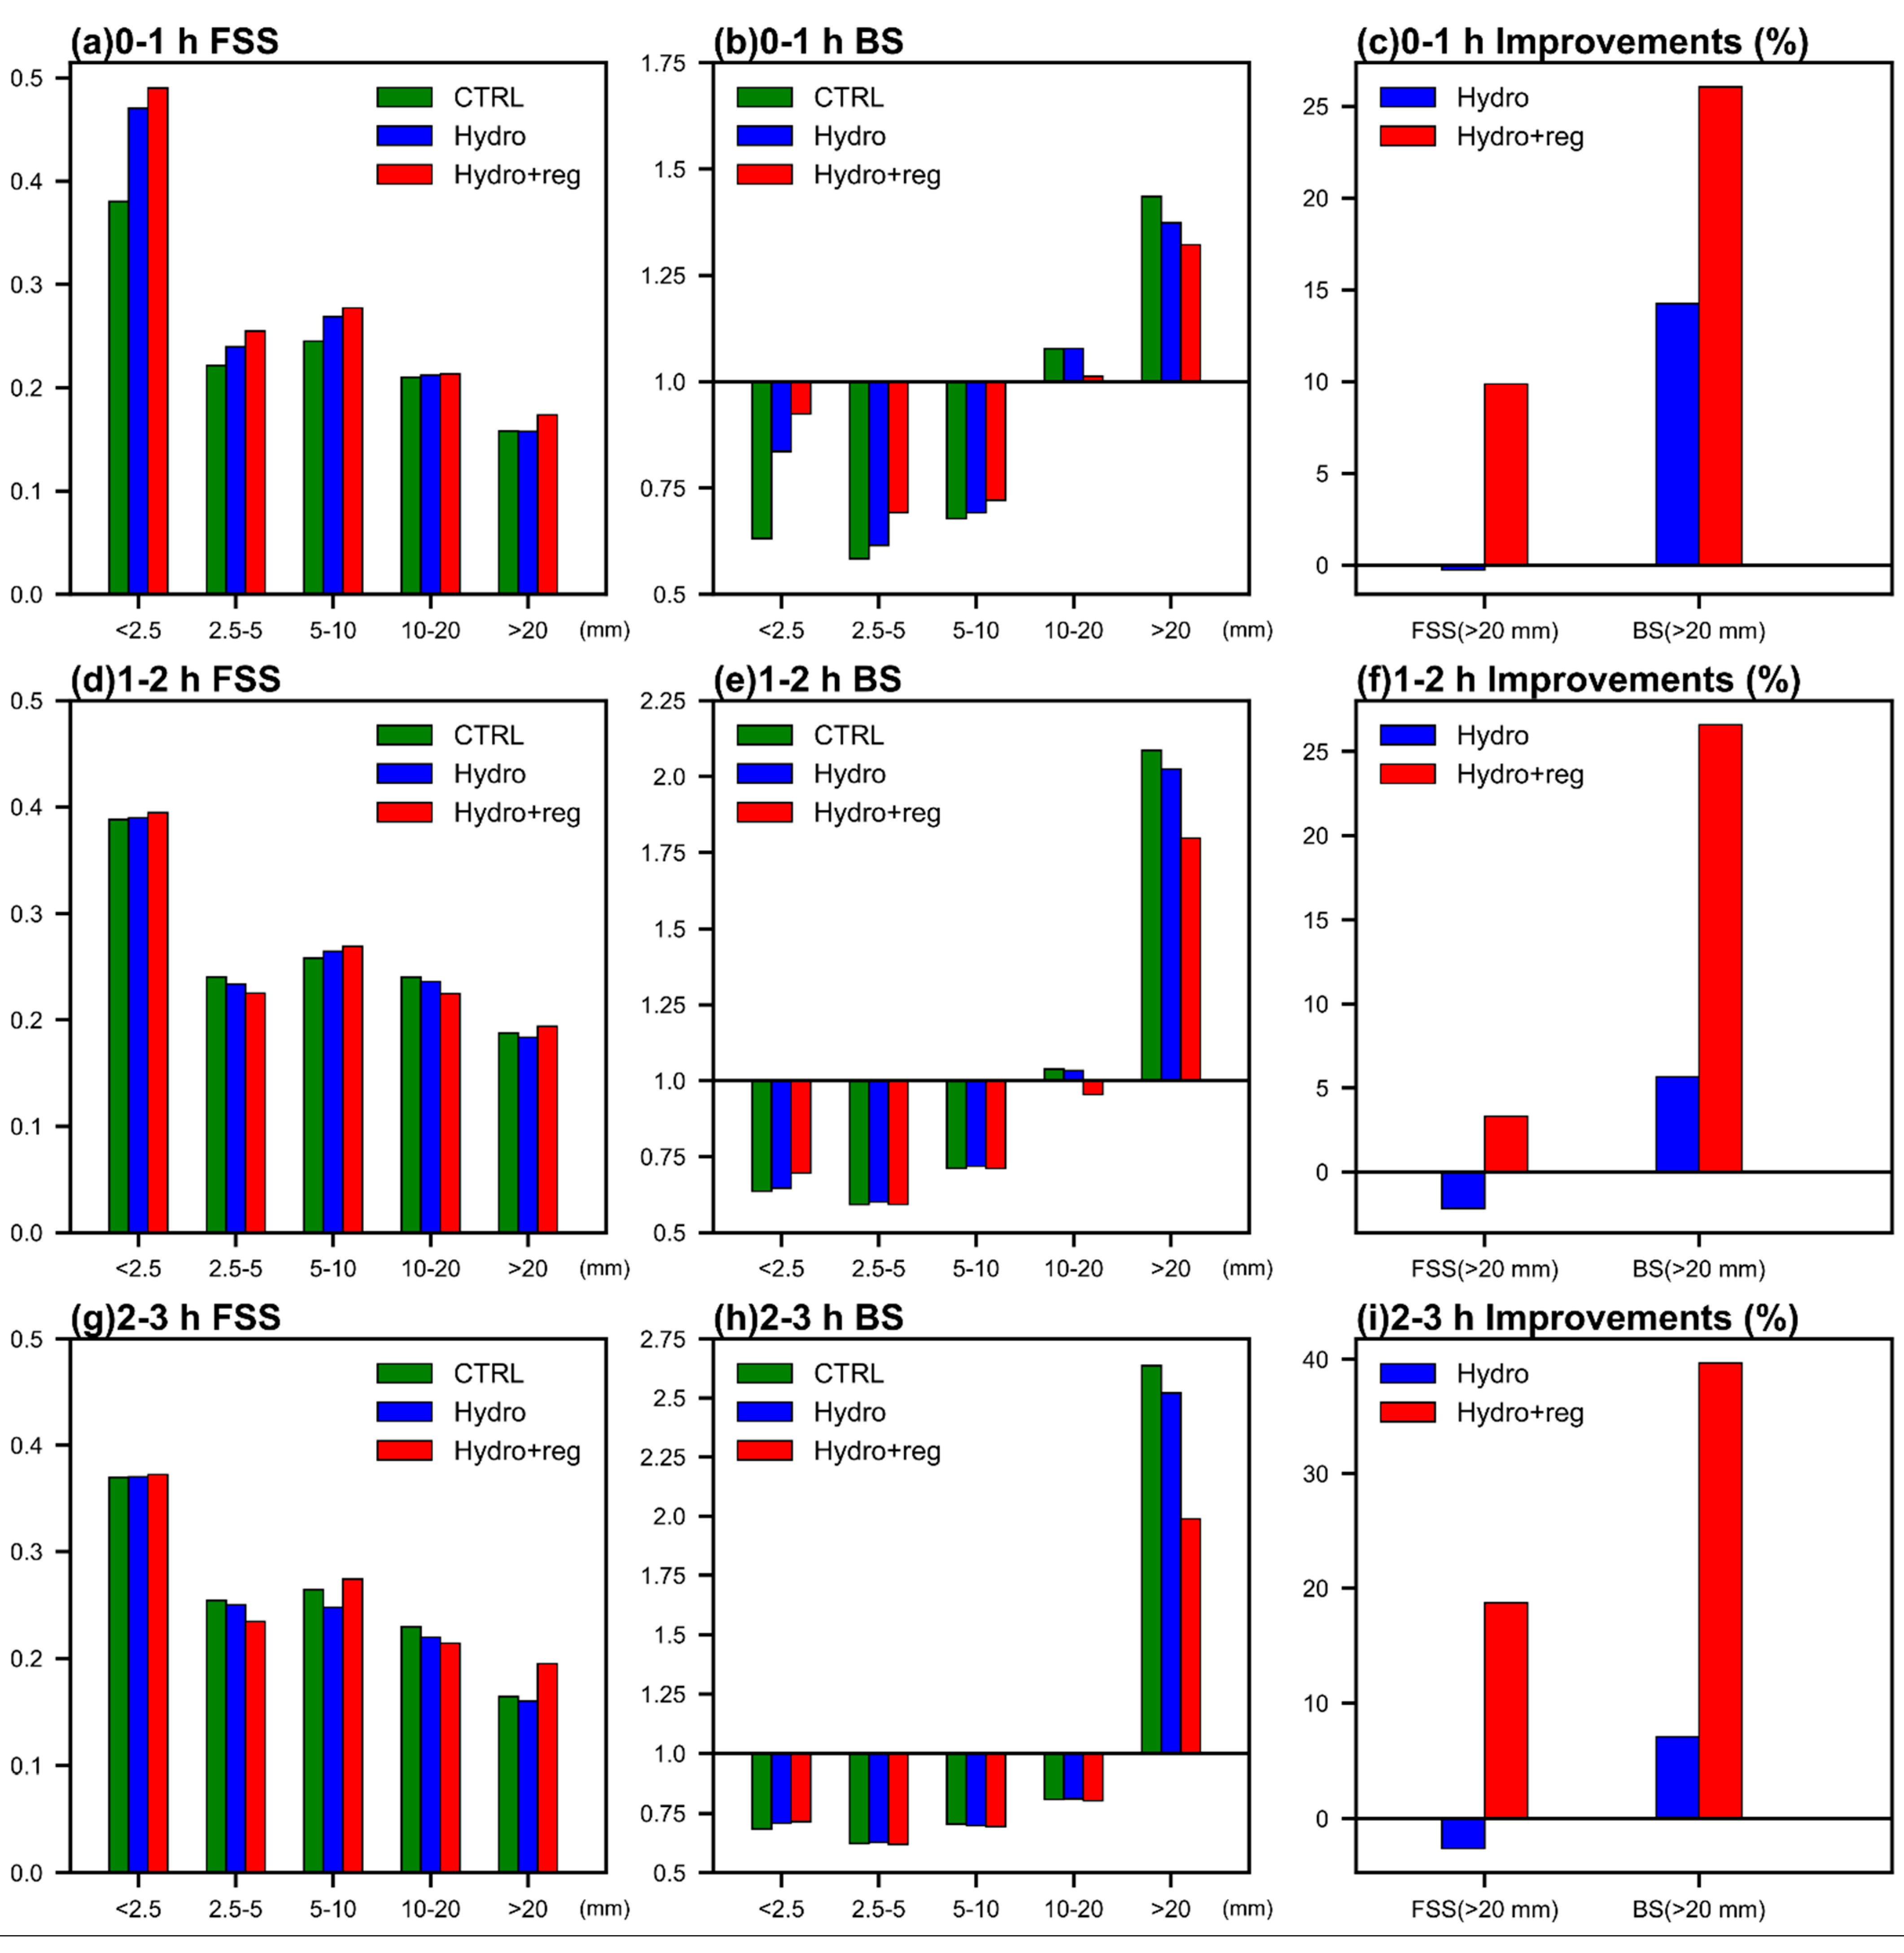
Figure 7 shows the 20-cycle-averaged FSS, BS and improvements in the percentage compared to the CTRL experiment for the cumulative precipitation forecast for each hour in the main precipitation area in the five cases. In the first hour (Figure 7a,b), the FSS in the Hydro experiment was higher than that in CTRL for most magnitudes of precipitation, and the BS was closer to 1. Compared to the CTRL and the Hydro experiment, the Hydro+reg experiment had the highest FSS, and the BS was closest to 1. In the second and third hours (Figure 7d,e,g,h), the FSS in the Hydro experiment became similar to that of the CTRL experiment, but the BS of heavy precipitation (>20 mm/h) remained closer to 1 than in the CTRL experiment. Compared to the CTRL and the Hydro experiment, the Hydro+reg experiment still had the highest FSS, and the BS was also closest to 1.
For heavy precipitation (>20 mm/h), the FSS and BS in the Hydro+reg experiment showed greater improvements, especially in the third hour (Figure 7i). For FSS, the improvement in the Hydro+reg experiment was positive compared to the CTRL experiment, with an improvement percentage of about 20% at the third hour (Figure 7i), while the improvement in the Hydro experiment was negative. For BS, the improvement percentage of the Hydro+reg experiment compared to the CTRL experiment remained above 25% and reached about 40% at the third hour, while the Hydro experiment showed a weaker improvement of only 6.5% at the third hour.
The average precipitation scores and improvements indicated that the vertical correlations could slightly improve the quantitative precipitation forecasting (QPF) ability, and the improvement existed mainly in the first hour. The multivariable correlations could further improve the precipitation forecast, especially for the heavy precipitation forecast. Furthermore, this improvement persisted into the third hour, due to the multivariate correlations of the hydrometeor control variables.

5. Diagnostics for a Fast-Moving Squall Line Case on 6 July 2019

To further explore the impacts of the vertical and multivariable correlations in H-BEC on the actual radar reflectivity assimilation, QPF, and thermal and dynamic conditions, a fast-moving squall line case on 6 July 2019 was selected for detailed analysis. This case was a typical squall line process in the Yangtze-Huaihe basin, China, which was difficult to accurately forecast in NWP model.

5.1. Overview of the Squall Line

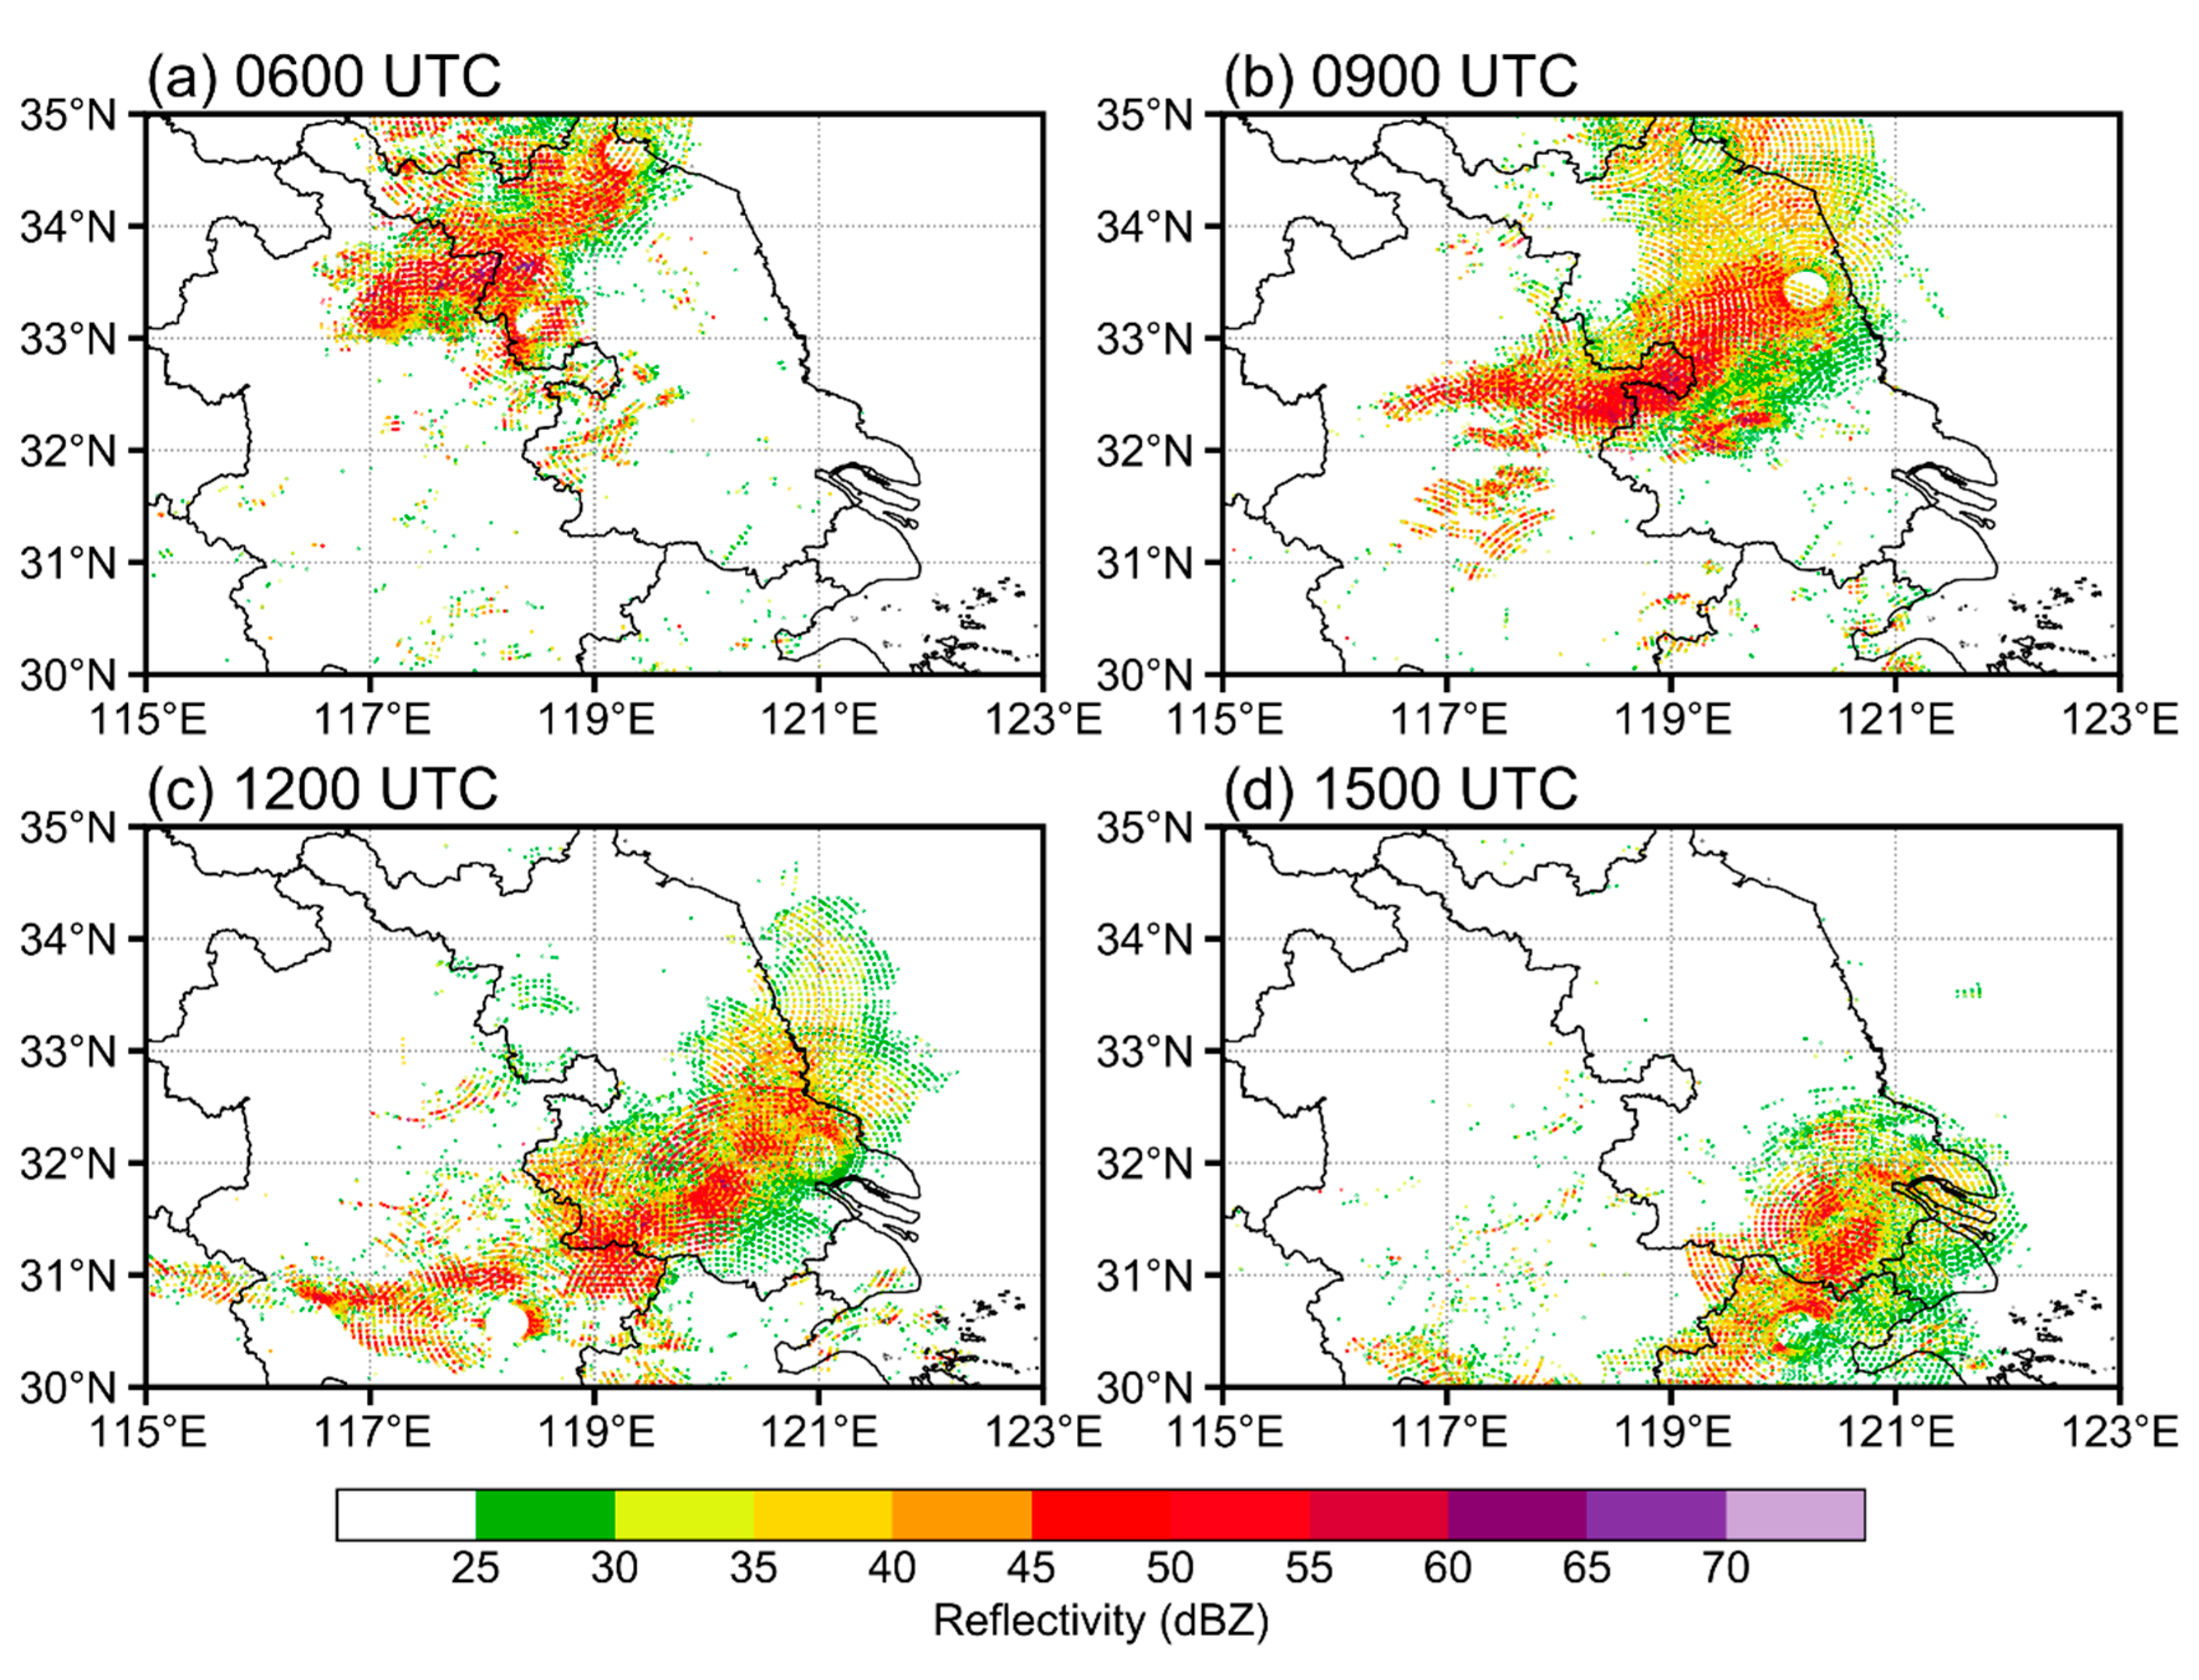
The observed composite reflectivity of this case is shown in Figure 8. The squall line lay across the north of Jiangsu and Anhui provinces at 0600 UTC, the strong reflectivity was fragmented, and the whole system was weakly organized (Figure 8a). At 0900 UTC, the squall line moved south to the central Jiangsu and Anhui provinces with a significant linear structure, following a broad stratocumulus precipitation area. At this time, the squall line was strongly organized and vigorously developed (Figure 8b). At 1200 UTC, the squall line continued moving south and lay across the south of Jiangsu and Anhui provinces, still with a significant, but weaker, linear structure (Figure 8c). At 1500 UTC, the line continued to weaken (Figure 8d). The period 0600–0900 UTC was selected to assimilate radar data, and the whole process covered the developing and the most robust stages of the squall line.

5.2. The Analysis Increment in the First Assimilation Cycle

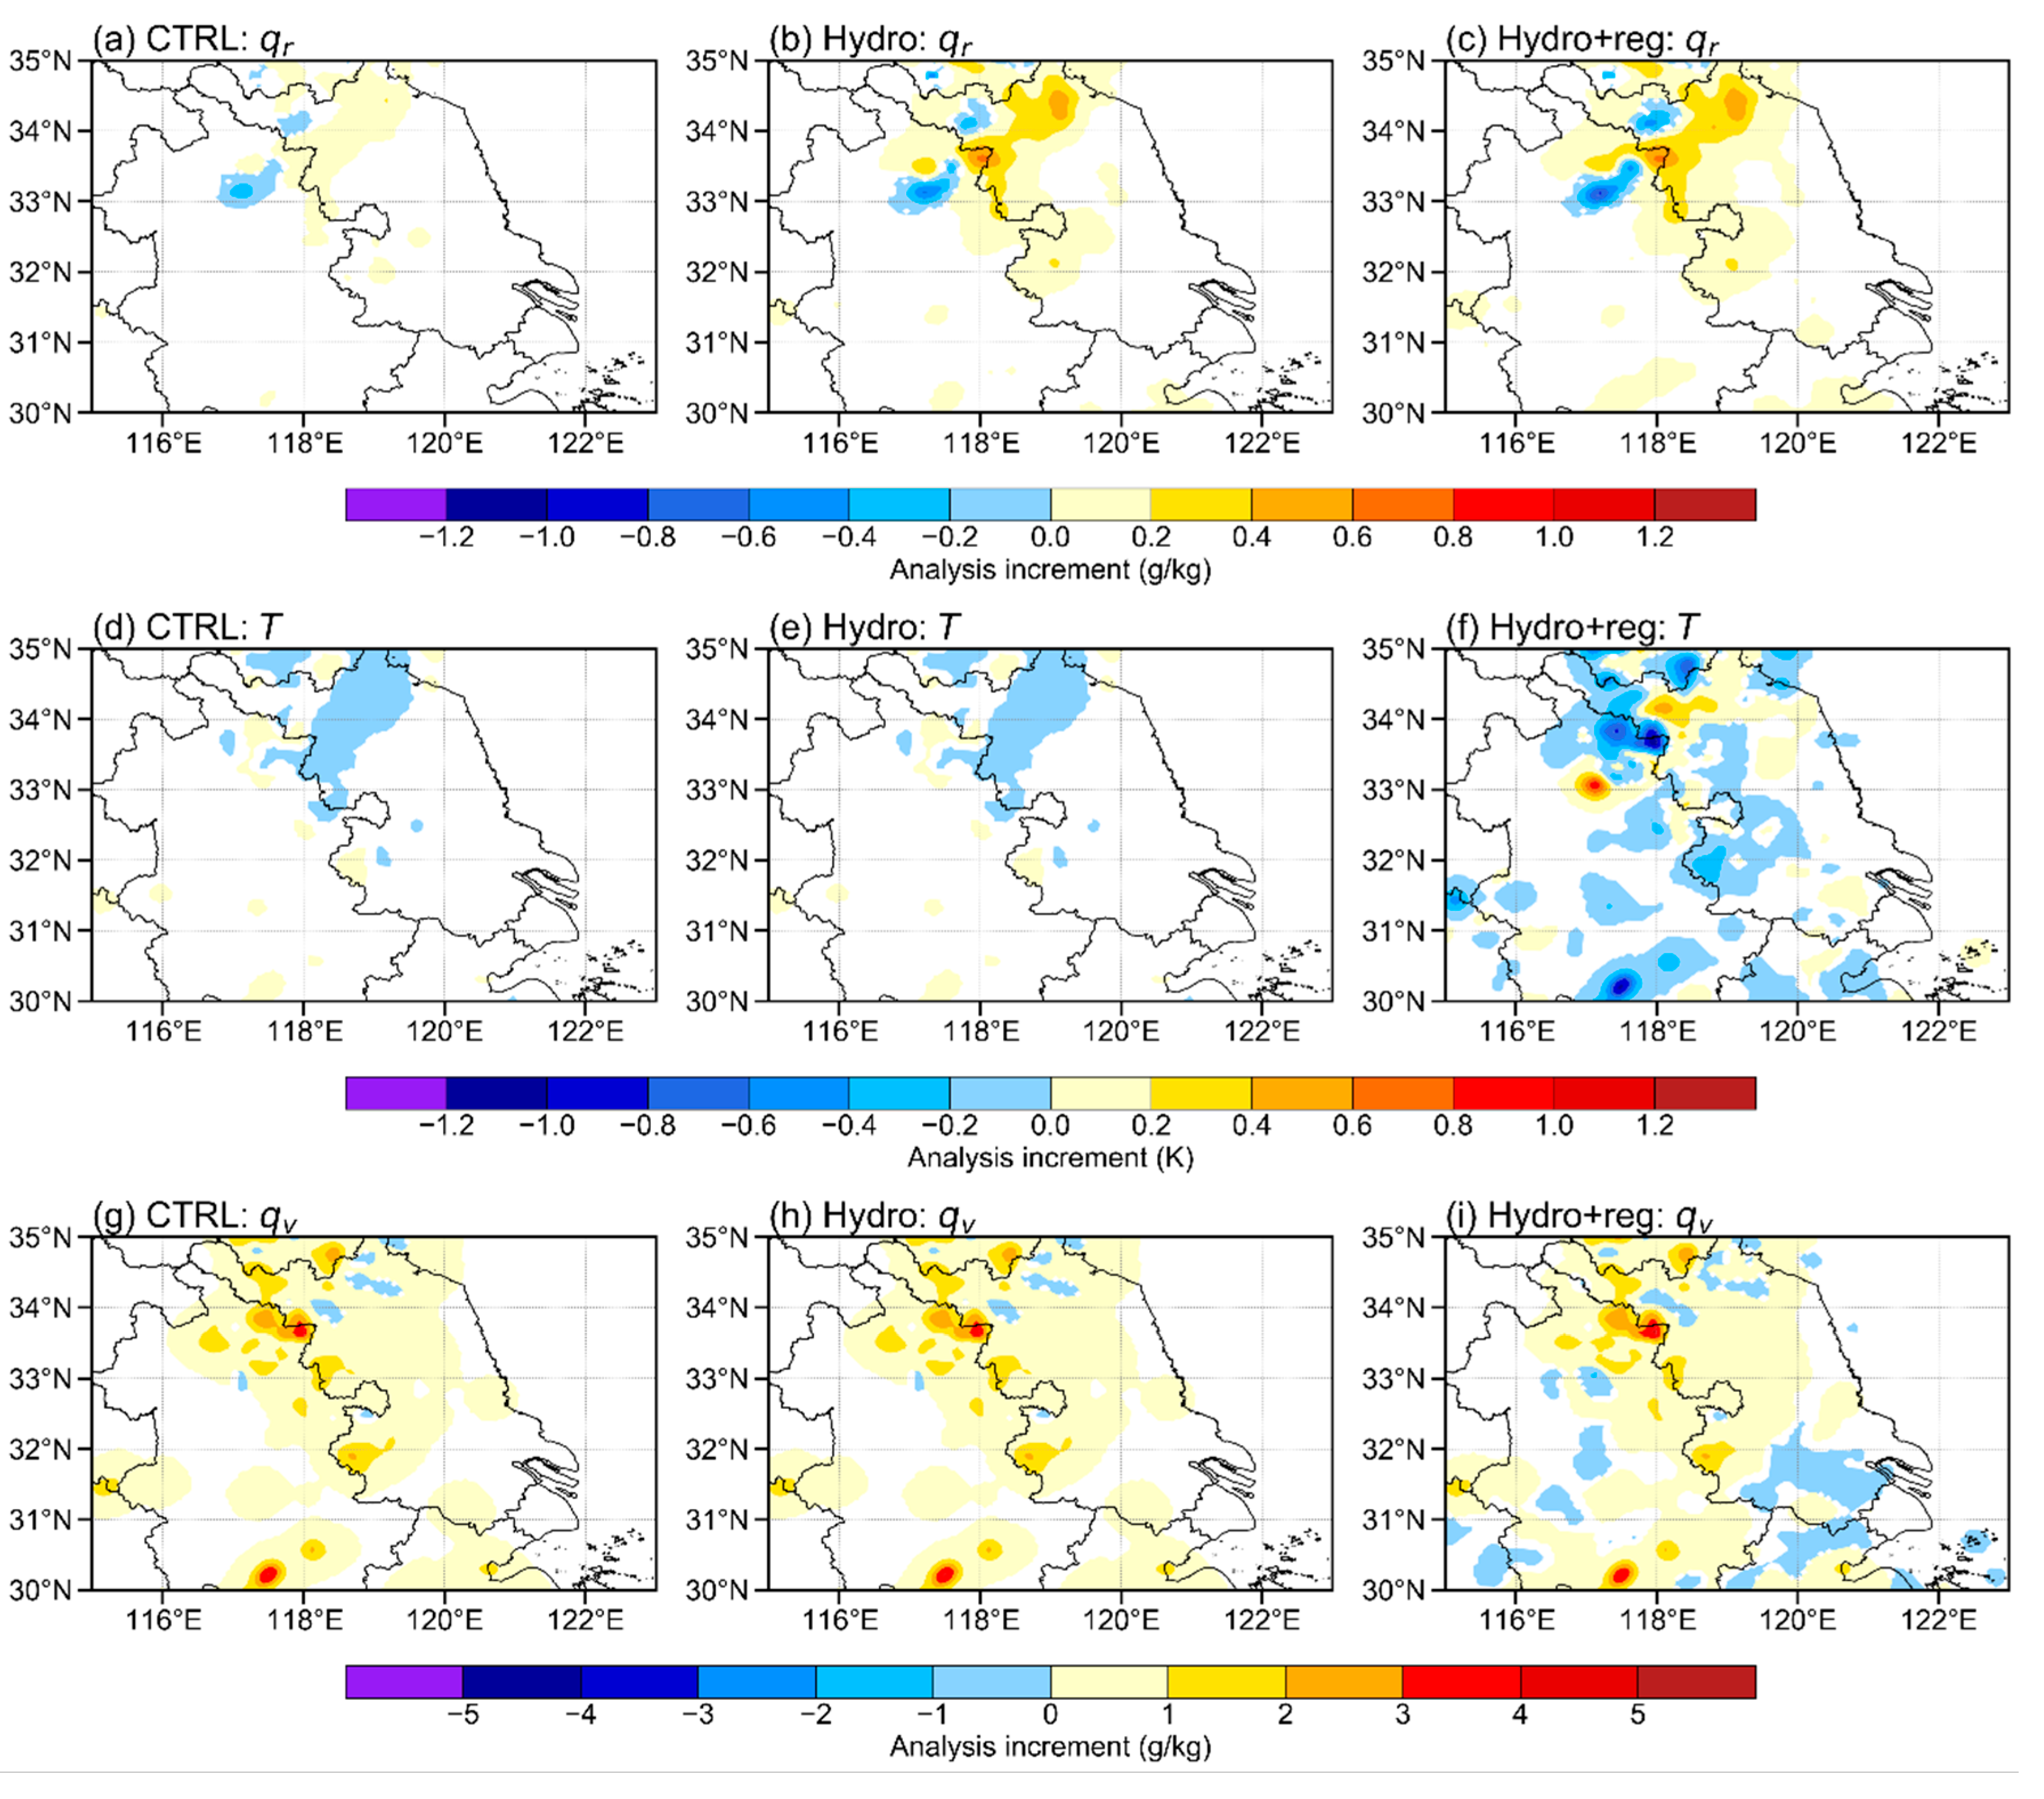
The first analysis increments of q r , T , and q v in the first assimilation cycle at level 16 (~700 hPa) are displayed in Figure 9, and the differences among the three experiments related mainly to the characteristics of the BEC. The analysis increment of q r in CTRL was small and fragmented (Figure 9a) over the north of Jiangsu and Anhui provinces, whereas it was stronger and continuous in Hydro, because the vertical correlations transferred the observation information vertically. The analysis of q s and q g at higher model levels resembled that of q r (not shown). However, the analysis increment of T and q v in Hydro was the same as in CTRL (Figure 9d,e), whereas higher increments and wider propagation were observed in Hydro+reg, retaining the structure of q r .

5.3. Cost Function

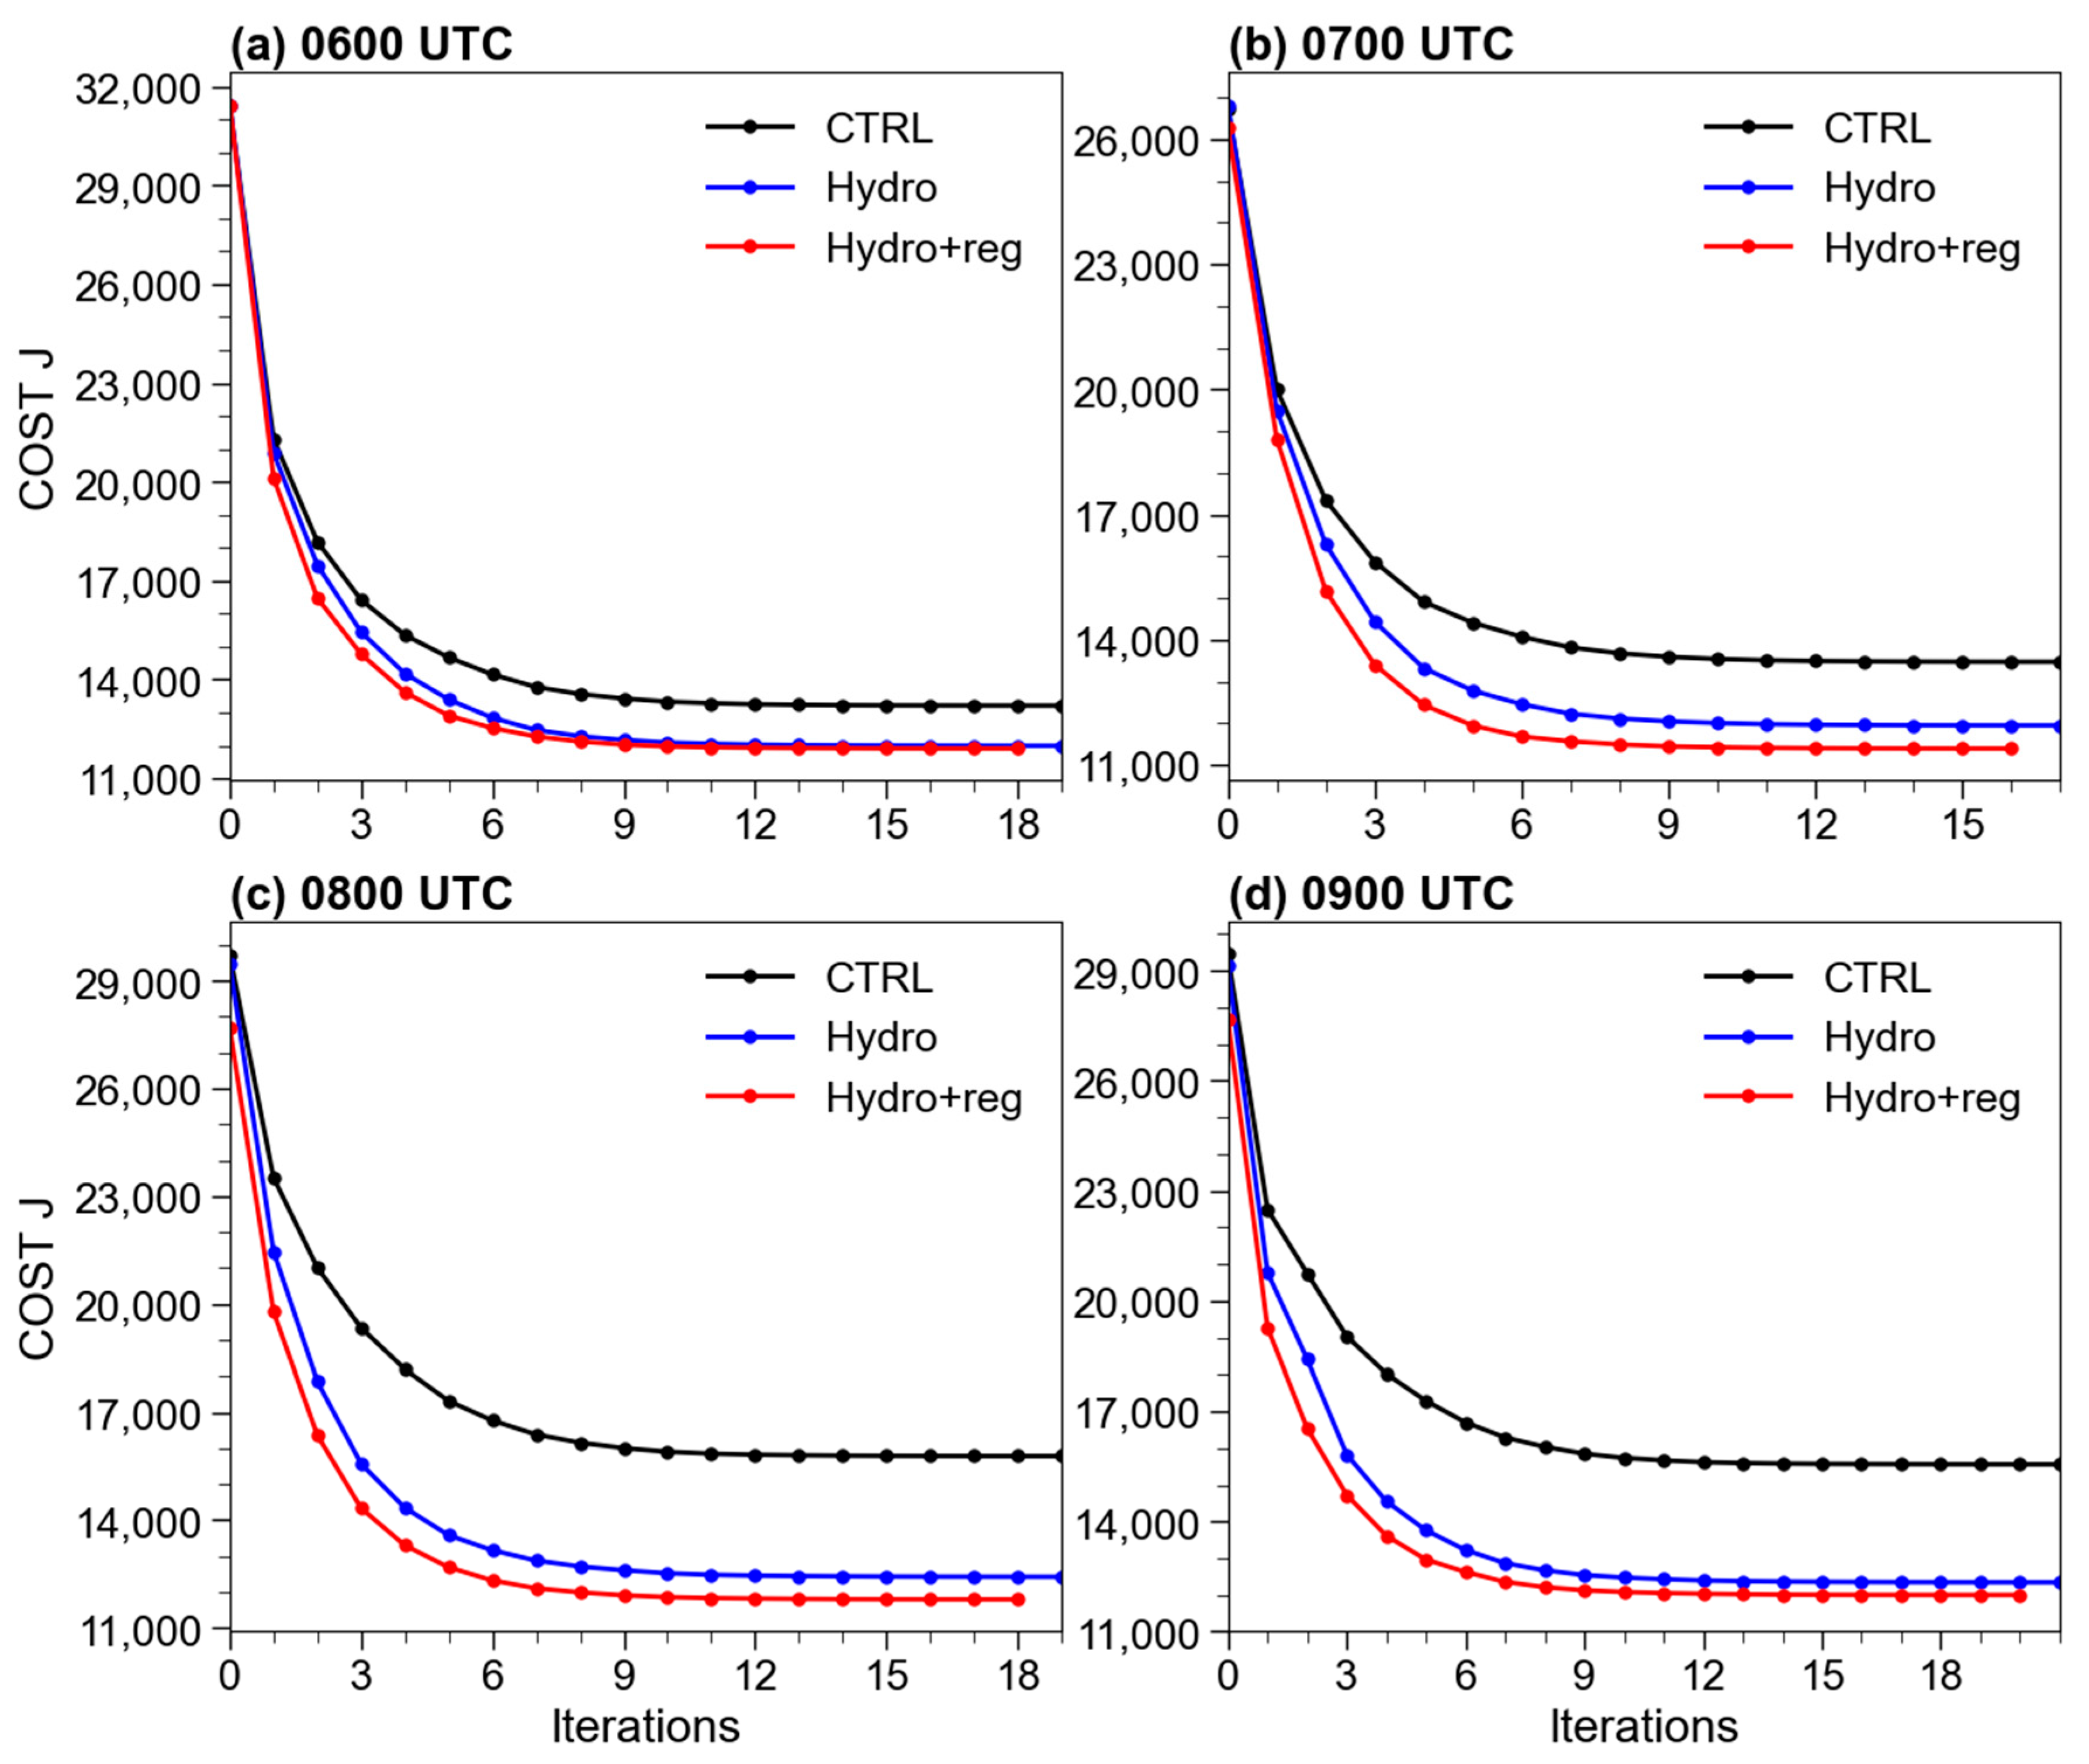
The cost function is also shown in Figure 10, and was used to investigate the impacts of vertical and multivariable correlations on actual radar data assimilation. Note that the cost function in Hydro was smaller than in CTRL at the first cycle and was further reduced in Hydro+reg. In addition, the cost function minimized faster in Hydro+reg than in CTRL and Hydro (Figure 10a); this was maintained in further cycles, whereas the difference between these experiments gradually increased (Figure 10b,c). Therefore, the minimization of the cost function improved when the vertical correlations were included. The multivariable correlations further accelerated the convergence of minimization.

5.4. Precipitation Forecast

The 3 h accumulated precipitation after three cycles is shown in Figure 11, which was used to investigate the impacts of vertical and multivariable correlations on the QPF. The observations along the line AB showed low precipitation at the center of the line with strong precipitation on either side (Figure 11a). The distribution and intensity of heavy precipitation in CTRL was greater than observations (Figure 11b), and this was slightly reduced in Hydro (Figure 11c). The distribution and intensity of heavy precipitation in the Hydro+reg (Figure 11d) were much closer to the observations, and the main fall areas of precipitation could be consistent with the observations.

5.5. Thermodynamic and Dynamical Diagnostics

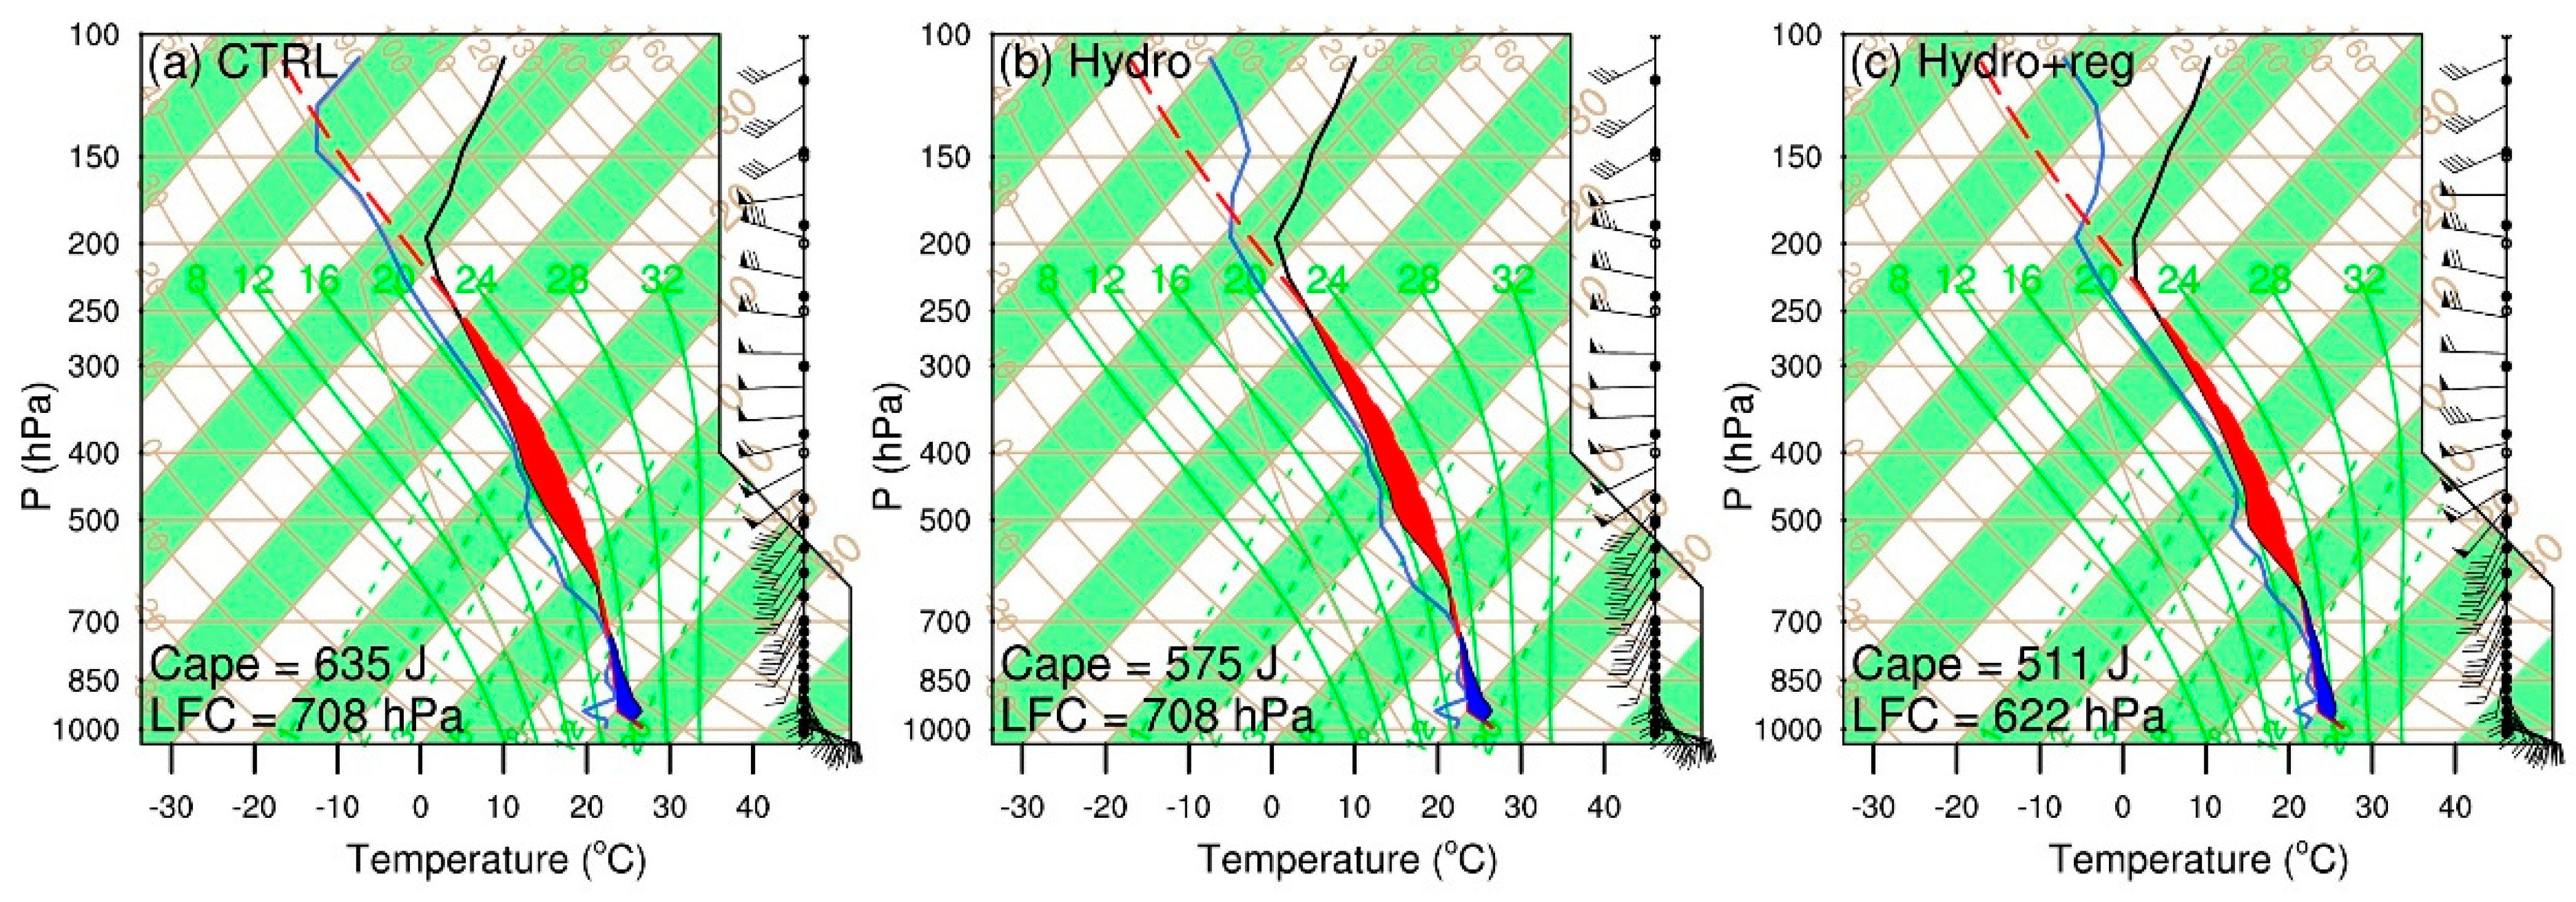
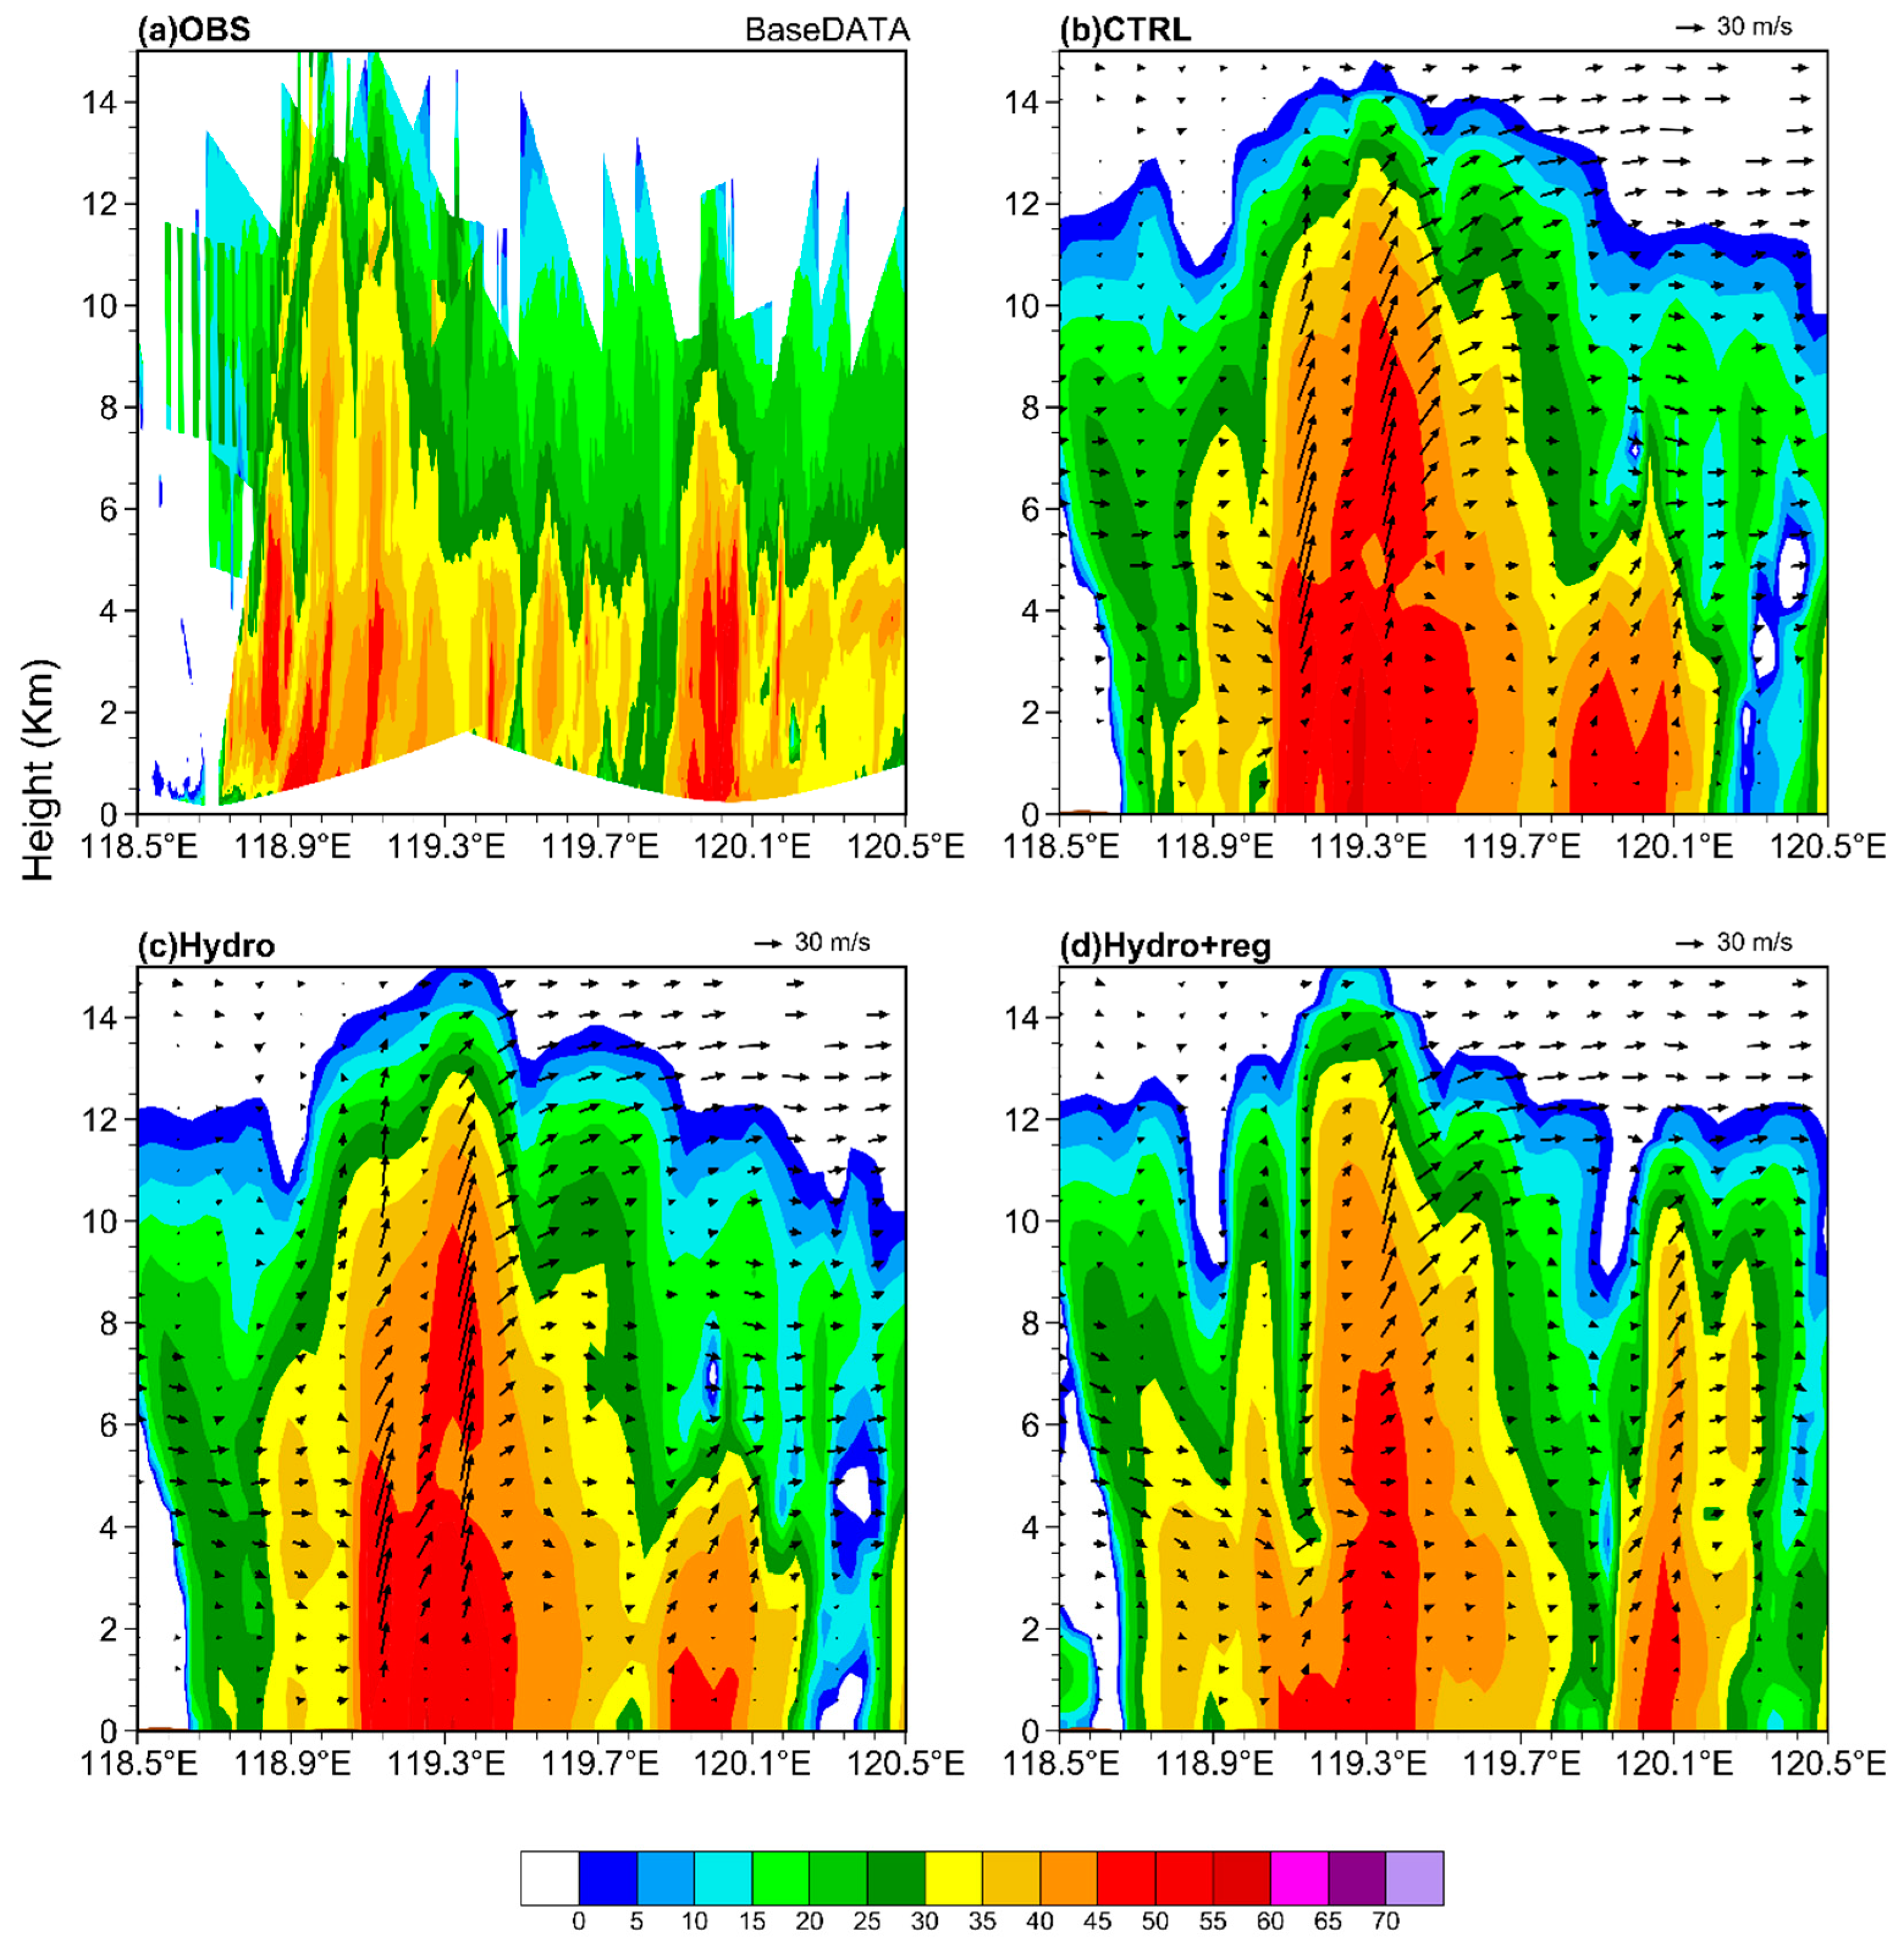
The Skew-T plots, reflectivity, and vertical velocity were selected to analyze both the thermal and dynamic causes for the precipitation improvement. The Skew-T plots over 33.2°N, 119.7°E (triangle in Figure 11) in the initial field after three cycles (Figure 12) showed that the CTRL experiment had the maximum convective available potential energy (CAPE), which favored triggering of convection. Although the CAPE in the Hydro experiment was smaller than in the CTRL experiment, the level of free convection (LFC) was the same. This indicated that the vertical hydrometeor information could transfer to other variables via cycling assimilation and forecasting, but the impact was slight. The Hydro+reg experiment achieved the smallest CAPE and the highest LFC, impeding the triggering of convection. Owing to these initial thermal differences, a strong reflectivity was forecast between the two heavy rainfall regions (near 119.3°E and 120°E) in CTRL and Hydro (Figure 13b,c), resulting in spurious heavy precipitation. However, the strong reflectivity in Hydro+reg was divided between the two heavy rainfall regions (Figure 13d) and this distribution was closer to the observations (Figure 13a).
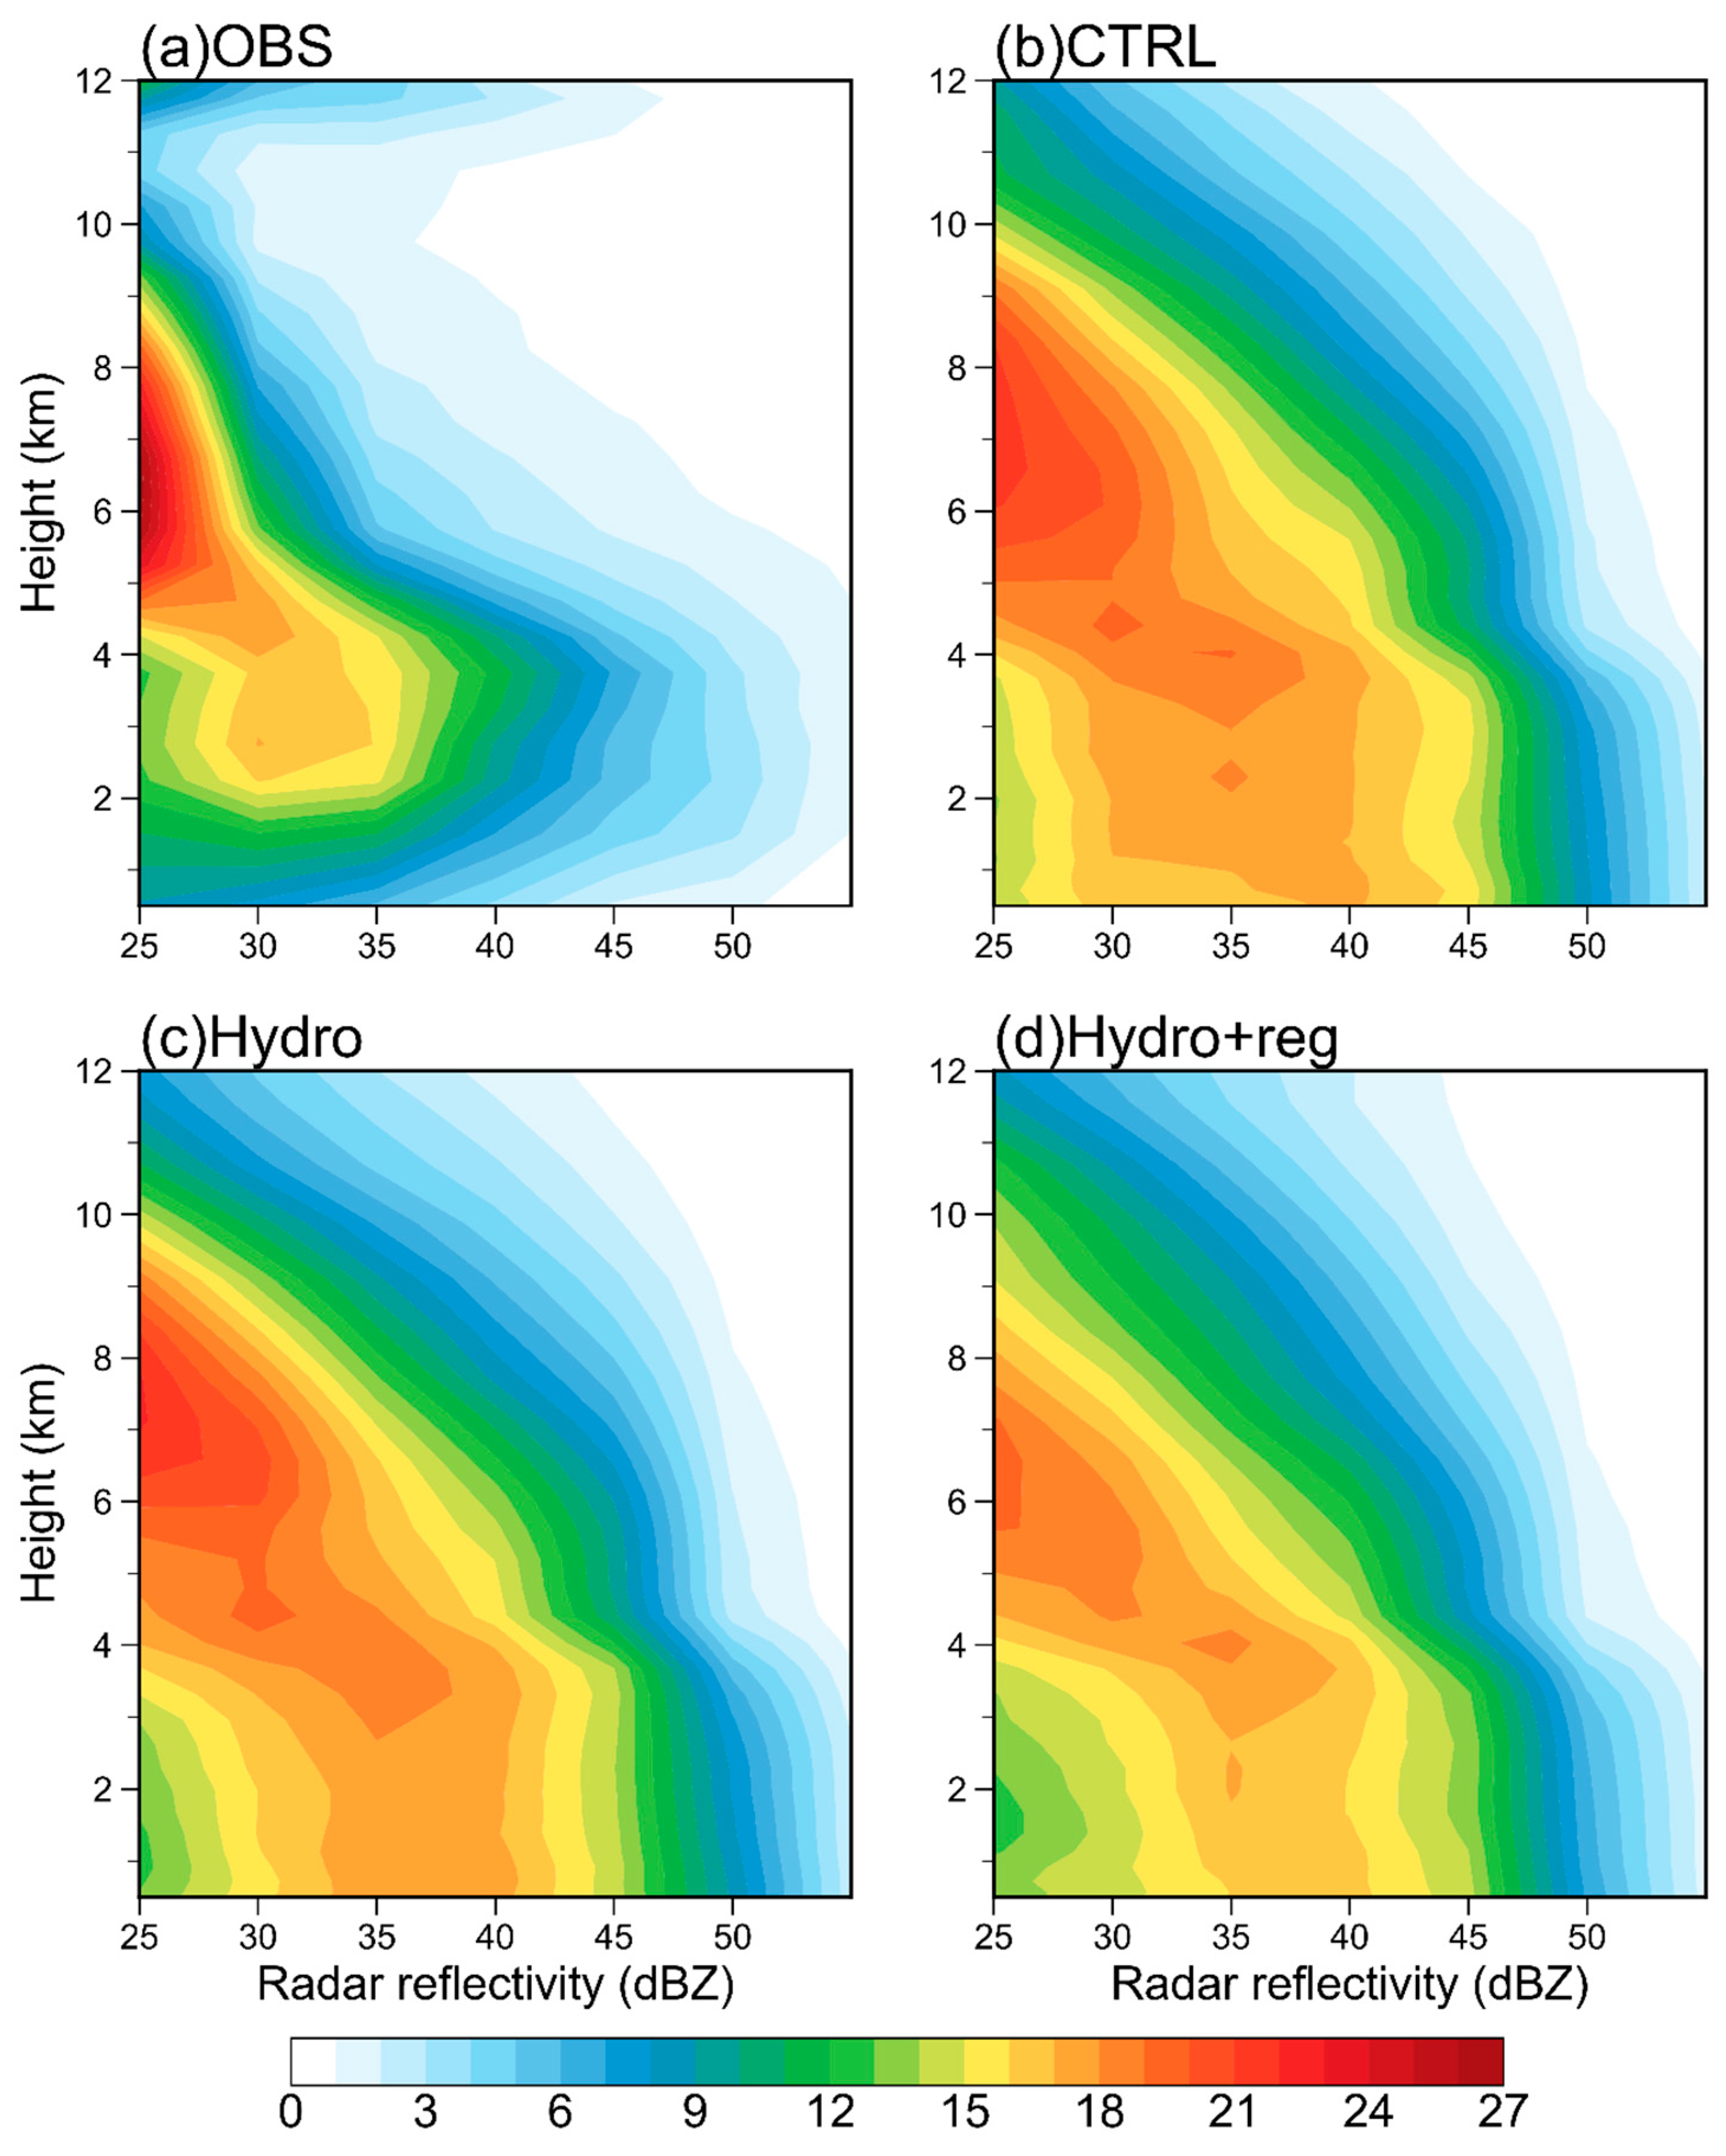
To further analyze the causes for the precipitation improvements, Contoured Frequency by Altitude Diagrams (CFADs) [61] are shown in Figure 14, which displayed the frequency distribution of reflectivity [per bin size (~0.5 km × 5 dBZ)] as a function of height. Since weak reflectivity has a small effect on convective weather processes, only reflectivity above the 25 dBZ threshold are shown in this paper. For CTRL (Figure 14b), the frequencies of strong radar reflectivity at the middle and lower atmosphere were much stronger than the observations (Figure 14a), resulting in stronger precipitation (Figure 11b). The frequencies of Hydro (Figure 14c) were slightly reduced compared to CTRL. After considering multivariate correlations, the frequencies of strong radar reflectivity in Hydro+reg (Figure 14d) was further reduced. as well as being closer to the observations. This phenomenon was consistent with the cross sections of radar reflectivity (Figure 13).
In summary, radar assimilation, considering multivariate correlations, led to a more reasonable thermal and dynamic structure in the initial field, and the radar reflectivity simulated in the forecast field was closer to the observations, resulting in improvement of the precipitation forecasting.

6. Conclusions

Weather radar soundings give useful indications for short-term weather prediction, while radar assimilation can improve precipitation forecasting. Background error covariance (BEC) plays an essential role in variational data assimilation. To further clarify BEC with vertical and multivariable correlations of hydrometeors (H-BEC) and their impacts on radar reflectivity assimilation, this study further developed the H-BEC with vertical and multivariable correlations in WRFDA for better consideration of the vertical correlations and cross-correlations of hydrometeor CVs, and their impacts on radar reflectivity assimilation. Furthermore, model short-term precipitation forecasting was investigated.
The characteristics of the H-BEC indicates that hydrometeors are strongly correlated with temperature and relative humidity. The vertical correlations can speed up the minimization of the cost function on radar data assimilation, and the multivariable correlations further accelerate this minimization by leading to more balanced relationships amongst the model variables. The single tests showed that the radar reflectivity assimilation could facilitate the analysis of hydrometeor variables and propagate this analysis to vertical spatial and other control variables by vertical and multivariate correlations in H-BEC, improving the coordination of the analysis of control variables.
The evaluation of cycling assimilation and forecasting experiments demonstrated that the vertical correlations could slightly improve the forecasting, and this improvement occurred mainly during the first hour. When the multivariable correlations were added, the predictive capacity of heavy precipitation further improved. In addition, due to the multivariate correlations of hydrometeors, the model variables were more balanced and coordinated, resulting in the improvement persisting into the third hour.
The diagnostics of the fast-moving squall line case further showed that the over-estimation of strong convective precipitation forecasts was mitigated, due to a more balanced and coordinated relationship of control variables. Moreover, this improved control variable relationship led to a more reasonable thermodynamic and dynamical structure, resulting in an improvement in short-term precipitation forecasting.
In this paper, the application of BEC with vertical and multivariable correlations of hydrometeors not only highlighted the potential of hydrometeors in radar data assimilation, but also provided some helpful suggestions for better precipitation forecasting in the NWP models. In addition, dual-polarization radar has a greater ability to detect hydrometeors [62]. Therefore, as a next step, it would be valuable to assimilate dual-polarization radar observations using the H-BEC.

Author Contributions

Conceptualization, Y.C.; Methodology, Y.C., H.Z. and S.Z.; Software, S.Z.; Formal analysis, Y.C., H.Z. and S.Z.; Investigation, H.Z. and S.Z.; Project administration, Y.C.; Supervision, Y.C.; Writing-original draft preparation, H.Z. and S.Z; Validation, H.Z., Y.C., D.M. and T.S.; Writing-review and editing, Y.C., H.Z., S.Z, D.M. and T.S.; Visualization, H.Z.; Funding acquisition, Y.C. and D.M. All authors have read and agreed to the published version of the manuscript.

Funding

This work was jointly sponsored by the National Natural Science Foundation of China (42075148, 42205154, 42192553), the Open Research Program of the State Key Laboratory of Severe Weather (2021LASW-A08), and the Joint Open Project of KLME & CIC-FEMD, NUIST (KLME202205). The numerical calculations of this study were supported by the High-Performance Computing Center of Nanjing University of Information Science and Technology (NUIST).

Data Availability Statement

The analysis and forecast field of GFS and the GTS observations were obtained from the National Centers for Environmental Prediction (NCEP) at (https://rda.ucar.edu/datasets/ds084.1, accessed on 21 June 2021) and (https://rda.ucar.edu/datasets/ds337.0, accessed on 27 June 2021), respectively. The CMORPH precipitation observation and radar observation data were obtained from China Meteorological Administration (CMA; http://data.cma.cn, accessed on 25 September 2021). The ERA5 data were obtained from ECMWF (https://cds.climate.copernicus.eu/#!/home, accessed on 5 October 2021).

Acknowledgments

The authors thank the three reviewers for their constructive comments and useful suggestions that helped significantly improve the manuscript.

Conflicts of Interest

The authors declare no conflict of interest.

References

  1. Bauer, P.; Thorpe, A.; Brunet, G. The Quiet Revolution of Numerical Weather Prediction. Nature 2015, 525, 47–55. [Google Scholar] [CrossRef]
  2. Luo, L.; Xiao, H.; Yang, H.; Chen, H.; Guo, J.; Sun, Y.; Feng, L. Raindrop Size Distribution and Microphysical Characteristics of a Great Rainstorm in 2016 in Beijing, China. Atmos. Res. 2020, 239, 104895. [Google Scholar] [CrossRef]
  3. Errico, R.M.; Bauer, P.; Mahfouf, J.F. Issues Regarding the Assimilation of Cloud and Precipitation Data. J. Atmos. Sci. 2007, 64, 3785–3798. [Google Scholar] [CrossRef]
  4. Roh, W.; Satoh, M. Evaluation of Precipitating Hydrometeor Parameterizations in a Single-Moment Bulk Microphysics Scheme for Deep Convective Systems over the Tropical Central Pacific. J. Atmos. Sci. 2014, 71, 2654–2673. [Google Scholar] [CrossRef]
  5. Chen, Y.; Wang, H.; Min, J.; Huang, X.Y.; Minnis, P.; Zhang, R.; Haggerty, J.; Palikonda, R. Variational Assimilation of Cloud Liquid/Ice Water Path and Its Impact on NWP. J. Appl. Meteorol. Climatol. 2015, 54, 1809–1825. [Google Scholar] [CrossRef]
  6. Chen, Y.; Zhang, R.; Meng, D.; Min, J.; Zhang, L. Variational Assimilation of Satellite Cloud Water/Ice Path and Microphysics Scheme Sensitivity to the Assimilation of a Rainfall Case. Adv. Atmos. Sci. 2016, 33, 1158–1170. [Google Scholar] [CrossRef]
  7. Meng, D.; Chen, Y.; Wang, H.; Gao, Y.; Potthast, R.W.E.; Wang, Y. The Evaluation of EnVar Method Including Hydrometeors Analysis Variables for Assimilating Cloud Liquid/Ice Water Path on Prediction of Rainfall Events. Atmos. Res. 2019, 219, 1–12. [Google Scholar] [CrossRef]
  8. Wang, Y.; Wang, X. Development of Convective-Scale Static Background Error Covariance within GSI-Based Hybrid EnVar System for Direct Radar Reflectivity Data Assimilation. Mon. Weather Rev. 2021, 149, 2713–2736. [Google Scholar] [CrossRef]
  9. Weckwerth, T.M.; Pettet, C.R.; Fabry, F.; Park, S.; Lemone, M.A.; Wilson, J.W. Radar Refractivity Retrieval: Validation and Application to Short-Term Forecasting. J. Appl. Meteorol. 2005, 44, 285–300. [Google Scholar] [CrossRef]
  10. Carlin, J.T.; Ryzhkov, A.V.; Snyder, J.C.; Khain, A. Hydrometeor Mixing Ratio Retrievals for Storm-Scale Radar Data Assimilation: Utility of Current Relations and Potential Benefits of Polarimetry. Mon. Weather Rev. 2016, 144, 2981–3001. [Google Scholar] [CrossRef]
  11. Gu, T.; Chen, Y.; Gao, Y.; Qin, L.; Wu, Y.; Wu, Y. Improved Streamflow Forecast in a Small-Medium Sized River Basin with Coupled WRF and WRF-Hydro: Effects of Radar Data Assimilation. Remote Sens. 2021, 13, 3251. [Google Scholar] [CrossRef]
  12. Hu, M.; Xue, M.; Gao, J.; Brewster, K. 3DVAR and Cloud Analysis with WSR-88D Level-II Data for the Prediction of the Fort Worth, Texas, Tornadic Thunderstorms. Part II: Impact of Radial Velocity Analysis via 3DVAR. Mon. Weather Rev. 2006, 134, 699–721. [Google Scholar] [CrossRef]
  13. Sun, J.; Xue, M.; Wilson, J.W.; Zawadzki, I.; Ballard, S.P.; Onvlee-Hooimeyer, J.; Joe, P.; Barker, D.M.; Li, P.W.; Golding, B.; et al. Use of NWP for Nowcasting Convective Precipitation: Recent Progress and Challenges. Bull. Am. Meteorol. Soc. 2014, 95, 409–426. [Google Scholar]
  14. Xiao, Q.; Kuo, Y.H.; Sun, J.; Lee, W.C.; Barker, D.M.; Lim, E. An Approach of Radar Reflectivity Data Assimilation and Its Assessment with the Inland QPF of Typhoon Rusa (2002) at Landfall. J. Appl. Meteorol. Climatol. 2007, 46, 14–22. [Google Scholar] [CrossRef] [Green Version]
  15. Montmerle, T.; Faccani, C. Mesoscale Assimilation of Radial Velocities from Doppler Radars in a Preoperational Framework. Mon. Weather Rev. 2009, 137, 1939–1953. [Google Scholar] [CrossRef]
  16. Sun, J.; Wang, H. Radar Data Assimilation with WRF 4D-Var. Part II: Comparison with 3D-Var for a Squall Line over the U.S. Great Plains. Mon. Weather Rev. 2013, 141, 2245–2264. [Google Scholar] [CrossRef]
  17. Li, Y.; Wang, X.; Xue, M. Assimilation of Radar Radial Velocity Data with the WRF Hybrid Ensemble–3DVAR System for the Prediction of Hurricane Ike (2008). Mon. Weather Rev. 2012, 140, 3507–3524. [Google Scholar] [CrossRef] [Green Version]
  18. Lai, A.; Gao, J.; Koch, S.E.; Wang, Y.; Pan, S.; Fierro, A.O.; Cui, C.; Min, J. Assimilation of Radar Radial Velocity, Reflectivity, and Pseudo–Water Vapor for Convective-Scale NWP in a Variational Framework. Mon. Weather Rev. 2019, 147, 2877–2900. [Google Scholar] [CrossRef]
  19. Stephan, K.; Klink, S.; Schraff, C. Assimilation of radar derived rain rates into the convective scale model COSMO-DE at DWD. Q. J. R. Meteorol. Soc. 2008, 134, 1315–1326. [Google Scholar] [CrossRef]
  20. Gao, J.; Stensrud, D.J. Assimilation of Reflectivity Data in a Convective-Scale, Cycled 3DVAR Framework with Hydrometeor Classification. J. Atmos. Sci. 2012, 69, 1054–1065. [Google Scholar] [CrossRef]
  21. Wang, H.; Sun, J.; Fan, S.; Huang, X. Indirect Assimilation of Radar Reflectivity with WRF 3D-Var and Its Impact on Prediction of Four Summertime Convective Events. J. Appl. Meteorol. Climatol. 2013, 52, 889–902. [Google Scholar] [CrossRef]
  22. Chen, H.; Chen, Y.; Gao, J.; Sun, T.; Carlin, J.T. A Radar Reflectivity Data Assimilation Method Based on Background Dependent Hydrometeor Retrieval: An Observing System Simulation Experiment. Atmos. Res. 2020, 243, 105022. [Google Scholar] [CrossRef]
  23. Sun, T.; Chen, Y.; Sun, J.; Wang, H.; Chen, H.; Wang, Y.; Meng, D. A Multi-Time-Scale Four-Dimensional Variational Data Assimilation Scheme and Its Application to Simulated Radial Velocity and Reflectivity Data. Mon. Weather Rev. 2020, 148, 2063–2085. [Google Scholar] [CrossRef]
  24. Wang, H.; Sun, J.; Zhang, X.; Huang, X.-Y.; Auligné, T. Radar Data Assimilation with WRF 4D-Var. Part I: System Development and Preliminary Testing. Mon. Weather Rev. 2013, 141, 2224–2244. [Google Scholar] [CrossRef]
  25. Auligné, T.; Lorenc, A.; Michel, Y.; Montmerle, T.; Jones, A.; Hu, M.; Dudhia, J. Toward a New Cloud Analysis and Prediction System. Bull. Am. Meteorol. Soc. 2011, 92, 207–210. [Google Scholar] [CrossRef] [Green Version]
  26. Houtekamer, P.L.; Zhang, F. Review of the Ensemble Kalman Filter for Atmospheric Data Assimilation. Mon. Weather Rev. 2016, 144, 4489–4532. [Google Scholar] [CrossRef]
  27. Sun, T.; Sun, J.; Chen, Y.; Zhang, Y.; Ying, Z.; Chen, H. Improving Short-Term Precipitation Forecasting with Radar Data Assimilation and a Multiscale Hybrid Ensemble–Variational Strategy. Mon. Weather Rev. 2022, 150, 2357–2377. [Google Scholar] [CrossRef]
  28. Sugimoto, S.; Crook, N.A.; Sun, J.; Xiao, Q.; Barker, D.M. An Examination of WRF 3DVAR Radar Data Assimilation on Its Capability in Retrieving Unobserved Variables and Forecasting Precipitation through Observing System Simulation Experiments. Mon. Weather Rev. 2009, 137, 4011–4029. [Google Scholar] [CrossRef]
  29. Sun, J.; Wang, H.; Tong, W.; Zhang, Y.; Lin, C.Y.; Xu, D. Comparison of the Impacts of Momentum Control Variables on High-Resolution Variational Data Assimilation and Precipitation Forecasting. Mon. Weather Rev. 2016, 144, 149–169. [Google Scholar] [CrossRef]
  30. Gustafsson, N.; Janjić, T.; Schraff, C.; Leuenberger, D.; Weissmann, M.; Reich, H.; Brousseau, P.; Montmerle, T.; Wattrelot, É.; Bučánek, A.; et al. Survey of Data Assimilation Methods for Convective-scale Numerical Weather Prediction at Operational Centres. Q. J. R. Meteorol. Soc. 2018, 144, 1218–1256. [Google Scholar]
  31. Huang, Y.; Liu, Y.; Xu, M.; Liu, Y.; Pan, L.; Wang, H.; Cheng, W.Y.Y.; Jiang, Y.; Lan, H.; Yang, H.L.; et al. Forecasting Severe Convective Storms with WRF-Based RTFDDA Radar Data Assimilation in Guangdong, China. Atmos. Res. 2018, 209, 131–143. [Google Scholar] [CrossRef]
  32. Liu, Y.; Liu, J.; Li, C.; Yu, F.; Wei, W. Effect of the Assimilation Frequency of Radar Reflectivity on Rain Storm Prediction by Using WRF-3DVAR. Remote Sens. 2021, 13, 2103. [Google Scholar] [CrossRef]
  33. Bae, J.H.; Min, K.H. Forecast Characteristics of Radar Data Assimilation Based on the Scales of Precipitation Systems. Remote Sens. 2022, 14, 605. [Google Scholar] [CrossRef]
  34. Bannister, R.N. A Review of Forecast Error Covariance Statistics in Atmospheric Variational Data Assimilation. I: Characteristics and Measurements of Forecast Error Covariances. Q. J. R. Meteorol. Soc. 2008, 134, 1951–1970. [Google Scholar] [CrossRef]
  35. Chen, Y.; Rizvi, S.R.H.; Huang, X.Y.; Min, J.; Zhang, X. Balance Characteristics of Multivariate Background Error Covariances and Their Impact on Analyses and Forecasts in Tropical and Arctic Regions. Meteorol. Atmos. Phys. 2013, 121, 79–98. [Google Scholar] [CrossRef] [Green Version]
  36. Choi, Y.; Cha, D.H.; Kim, J. Tuning of Length-Scale and Observation-Error for Radar Data Assimilation Using Four Dimensional Variational (4D-Var) Method. Atmos. Sci. Lett. 2017, 18, 441–448. [Google Scholar] [CrossRef] [Green Version]
  37. Gong, J.; Hólm, E. Development of Cloud Condensate Background Errors. ECMWF Newsl. 2011, 128, 23–27. [Google Scholar]
  38. Michel, Y.; Auligne, T.; Montmerle, T. Heterogeneous Convective-Scale Background Error Covariances with the Inclusion of Hydrometeor Variables. Mon. Weather Rev. 2011, 139, 2994–3015. [Google Scholar] [CrossRef]
  39. Descombes, G.; Auligne, T.; Vandenberghe, F.; Barker, D.M.; Barre, J. Generalized Background Error Covariance Matrix Model (GEN_BE v2.0). Geosci. Model Dev. 2015, 8, 669–696. [Google Scholar] [CrossRef] [Green Version]
  40. Liu, C.; Xue, M.; Kong, R. Direct Assimilation of Radar Reflectivity Data Using 3DVAR: Treatment of Hydrometeor Background Errors and OSSE Tests. Mon. Weather Rev. 2019, 147, 17–29. [Google Scholar] [CrossRef]
  41. Barker, D.M.; Huang, W.; Guo, Y.R.; Bourgeois, A.J.; Xiao, Q.N. A Three-Dimensional Variational Data Assimilation System for MM5: Implementation and Initial Results. Mon. Weather Rev. 2004, 132, 897–914. [Google Scholar] [CrossRef]
  42. Courtier, P.; Thepaut, J.N.; Hollingsworth, A. A Strategy for Operational Implementation of 4D-Var, Using an Incremental Approach. Q. J. R. Meteorol. Soc. 1994, 120, 1367–1387. [Google Scholar] [CrossRef]
  43. Derber, J.; Bouttier, F. A Reformulation of the Background Error Covariance in the ECMWF Global Data Assimilation System. Tellus A 1999, 51, 195–221. [Google Scholar] [CrossRef]
  44. Wu, W.; Purser, R.J.; Parrish, D.F. Three-Dimensional Variational Analysis with Spatially Inhomogeneous Covariances. Mon. Weather Rev. 2002, 130, 2905–2916. [Google Scholar] [CrossRef]
  45. Lin, Y.-L.; Farley, R.D.; Orville, H.D. Bulk Parameterization of the Snow Field in a Cloud Model. J. Appl. Meteorol. Climatol. 1983, 22, 1065–1092. [Google Scholar] [CrossRef]
  46. Gilmore, M.S.; Straka, J.M.; Rasmussen, E.N. Precipitation and Evolution Sensitivity in Simulated Deep Convective Storms: Comparisons between Liquid-Only and Simple Ice and Liquid Phase Microphysics. Mon. Weather Rev. 2004, 132, 1897–1916. [Google Scholar] [CrossRef]
  47. Tong, M.; Xue, M. Ensemble Kalman Filter Assimilation of Doppler Radar Data with a Compressible Nonhydrostatic Model: OSS Experiments. Mon. Weather Rev. 2005, 133, 1789–1807. [Google Scholar] [CrossRef] [Green Version]
  48. Dowell, D.C.; Wicker, L.J.; Snyder, C. Ensemble Kalman Filter Assimilation of Radar Observations of the 8 May 2003 Oklahoma City Supercell: Influences of Reflectivity Observations on Storm-Scale Analyses. Mon. Weather Rev. 2011, 139, 272–294. [Google Scholar] [CrossRef] [Green Version]
  49. Parrish, D.F.; Derber, J.C. The National Meteorological Center’s Spectral Statistical-Interpolation Analysis System. Mon. Weather Rev. 1992, 120, 1747–1763. [Google Scholar] [CrossRef]
  50. Skamarock, W.C.; Klemp, J.B. A Time-Split Nonhydrostatic Atmospheric Model for Weather Research and Forecasting Applications. J. Comput. Phys. 2008, 227, 3465–3485. [Google Scholar] [CrossRef]
  51. Hong, S.Y.; Lim, J.O.J. The WRF Single-Moment 6-Class Microphysics Scheme (WSM6). Asia Pac. J. Atmos. Sci. 2006, 42, 129–151. [Google Scholar]
  52. Mlawer, E.J.; Taubman, S.J.; Brown, P.D.; Iacono, M.; Clough, S.A. Radiative Transfer for Inhomogeneous Atmospheres: RRTM, a Validated Correlated-k Model for the Longwave. J. Geophys. Res. 1997, 102, 16663–16682. [Google Scholar] [CrossRef] [Green Version]
  53. Dudhia, J. Numerical Study of Convection Observed during the Winter Monsoon Experiment Using a Mesoscale Two-Dimensional Model. J. Atmos. Sci. 1989, 46, 3077–3107. [Google Scholar] [CrossRef]
  54. Hong, S.Y.; Noh, Y.; Dudhia, J. A New Vertical Diffusion Package with an Explicit Treatment of Entrainment Processes. Mon. Weather Rev. 2006, 134, 2318–2341. [Google Scholar] [CrossRef] [Green Version]
  55. Kain, J.S.; Kain, J. The Kain-Fritsch Convective Parameterization: An Update. J. Appl. Meteorol. Climatol. 2004, 43, 170–181. [Google Scholar] [CrossRef]
  56. Tewari, M.; Wang, W.; Dudhia, J.; LeMone, M.A.; Mitchell, K.; Ek, M.; Gayno, G.; Wegiel, J.; Cuenca, R. Implementation and Verification of the Unified NOAH Land Surface Mode in the WRF model. In Proceedings of the 20th Conference on Weather Analysis and Forecasting/16th Conference on Numerical Weather Prediction, Seattle, WA, USA, 12–16 January 2004; pp. 11–15. [Google Scholar]
  57. Johnson, A.; Wang, X.; Carley, J.R.; Wicker, L.J.; Karstens, C.D. A Comparison of Multiscale GSI-Based EnKF and 3DVar Data Assimilation Using Radar and Conventional Observations for Midlatitude Convective-Scale Precipitation Forecasts. Mon. Weather Rev. 2015, 143, 3087–3108. [Google Scholar] [CrossRef]
  58. Hersbach, H.; Bell, B.; Berrisford, P.; Hirahara, S.; Horányi, A.; Muñoz-Sabater, J.; Nicolas, J.; Peubey, C.; Radu, R.; Schepers, D.; et al. The ERA5 Global Reanalysis. Q. J. R. Meteorol. Soc. 2020, 146, 1999–2049. [Google Scholar] [CrossRef]
  59. Shen, Y.; Zhao, P.; Pan, Y.; Yu, J. A High Spatiotemporal Gauge-satellite Merged Precipitation Analysis over China. J. Geophys. Res.-Atmos. 2014, 119, 3063–3075. [Google Scholar] [CrossRef]
  60. Faggian, N.; Roux, B.; Steinle, P.; Ebert, B. Fast Calculation of the Fractions Skill Score. MAUSAM 2021, 66, 457–466. [Google Scholar] [CrossRef]
  61. Yuter, S.E.; Houze, R.A. Three-Dimensional Kinematic and Microphysical Evolution of Florida Cumulonimbus. Part I: Spatial Distribution of Updrafts, Downdrafts, and Precipitation. Mon. Weather Rev. 1995, 123, 1921–1940. [Google Scholar] [CrossRef]
  62. Posselt, D.J.; Li, X.; Tushaus, S.A.; Mecikalski, J.R. Assimilation of Dual-Polarization Radar Observations in Mixed- and Ice-Phase Regions of Convective Storms: Information Content and Forward Model Errors. Mon. Weather Rev. 2015, 143, 2611–2636. [Google Scholar] [CrossRef] [Green Version]
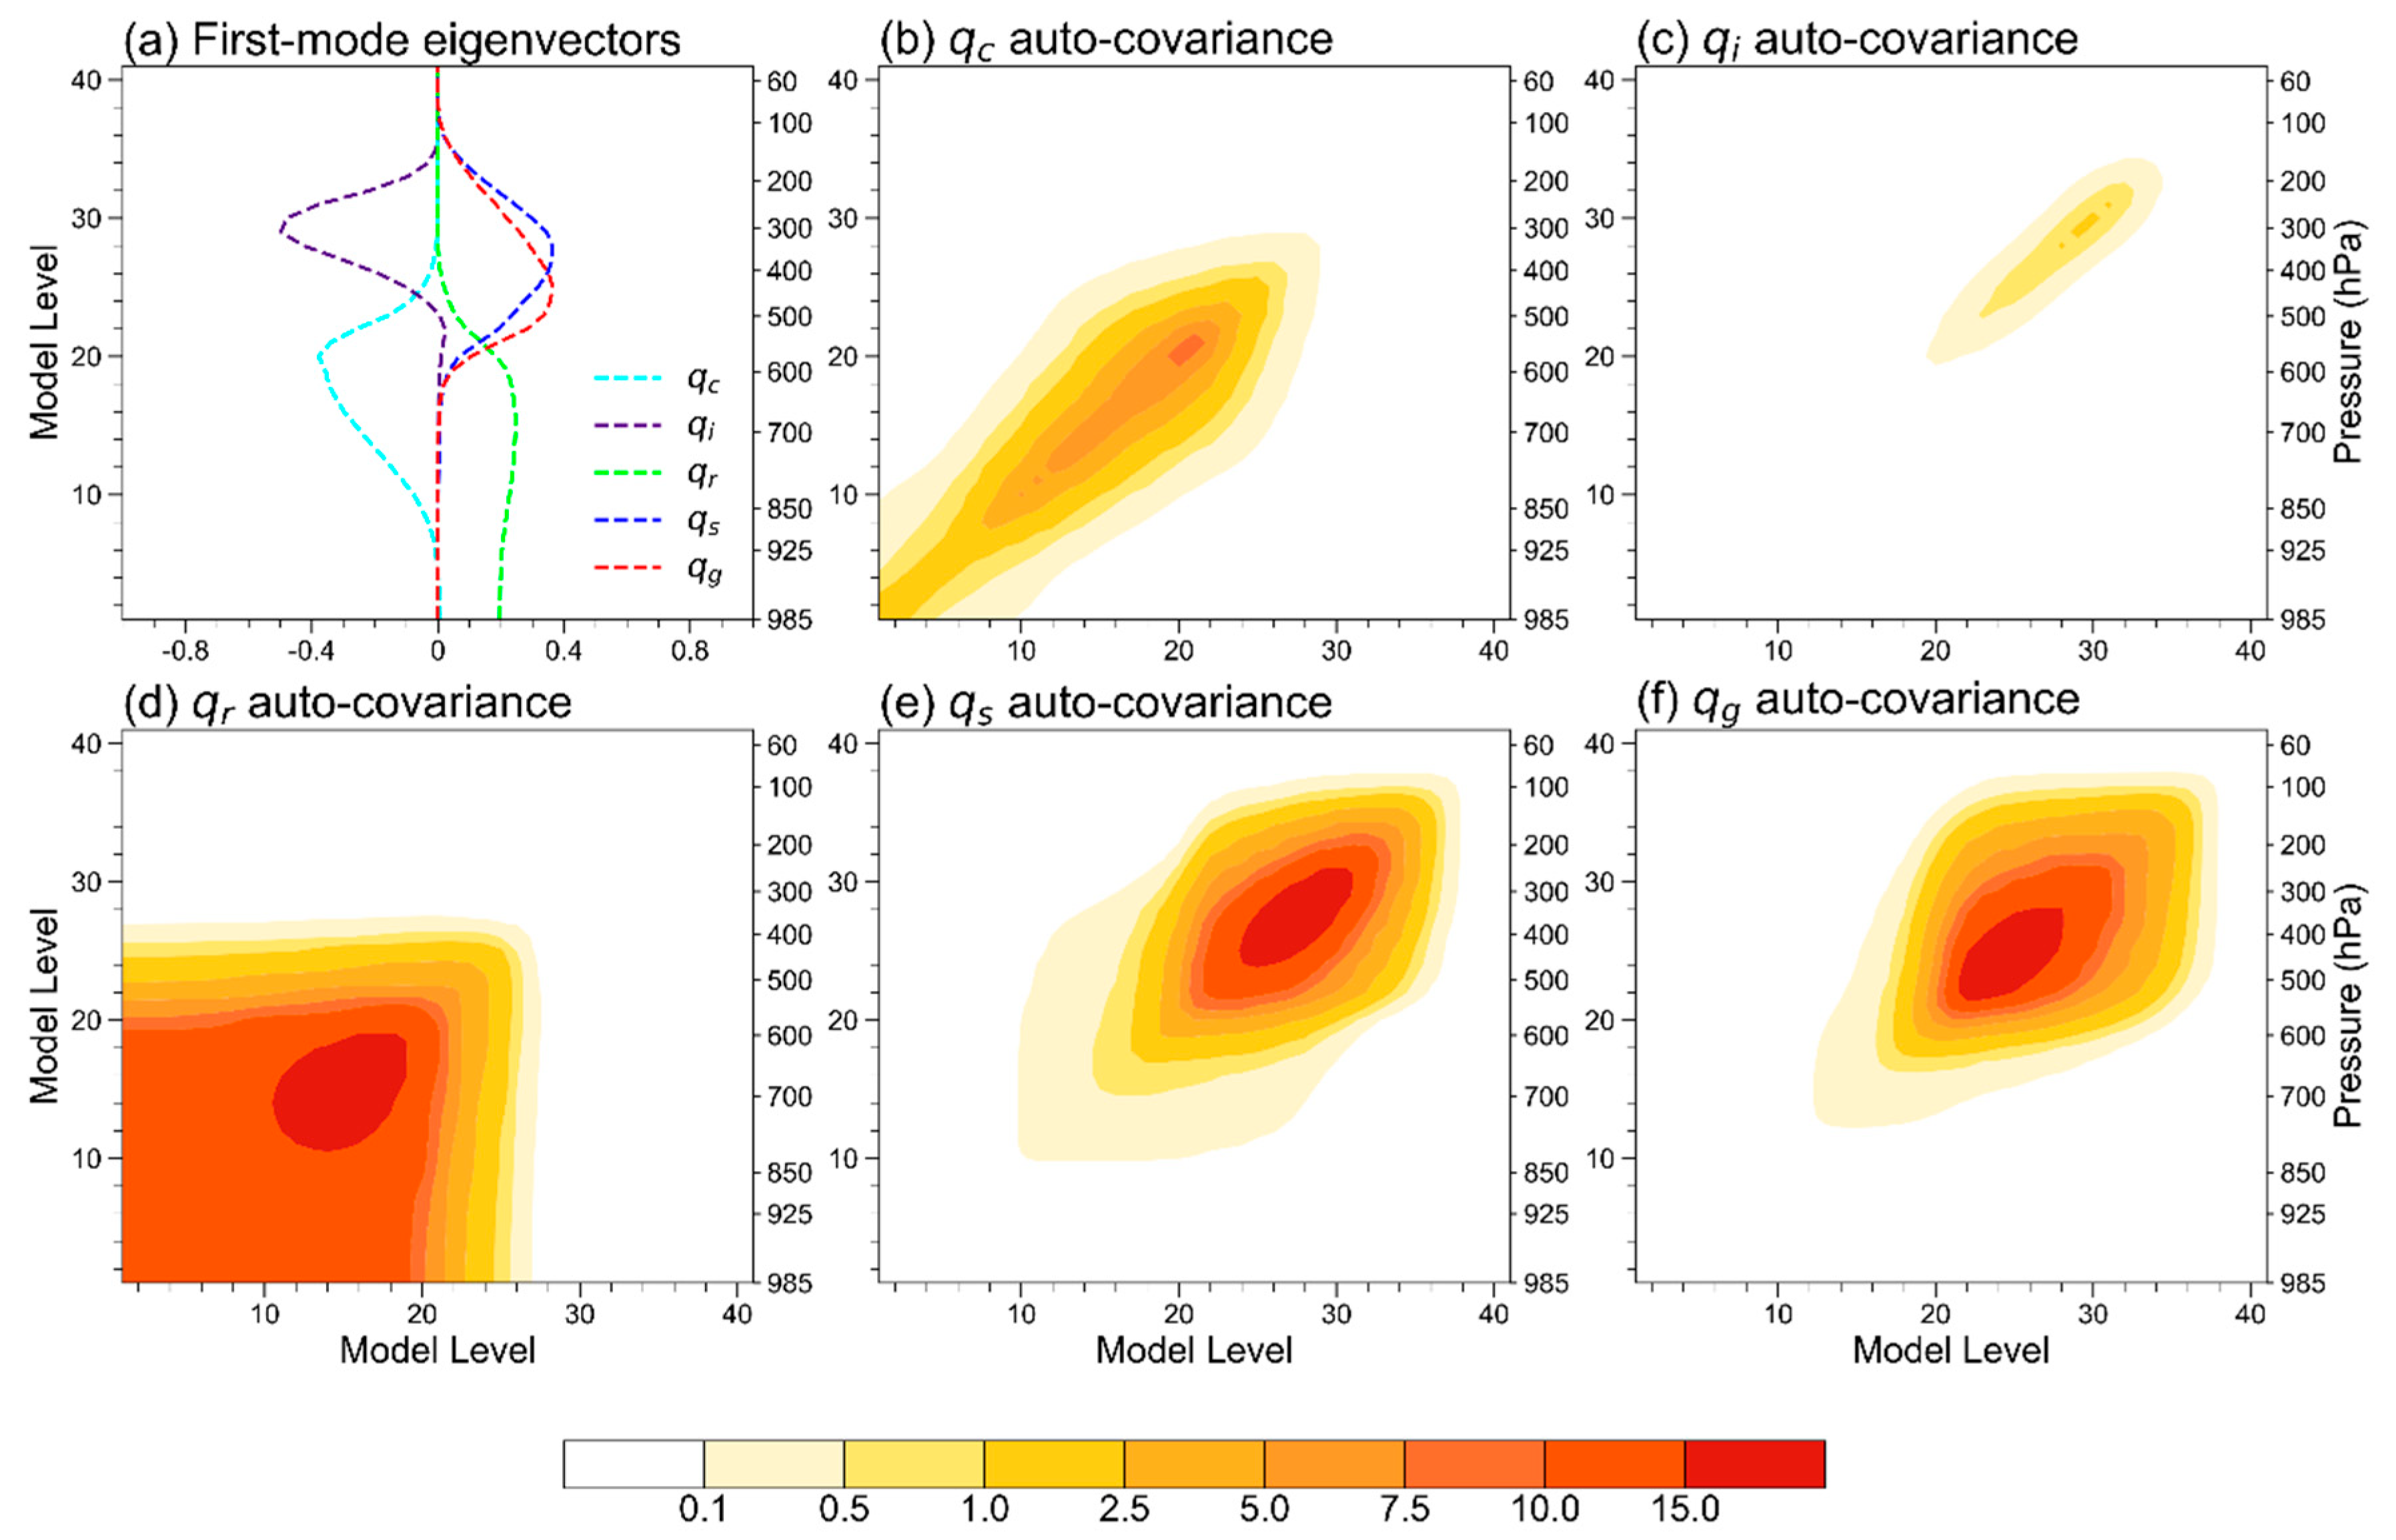
Figure 1. Vertical eigenvectors and vertical auto-covariance of hydrometeors. (a) First-mode eigenvector of hydrometeors, the horizontal axis is eigenvector value. (bf) The vertical auto-covariance (units: 10−9 kg2/kg2) of (b) q c , (c) q i , (d) q r , (e) q s and (f) q g , the horizontal axis is model level. The left vertical axis is model level, and the right vertical axis is the pressure level (units: hPa).
Remotesensing 15 00672 g001
Figure 2. Vertical distribution of the balance part contribution to (a) R H s , (b) q c , (c) q i , (d) q r , (e) q s and (f) q g . The “Balance” line is the sum of others, and the larger the contribution, the stronger the correlation between the two CVs.
Remotesensing 15 00672 g002
Figure 3. Cross-sections of analysis increment of q r , q c , T and q v by assimilating single radar reflectivity observation at 26.5°N in CTRL (the left column), Hydro (the center column), and Hydro+reg (the right column) experiments: (ac) q r (shaded, units: 10−2 g/kg), T (red contour, units: K) and q v (black contour, units: g/kg); (df) q c (shaded, units: 10−2 g/kg), the T and q v were set in the same way as (ac). The horizontal axis represents the longitude, the left vertical axis is model height (units: km), and the right vertical axis is the pressure level (units: hPa).
Remotesensing 15 00672 g003
Figure 4. Model grid configuration and observation stations distribution. (a) Domain configuration and the conventional observation stations distribution; (b) D02 configuration and the radar observation stations (purple points), where the blue box is the evaluation area in cycling data assimilation and forecasting experiments.
Remotesensing 15 00672 g004
Figure 5. Schematic diagram showing the assimilation and forecast cycles.
Remotesensing 15 00672 g005
Figure 6. The 20-cycle-averaged RMSE of 3 h forecast in main precipitation area from 5 cases. (a) U (units: m/s), (b) V (units: m/s), (c) T (units: K), (d) Q (units: g/kg).
Remotesensing 15 00672 g006
Figure 7. The 20-cycle-averaged FSS scores (the left column), BS scores (the center column) and improvements in the percentage compared to CTRL experiment (the right column) for each-hour precipitation forecast in main precipitation area from the 5 cases. (ac) 0–1 h, (df) 1–2 h, (gi) 2–3 h.
Remotesensing 15 00672 g007
Figure 8. Composite reflectivity observation for the fast-moving squall line case on 6 July 2019 (units: dBZ). (a) 0600 UTC, (b) 0900 UTC, (c) 1200 UTC, (d) 1500 UTC.
Remotesensing 15 00672 g008
Figure 9. Analysis increment at level 16 of (ac) q r (units: g/kg), (df) T (units: K) and (gi) q v (units: g/kg) in CTRL (the left column), Hydro (the center column), and Hydro+reg (the right column) experiments.
Remotesensing 15 00672 g009
Figure 10. Variation of the cost function in radar data assimilation at (a) 0600 UTC (cycle 1), (b) 0700 UTC (cycle 2), (c) 0800 UTC (cycle 3), and (d) 0900 UTC (cycle 4).
Remotesensing 15 00672 g010
Figure 11. Distribution of 3-h accumulated precipitation forecast from 0800 UTC to 1100 UTC on 6 July 2019, in main precipitation area (units: mm), and the triangle is the position of (33.2°N, 119.7°E) where Skew-T plots will be analyzed: (a) Observation, (b) CTRL, (c) Hydro, (d) Hydro+reg. The black line A(32°N, 118.5°E) −B(34°N, 120.5°E) indicates the position of the vertical section shown in Figure 13.
Remotesensing 15 00672 g011
Figure 12. The Skew−T plots over (33.2°N, 119.7°E) in the initial field after 3 cycles from (a) CTRL, (b) Hydro, and (c) Hydro+reg experiments. The blue and the black lines indicate the dew point temperature and the ambient temperature, respectively. The shadow in red indicates convective available potential energy (CAPE).
Remotesensing 15 00672 g012
Figure 13. Cross-sections over line AB of the reflectivity (shaded, units: dBZ) and wind (vector, the vertical velocity has been multiplied 10) field at 0920UTC from (a) Observation, (b) CTRL, (c) Hydro and (d) Hydro+reg experiments after 3 cycles.
Remotesensing 15 00672 g013
Figure 14. Contoured Frequency by Altitude Diagrams (CFADs, shaded, units: %) in main precipitation areas at 0920 UTC from (a) Observation, (b) CTRL, (c) Hydro and (d) Hydro+reg experiments after 3 cycles. The CFADs is calculated over the main precipitation area (29°–35°N, 115°–123°E; blue box in Figure 4b).
Remotesensing 15 00672 g014
Table 1. Summary of three experiments.
NameVertical CorrelationsMultivariable Correlations
CTRLNoNo
HydroYesNo
Hydro+regYesYes
Table 2. Multi-type cases for cycling data assimilation and forecasting.
Case
(Period in the Whole Process Except Spin-Up)
Type and Characteristics of the Case
17 July 2018, 0600–1200 UTCSquall line, slow-moving
6 July 2019, 0600–1200 UTCSquall line, fast-moving
17 July 2019, 0900–1500 UTCMulticellular storm, stable
26 July 2019, 1800 UTC–27 July, 0000 UTCMulticellular storm, local
27 July 2019, 1200–1800 UTCMulticellular storm, fast-moving
Disclaimer/Publisher’s Note: The statements, opinions and data contained in all publications are solely those of the individual author(s) and contributor(s) and not of MDPI and/or the editor(s). MDPI and/or the editor(s) disclaim responsibility for any injury to people or property resulting from any ideas, methods, instructions or products referred to in the content.