Article

Planting Age Identification and Yield Prediction of Apple Orchard Using Time-Series Spectral Endmember and Logistic Growth Model

1
College of Land Science and Technology, China Agricultural University, Beijing 100193, China
2
Institute of Agricultural Resources and Regional Planning, Chinese Academy of Agricultural Sciences, Beijing 100081, China
3
Department of Sustainable Development, Environmental Science and Engineering (SEED), KTH Royal Institute of Technology, 10044 Stockholm, Sweden
4
College of Resources and Environmental Sciences, China Agricultural University, Beijing 100193, China
5
The Bartlett School of Environment, Energy and Resources, University College London, London WC1E 6BT, UK
6
Institute of Plant Nutrition and Resources, Beijing Academy of Agriculture and Forestry Sciences, Beijing 100097, China
*
Author to whom correspondence should be addressed.
These authors contributed equally to this work.
Remote Sens. 2023, 15(3), 642; https://doi.org/10.3390/rs15030642
Submission received: 12 December 2022 / Revised: 16 January 2023 / Accepted: 19 January 2023 / Published: 21 January 2023
(This article belongs to the Special Issue Remote Sensing in Ecophysiological and Agricultural Applications)

Abstract

:
In response to significant shifts in dietary and lifestyle preferences, the global demand for fruits has increased dramatically, especially for apples, which are consumed worldwide. Growing apple orchards of more productive and higher quality with limited land resources is the way forward. Precise planting age identification and yield prediction are indispensable for the apple market in terms of sustainable supply, price regulation, and planting management. The planting age of apple trees significantly determines productivity, quality, and yield. Therefore, we integrated the time-series spectral endmember and logistic growth model (LGM) to accurately identify the planting age of apple orchard, and we conducted planting age-driven yield prediction using a neural network model. Firstly, we fitted the time-series spectral endmember of green photosynthetic vegetation (GV) with the LGM. By using the four-points method, the environmental carrying capacity (ECC) in the LGM was available, which serves as a crucial parameter to determine the planting age. Secondly, we combined annual planting age with historical apple yield to train the back propagation (BP) neural network model and obtained the predicted apple yields for 12 counties. The results show that the LGM method can accurately estimate the orchard planting age, with Mean Absolute Error (MAE) being 1.76 and the Root Mean Square Error (RMSE) being 2.24. The strong correlation between orchard planting age and apple yield was proved. The results of planting age-driven yield prediction have high accuracy, with the MAE up to 2.95% and the RMSE up to 3.71%. This study provides a novel method to accurately estimate apple orchard planting age and yields, which can support policy formulation and orchard planning in the future.

Graphical Abstract

1. Introduction

Apples are nutrient-dense fruits with high economic benefits that are consumed worldwide [1]. When it comes to apple production, exports, and individual consumption, China leads the world [2]. In addition, the apple industry has emerged as a significant means for Chinese farmers to lift themselves out of poverty [3,4]. Given the rising tensions between protecting arable land and accommodating orchard expansion, intensive orchard management is more required than ever for ensuring the continued viability of the orchard industry. [5,6]. In the meantime, some senescent orchards are suffering from problems such as low productivity and soil acidification [7]. It is essential to precisely estimate the planting age of orchards, determine the spatial distribution of senescent orchards, and predict orchard productivity in order to promote the sustainable development of the apple industry.
For large-scale crop yield prediction, the most common method is to obtain crop growth indices and construct crop growth models by combining multi-source remote sensing data [8,9,10]. The vegetation indices, such as normalized difference vegetation index (NDVI), enhanced vegetation index (EVI), crop leaf area index (LAI), and net primary productivity (NPP), can provide an indication of the crop growth [11,12]. Based on time-series LAI data, Wu et al. [13] used the Markov chain Monte Carlo method and WOFOST model to predict winter wheat yield in Hengshui, Hebei Province. Battude et al. [9] combined the Simple Algorithm for the yield estimation model with high spatial and temporal resolution remote sensing data from several sensors and optimized the model with specific leaf area, effective light use efficiency, and NDVI.
Perennial cash crops, such as fruit trees, are particularly sensitive to environmental conditions and human management [14]. The vegetation index, temperature, and precipitation are the main components of the regression model used in the prediction process for perennial cash crops [15]. Bai et al. [16] constructed a random forest model based on cumulative vegetation indices and an apple yield prediction model based on Carnegie-Ames-Stanford. Kang et al. [17] used monthly downscaled solar-induced chlorophyll fluorescence (CNN-SIF) for linear regression and random forest regression to estimate field-scale cotton yield. Sarron et al. [18] used tree structure parameters and fruit load index to predict mango yield in the Niayes region, West Senegal.
Studies have been conducted to predict fruit yield using indicators such as tree structure parameters and climate factors combined with regression models; however, these studies neglected the impact of fruit trees’ inherent characteristics on yield. Researchers have found that apple orchard planting age is the primary determinant of apple yield and quality, which can directly or indirectly affect the economic output of orchards [7,19]. However, the acquisition of planting age in apple orchards requires the collection of farm planting records, which is time-consuming, labor-intensive, and challenging to implement on a large scale [20,21]. Some researchers have developed approaches for evaluating planting age using remote sensing data. Zhu et al. [7] estimated orchard planting years using time-series NDVI data and a pixel-by-pixel inverse time-series calculation approach. Chen et al. [22] used time-series NDVI data to estimate tree crop ages based on a robust z-score threshold and the most recent minimum strategy. These studies rely on time-series NDVI and require a large number of remote sensing images. Taking soil and moisture components into account can help to determine the transition stage of orchards and improves the accuracy of planting age identification [22]. Therefore, considering the components of the orchard is essential in determining the planting age of orchards. Furthermore, it is critical to use apple tree planting age as a critical factor in yield prediction. Predicting apple yields accurately and identifying aging orchards with low productivity can serve as a foundation for orchard management and decision-making.
Qixia City is a vital part of the apple industry in China, with over 67,000 hectares of apple orchards yielding over 2 million tons of apples annually. However, Qixia City is facing the challenges of aging orchards, declining orchard expansion rates, and senescent orchard renewal. Therefore, Qixia City was selected as the research place: (1) To determine the planting age structure of regional orchards, and identify senescent and renewed orchards in Qixia City, we first estimated the planting age of apple orchards based on the time-series endmember and the LGM method. In this study, the planting age of apple orchards represents the number of years after apple trees were planted in the orchard. (2) Second, we predicted orchard yields at the regional scale by combining the planting age. (3) Finally, we investigated the impact of different planting age structures on orchard yields. (4) Furthermore, considering the suitability of orchard planting in the research area, we conducted a comprehensive analysis of the factors affecting apple yield and proposed optimization strategies for orchard planting to promote the sustainable development of the apple industry.

2. Materials and Methods

2.1. Study Area

In this study, Qixia City, Shandong Province, was selected as the study area (Figure 1). Qixia City is situated between 37°05′05″–37°29′46″E and 120°32′45″–121°15′58″N, with a total area of 1793 km2. With its average temperature of 11.4 °C, average frost-free duration of 209 days, and total annual precipitation of 650 mm, Qixia City is suitable for apple cultivation [7,23]. Qixia is one of the largest apple production areas in China. According to the 2020 Qixia Statistical Yearbook, Qixia’s apple orchards account for 90.1% of the cultivated land, and apples account for 94.7% of the city’s fruit production. Due to the absolute dominance of apple yield in Qixia City’s fruit production, selecting this research area can mitigate the influence of other fruit on the yield prediction.

2.2. Data Sources

2.2.1. Satellite Data

This study used the surface reflectance data from Landsat TM/ETM +/OLI C2L2 products with radiometric calibration, geometric correction, and atmospheric correction. The Landsat satellite images have a 16-day return time and 30 m spatial resolution and are available from 1972 to the present [24]. All images are freely available on the website of the United States Geological Survey (https://earthexplorer.usgs.gov (accessed on 16 February 2022)). The whole study area can be completely covered by a single Landsat scene (path:119, row:034). We used Landsat data from 1987 to 2020 to estimate the planting age of apple orchards. We also used the “landsat_gapfll.sav” plug-in of ENVI version 5.3 software to compensate for the loss of ETM+ data. The cloud cover of the images used in this study was below 10%, and we implemented CFMask to remove clouds and cloud shadows. CFmask is a cloud cover classification provided with the USGS CDR Landsat surface reflectance products which employ a series of rules based on the physical properties of clouds [25,26].
Before apple trees begin to bear fruit, many farmers intercrop other crops, such as corn and peanuts, to increase economic efficiency; however, this can interfere with the time-series curve of infant apple trees. Therefore, we selected the time window from September 20 to November 15 to collect data, as this was when the crops had been harvested, but the apple trees had not begun to leaf out. From 1987 to 2020, a total of 32 images with the lowest cloud coverage per year within the time window were selected.

2.2.2. Field Data

We collected field data in 2018 and 2019, including samples of land use/cover and apple orchard planting age. We acquired geographic coordinates using a portable GPS satellite positioning navigator and marked the type of land use/cover. Additionally, we selected samples based on the visual interpretation of Google Earth’s high-resolution historical images for the type of land use/cover. We ultimately selected 938 samples from six land use/cover classification types, including 237 apple orchards, 83 cultivated lands, 243 forests, 182 grasslands, 93 watersheds, and 100 construction sites. Moreover, we selected 59 samples for planting age verification. The planting age samples were acquired by consulting local experts and farmers during the surveys.

2.2.3. Statistical Yearbook Data

We collected statistics on apple yields and orchard areas at the county scale (Table S1) from 2016 to 2020 from the Qixia City Statistical Yearbook (http://www.sdqixia.gov.cn (accessed on 2 March 2022)). The statistical yearbook data are available on the official government websites of Qixia City.

2.2.4. Orchard Planting Suitability Data

Water, heat, sunlight, and topographical conditions in the planting region are essential factors for apple growth [27,28]. Research has shown that the optimum climate conditions for apple growing include 500–800 mm of annual precipitation, 9–12.5 °C of annual mean temperature, 2800–3600 °C of annual cumulative temperature, a daily temperature difference of no more than 10 °C in the summer, 2500 h of annual sunshine, and soil pH from 6.5 to 7 [29]. We developed an index system to evaluate the suitability of orchard planting in the Wulong River basin based on these six optimal criteria for apple growth and the ecological environment of the Wulong River in conjunction with the orchard planting situation (additional information is provided in Section S1 of the Supplementary).

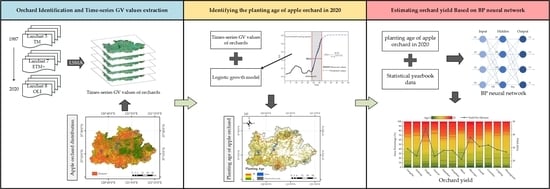
2.3. Overall Research Framework

Figure 2 depicts the overall framework of this study. The framework includes three steps: (1) Obtain the time-series GV data of apple orchards using the linear spectral mixture analysis (LSMA) method. (2) Estimating the planting age of the orchard by fitting the time-series GV data based on LGM. (3) The annual planting age and yield data are used to train a BP neural network to predict the apple yield in 2020. The detailed steps of the method are described in the subsequent sections.

2.4. Estimation of Apple Orchard Planting Age

2.4.1. Linear Spectral Mixture Analysis

The LSMA assumes that the spectral signature of a given pixel is the linear, proportion-weighted combination of the endmember spectra [30], and an endmember is a pure surface material or land cover type with a unique spectral signature [31,32,33]. The general mathematical expression for LSMA in mathematics is:
R i = j = 1 n F j × R E i j + ε i and j = 1 n F j = 1 ;   0 F j 1
where i is the number of spectral bands used, j is the number of endmembers, Ri is the spectral reflectance of the mixed pixel in band i, Fj is the fraction of the area covered by the endmember j in unit pixel, REij represents the reflectance of the endmember j in band i, and εi is the residual error in band i. The residual error ε is the difference between measured and modeled reflectance in each band. Additionally, there are two constraints in the solution of Fj values. First, the fractions across all endmembers should sum to one. Secondly, each endmember fraction should be in the range of 0 to 1.
Principal component analysis and endmember selection are required to determine the appropriate standard endmembers and the number of endmembers. Firstly, we performed a principal component analysis on the images from the three seasons. The results demonstrated that the top three principal components contributed over 98%, which indicates that there are three intrinsic dimensions to all images. According to the convex geometry theory, the number of endmembers is typically one more than the intrinsic dimension of the spectral space [34]; consequently, we can acquire four pure endmembers in the study area. We selected four pure endmembers: water (WA), green photosynthetic vegetation (GV), soil (SL), and dark material (DA). Based on the spectral information of the four endmembers, we applied LSMA to every image (Figure 3). The bands of the OLI, ETM+ and TM sensors are distinct [35]. As a result, we extracted the spectral information of pure endmembers for each of the three sensors and applied LSMA separately for the images from the different sensors (Figure S2). We used six common bands (blue, green, red, near infrared, shortwave infrared 1 and 2) of Landsat 5, 7, and 8 for the LSMA. The average RMSE value of all images is less than 0.015 (Spring: 0.010, Summer: 0.013, Autumn: 0.010), indicating the high fitness of the four endmembers LSMA used in the study area.

2.4.2. Orchard Distribution

In this study, the distribution of orchards is acquired from the land use/cover classification of Qixia City. Distinct land use/cover categories have different components and component ratios. LSMA can convert the spectral information of the original remote sensing image into physical endmember information. The endmember with specific physical meaning, in contrast to other traditional vegetation indices, such as NDVI, NDMI, and SAVI, can better reflect the information of landscape features (such as plants, soil, water, and so on) and help with orchard classification [30,31,32,33]. Furthermore, the composition and composition ratios of the different land use/cover classes vary seasonally. According to our field research, apple orchards bloom and sprout in April, and orchard foliage begins to grow; August is the peak month for orchard foliage growth; in November, local crops are harvested, and deciduous forest leaves have almost fallen, while apple orchard foliage is just beginning to fall. As a result, we used the LSMA results for April, August, and November 2020 as the foundation for land use/cover classification. We classified land use/cover in Qixia City using random forests [36], which included six categories: water, construction land, grassland, forest land, orchard, and cultivated land. The classification results are shown in Figure 1c. The overall accuracy was 89.8%, among which the classification accuracy of orchards was 91.1% (Table 1).

2.4.3. Estimation of Orchard Planting Age Based on Logistic Growth Model

The logistic function was initially proposed to describe the growth process of population size in biological groups [37]. After that, this function was developed further and applied to different research fields. The LGM is derived from the logistic function, which is more aligned with the realistic population growth pattern [38]. The function of LGM is:
G V t = C 1 + e a b t
where GV is the value of GV endmember, which represents the biomass of green photosynthetic vegetation [30,31,32,33], time t is the year, b is the logistic growth rate of the curve, and C is the environmental carrying capacity (ECC). From a theoretical standpoint, the ECC represents the maximum potential of the population. When a population reaches its ECC, it will stop increasing and fluctuate around the ECC [39]. According to the findings of our field research, apple trees need approximately ten years to reach ECC. Therefore, we can determine the planting age of apple trees by analyzing the correlation between the tree’s growth stage and its ECC. To estimate the ECC, Wang et al. [40] proposed a four-point averaging valuation method (referred to as the four-point method), which uses the time series values of the two equal intervals to find the ECC. The equation for the four-point method is:
C = N j N k ( N i + N l ) N i N l ( N j + N k ) N j N k N i N l   ( i < j ,   k < l )
where C value is the environmental carrying capacity, Ni, Nj, Nk, Nl are the observations corresponding to the time ti, tj, tk, tl (tjti = tltk). The values corresponding to the same time interval are gathered into groupings among all the observations. The actual ECC can be represented by the mathematical expectation of all ECCs estimated by groupings.
To improve the precision of ECC evaluation, the ECC needs to be determined during the slow growth stage (SGS) of the GV. Firstly, we calculate the growth rate of apple trees by taking the first-order derivative of the time-series GV values. From the samples we collected, we found that the highest growth rate occurs in the orchard between the ages of one and five years. The growth rate gradually decreases with increasing planting age (Figure S3). The orchards between the ages of six and 10 years have a slower growth rate, with a mean annual growth stage of 0.036 and a standard deviation (STD) of 0.0087. Based on our experiments, we found that using the average annual growth rate of orchards aged between six and 10 years minus one STD as the threshold (0.0273) for identifying SGS had the best results; the GV growth rate within the SGS should be below this threshold. Second, a set of four-points groups is selected for all equal periods (time interval of one) within the SGS (Figure 4b). We can calculate the corresponding C value for each four-points group using Equation (3). The ultimate ECC is determined by the mathematical expectation of the C values obtained from each four-points group.
After determining the ECC, the general linearization method can be used to obtain the a and b values. We identify the maximum growth stage (MGS) by going backward ten years from the SGS and removing all data after the first observation over the ECC; the LGM is determined by fitting the observations within the MSG. Finally, the valley point in the observed values that were closest to the predicted values of LGM was chosen as the starting planting year.
Three particular conditions may arise. First, when there are fewer than four SGS observations available, the ECC is calculated using MGS (Figure 4a). Second, the MGS is unidentifiable when the number of SGS observations is greater than 29, at which point the pixel value will be set to 32. Third, due to the limitation of remote sensing images, there may be no valley point close to the predicted value of LGM. In this case, we selected the point at which the predicted value appeared greater than or equal to 0.1 as the starting planting year.

2.5. Yield Prediction Based on the BP Neural Network

The BP neural network is the most widely used algorithm for supervised learning with multi-layered feed-forward networks [41]. The BP neural network’s foundational principle is to use back propagation to adjust the network’s weights and thresholds in order to reduce the deviation between the actual and expected output values. The forward propagation process of information and the backward propagation process of errors are the two primary processes of the BP neural network. The BP neural network includes three layers: the input layer, the hidden layer, and the output layer (Figure 5). The signal flows from the input layer to the hidden layer and finally to the output layer. Errors in the output layer will propagate back to the hidden layer and the input layer. The process will stop when the final output meets the user-defined error tolerance threshold [42].
We trained the BP neural network with orchard area and yield data from 2015 to 2019 for different orchard planting ages. The areas of orchards between one and 27 years were obtained directly by working backward from the planting age in 2020. For reasons related to orchard renewal, historical data on the area of orchards older than 28 years are inaccessible. As a result, we extrapolated the annual orchard area in Qixia City by using the ratio of the orchard area in 2020 to the orchard area in other years as reported in the Statistical Yearbook. We then calculated the annual area of the orchards older than 28 years by subtracting from the total area of the orchard areas between one and 27 years. We used the orchard areas of different ages and the regional yield of 12 counties from 2015 to 2019 to train the BP neural network (Table S3), with the input layer set to 4, and the output layer and hidden layer set to 1.

2.6. Accuracy Verification Method

We evaluated the accuracy of the planting age of the apple orchard and regional apple yield using MAE and RMSE. MAE is the average absolute error between predicted and observed values; RMSE is the sample standard deviation of the difference between the predicted and observed values. The smaller MAE and RMSE values represent a better result [43]. The equations for MAE and RMSE are as follows:
MAE = 1 n i = 1 n y ^ i y i
RMSE = 1 n i = 1 n ( y ^ i y i ) 2
where n is the number of samples, y ^ i is the predicted value, y i is the actual value.

3. Results

3.1. Apple Tree Planting Age Estimation and Accuracy Verification

As shown in Figure 6, the overall R2 of the LGM reached 0.745, with 70% of the R2 being greater than 0.7, 55% greater than 0.8, and 25% greater than 0.9. Therefore, the LGM for the fitting results of the GV time-series data can adequately describe the growing process of apple trees. We selected 59 samples to validate the planting age prediction results (Figure 1b). The MAE of the planting age prediction results was 1.76, and the RMSE was 2.24, demonstrating that this method can accurately estimate the planting age of orchards.
The apple orchards are separated into four distinct groups, each corresponding to a distinct stage in their respective growth cycles: from 1 to 4 years is the infant stage, from 5 to 8 years is the premature stage, from 9 to 20 is the mature stage, and over 21 years is the senescence stage. The infant apple trees primarily absorb nutrients and rarely bear fruit. The premature apple trees begin to bear fruit, albeit in small quantities. Apple orchards achieve their highest level of productivity when they reach the mature stage. During the senescent stage, the productivity of apple orchards will naturally decline.
The predicted results of planting age are shown in Figure 7. The percentage of infant orchard area was 2.1%, whereas the percentage of premature orchard area was 13.1%, showing the existence of orchard renewal or expansion in the study area. Apple production is highest in mature orchards, which account for 52.3% of the total orchard area. In senescent orchards, the area occupied by apple trees older than 28 decreases significantly as apple orchard owners promptly replace older orchards. Qixia City’s apple production is dominated by mature and senescent orchards, which account for 84.8% of the total orchard area in the city. As the rate of orchard expansion and renewal has decreased in recent years, whether orchard production can fulfill future market demand remains a challenge.

3.2. Yield Prediction Results Based on the BP Neural Network

In this study, the BP neural network was fitted to the yield and planting age of twelve counties in Qixia City from 2015 to 2019, including Guanli, Guandao, Cuiping, shewopo, Sikou, Songshan, Sujiadian, Taocun, Tingkou, Xicheng, Yangchu and Zhuangyuan. The fitting results of the BP neural network are shown in Figure 8. The close correspondence between the fitted and actual values for all regions indicates that the BP neural network constructed based on planting age is highly accurate for predicting regional yield. Using the trained BP neural network and the 2020 planting age data, we predicted the regional apple yield for 2020. Except for Shewopo, the predicted and actual yields of the remaining eleven regions are nearly identical (Figure 9a). The maximum prediction error percentage across all regions is 8.19%. Furthermore, except for Sujiadian, Shewopo, and ZhuangYuan, the difference between predicted and actual values does not exceed 5%, which indicates the high prediction accuracy of the BP neural network.
Figure 9b displays the yield per hectare for each county. All yields in twelve counties exceeded the Chinese average (20.2 t/ha), with Tingkou being the highest, with yields exceeding 45 t/ha, and Shewopo, Guanli, and Guandao all yielding more than 30 t/ha. Except for Tingkou, all remaining counties have yields between 22 and 30 t/ha, which are relatively close. According to the field survey results, the yield of high-quality orchards at the mature stage in Qixia can reach 37.5 t/ha. In this study, the predicted yields included yields from young and older (over 30 years old) orchards with low yields that were difficult to predict accurately, which affected the accuracy of the predicted yields. In addition, other types of orchards in Qixia, such as grape and peach orchards, affected the apple yield prediction, but the predictions were accurate in general.

3.3. Effect of Orchard Planting Age Structure on Apple Yield

In each region of Qixia, the proportion of orchards in the mature and senescence stages significantly impacts the yield (Figure 10). Except for Shewopo and TingKou, all counties with yields over 25 t/ha contained more than 47% mature orchards. Although the proportion of mature apple orchards in Shewopo and Tingkou was only 40.9% and 45.0%, respectively, the proportion of senescent apple orchards reached 45.3%, indicating that apple trees at the senescent stage with declining productivity can still make a significant contribution to apple production. The proportion of infant orchards in Sikou exceeds 30%, the highest among the 12 counties, while the proportion of mature orchards is only 43.5%, resulting in Sikou being the least productive of the counties in Qixia. Sikou, Xicheng, and Taocun have the highest infant and premature orchard proportion among all Qixia counties, exceeding 20%. In the meantime, apple production in all three counties is below 25 t/ha, demonstrating low apple productivity in infant and premature orchards.
Xicheng, Taocun, and Sikou have an abundance of premature orchards and a low proportion of senescent orchards. These young apple trees will mature gradually over the next few years. In the absence of substantial orchard expansion and orchard regeneration, the yield of these counties will increase over the next several years. In contrast, as senescent orchards get older and cease production, there are insufficient premature apple trees in Yangchu, Tingkou, Sujiadian, Songshan, Shewopo, and Guanli, causing a downward trend in yields. Due to the relatively balanced ratio of premature orchards to senescent orchards, apple production in Guandao, Cuiping, and Zhuangyuan will remain stable.

4. Discussion

4.1. Effect of Orchard Planting Suitability on Apple Yield

The yield of apple orchards is also affected by factors such as water, sunlight, temperature, and topography [29]. The regional yield data used in the initial training of the BP neural network included yield variation caused by environmental factors; therefore, the analysis combined with the distribution of orchards and orchard planting suitability in the 12 counties can better explain the variances in yields between the counties.
As shown in Figure 11, the planting age structures of orchards in Tingkou and Shewopo are nearly identical; however, the yield of orchards in Tingkou exceeds that of Shewopo by 7 t/ha; this is because Tingkou has the highest planting suitability of orchards among the twelve regions, resulting in a higher yield than other regions. The proportion of mature orchards is over 50% in both Guandao and Songshan, and the age structure is comparable; although the yield of Guandao is 4 t/ha higher than that of Songshan, this is primarily due to the large number of orchards located in the generally suitable northern and southeastern regions of Songshan, which reduces the yield. While the overall suitability of Guandao for orchard planting is moderate, abundant mature orchards are distributed in the highly suitable northeastern region. Moreover, the generally suitable region is primarily concentrated in the south, mainly consisting of infant and premature orchards, which have a negligible impact on the overall yield. The majority of orchards in the central and southwestern regions of the Shewopo are located in high-suitability regions, and most of the orchards are in the mature and senescent stages, which significantly increases the total orchard production in the Shewopo. The northern portion of Shewopo is generally suitable for planting, but there are a few orchards in this region; consequently, the yield exceeds 37.5 t/ha even though the proportion of mature orchards in Shewopo is only 40.9%.
Apple orchard yields are typically greater in regions with a high proportion of mature orchards and planting suitability. Combining orchard planting suitability can lead to higher economic returns when expanding orchards and renewing apple trees.

4.2. Innovations and Outlooks for Future Research

The main innovations of this paper are as follows: (1) The LGM is used to map the planting age of orchards on the regional scale. Moreover, the four-point method can accurately evaluate the ECC of orchard growth and then identify the orchard planting year. This GV endmember is more physically meaningful and consistent with the actual situation of apple tree growth than the traditional vegetation indices. (2) Based on orchard planting age, orchard yield was accurately predicted using BP neural networks. Compared with the traditional method using multi-year orchard planting area, orchard planting age can reflect orchard planting activities more accurately and better reflect orchard expansion and orchard renewal.
Nonetheless, due to the accuracy of the original data, this study still contains flaws. When using planting age as the input data for BP neural networks prediction, the accuracy of statistical yearbook data limits the prediction results. Further research can improve the identification of orchard expansion and renewal by mapping the planting age of orchards. In order to increase the accuracy of statistical data and unify statistical standards, it is necessary to collect more precise orchard yield data through field surveys.

5. Conclusions

We developed a novel method to predict orchard yield using planting age. The GV-characterized growth curve of apple trees was fitted using the LGM, which more accurately captures the general pattern of apple tree growth in a life cycle. Mature and senescent orchards made up 52.3% and 32.5% of the total orchards in Qixia, respectively. Premature and infant orchards made up a small percentage, suggesting that the orchard expansion and renewal rate have slowed. The BP neural network model exhibits high stability and accuracy when calculating yield based on planting age, allowing for precise yield predictions. Our forecast for Qixia’s total apple production in 2020 is 1700 kilotons, with each county’s yield exceeding the national average level (20.2 t/ha) and Tingkou’s yield being 2.3 times higher than the average. Our findings suggest that Qixia will retain its position as the leading apple-producing region in China and ensure future supply. Further, our results indicate that apple planting age and orchard planting suitability have a substantial impact on orchard yield. Regions dominated by mature orchards or early senescent orchards have higher yields (e.g., Tingkou and Shewopo). Furthermore, Kuandao and Tingkou, both of which have high planting suitability for orchards, can greatly boost orchard yields. Since highly suitable planting areas are becoming scarce, it is imperative that older orchards be renewed, despite the initial period of lower yield. Yet, orchard renewal is a crucial management strategy for advancing orchards’ intensive and long-term use. The future of the apple industry depends on better orchard growing conditions and a reasonable orchard age structure in terms of yield, efficiency, and sustainability.

Supplementary Materials

The following supporting information can be downloaded at: https://www.mdpi.com/article/10.3390/rs15030642/s1, Figure S1: Data source and time of remote sensing image; Figure S2: The spectral information of pure endmembers for each of the three sensors; Figure S3: The average annual growth rate of different age groups; Table S1: 2018–2019 Statistical Yearbook Data; Table S2: Orchard planting suitability evaluation system; Table S3: BP neural network input data of Guanli.

Author Contributions

Conceptualization, H.L.; methodology, X.G. and W.H.; software, X.G. and W.H.; validation, X.G. and Q.H.; formal analysis, Y.Q.; investigation, S.W.; resources, F.L., Y.L. and X.X.; data curation, X.G., W.H. and Q.H.; writing—original draft preparation, X.G. and Q.H.; writing—review and editing, X.G., Q.H., F.L., J.W. and J.S.; visualization, X.G. and Q.H.; supervision, H.L.; project administration, H.L.; funding acquisition, H.L.; All authors have read and agreed to the published version of the manuscript.

Funding

This research was funded by the National Natural Science Foundation of China (No. 41801202) and the Key Laboratory of Urban Land Resource Monitoring and Simulation, Ministry of Natural Resources (grant number KF-2020-05-026).

Data Availability Statement

Data are available from the corresponding authors upon request.

Acknowledgments

Thanks to the anonymous reviewers and editors for their valuable suggestions for improving the manuscript.

Conflicts of Interest

The authors declare no conflict of interest.

References

  1. Ulaszewska, M.; Vázquez-Manjarrez, N.; Garcia-Aloy, M.; Llorach, R.; Mattivi, F.; Dragsted, L.O.; Praticò, G.; Manach, C. Food intake biomarkers for apple, pear, and stone fruit. Genes Nutr. 2018, 13, 29. [Google Scholar] [CrossRef] [PubMed] [Green Version]
  2. FAOSTAT. Crops and Livestock Products; Food and Agriculture Organization of the United Nations: Rome, Italy, 2022. [Google Scholar]
  3. Gao, X.; Zhao, X.; Wu, P.; Yang, M.; Ye, M.; Tian, L.; Zou, Y.; Wu, Y.; Zhang, F.; Siddique, K.H. The economic–environmental trade-off of growing apple trees in the drylands of China: A conceptual framework for sustainable intensification. J. Clean. Prod. 2021, 296, 126497. [Google Scholar] [CrossRef]
  4. Zhou, Y.; Guo, L.; Liu, Y. Land consolidation boosting poverty alleviation in China: Theory and practice. Land Use Policy 2019, 82, 339–348. [Google Scholar] [CrossRef]
  5. Huang, H.; Zhou, Y.; Qian, M.; Zeng, Z. Land use transition and driving forces in Chinese Loess Plateau: A case study from Pu County, Shanxi Province. Land 2021, 10, 67. [Google Scholar] [CrossRef]
  6. Zhang, Q.; Shi, F.; Abdullahi, N.M.; Shao, L.; Huo, X. An empirical study on spatial–temporal dynamics and influencing factors of apple production in China. PLoS ONE 2020, 15, e0240140. [Google Scholar] [CrossRef]
  7. Zhu, Y.; Yang, G.; Yang, H.; Wu, J.; Lei, L.; Zhao, F.; Fan, L.; Zhao, C. Identification of apple orchard planting year based on spatiotemporally fused satellite images and clustering analysis of foliage phenophase. Remote Sens. 2020, 12, 1199. [Google Scholar] [CrossRef] [Green Version]
  8. Becker-Reshef, I.; Vermote, E.; Lindeman, M.; Justice, C. A generalized regression-based model for forecasting winter wheat yields in Kansas and Ukraine using MODIS data. Remote Sens. Environ. 2010, 114, 1312–1323. [Google Scholar] [CrossRef]
  9. Battude, M.; Al Bitar, A.; Morin, D.; Cros, J.; Huc, M.; Sicre, C.M.; Le Dantec, V.; Demarez, V. Estimating maize biomass and yield over large areas using high spatial and temporal resolution Sentinel-2 like remote sensing data. Remote Sens. Environ. 2016, 184, 668–681. [Google Scholar] [CrossRef]
  10. Iizumi, T.; Sakai, T. The global dataset of historical yields for major crops 1981–2016. Sci. Data 2020, 7, 97. [Google Scholar] [CrossRef] [Green Version]
  11. Liu, Y.; Wang, S.; Chen, J.; Chen, B.; Wang, X.; Hao, D.; Sun, L. Rice Yield Prediction and Model Interpretation Based on Satellite and Climatic Indicators Using a Transformer Method. Remote Sens. 2022, 14, 5045. [Google Scholar] [CrossRef]
  12. Dong, T.; Liu, J.; Shang, J.; Qian, B.; Ma, B.; Kovacs, J.M.; Walters, D.; Jiao, X.; Geng, X.; Shi, Y. Assessment of red-edge vegetation indices for crop leaf area index estimation. Remote Sens. Environ. 2019, 222, 133–143. [Google Scholar] [CrossRef]
  13. Wu, Y.; Xu, W.; Huang, H.; Huang, J. Bayesian Posterior-Based Winter Wheat Yield Estimation at the Field Scale through Assimilation of Sentinel-2 Data into WOFOST Model. Remote Sens. 2022, 14, 3727. [Google Scholar] [CrossRef]
  14. Khan, T.; Qiu, J.; Qureshi, M.A.A.; Iqbal, M.S.; Mehmood, R.; Hussain, W. Agricultural fruit prediction using deep neural networks. Procedia Comput. Sci. 2020, 174, 72–78. [Google Scholar] [CrossRef]
  15. Akbarian, S.; Xu, C.; Wang, W.; Ginns, S.; Lim, S. Sugarcane yields prediction at the row level using a novel cross-validation approach to multi-year multispectral images. Comput. Electron. Agric. 2022, 198, 107024. [Google Scholar] [CrossRef]
  16. Bai, X.; Li, Z.; Li, W.; Zhao, Y.; Li, M.; Chen, H.; Wei, S.; Jiang, Y.; Yang, G.; Zhu, X. Comparison of machine-learning and casa models for predicting apple fruit yields from time-series planet imageries. Remote Sens. 2021, 13, 3073. [Google Scholar] [CrossRef]
  17. Kang, X.; Huang, C.; Zhang, L.; Zhang, Z.; Lv, X. Downscaling solar-induced chlorophyll fluorescence for field-scale cotton yield estimation by a two-step convolutional neural network. Comput. Electron. Agric. 2022, 201, 107260. [Google Scholar] [CrossRef]
  18. Sarron, J.; Malézieux, É.; Sané, C.A.B.; Faye, É. Mango yield mapping at the orchard scale based on tree structure and land cover Assessed by UAV. Remote Sens. 2018, 10, 1900. [Google Scholar] [CrossRef] [Green Version]
  19. Zhu, Y.; Yang, G.; Yang, H.; Zhao, F.; Han, S.; Chen, R.; Zhang, C.; Yang, X.; Liu, M.; Cheng, J.; et al. Estimation of Apple Flowering Frost Loss for Fruit Yield Based on Gridded Meteorological and Remote Sensing Data in Luochuan, Shaanxi Province, China. Remote Sens. 2021, 13, 1630. [Google Scholar] [CrossRef]
  20. Chen, B.; Xiao, X.; Wu, Z.; Yun, T.; Kou, W.; Ye, H.; Lin, Q.; Doughty, R.; Dong, J.; Ma, J.; et al. Identifying establishment year and pre-conversion land cover of rubber plantations on Hainan Island, China using Landsat data during 1987–2015. Remote Sens. 2018, 10, 1240. [Google Scholar] [CrossRef] [Green Version]
  21. Altman, J.; Doležal, J.; Čížek, L. Age estimation of large trees: New method based on partial increment core tested on an example of veteran oaks. For. Ecol. Manag. 2016, 380, 82–89. [Google Scholar] [CrossRef]
  22. Chen, B.; Jin, Y.; Brown, P. Automatic mapping of planting year for tree crops with Landsat satellite time series stacks. ISPRS J. Photogramm. Remote Sens. 2019, 151, 176–188. [Google Scholar] [CrossRef]
  23. Jiao, S.; Shen, Z.; Kou, W.; Wang, H.; Li, J.; Jiao, Z.; Lei, Y. Parcel-Level Mapping of Horticultural Crops in Mountain Areas Using Irregular Time Series and VHR Images Taking Qixia, China as An Example. Remote Sens. 2023, 15, 175. [Google Scholar] [CrossRef]
  24. Roy, D.P.; Wulder, M.A.; Loveland, T.R.; Woodcock, C.E.; Allen, R.G.; Anderson, M.C.; Helder, D.; Irons, J.R.; Johnson, D.M.; Kennedy, R.; et al. Landsat-8: Science and product vision for terrestrial global change research. Remote Sens. Environ. 2014, 145, 154–172. [Google Scholar] [CrossRef] [Green Version]
  25. Zhu, Z.; Woodcock, C.E. Object-based cloud and cloud shadow detection in Landsat imagery. Remote Sens. Environ. 2012, 118, 83–94. [Google Scholar] [CrossRef]
  26. Selkowitz, D.J.; Forster, R.R. Automated mapping of persistent ice and snow cover across the western U.S. with Landsat. ISPRS J. Photogramm. Remote Sens. 2016, 117, 126–140. [Google Scholar] [CrossRef]
  27. Beattie, B.B.; Folley, R.R.W. Production variability in apple crops. Sci. Hortic. 1977, 6, 271–279. [Google Scholar] [CrossRef]
  28. Emongor, V.E.; Murr, D.P.; Lougheed, E.C. Preharvest factors that predispose apples to superficial scald. Postharvest Biol. Technol. 1994, 4, 289–300. [Google Scholar] [CrossRef]
  29. Qu, Y.; Qi, W.; Zhao, S.; Shi, D.; Shang, R.; Li, L. Ecological suitability evaluation and potential analysis of top-quality apple in Jiaodong mountainous areas at county level. Trans. Chin. Soc. Agric. Eng. 2008, 6, 109–114. [Google Scholar]
  30. Smith, M.O.; Ustin, S.L.; Adams, J.B.; Gillespie, A.R. Vegetation in deserts: I. A regional measure of abundance from multispectral images. Remote Sens. Environ. 1990, 31, 1–26. [Google Scholar] [CrossRef]
  31. Sun, D.; Liu, N. Coupling spectral unmixing and multiseasonal remote sensing for temperate dryland land-use/land-cover mapping in Minqin County, China. Int. J. Remote Sens. 2015, 36, 3636–3658. [Google Scholar] [CrossRef]
  32. Sun, D.; Zhang, P.; Sun, Q.; Jiang, W. A dryland cover state mapping using catastrophe model in a spectral endmember space of OLI: A case study in Minqin, China. Int. J. Remote Sens. 2019, 40, 5673–5694. [Google Scholar] [CrossRef]
  33. Li, Z.; Han, W.; Hu, Q.; Gao, X.; Wang, L.; Xiao, F.; Liu, W.C.; Guo, W.H.; Sun, D.F. Land use/cover classification based on combining spectral mixture analysis model and object-oriented method. Trans. Chin. Soc. Agric. Eng. 2021, 37, 225–233. [Google Scholar]
  34. Boardman, J.W. Automating Spectral Unmixing of AVIRIS Data Using Convex Geometry Concepts; Summaries of the 4th Annual JPL Airborne Geoscience Workshop; NASA: Washington, DC, USA, 1993. [Google Scholar]
  35. Liu, L.; Xiao, X.; Qin, Y.; Wang, J.; Xu, X.; Hu, Y.; Qiao, Z. Mapping cropping intensity in China using time series Landsat and Sentinel-2 images and Google Earth Engine. Remote Sens. Environ. 2020, 239, 111624. [Google Scholar] [CrossRef]
  36. Belgiu, M.; Drăguţ, L. Random forest in remote sensing: A review of applications and future directions. ISPRS J. Photogramm. Remote Sens. 2016, 114, 24–31. [Google Scholar] [CrossRef]
  37. Berkson, J. Application of the logistic function to bio-assay. J. Am. Stat. Assoc. 1944, 39, 357–365. [Google Scholar]
  38. Tsoularis, A.; Wallace, J. Analysis of logistic growth models. Math. Biosci. 2002, 179, 21–55. [Google Scholar] [CrossRef] [PubMed] [Green Version]
  39. Han, W.; Liu, M.; Sun, M.; Zha, S.; Huo, W.; Sun, D. Time-of-planting mapping method for apple orchards based on standard spectral endmembers spaces. Trans. Chin. Soc. Agric. Eng. 2022, 38, 201–210. [Google Scholar]
  40. Wang, Z.; Lin, K. Two-paired points method for estimating K value of logistic equation. Acta Ecol. Sin. 1987, 3, 193–198. [Google Scholar]
  41. Tian, H.; Wang, P.; Tansey, K.; Zhang, S.; Zhang, J.; Li, H. An IPSO-BP neural network for estimating wheat yield using two remotely sensed variables in the Guanzhong Plain, PR China. Comput. Electron. Agric. 2020, 169, 105180. [Google Scholar] [CrossRef]
  42. Li, L.; Chen, Y.; Xu, T.; Liu, R.; Shi, K.; Huang, C. Super-resolution mapping of wetland inundation from remote sensing imagery based on integration of back-propagation neural network and genetic algorithm. Remote Sens. Environ. 2015, 164, 142–154. [Google Scholar] [CrossRef]
  43. Chai, T.; Draxler, R.R. Root mean square error (RMSE) or mean absolute error (MAE)?—Arguments against avoiding RMSE in the literature. Geosci. Model Dev. 2014, 7, 1247–1250. [Google Scholar] [CrossRef]
Figure 1. Study area and land use/cover classification result. (a) Study area. (b) High-resolution remote sensing image of Qixia City and samples. (c) The land use/cover classification result of Qixia City.
Remotesensing 15 00642 g001
Figure 2. Overall framework of the study.
Remotesensing 15 00642 g002
Figure 3. Standard endmember spectral curves and 2020 LSMA results. (a) Standard spectral information of four pure endmembers. (b) LMSA results in 2020.
Remotesensing 15 00642 g003
Figure 4. Schematic diagram of estimated planting age based on LGM. (a) Unidentifiable SGS. (b) Identifiable SGS.
Remotesensing 15 00642 g004
Figure 5. Structure of BP neural networks.
Remotesensing 15 00642 g005
Figure 6. Accuracy validation of orchard planting age estimation. The blue line is the 1:1 line.
Remotesensing 15 00642 g006
Figure 7. Assessment Results of Orchard Planting Age. (a) Planting age estimation results. (b) Details of the planting age estimation results. (c) Percentage of orchard area of different ages in Qixia City.
Remotesensing 15 00642 g007
Figure 8. Training results of BP neural network model. (al) Predicted yield compared with the actual yield of model training results for each county in Qixia from 2015 to 2019. Actual yields are from statistical yearbooks.
Remotesensing 15 00642 g008
Figure 9. The 2020 prediction results and errors of counties in Qixia city. (a) Prediction results and error between predicted and actual yields. (b) Yield per hectare.
Remotesensing 15 00642 g009
Figure 10. The comparison of orchard planting age structure and regional orchard yield.
Remotesensing 15 00642 g010
Figure 11. Relationship between orchard planting suitability and orchard yield. (a) The suitability of orchard planting. (b) The planting age of apple orchards. (c) Suitability distribution and yield of existing orchards in each county. The numbers in (a) and (b) correspond to (c).
Remotesensing 15 00642 g011
Table 1. Land use/cover classification accuracy.
Classification ResultWaterConstruction LandGrasslandForest LandOrchardCultivated Land
Water96.3%3.7%0.0%0.0%0.0%0.0%
Construction land6.1%84.8%6.1%3.0%0.0%0.0%
Grassland0.0%3.4%89.7%3.4%0.0%3.4%
Forest land0.0%0.0%3.3%80.0%13.3%3.3%
Orchard0.0%0.0%0.0%9.5%90.5%0.0%
Cultivated land1.6%0.0%1.6%1.6%1.6%93.5%
Producer’s Accuracy96.3%84.8%89.7%80.0%91.1%93.5%
Consumer’s Accuracy89.7%93.3%86.7%77.4%89.1%96.7%
Disclaimer/Publisher’s Note: The statements, opinions and data contained in all publications are solely those of the individual author(s) and contributor(s) and not of MDPI and/or the editor(s). MDPI and/or the editor(s) disclaim responsibility for any injury to people or property resulting from any ideas, methods, instructions or products referred to in the content.

