Abstract
This work compares the contributions of synoptic, intraseasonal, and interannual components of large-scale parameters to tropical cyclone (TC) genesis over the North Indian Ocean (NIO) from April to December from 1979 to 2020. A composite analysis is employed with respect to TC genesis time and location. It is shown that most TCs occur when the total sea surface temperature (SST) is between 28 and 30 °C and SST anomalies in three time ranges are small (with the magnitude less than 0.2 °C). The TCs form mostly when the anomalies of vertical zonal wind shear are between −6 and 6 m s−1 and total vertical zonal wind shear falls within −12 and −3 m s−1, with the synoptic component being a positive contributor. The intraseasonal component of vorticity and convergence in the low level, vertical motion and specific humidity in the middle level, and convection contributes dominantly to the TC genesis. Synoptic-scale tropical disturbances obtain barotropic kinetic energy from the climatological mean and intraseasonal flows, with the former dominant in the southeastern sector, and the latter dominant in the northwestern sector. The contributions of the three temporal components of environmental factors are compared for TC genesis between the Arabian Sea (AS) and Bay of Bengal (BOB) and between the early season (April through June) and late season (September through December). The relative contributions of the three temporal components of factors are also compared for the TC formation among the NIO, northern tropical Atlantic Ocean (NTA), Northwestern Pacific (WNP), and Northeastern Pacific (ENP).
1. Introduction
Tropical cyclones (TCs) emerge over tropical warm oceans during summer and fall, featuring a closed lower-level cyclonic circulation with forceful winds and a spiral distribution of strong precipitation [1]. TCs form around the global tropics, including both the Northwestern and Northeastern Pacific, the Southwestern Pacific, the northern Atlantic Ocean, and both the North and South Indian Ocean. Generally, the North Indian Ocean (NIO) includes the Arabian Sea (AS) and Bay of Bengal (BOB). Singh and Roxy (2022) showed that NIO TCs account for 6% of global annual TCs [2]. Some of the most destructive TCs are generated in the NIO, causing great casualties and economic loss over the coastal countries of the NIO such as India, Myanmar, and Bangladesh. In historical TC records, 7 of the top 10 lethiferous TCs formed over the BOB [3,4,5]. Therefore, an investigation of the mechanisms responsible for NIO TC genesis is of great importance.
Warm sea surface temperatures (SSTs), the Coriolis force off the equator, great relative vorticity in the lower level, low vertical wind shear, and ample moisture in the middle level are the essential conditions for tropical cyclogenesis [6,7,8,9,10]. These large-scale factors for tropical cyclogenesis are modulated by the climate modes through a monthly mean composite of various environmental factors over the NIO [11,12,13]. For instance, the environmental parameters over the NIO are significantly adjusted by the El Niño–Southern Oscillation (ENSO) [10,12,14,15,16]. There is a higher TC genesis frequency and a stronger TC intensity over the BOB during La Niña years [14,15,16,17]. La Niña years are accompanied by favorable large-scale environmental fields including low vertical wind shear, increased relative vorticity, and high humidity [14,16]. Moreover, the Madden–Julian Oscillation (MJO), as a prevailing intraseasonal system [18], makes its adjustment on the environmental factors for the NIO tropical cyclogenesis with more active TC genesis in the region of enhanced relative lower-level vorticity, increased mid-level relative humidity, and reduced vertical wind shear [13,19,20,21].
Generally, TC genesis is a local synoptic process. The conditions of TC formation are comprised of a synthesis of various temporal components of large-scale parameters. Thus, it is proper to focus on the specific time and position of tropical cyclogenesis to document the contributions of various temporal components of large-scale variables to NIO tropical cyclogenesis [22,23]. This point of view in terms of time and position of tropical cyclogenesis was proposed by Cao et al. (2018, 2019, 2021) [24,25,26] in the diagnosis of the relative contributions of environmental factors on various time scales to TC formation over the Northwestern Pacific (WNP), Northeastern Pacific (ENP), and northern tropical Atlantic Ocean (NTA). This work attempts to extend the previous works [24,25,26] to NIO TC genesis to address the following three objectives. Focusing on the NIO, we firstly contrast contributions to tropical cyclogenesis of a variety of large-scale parameters on three time scales: synoptic, intraseasonal, and interannual. Second, we examine regional and temporal diversity in the contributions of various temporal components of ambient fields to NIO tropical cyclogenesis. Third, we compare the distinction of the contributions of the ambient parameters on the various time scales to NIO tropical cyclogenesis with those over the WNP, ENP, and NTA.
The remainder is structured as below. The materials and methods are introduced in Section 2. The contributions of various large-scale factors on various time scales to NIO TC formation are documented in Section 3. Section 4 compares the contributions of various temporal components to TC formation between the AS and BOB during the early and late seasons. An analogous comparison is also performed among the NIO, WNP, ENP, and NTA in the same section. A summary and short discussion are provided in Section 5.
2. Materials and Methods
The historical tropical cyclogenesis dataset was provided by JTWC, archived in the National Climate Data Center’s International Best Track Archive for Climate Stewardship (IBTrACS) v04r00 [27]. In this dataset, the time of the tropical cyclogenesis is determined based on the first observation record of the maximum sustained wind speed, which is more than 25 kts.
The daily mean interpolated satellite outgoing longwave radiation (OLR) data were provided by the National Oceanic and Atmosphere Administration (NOAA) [28]. The data of daily mean dynamical and thermodynamical variables were obtained from the ERA5 reanalysis on a 2.5° × 2.5° grid [29]. The monthly mean SST on a 2° × 2° grid was obtained from the Extended Reconstructed Sea Surface Temperature (ERSST) V5 data, beginning from 1854 [30].
The synoptic, intraseasonal, and interannual components of different large-scale parameters were obtained by employing a Lanczos filter [31]. The synoptic component of variations was derived by using a 3–8-day bandpass Lanczos filter [31] to the original daily time series from 1979 to 2021. Similarly, the intraseasonal component of variations was derived by using a 10–90-day bandpass Lanczos filter. Climatological daily means from 1979 to 2021 were removed from the original dataset to gain a daily anomalous time series. The interannual component of variations over a >90-day period was obtained by applying a 90-day low-pass Lanczos filter to the daily anomaly time series from 1979 to 2021.
In addition to the large-scale parameters modulating TC genesis [19,20,21], the dynamic influence of large-scale background flows on TC formation was also obtained through barotropic kinetic energy conversion by which synoptic-scale eddies obtain energy from the background flows [32,33]. The eddy kinetic energy was used to indicate synoptic-scale eddies. The formula of the barotropic kinetic energy conversion in the lower level [32,33] can be written as
where are the background wind flows, and are the synoptic-scale eddy components of winds on the 3–8-day time scale. The background flows are segmented into climatological mean winds, and interannual and intraseasonal components as and . The four terms of the barotropic kinetic energy conversion equation are in relation to the zonal convergence of zonal wind and the meridional shear of zonal wind , and the zonal shear of meridional wind and meridional convergence of meridional wind , respectively.
3. Contributions of Various Temporal Components to NIO TC Genesis
The region of 0°–22.5°N and 50°–100°E is the major source of TC genesis over the NIO (Figure 1a). Climatological mean low-level winds are westerly in this region. Most TCs over the NIO are generated in regions with climatological mean SSTs greater than 27.5 °C. Further, the frequency of BOB tropical cyclogenesis is far greater than that of AS TC genesis, which is in concert with previous research [1,34]. This difference is owing to the higher SST and moisture content over the BOB than over the AS, and synoptic-scale disturbances propagating from the WNP to the BOB [35].
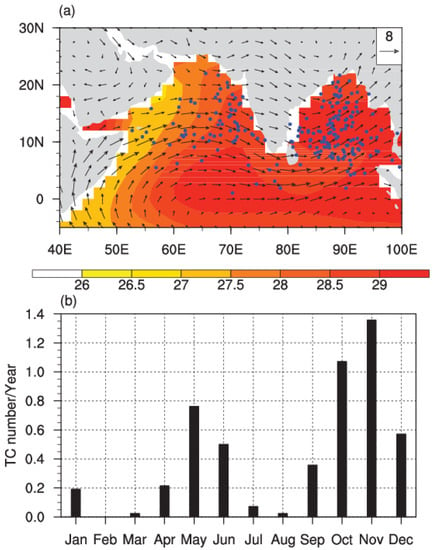
Figure 1.
(a) The climatological mean SST (shaded, °C) and lower-level winds (vector, m s−1) during AMJJASOND for the period 1979–2020. The blue dots indicate the location of AMJJASOND TC formation. (b) The climatologically monthly mean variation of TC formation frequency over the NIO during the period 1979–2020.
The climatology of the tropical cyclogenesis number occurring over the NIO (0°–25°N and 50°–100°E) reaches its peak in November, and TC genesis is scarcely observed in February (Figure 1b). The NIO has two active TC genesis seasons; one lasts from April to June, while the other one lasts from September to December, consistent with a previous study [5]. These two active TC genesis seasons are also observed in both the AS and BOB (figure not shown). Compared with the NTA, WNP, and ENP, NIO TC genesis frequency shows a distinct picture in terms of annual cycle [24,25,26]. There is only one single peak TC season within July through October over the NTA, WNP, and ENP [24,25,26]. TCs are rarely generated during the monsoon season (from July to August) over the NIO due to the strong vertical wind shear [5]. There were 207 TCs generated over the NIO region in total during April to December (AMJJASOND for brevity) from 1979 to 2020. Although we included TC genesis in July and August in the following analysis, the low number of generated TCs in these two months did not influence the statistical results, as our analysis was conducted according to the TC genesis time and position. A comparison between the AS and BOB and between early TC season (April through June) and late TC season (September through December) are presented in Section 4.
In the following, the contributions of the environmental parameters, including SST, vertical shear of zonal wind between 850 hPa and 200 hPa, OLR, 850 hPa convergence, 850 hPa relative vorticity, 700 hPa specific humidity, 500 hPa vertical p-velocity, and 850 hPa barotropic energy conversion, to the NIO tropical cyclogenesis are analyzed on different time scales. The above dynamic and thermodynamic factors are crucial in the process of tropical cyclogenesis [7,9,32]. Note that when the anomalies of the SST, lower-level relative vorticity, lower-level barotropic eddy energy conversion, and mid-level specific humidity are greater than 0 or when the anomalies of the OLR, lower-level convergence, and mid-level vertical motion are less than 0, the contributions of these factors to tropical cyclogenesis are positive. On the contrary, their contributions are considered to be negative.
The contributions of the three temporal components of the aforementioned ambient parameters to NIO tropical cyclogenesis were calculated in the following steps. First, the daily anomalies of these variables on various time scales for each tropical cyclogenesis case were calculated based on a 7.5° × 7.5° averaged box centered around the location of tropical cyclogenesis. Then, the anomalies of these variables were grouped into multiple ranges determined according to total anomalies, i.e., the sum of individual anomalies, or total value, i.e., the sum of climatological mean and total anomalies. The number of generated TCs, the average of total anomalies, and the average of anomalies on individual time scales were computed for each range. The proportion of the NIO tropical cyclogenesis in a specific range was obtained by dividing the TC genesis frequency falling within this range by the total TC genesis number.
Generally, a warm ocean provides moisture and thermal energy to promote TC genesis [2,6,7]. About 67% (141/207) of TCs over the NIO were found to emerge when the SST anomalies fall into the interval between −0.4 and +0.4 °C (Figure 2a). The increase of anomalies of the interannual and intraseasonal components is accompanied by a declining TC genesis number. It follows that the SST anomalies may not be vital for NIO TC genesis, which is likely due to the high climatological mean warm SSTs there. The vast majority of TCs over the NIO emerged when the total SST was within 28–30 °C (Figure 2b), exceeding the threshold of 26.5 °C for tropical cyclogenesis [7]. Only a few TCs emerged when the total SST exceeded 30 °C. This is related to intraseasonal and interannual components (Figure 2b).
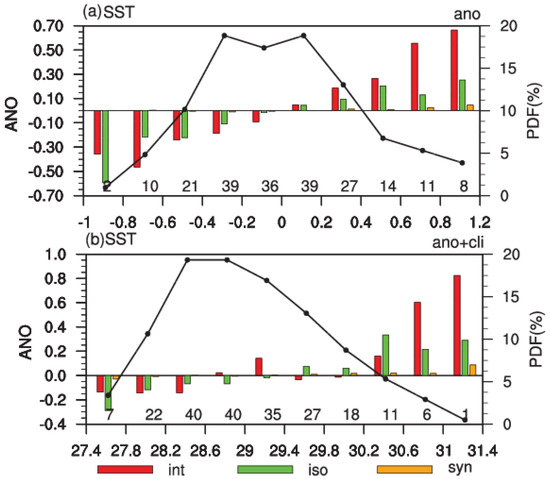
Figure 2.
Distribution of daily anomalies of (a) SST (°C) associated with the 207 TCs on interannual (red bar), intraseasonal (green bar), and synoptic (orange bar) time scales during AMJJASOND in 1979–2020. (b) The same as (a) except that the bins are grouped based on total SST. The solid line indicates the probability density function of TC formation (scale at right). The digit number above the x-axis indicates the TC formation number in each bin.
Weak vertical wind shear is one of the essential prerequisites for tropical cyclogenesis. DeMaria (1996) suggested that the formation of an upper-level warm core prefers weak vertical wind shear, which helps the tropical disturbances to grow into TCs [36]. Most of the TCs over the NIO emerged when anomalies of vertical zonal wind shear were within −6 and 6 m s−1 and all the three components were small (Figure 3a). When vertical zonal wind shear anomalies were great (either positive or negative), the tropical cyclogenesis frequency decreased. The increase of the vertical zonal wind shear anomalies was ascribed to intraseasonal and interannual components with a larger contribution from the former (Figure 3a). The climatology value of vertical zonal wind shear was easterly over the NIO. Most TCs were observed when the total vertical shear of zonal wind was between −12 and −3 m s−1 (Figure 3b). This indicates that the magnitude of the vertical zonal wind shear for NIO TC genesis was relatively great compared to that over the other basins. Among the three components, the synoptic component was positive, and the intraseasonal and interannual components were negative (Figure 3b). This suggests that the synoptic component of the vertical zonal wind shear contributed positively to NIO tropical cyclogenesis.
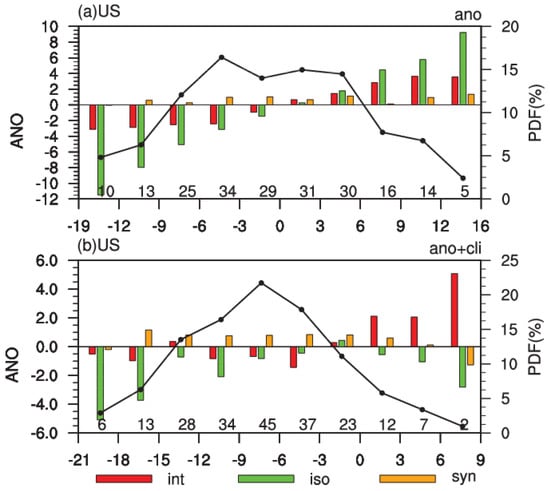
Figure 3.
Same as Figure 2, except for (a) daily anomalies of vertical zonal wind shear (m s−1) on interannual (red bar), intraseasonal (green bar), and synoptic (orange bar) time scales. (b) The same as (a) except that the bins are grouped based on total vertical zonal wind shear..
We further examined the two-dimensional distributions of composite 850 hPa wind and relative vorticity, 850 hPa divergence, 700 hPa specific humidity, OLR, and 500 hPa vertical motion centered around the locations where TCs emerge on synoptic, intraseasonal and interannual time scales (Figure 4). A composite of barotropic energy conversion terms centered around the TC genesis locations in association with interannual flows, intraseasonal flows, and climatological mean winds is shown in Figure 5. An obvious feature is that the total anomalies of the above factors were dominated by the intraseasonal component (Figure 4). The synoptic and interannual components were relatively weak (Figure 4). On the other hand, the climatological mean winds and intraseasonal flows supplied the barotropic energy for the growth of the synoptic eddies (Figure 5a,c). The interannual component of wind variations had a very small contribution (Figure 5b). A salient difference was seen in the spatial distribution of the barotropic eddy energy conversion related to the climatological mean winds and intraseasonal flows. The largest barotropic eddy energy conversion associated with the climatological mean winds was located in the southeastern sector (Figure 5a). In sharp contrast, the largest barotropic eddy energy conversion associated with the intraseasonal flows was located in the northwestern quadrant (Figure 5c).
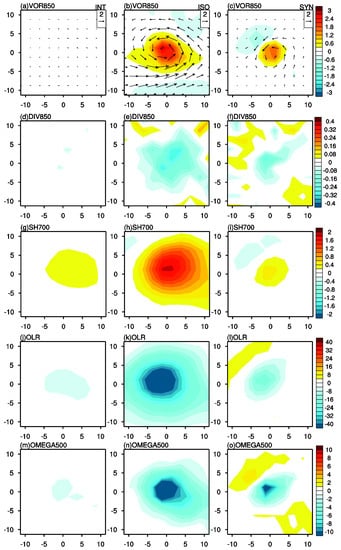
Figure 4.
Composite of (a–c) 850 hPa wind (vector, m/s, scale at the top right) and relative vorticity (shading, 10−5 s−1), (d–f) 850 hPa divergence (shading, 10−5 s−1), (g–i) 700 hPa specific humidity (shading, g kg−1), (j–l) OLR (shading, W m−2), and (m–o) 500 hPa vertical p-velocity (shading, 10−2 Pa s−1) centered over the locations of TC formation on (left) interannual, (middle) intraseasonal, and (right) synoptic time scales during AMJJASOND from 1979 to 2020. The zero indicates the grid point nearest to the TC formation locations. The x-axis (y-axis) represents the distance (°) from the TC center with positive distance to the east (north) and negative distance to the west (south).
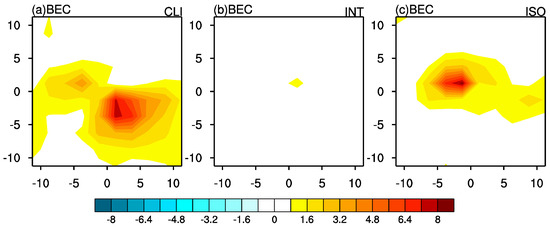
Figure 5.
The same as Figure 4, except for composite barotropic energy conversion (10−5 m2/s3) terms associated with (a) climatological mean winds (CLI), (b) interannual (INT), (c) intraseasonal background flows (ISO).
Based on Figure 4 and Figure 5, we conducted a quantitative comparison of the contributions of three temporal components to NIO tropical cyclogenesis. For this purpose, the total percent contributions of the three components, as shown in Figure 6, were obtained as the rate between the total average anomalies on one component and the sum of the total average anomalies of the synoptic, intraseasonal, and interannual components when the total anomalies contribute positively to NIO tropical cyclogenesis.
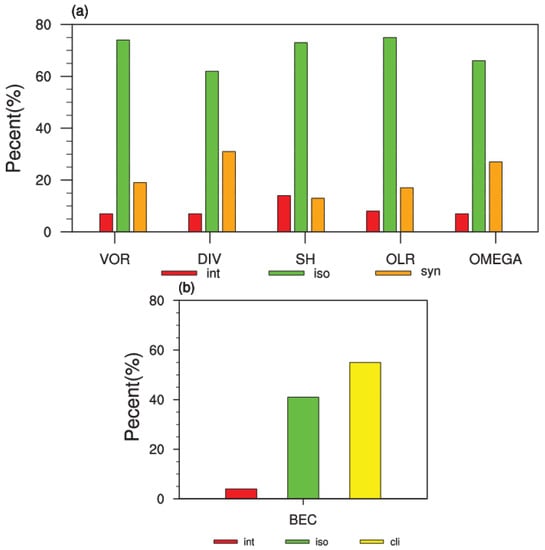
Figure 6.
The percent (%) contributions (a) from anomalies of 850 hPa relative vorticity (VOR), 850 hPa divergence (DIV), 700 hPa specific humidity (SH), OLR, and 500 hPa vertical p-velocity (OMEGA) on interannual (red bar), intraseasonal (green bar), and synoptic (orange bar) time scales; and (b) 850 hPa barotropic energy conversion (BEC) with regard to interannual (red bar), intraseasonal (green bar) flows, and climatological mean (yellow bar) flows.
A pronounced feature is that the intraseasonal component of low-level relative vorticity, low-level convergence, mid-level specific humidity, OLR, and mid-level vertical movement to the NIO tropical cyclogenesis were much greater than the synoptic and interannual components (Figure 6a), which elucidates that the influence of the aforementioned ambient parameters to the NIO tropical cyclogenesis is governed by the intraseasonal component. For the barotropic eddy energy conversion, the climatological mean winds and intraseasonal variations of flows supply the energy for the growth of the synoptic-scale disturbances (Figure 6b). Note that for the role of individual factors, we mainly focused on the comparison of contributions of anomalies on the interannual, intraseasonal, and synoptic time scales, while for the barotropic kinetic energy conversion, we mainly focused on the impact of large-scale background flows, including climatological mean winds and slow-varying wind anomalies on tropical cyclogenesis.
To examine whether the TC-related winds interfere with the synoptic and intraseasonal components of dynamical fields, we conducted a parallel analysis about the relative contribution of low-level relative vorticity and convergence on the three time scales to TC formation after removing the TC vortex from the total wind fields. The removal of TC-related cyclonic winds followed the procedure in [37] according to the algorithm proposed by Kurihara et al. (1995) [38]. The results based on TC-removed wind fields were similar to those based on total wind fields (Figure 7), which indicate that the above conclusions still hold after removing the TC-related wind fields.
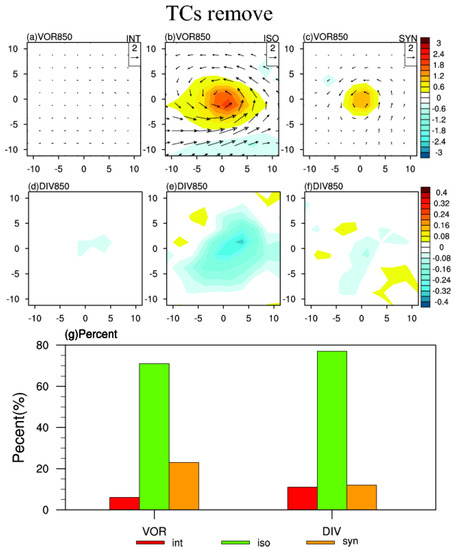
Figure 7.
Composite of (a–c) 850 hPa wind (vector, m/s, scale at the top right) and relative vorticity (shading, 10−5 s−1), (d–f) 850 hPa divergence (shading, 10−5 s−1) centered over the locations of TC formation on (left) interannual, (middle) intraseasonal, and (right) synoptic time scales during AMJJASOND from 1979 to 2020 with the TC signals removed. The zero indicates the grid point nearest to the TC formation locations. The x-axis (y-axis) represents the distance (°) from the TC center with positive distance to the east (north) and negative distance to the west (south). The percent (%) contributions (g) from anomalies of 850 hPa relative vorticity (VOR) and 850 hPa divergence (DIV) on interannual (red bar), intraseasonal (green bar), and synoptic (orange bar) time scales with the TC signals removed.
To qualitatively comprehend the mechanism of the dominant role of intraseasonal variations in the contributions of the OLR, low-level relative vorticity and divergence, and mid-level specific humidity and vertical p-velocity to the NIO tropical cyclogenesis, the ratios of the standard deviation of the above five factors were computed between the synoptic component and the intraseasonal component (Figure 8). It was seen that the standard deviations of intraseasonal components of the OLR, low-level relative vorticity, and mid-level specific humidity were greater than those of the synoptic component over the NIO (Figure 8a–c). This feature was particularly obvious for mid-level specific humidity (Figure 8c). This finding implies that the intraseasonal component of the OLR, low-level relative vorticity, and mid-level specific humidity is the most important over the NIO from April to December in the period 1979–2020. Thus, TC genesis prefers to occur in the background of active intraseasonal variations. The present results are in consonance with previous studies [19,39]. For instance, tropical cyclogenesis frequency increases over the NIO and the WNP under the active MJO phase [19]. It is noteworthy that for the low-level divergence and mid-level vertical motion, the ratios of the standard deviation between the synoptic and intraseasonal components are reversed (Figure 8d,e). This indicates that there is an inconsistency from different perspectives between the season mean and TC genesis location. This is due to a mismatch of the spatiotemporal scales between the background field and the local TC genesis.
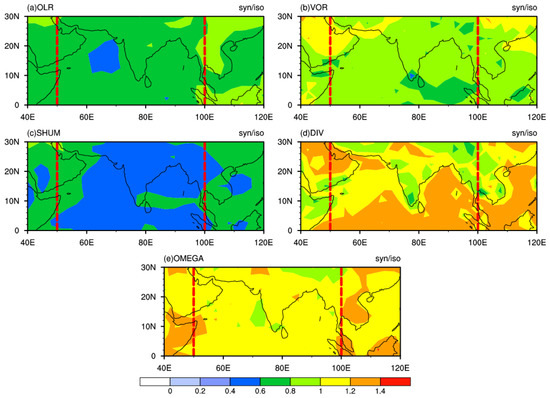
Figure 8.
The ratios of the standard deviations in (a) OLR, (b) 850 hPa relative vorticity, (c) 700 hPa specific humidity, (d) 850 hPa divergence, and (e) 500 hPa vertical p-velocity between the synoptic and intraseasonal components over the NIO during AMJJASOND of the period 1979–2020. The red dashed lines indicate the main region of the NIO.
4. The Comparison in Different Regions
4.1. The Comparison between the AS and BOB
This section further examines the differences in the contributions of various temporal components of large-scale parameters to the tropical cyclogenesis between the AS and BOB. We also compared the contributions between the early and late TC seasons. The results are displayed in Figure 9 and Figure 10. A common feature is that the 850 hPa relative vorticity and convergence, 700 hPa specific humidity, OLR, and 500 hPa vertical motion to the tropical cyclogenesis were dominantly contributed by the intraseasonal variation over the AS and BOB and in both April through June (AMJ) and September through December (SOND) (Figure 9). A different feature is that during AMJ over the AS, climatological mean environmental flows dominantly supplied barotropic energy for the growth of the synoptic eddies (Figure 10), whereas during AMJ over the BOB, the barotropic eddy energy conversion related to intraseasonal flows was greater than that related to the climatological mean flows (Figure 10). This difference is partly related to the larger shear of climatological mean winds over the AS than over the BOB (Figure 1a).
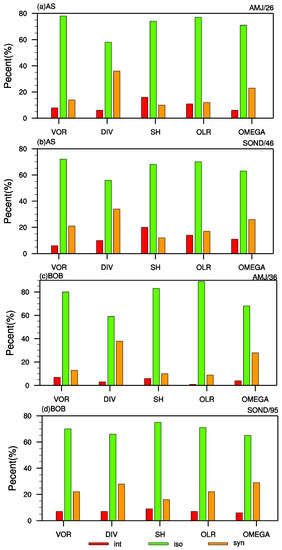
Figure 9.
Similar to Figure 6a, except over the (a,b) AS and (c,d) BOB during (a,c) AMJ and (b,d) SOND during the period 1979–2020. The four digit numbers at the top right indicate the TC formation number in the respective region and period.
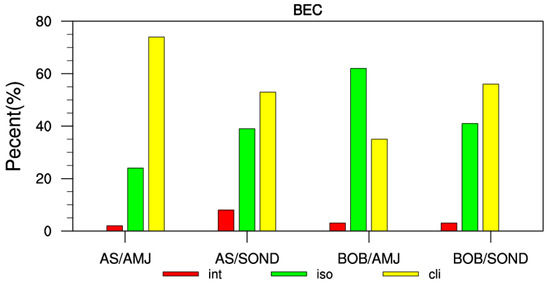
Figure 10.
Similar to Figure 6b, except over the AS and BOB during AMJ and SOND.
4.2. The Comparison among Different Ocean Basins
Tropical cyclogenesis over various oceanic basins is possibly related to different temporal components of atmospheric and oceanic processes. Here, we compared the contributions of various temporal components of environmental parameters to tropical cyclogenesis among the NIO, WNP, ENP, and NTA. Our previous works [24,25,26] have examined the relative contribution of various temporal components of environmental parameters to tropical cyclogenesis during the major TC seasons of 1979–2013 over the WNP, ENP, and NTA. Table 1 summaries the major results of comparisons of the relative contributions of OLR, relative vorticity, specific humidity, and barotropic eddy energy conversion among the above four oceanic basins. There are both similarities and noticeable differences among the four oceanic basins. On the one hand, the intraseasonal components of OLR, relative vorticity in the low-level, and specific humidity in the mid-level have primary positive contributions to TC formation over the NIO and WNP. On the other hand, over the NIO and NTA, the main contribution of the barotropic eddy energy conversion is similar, with the major positive contribution in association with climatological mean flows and intraseasonal flows. On the contrary, the synoptic components of OLR, relative vorticity, and specific humidity have dominantly positive contributions to tropical cyclogenesis over the ENP and NTA, which is completely different from that over the NIO and WNP. Additionally, climatological mean background flows are a dominant energy source for the growth of the synoptic eddies in the lower troposphere over the ENP and WNP.

Table 1.
Summary of the primary contribution components of OLR, relative vorticity (VOR), specific humidity (SH), and barotropic energy conversion (BEC) to tropical cyclogenesis over the NIO, WNP, ENP, and NTA.
The discrepancy in the contributions of OLR, relative vorticity, and specific humidity between the NIO/WNP and ENP/NTA seems to be related to the activities of synoptic-scale disturbance and intraseasonal oscillation. On the synoptic time scale, the African easterly waves are found to be a precursor for the tropical cyclogenesis over the NTA and ENP [40,41]. Therefore, the variation on the synoptic time scale is anticipated to be more prominent over the ENP and NTA. On the other hand, the MJO with the 30–60-day period is a dominant signal, and it is triggered over the equatorial Indian Ocean and tends to propagate eastward to the western Pacific [2]. As a result, the variation of the intraseasonal time scale is expected to be more vigorous over the NIO and WNP.
5. Conclusions
This study compares the contributions of large-scale parameters to NIO tropical cyclogenesis in terms of time and location of tropical cyclogenesis. First, the total anomalies of every parameter in the location of tropical cyclogenesis are segmented into synoptic, intraseasonal, and interannual components. Then we contrast the contributions of various temporal components of the environmental parameters to NIO tropical cyclogenesis. Furthermore, the contributions of the various temporal components of each parameter are contrasted between the AS and BOB and among the NIO, WNP, ENP, and NTA.
The composite analysis shows that the primary positive contributions of relative vorticity and convergence in the low level, specific humidity, and vertical motion in the middle level and OLR to NIO TC genesis are consistently owing to the intraseasonal component. The climatological mean winds and intraseasonal flows supply the barotropic energy for the growth of the synoptic eddies in the lower level, with the former being slightly larger than the latter. Most TCs emerge when the vertical zonal wind shear anomalies are between −6 m s−1 and 6 m s−1, with the synoptic-scale component being a positive contributor. The SST anomalies do not seem to be critical for tropical cyclogenesis over the NIO due to high climatological mean SST there.
The primary positive contributions of relative vorticity and convergence in the low level, specific humidity, and vertical motion in the middle level and OLR to tropical cyclogenesis are contributed by the intraseasonal component over both the AS and BOB and during both early and late TC seasons. However, there is an evident diversity in the barotropic energy conversion during AMJ between the AS and BOB. Over the AS, climatological mean environmental flows supply primary barotropic energy for the growth of the synoptic eddies, whereas over the BOB, the intraseasonal flows dominantly supply barotropic kinetic energy for the synoptic-scale eddies, and the contribution from climatological mean background flows is secondary.
Differences are identified for the relative contributions of OLR, relative vorticity in the low level, and specific humidity in the middle level to tropical cyclogenesis over the NIO, WNP, ENP, and NTA. The synoptic component of these three environmental parameters is the foremost over the ENP and NTA, whereas the intraseasonal component is the greatest over the NIO and WNP. In addition, the climatological mean background flows and intraseasonal flows supply barotropic kinetic energy for the growth of synoptic eddies over the NIO and the NTA, but climatological mean flows are the primary source of barotropic energy over the WNP and ENP.
Our study suggests a dominant role of the intraseasonal component of a variety of environmental parameters in NIO tropical cyclogenesis. The South Indian Ocean is another active center of TC activity. Does the intraseasonal component of environmental parameters have an essential contribution to tropical cyclogenesis over the South Indian Ocean? What are the relative contributions of different time scale background flows in the barotropic kinetic energy conversion to the growth of the synoptic eddies over the South Indian Ocean? Those issues will be studied in future work.
Author Contributions
Conceptualization, X.C. and Y.D.; methodology, X.C. and R.W.; software, X.C.; validation, Y.W. and X.L.; formal analysis, X.C.; investigation, X.C.; resources, X.C.; data curation, X.L. and M.B.; writing—original draft preparation, Y.D. and X.C.; writing—review and editing, X.C., R.W. and X.L.; visualization, X.C.; supervision, Y.D; project administration, Y.D.; funding acquisition, Y.D. All authors have read and agreed to the published version of the manuscript.
Funding
This study is supported by the Tongji Zhejiang College (Project No. JZ0719003), Open Grants of the State Key Laboratory of Severe Weather (Grant 2022LASW-B03) and State Key Laboratory of Tropical Oceanography, South China Sea Institute of Oceanology, Chinese Academy of Sciences (Project No. LTO2203), and the National Natural Science Foundation of China (Grant 41505048).
Data Availability Statement
The ERSST data were obtained from https://psl.noaa.gov/data/gridded/data.noaa.ersst.v5.html (accessed on 1 October 2022). The NOAA OLR data were obtained from https://psl.noaa.gov/data/gridded/data.interp_OLR.html (accessed on 1 October 2022). The IBTrACS data were obtained from https://www.ncei.noaa.gov/data/international-best-track-archive-for-climate-stewardship-ibtracs/v04r00/access/netcdf/ (accessed on 1 October 2022). The ERA5 dataset was obtained from https://doi.org/10.24381/cds.6860a573 (accessed on 1 October 2022).
Conflicts of Interest
The authors declare no conflict of interest.
References
- Priya, P.; Pattnaik, S.; Trivedi, D. Characteristics of the tropical cyclones over the North Indian Ocean Basins from the long-term datasets. Meteorol. Atmos. Phys. 2022, 134, 65. [Google Scholar] [CrossRef]
- Singh, V.K.; Roxy, M.K. A review of the ocean-atmosphere interactions during tropical cyclones in the north Indian Ocean. Earth Sci. Rev. 2022, 16, 103967. [Google Scholar] [CrossRef]
- Webster, P.J. Myanmar’s deadly daffodil. Nat. Geosci. 2008, 1, 488–490. [Google Scholar] [CrossRef]
- Yanase, W.; Taniguchi, H.; Satoh, M. The genesis of Tropical Cyclone Nargis (2008): Environmental modulation and numerical predictability. J. Meteor. Soc. Jpn. 2010, 88, 497–519. [Google Scholar] [CrossRef]
- Li, Z.; Yu, W.; Li, T.; Murty, V.S.N.; Tangang, F. Bimodal character of cyclone climatology in the Bay of Bengal modulated by monsoon seasonal cycle. J. Climate 2013, 26, 1033–1046. [Google Scholar] [CrossRef]
- Gray, W.M. Global view of the origin of tropical disturbances and storms. Mon. Wea. Rev. 1968, 96, 669–700. [Google Scholar] [CrossRef]
- Gray, W.M. Hurricanes: Their formation, structure and likely role in the tropical circulation. In Meteorology over the Tropical Oceans; Royal Meteorology Society: Bracknell, UK, 1979; pp. 155–218. [Google Scholar]
- Cheung, K.K.W. Large-scale environmental parameters associated with tropical cyclone formations in the western North Pacific. J. Climate 2004, 17, 466–484. [Google Scholar] [CrossRef]
- Camargo, S.J.; Emanuel, K.A.; Sobel, A.H. Use of a genesis potential index to diagnose ENSO effects on tropical cyclone genesis. J. Climate 2007, 20, 4819–4834. [Google Scholar] [CrossRef]
- Girishkumar, M.S.; Ravichandran, M. The influences of ENSO on tropical cyclone activity in the Bay of Bengal during October–December. J. Geophys. Res. Oceans. 2012, 117, C02033. [Google Scholar] [CrossRef]
- Krishnamohan, K.S.; Mohanakumar, K.; Joseph, P.V. The influence of Madden- Julian Oscillation in the genesis of North Indian Ocean tropical cyclones. Theor. Appl. Climatol. 2012, 109, 271–282. [Google Scholar] [CrossRef]
- Ng, E.K.W.; Chan, J.C.L. Interannual variations of tropical cyclone activity over the north Indian Ocean. Int. J. Climatol. 2012, 32, 819–830. [Google Scholar] [CrossRef]
- Singh, V.K.; Roxy, M.K.; Deshpande, M. Role of warm ocean conditions and the MJO in the genesis and intensification of extremely severe cyclone Fani. Sci. Rep. 2021, 11, 3607. [Google Scholar] [CrossRef]
- Felton, C.S.; Subrahmanyam, B.; Murty, V.S.N. ENSO-modulated cyclogenesis over the Bay of Bengal. J. Climate 2013, 26, 9806–9818. [Google Scholar] [CrossRef]
- Mahala, B.K.; Nayak, B.K.; Mohanty, P.K. Impacts of ENSO and IOD on tropical cyclone activity in the Bay of Bengal. Nat. Hazards 2015, 75, 1105–1125. [Google Scholar] [CrossRef]
- Bhardwaj, P.; Pattanaik, D.R.; Singh, O. Tropical cyclone activity over Bay of Bengal in relation to El Niño-Southern Oscillation. Int. J. Climatol. 2019, 39, 5452–5469. [Google Scholar] [CrossRef]
- Singh, O.P.; Ali Khan, T.M.; Rahman, M.S. Changes in the frequency of tropical cyclones over the north Indian Ocean. Meteorol. Atmos. Phys. 2000, 75, 11–20. [Google Scholar] [CrossRef]
- Madden, R.; Julian, P. Observations of the 40-50-day tropical oscillation-A review. Mon. Wea. Rev. 1994, 122, 814–837. [Google Scholar] [CrossRef]
- Liebmann, B.; Hendon, H.; Glick, D. The Relationship between Tropical Cyclones of the Western Pacific and Indian Oceans and the Madden-Julian Oscillation. J. Meteorol. Soc. Jpn. 1994, 72, 401–411. [Google Scholar] [CrossRef]
- Tsuboi, A.; Takemi, T. The interannual relationship between MJO activity and tropical cyclone genesis in the Indian Ocean. Geosci. Lett. 2014, 1, 9. [Google Scholar] [CrossRef]
- Roman-Stork, H.L.; Subrahmanyam, B. The Impact of the Madden–Julian Oscillation on Cyclone Amphan (2020) and Southwest Monsoon Onset. Remote Sens. 2020, 12, 3011. [Google Scholar] [CrossRef]
- Kuttippurath, J.; Sunanda, N.; Martin, M.V.; Chakraborty, K. Tropical storms trigger phytoplankton blooms in the deserts of north Indian Ocean. npj Clim. Atmos. Sci. 2021, 4, 11. [Google Scholar] [CrossRef]
- Bhardwaj, P.; Singh, O. Climatological characteristics of Bay of Bengal tropical cyclones: 1972–2017. Theor. Appl. Climatol. 2020, 139, 615–629. [Google Scholar] [CrossRef]
- Cao, X.; Wu, R.; Bi, M.Y. Contributions of different time scale variations to tropical cyclogenesis over the western North Pacific. J. Climate 2018, 31, 3137–3153. [Google Scholar] [CrossRef]
- Cao, X.; Wu, R.; Bi, M.Y.; Lan, X.Q.; Dai, Y.F.; Zhao, J.H. Contributions of different time scale variations to tropical cyclogenesis over the northern tropical Atlantic and comparison with the western North Pacific. J. Climate 2019, 32, 6645–6661. [Google Scholar] [CrossRef]
- Cao, X.; Wu, R.G.; Feng, J.; Zhang, X.P.; Dai, Y.F. Contrasting contributions of different time scale variations of environmental factors to tropical cyclogenesis over the eastern North Pacific. Atmos. Sci. Lett. 2021, 22, e1037. [Google Scholar] [CrossRef]
- Knapp, K.R.; Kruk, M.C.; Levinson, D.H.; Diamond, H.J.; Neumann, C.J. The International Best Track Archive for Climate Stewardship, IBTrACS. Bull. Amer. Meteor. Soc. 2010, 91, 363–376. [Google Scholar] [CrossRef]
- Liebmann, B.; Smith, C.A. Description of a complete, interpolated outgoing longwave radiation dataset. Bull. Amer. Meteorol. Soc. 1996, 77, 1275–1277. [Google Scholar]
- Hersbach, H.; Bell, B.; Berrisford, P.; Hirahara, S.; Horanyi, A.; Muñoz-Sabater, J.; Nicolas, J.; Peubey, C.; Radu, R.; Schepers, D.; et al. The ERA5 global reanalysis. Q. J. R. Meteor. Soc. 2020, 146, 1999–2049. [Google Scholar] [CrossRef]
- Huang, B.; Thorne, P.W.; Banzon, V.F.; Boyer, T.; Chepurin, G.; Lawrimore, J.H.; Menne, M.J.; Smith, T.M.; Vose, R.S.; Zhang, H.-M. Extended reconstructed sea surface temperature, version 5 (ERSSTv5): Updates, validations, and intercomparisons. J. Climate 2017, 30, 8179–8205. [Google Scholar] [CrossRef]
- Duchan, C.E. Lanczos filtering in one and two dimensions. J. Appl. Meteor. 1979, 18, 1016–1022. [Google Scholar] [CrossRef]
- Maloney, E.D.; Hartmann, D.L. The Madden-Julian oscillation, barotropic dynamics, and north Pacific tropical cyclone formation. Part I: Observations. J. Atmos. Sci. 2001, 58, 2545–2558. [Google Scholar] [CrossRef]
- Cao, X.; Wu, R. Comparison of different time scale contributions to tropical cyclone genesis over the western North Pacific in 2015 and 2016. J. Meteor. Soc. Jpn. 2018, 96, 317–336. [Google Scholar] [CrossRef]
- Dube, S.K.; Rao, A.D.; Sinha, P.C.; Murty, T.S.; Bahulayan, N. Storm surge in the Bay of Bengal and Arabian Sea the problem and its prediction. Mausam 1997, 48, 283–304. [Google Scholar] [CrossRef]
- Sahoo, B.; Bhaskaran, P.K. Assessment on historical cyclone tracks in the Bay of Bengal, east coast of India. Int. J. Climatol. 2016, 36, 95–109. [Google Scholar] [CrossRef]
- DeMaria, M. The effect of vertical shear on tropical cyclone intensity change. J. Atmos. Sci. 1996, 53, 2076–2087. [Google Scholar] [CrossRef]
- Bi, M.Y.; Li, T.; Shen, X.Y.; Peng, M.; Shen, X.Y.; Peng, M. To what extent the presence of real-strength tropical cyclones influences the estimation of atmospheric intraseasonal oscillation intensity? Atmos. Sci. Lett. 2015, 16, 438–444. [Google Scholar] [CrossRef]
- Kurihara, Y.; Bender, M.A.; Tuleya, R.E.; Ross, R.J. Improvements in the GFDL hurricane prediction system. Mon. Wea. Rev. 1995, 123, 2791–2801. [Google Scholar] [CrossRef]
- Bhardwaj, P.; Singh, O.; Pattanaik, R.D.; Klotzbach, P.J. Modulation of bay of bengal tropical cyclone activity by the madden-julian oscillation. Atmos. Res. 2019, 229, 23–38. [Google Scholar] [CrossRef]
- Burpee, R.W. The origin and structure of easterly waves in the lower troposphere of North Africa. J. Atmos. Sci. 1972, 29, 77–90. [Google Scholar] [CrossRef]
- Russell, J.O.; Aiyyer, A.; White, J.D.; Hannah, W. Revisiting the connection between African easterly waves and Atlantic tropical cyclogenesis. Geophys. Res. Lett. 2017, 44, 587–595. [Google Scholar] [CrossRef]
Disclaimer/Publisher’s Note: The statements, opinions and data contained in all publications are solely those of the individual author(s) and contributor(s) and not of MDPI and/or the editor(s). MDPI and/or the editor(s) disclaim responsibility for any injury to people or property resulting from any ideas, methods, instructions or products referred to in the content. |
© 2023 by the authors. Licensee MDPI, Basel, Switzerland. This article is an open access article distributed under the terms and conditions of the Creative Commons Attribution (CC BY) license (https://creativecommons.org/licenses/by/4.0/).