Article

The Ionospheric Plasma Perturbations before a Sequence of Strong Earthquakes in Southeast Asia and Northern Oceania in 2018

1
National Institute of Natural Hazards, Ministry of Emergency Management of China, Beijing 100085, China
2
National Space Science Center, Chinese Academy of Sciences, Beijing 100190, China
*
Author to whom correspondence should be addressed.
Remote Sens. 2023, 15(24), 5735; https://doi.org/10.3390/rs15245735
Submission received: 31 October 2023 / Revised: 9 December 2023 / Accepted: 11 December 2023 / Published: 15 December 2023

Abstract

:
From August to October 2018, a series of strong earthquake (EQ) events occurred in southeast Asia and northern Oceania (22°S to 0°N, 115°E to 170°E) within 50 days. In this paper, we analyze the features of ionospheric plasma perturbations, recorded by the Plasma Analyzer Package (PAP) and Langmuir probe (LAP) onboard the China Seismo-Electromagnetic Satellite (CSES-01), before four EQs with magnitudes of Ms 6.9 to Ms 7.4. The ion parameters such as the oxygen ion density (No+), the ion drift velocity in the vertical direction (Vz) under the conditions of geomagnetic storms, and strong EQs are compared. The results show that within 1 to 15 days before the strong EQs, the No+ and the electron density (Ne) increased while the electron temperature (Te) decreased synchronously. Meanwhile, the Vz significantly increased along the ground-to-space direction. The relative variation of No+ and Vz before the strong EQs is more prominent, and the Vz is not easily influenced by the geomagnetic storm but is susceptible to the seismic activities. Our results suggest that the anomaly of ionospheric plasma perturbations occurring in this area is possibly related to the pre-EQ signatures.

1. Introduction

An earthquake (EQ) is one of the most destructive natural disasters, and discerning seismic precursors has been one of the most challenging topics for scientists in the last few decades. With the rapid development of aerospace technology, the Low Earth Orbit (LEO) satellite in the upper ionosphere provides unique opportunities to identify possible pre-EQ anomalies. Many researchers have confirmed the disturbances of the electromagnetic field and plasma parameters appearing before some large EQs [1,2,3,4,5,6,7].
The Detection of Electro-Magnetic Emissions Transmitted from Earthquake Regions (DEMETER), which was the first satellite in the world dedicated to studying seismic ionospheric effects, was launched by France in 2004 on a sun-synchronous orbit at ~710 km altitude. The DEMETER satellite was designed to detect and characterize the ionosphere‘s electromagnetic fields, plasma parameters, and energetic particles [8,9]. Later, the Swarm satellite constellation was launched by the European Space Agency in 2013 to accurately measure the different magnetic signals that arise from the Earth’s core, crust, and the environment around the Earth [5,10].
Liu et al. [11] examined variations of ionospheric foF2, recorded by the Chung-Li ionosonde before M ≥ 6.0 EQs in Taiwan from 1994 to 1999, to understand seismo-ionospheric precursor signatures. Ouyang et al. [12] analyzed the disturbance of oxygen ion density detected by the DEMETER satellite before the Ms 7.9 Tonga Islands EQ in 2006. Piersanti et al. [13] analyzed the Bayan Mw 6.9 EQ, which occurred in 2018, using ground and satellite data, and they built a new lithospheric–atmospheric–ionospheric–magnetospheric coupling model to analyze the anomalous observations before and at the moment of the EQ occurrence.
In recent years, the China Seismo-Electromagnetic Satellite (CSES-01), which is also called ZHANGHENG-1, was launched on 2 February 2018, on a sun-synchronous orbit at an altitude of ~507 km with a high orbital inclination of 97.4° and a recursive period of 5 days. The ascending/descending node local time (LT) is fixed at 2:00/14:00, respectively. The main scientific objectives of CSES-01 are to detect the electromagnetic field/waves, ionospheric plasma, and charged particles intended to survey the space environment and the ionospheric disturbances that may be associated with destructive EQs, volcano explosions, tsunamis, and space weather anomalies, and to analyze the Lithosphere-Atmosphere-Ionosphere (LAI) coupling mechanism [14]. In addition, China and Italy are jointly building the second one, i.e., CSES-02, which will be launched in 2024. CSES-02 will also provide almost the same physical field parameters as CSES-01 but with numerous specific optimizations based on CSES-01’s in-orbit performance.
Using the CSES-01 data, the pre-EQ ionospheric anomalies have already been widely studied. Li et al. [15] statistically analyzed the seismo-ionospheric effects of electron density and oxygen ion density detected by the DEMETER and CSES-01 satellites. They suggested that the CSES-01 could effectively detect ionospheric disturbances during strong EQs, as the DEMETER satellite does. Liu et al. [14] reported the simultaneous disturbances of ion drift velocity and oxygen ion density recorded by the orbit closest to the epicenter five days before the Venezuelan Ms 7.3 EQ in 2018. Li et al. [16] analyzed possible perturbations in the electric field detected by CSES-01 before the Mw 7.7 Caribbean Sea EQ occurred in 2020. Song et al. [17] reported the possible plasma disturbance characteristic before four shallow-focus EQs in Indonesia were detected by CSES-01 in 2018.
More recently, Zeren et al. [18] put forward the routine data preprocessing and seismo-ionospheric information extraction methods by using CSES-01 data and other multi-source data and provided the results of the possible seismo-ionospheric anomalies that appeared during the Ms ≥ 7 shallow EQs recorded by CSES-01. Liu et al. [19] analyzed the seismo-ionospheric electron density disturbances observed by CSES-01 through a spatial analysis method.
These new scientific research results bring hope for a breakthrough in EQ forecasting. However, due to the insufficient amount of experimental evidence supporting those theories, there are also some debates on the possibility of seismo-ionospheric precursors; thus, the existence of ionospheric perturbations before EQs is controversial [9,13,20]. One of the main challenges for seeking seismic precursors from the ionosphere is that strong EQ events happen so occasionally around the globe, and there is a large time period and space among them, so it is difficult to compare and summarize the regularity and relevance of EQ precursors.
From August to October 2018, a series of strong EQ events occurred in southeast Asia and northern Oceania (22°S to 0°N, 115°E to 170°E), providing a rare opportunity for EQ precursor research. In this study, we analyze the characteristics of ionospheric plasma perturbations before four strong EQs with magnitudes equal to or larger than Ms 6.9 occurred during this period by using the observations from the Plasma Analyzer Package (PAP) and Langmuir Probe (LAP) onboard CSES-01. Our findings support the possibility of using in-situ plasma observation results from the LEO satellite to examine EQ precursor signatures in the ionosphere.

2. Data and Methods

2.1. Seismic Data

According to the China Earthquake Networks Center (CENC) and the United States Geological Survey (USGS), four strong EQ events with magnitudes Ms 6.9 to Ms 7.4 occurred in southeast Asia and northern Oceania from August to October 2018. The detailed information is described in Table 1 and Figure 1. These strong EQs happened in the adjacent areas—south of the circum-Pacific seismic belt—within 50 days, and the focal depths are all between 17 km and 39 km.
Among them, two EQs happened in the Loyalty Islands, and southeast of the Loyalty Islands are less than 100 km away. The Indonesia Ms 7.4 EQ and the Papua New Guinea Ms 7.1 EQ occurred at similar latitudes, with a distance of less than 5.5° in latitude. Similar occurrence characteristics provide an excellent research opportunity for studying EQ precursors.

2.2. CSES-01 Satellite Data

The CSES-01 satellite was specially developed to detect the abnormal ionospheric disturbances associated with strong seismic activities. It has eight types of scientific payloads that can observe the ionospheric background environment and perturbations in the electromagnetic waves and field, plasma, and high-energy particles. Among them, the PAP and LAP were designed to obtain plasma parameters (ion and electron properties) through in-situ detection. The PAP provides ion density (Ni, including hydrogen ion, helium ion, and oxygen ion), ion temperature, and ion drift velocity (Vi). LAP data provides electron density (Ne) and electron temperature (Te), respectively. They have a large measurement range that covers the plasma change at ~507 km altitude and high accuracy to discern weak abnormal information. The measurement range of Ni and Ne is 5 × 10⁸–1 × 10¹³ m−3, and Te is 500 K–10,000 K, with a relative accuracy of 10%. The measurement range of Vi is −3000–+3000 m/s, with a relative accuracy of 20 m/s [14,18].
The PAP and LAP onboard CSES-01 operate between latitudes of ±65 °, providing 30 or 31 sets of ascending and descending half-orbit data files in the Hierarchical Data Format (HDF) format every day. The PAP samples every 1 s in the whole observation area, while the LAP samples every 1.5 s above China and the main seismic belt around the world, and samples every 3 s in other regions [14,18]. In this research, we processed the Level 2 standard data of PAP and LAP, which are calibrated physical data with geographic coordinates and time information.
It should be noted that the PAP was contaminated after launch, leading to lower absolute values of Ni and larger Vi than the expected ones in the orbit position. After a lot of in-flight commissioning tests and simulation analysis, it was considered that this phenomenon was due to the decrease in the sensitivity of the sensors caused by the contamination layers on the surface of the PAP’s sensors. Due to the problems with the absolute values, the PAP data have not been widely studied yet [14].
Nonetheless, the calibration works and some observation results showed that the state of the contaminated layers on the sensors did not change apparently in 2018, therefore, the relative variations of Ni and Vi were stable in a short time, which had the capability of describing the ionospheric anomaly information. Liu et al. [14] discussed the reliability and application of PAP data in 2018 based on the distribution characteristics of ion parameters around the magnetic equator and the observations of ionospheric disturbance phenomena induced by natural sources (e.g., strong EQ and geomagnetic storms) and artificial sources (e.g., ground-based powerful VLF transmitters), which indicated the reliability of the relative variation of PAP data. Yang et al. [21] reported significant ionospheric responses to the intense geomagnetic storm event on 25 August 2018, using observations from PAP and the other payloads onboard CSES-01. After the comprehensive analysis, we suggested that the oxygen ion density (No+) and ion drift velocity in the vertical direction (Vz) of PAP in 2018 are reliable when studying the relative variations in a short time (not exceeding one month).
Meanwhile, the LAP data are considered to have good performance based on comparison with the Swarm constellation and ground-based observations [18]. Li et al. [15] made a preliminary statistical analysis of the seismic information on ionospheric plasma parameters detected by CSES-01 from August 2018 to November 2019. The results show that the CSES-01 can effectively record strong EQ precursors, and No+ seems more sensitive to seismic activities than Ne. This viewpoint needs further investigation with more observation data.
In this study, we mainly used No+, Vz, Ne, and Te to analyze strong EQ precursor anomalies.

2.3. Geomagnetic and Solar Conditions Data

The space weather condition from August to October 2018 is shown in Figure 2, including the 10.7 cm solar radio flux index (F10.7), the Dst, and the Kp index. The red vertical lines represent the times of four strong EQs.
The Dst and Kp indexes indicate that intense solar activities and geomagnetic perturbations occurred from 26–27 August, 10–11 September, 22 September, and 7–10 October. They provide us with opportunities to compare the differential performances of ionospheric disturbances caused by intense magnetic storms and strong EQs.
Furthermore, some researchers proposed that an increase in solar activity could also trigger EQ occurrence [22], and this could be the case, for example, for the first EQ of 29 August 2018, but the study of a possible influence of solar activity on the seismicity is beyond the scope of this study.

2.4. Method

It is widely known that the ionospheric environment is easily influenced by a geomagnetic storm that mainly originates from solar activity. Thus, the relatively weak seismic precursors could be submerged by such powerful space weather disturbances [18,21]. Therefore, it is necessary to check the space weather conditions before looking for eventual seismic information. The satellite data recorded under the geomagnetic indexes Kp exceeded 3 or the Dst index lower than −30 nT were carefully examined to minimize the anomalous interference likely excited by strong geomagnetic activity. Moreover, the observation results affected by the satellite control experiments were also excluded, according to the satellite platform’s data quality flags and information.
Based on previous studies [23], the orbits from the CSES-01 flying over the epicenters ±10° in longitude and latitude were chosen about 30 days before the EQs occurrence in these cases, as presented in Figure 3. Among these data, only those from ascending orbits (the satellite passed through the study areas around LT 2:00 a.m.) were used in this research, considering that the ionospheric environment of descending orbits (in the daytime) was strongly affected by the variations of the solar radiation [18].
According to long-term data processing and previous analysis results, plasma values vary significantly in different regions, while the disturbance caused by the EQ is relatively small [20]. In addition, considering there is only one satellite, its observation ability is limited in spatial and time resolutions, considering the distance between adjacent tracks in one day is about 2600 km. Therefore, it is not recommended to analyze the seismo-ionospheric disturbances in large areas, which may mix with other disturbance phenomena induced by other factors. In this research, we have monitored the critical areas for a long time, checked the relative abnormal changes of multiple plasma parameters through the revisiting orbit quartile analysis method, and then extracted the seismic anomalies.
Furthermore, considering that there are numerical deviations in the absolute values of No+ and Vz and their relative variations were reliable, we did not use their absolute values directly in the analysis in Section 3, but normalized them, i.e., firstly, we calculated the maximum values of No+ and Vz in the region of the latitude range shown in the figures, and then divided the observations by the maximum values in order to obtain their relative change states. In this way, we will focus on their relative variations during the seismic anomaly analysis process rather than their absolute values. Moreover, we compared the simultaneous variations of multiple parameters, such as No+, Vz, Ne, Te, and electric field waveform, to ensure the accuracy of seismic anomaly information extraction.

3. Results

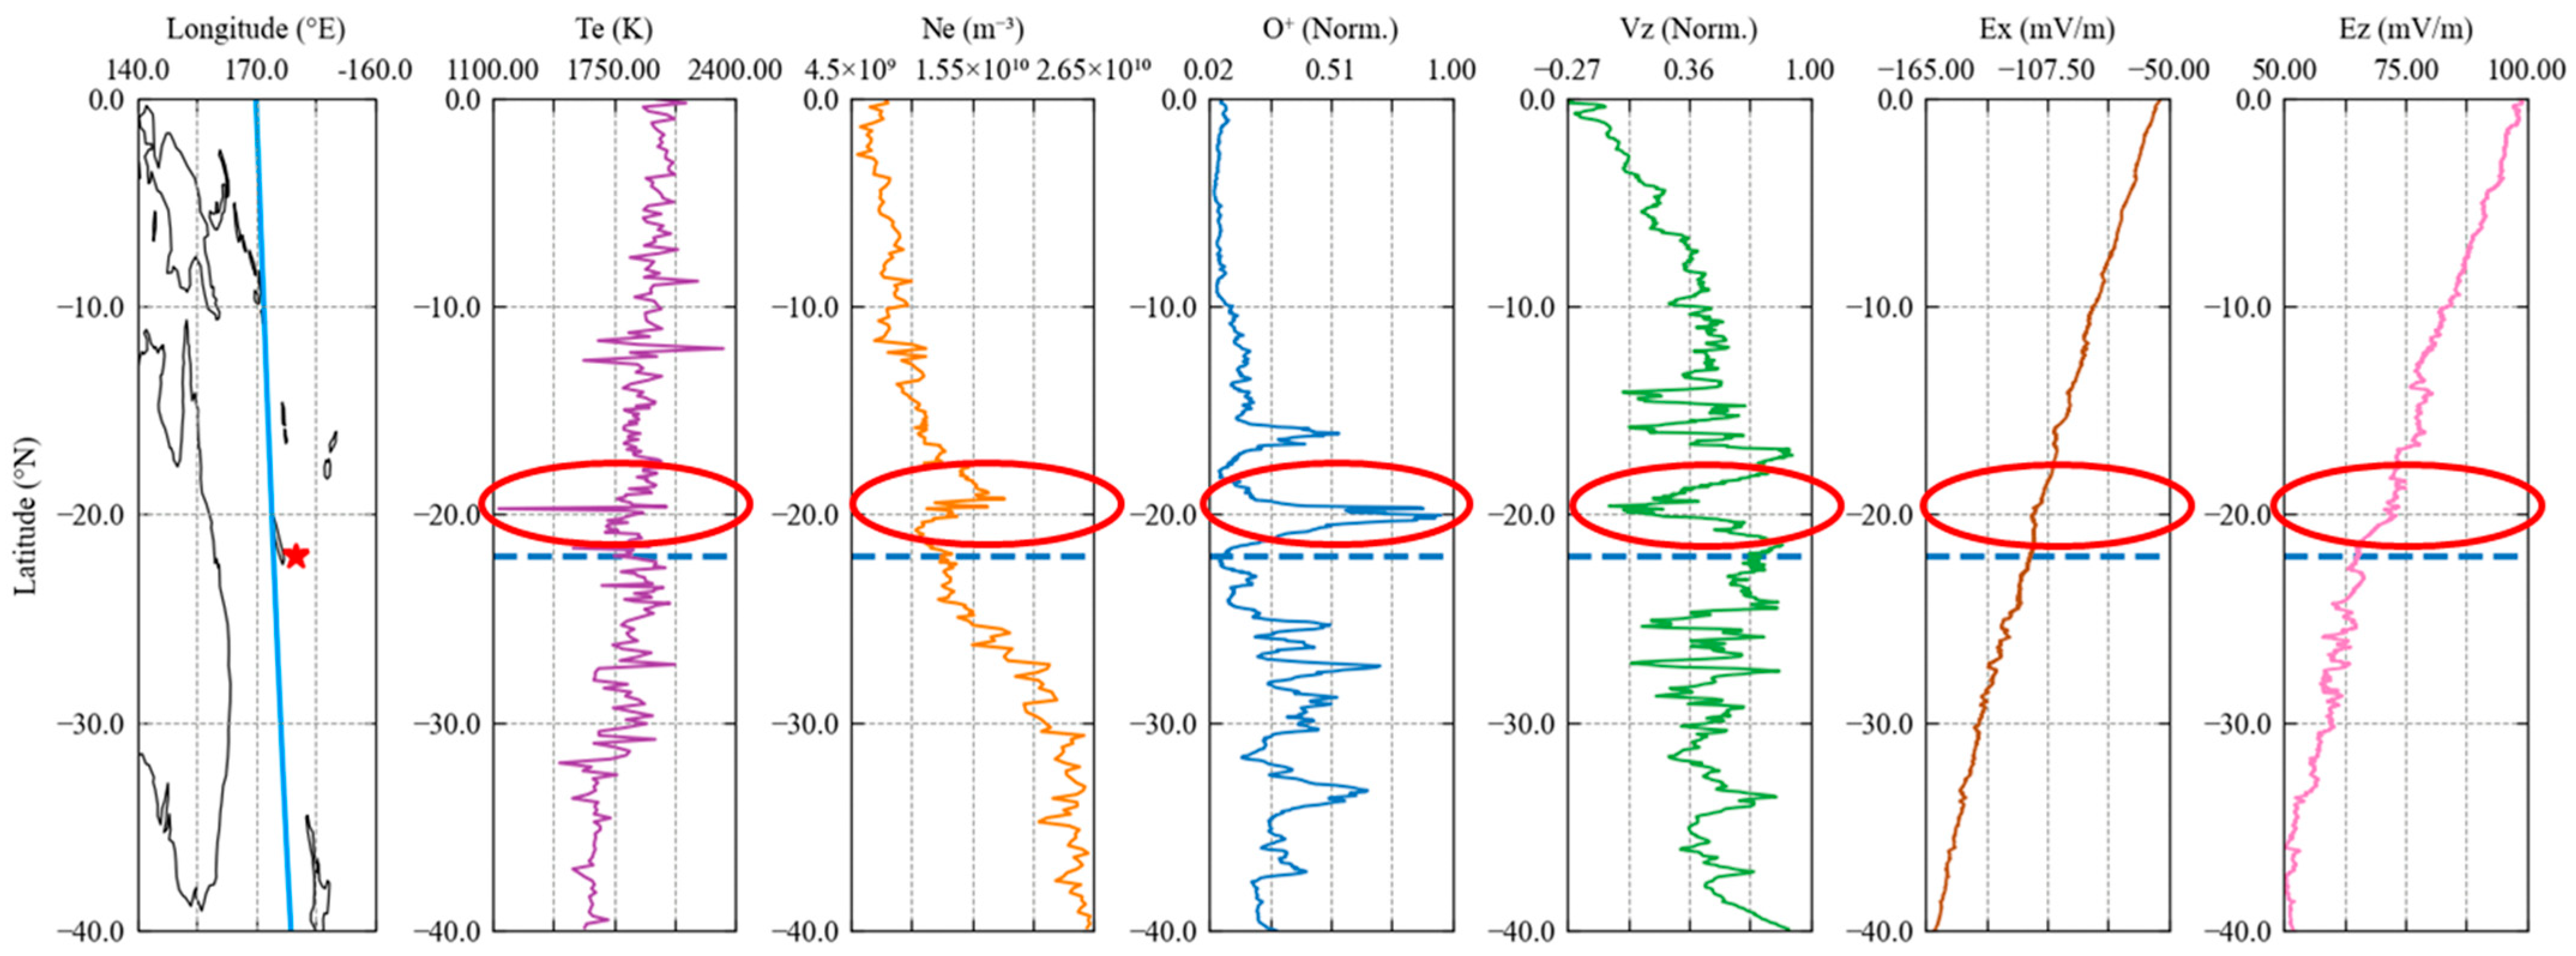
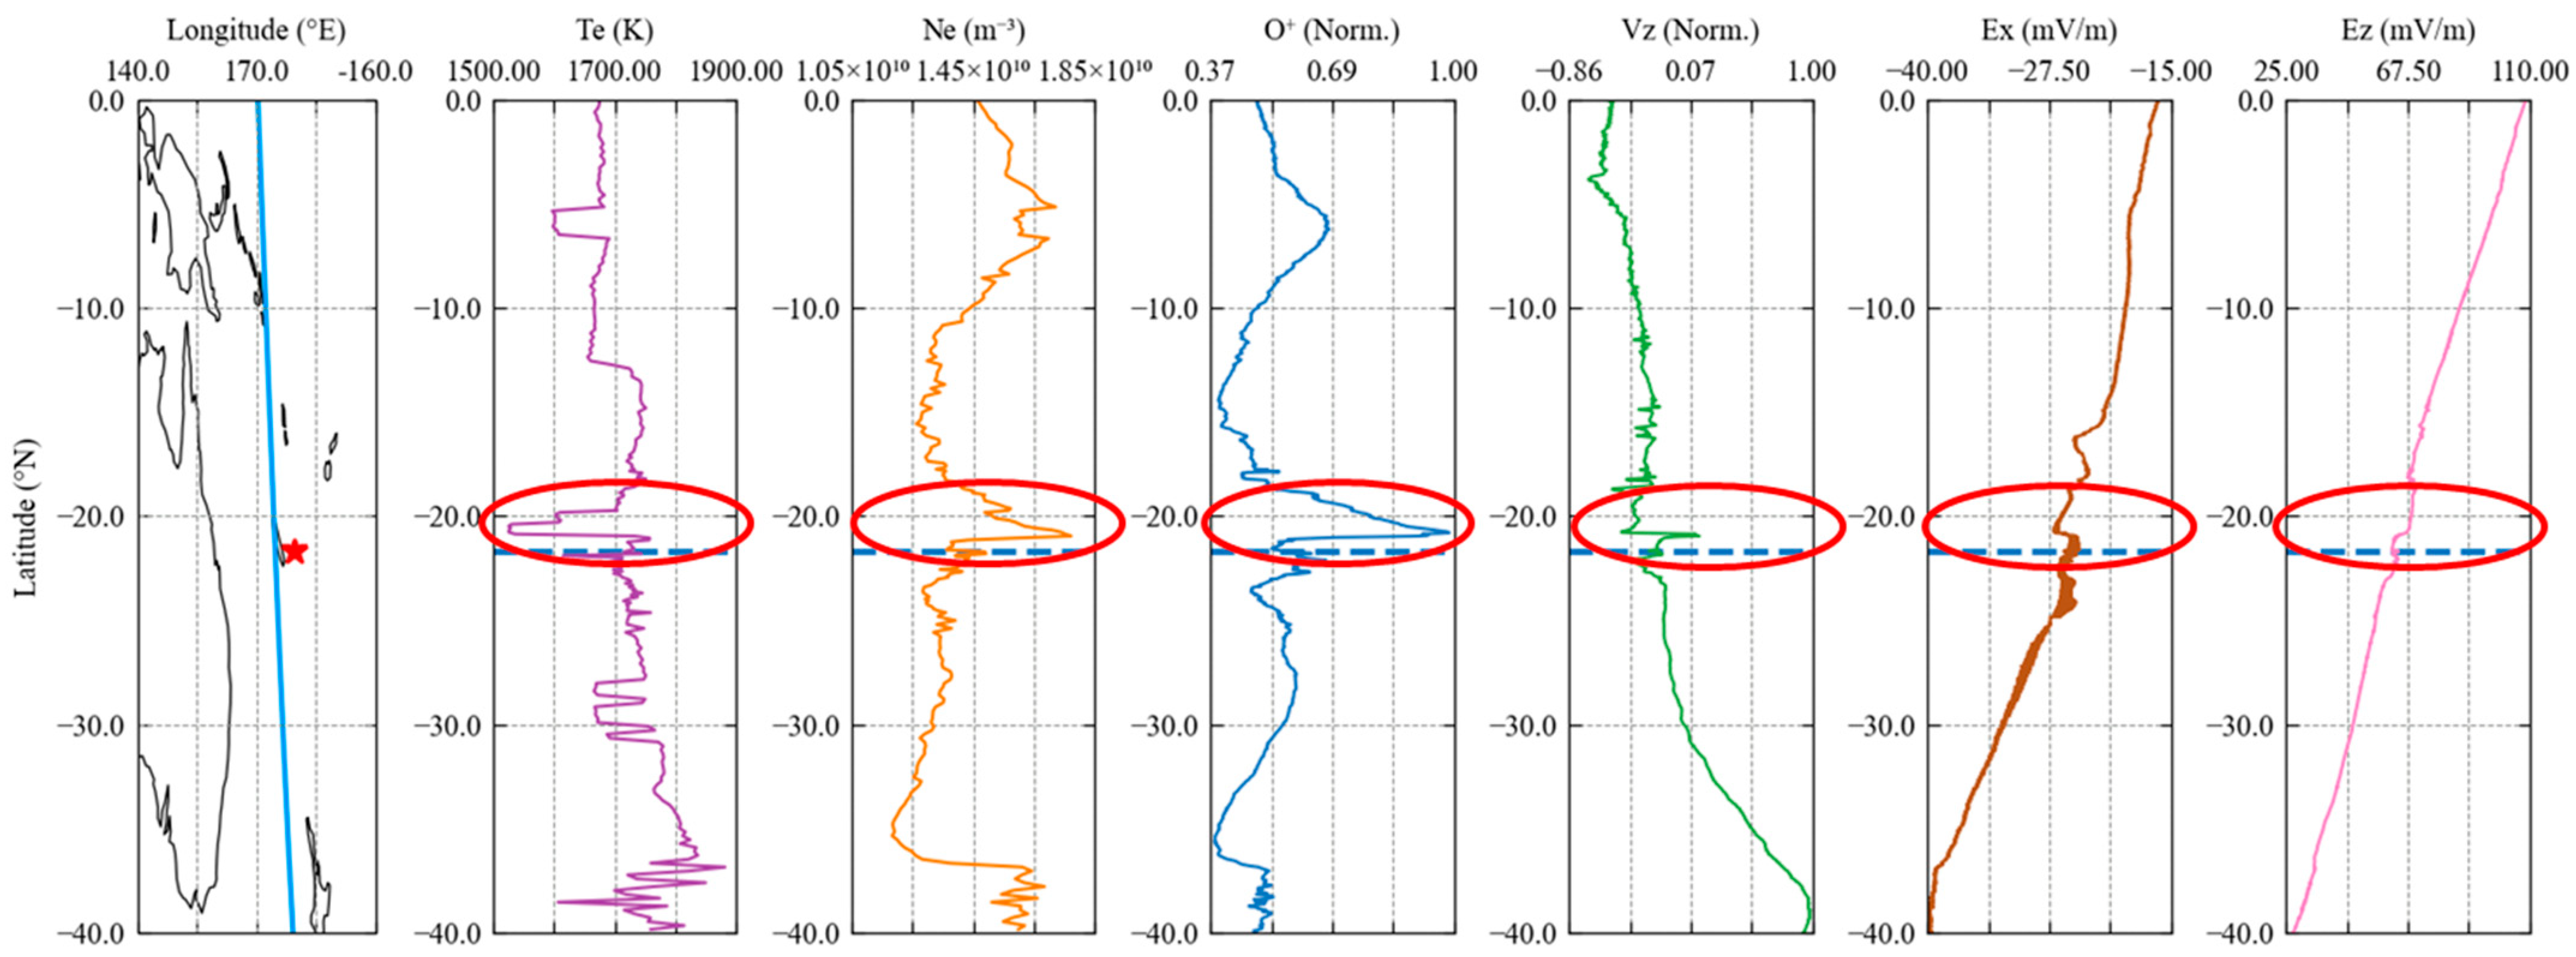
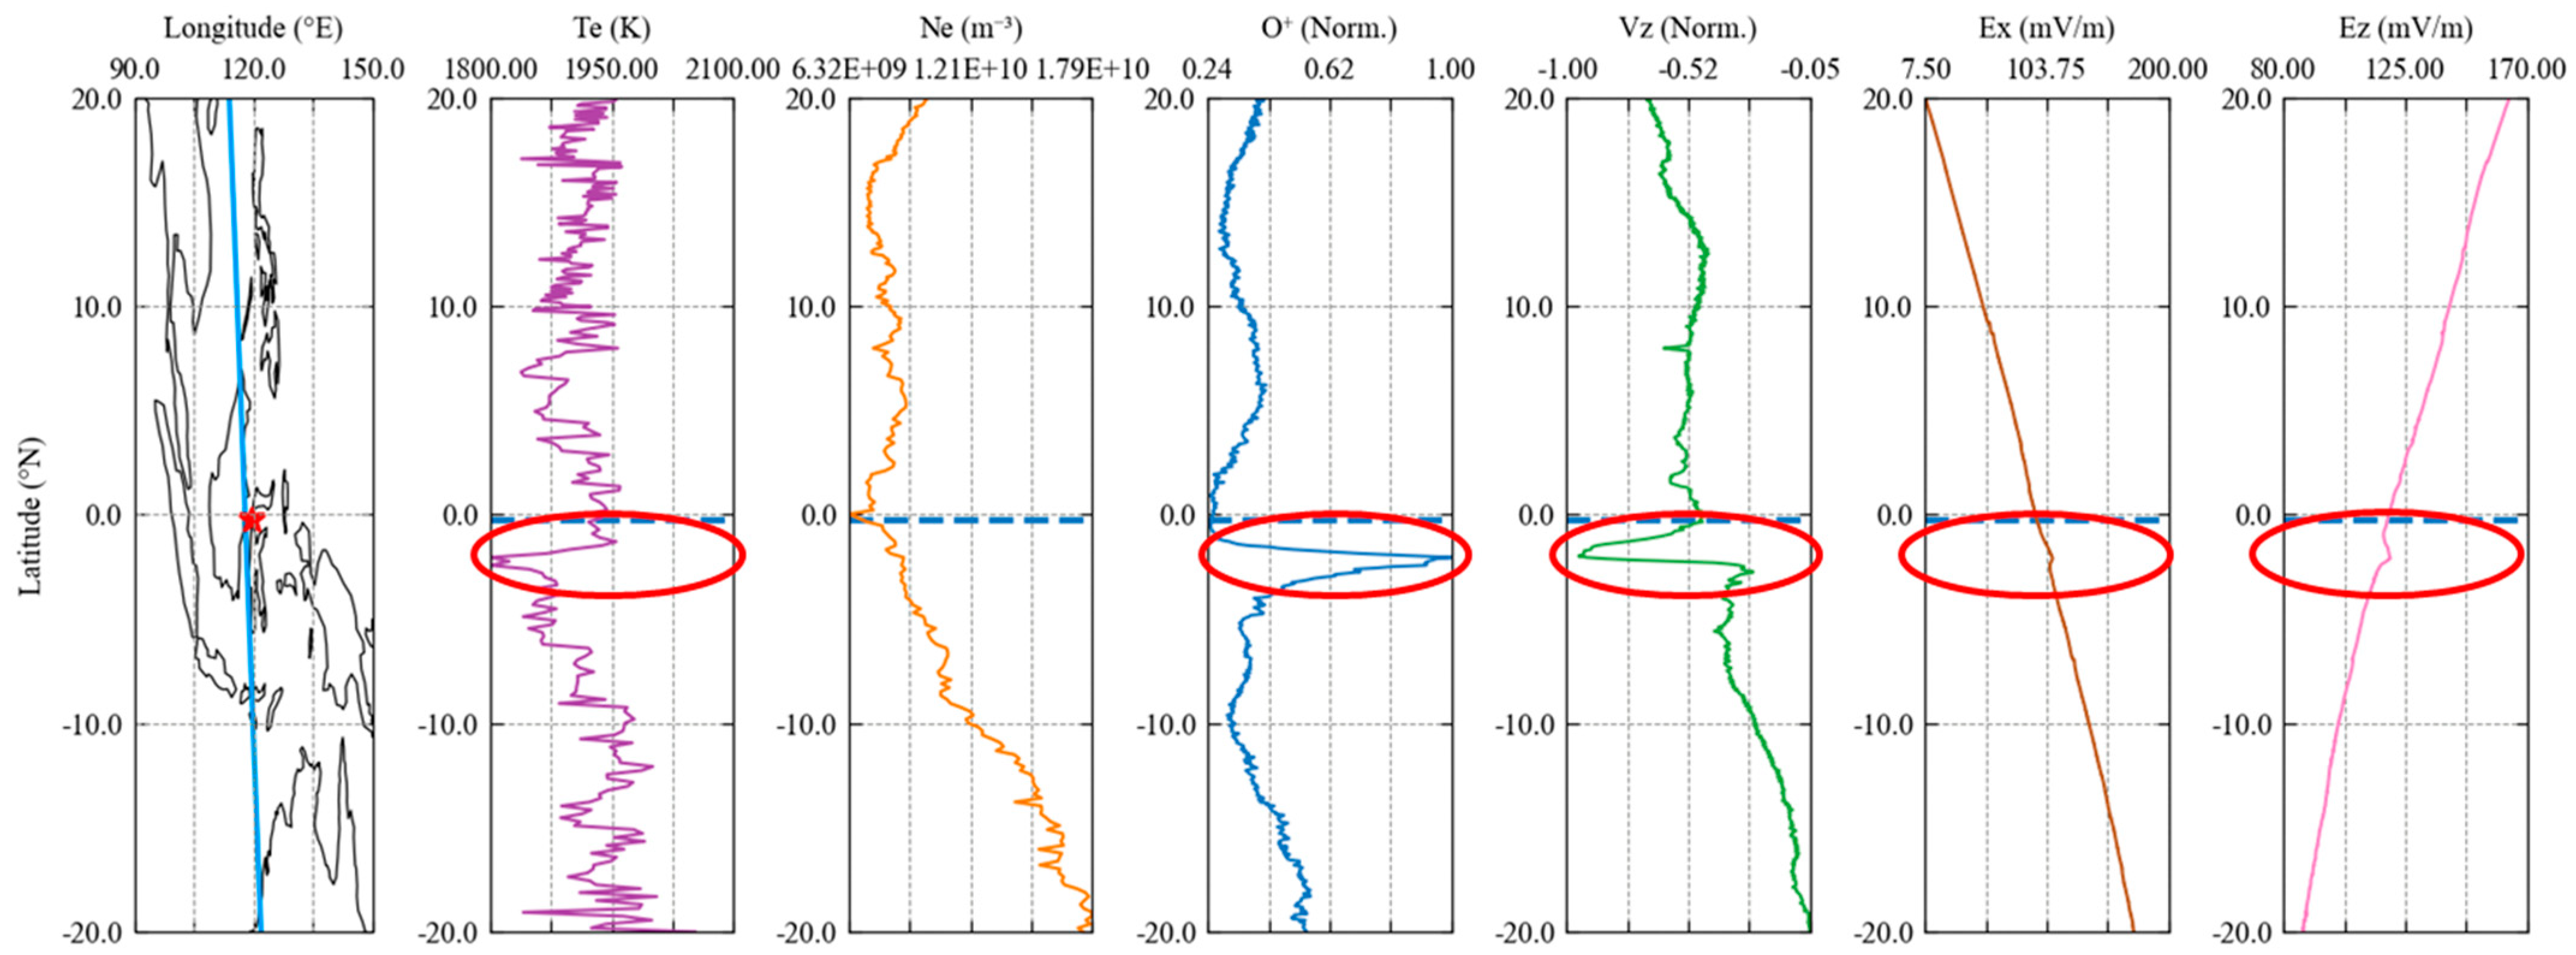
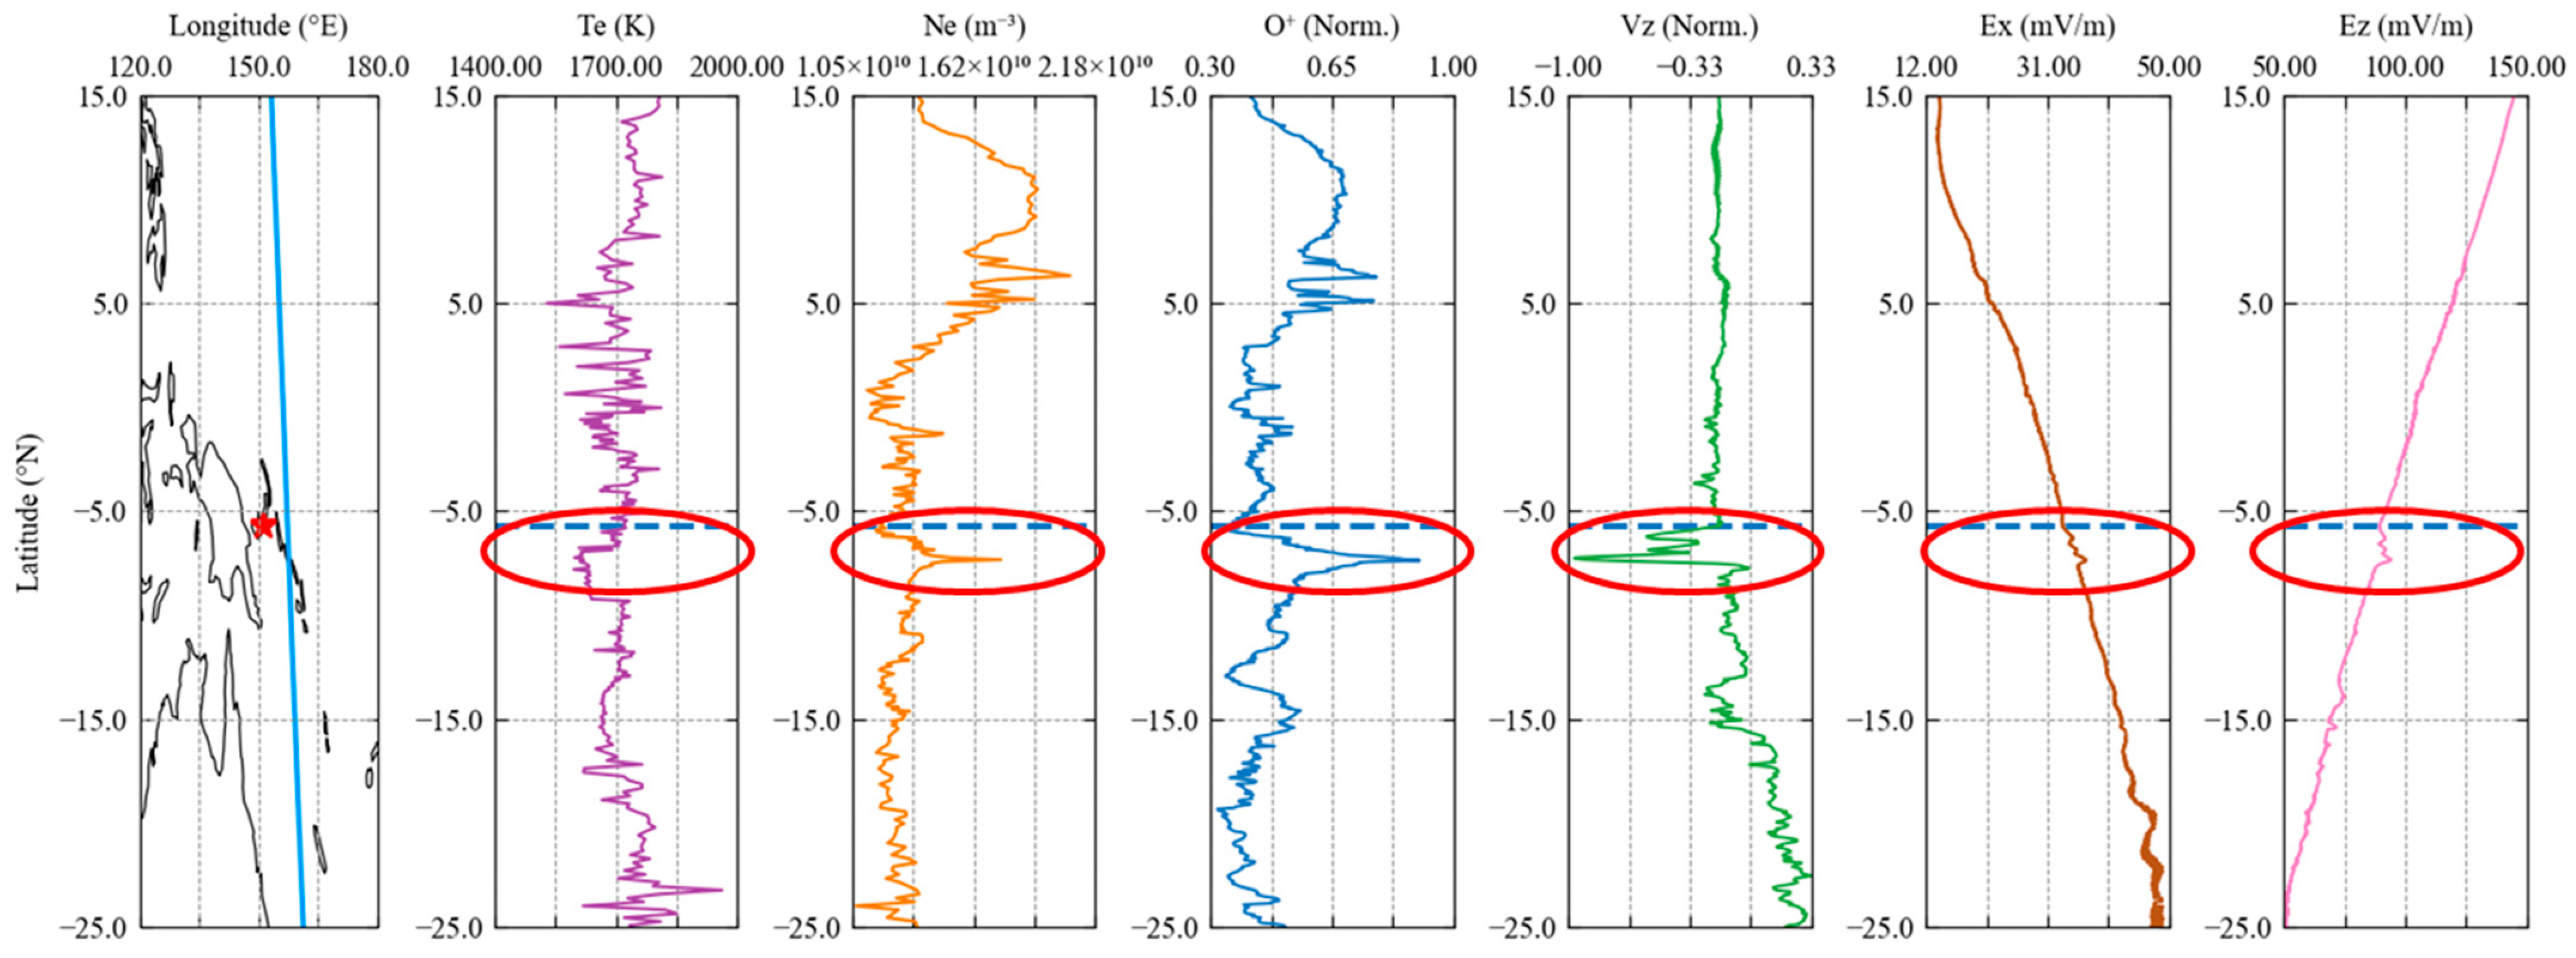
3.1. Single-Orbit Analysis

The physical data of PAP and LAP around the epicenters within ±10° in longitude, a period of about 30 days before the main shocks, were selected to be arranged as a time sequence to check the apparent disturbance variations that may be induced by seismic activity. To keep the original abnormal information, the data used in the time series analysis was not smoothed or interpolated.
As shown in Figure 1 and Table 1, the epicenter locations of the Loyalty Islands (Ms 7.1 EQ) and the southeast of the Loyalty Islands (Ms 6.9 EQ) are very close. The occurrence time interval is very short—only about 50 days. Therefore, we think that the EQ preparation conditions are similar, allowing us to compare their common characteristics of pre-EQ ionospheric anomalies. In addition, the latitude distance between the Indonesia Ms 7.4 EQ and the Papua New Guinea Ms 7.1 EQ is only 5.5°, while their occurrence time interval is within 15 days, so we also have ideal conditions to carry out a comparison of common features.
It is worth noting in Figure 4 that the profile of orbit 2939_1 on 14 August 2018, 15 days before the Loyalty Island Ms 7.1 EQ, is different from other curves, with significant synchronous variation in the area ~200–550 km northwest of the epicenter. The values of Ne and No+ increased (Te decreased) evidently, and Vz, which is vertical ion drift velocity, and positive (negative) values indicate downward (upward), increased strongly along the path of ground-to-space simultaneously, exhibiting the consistency of the plasma multi-parameter anomaly characteristics. Based on those reported by previous studies, before the EQ, the Ne and Te in the ionosphere displayed a negative correlation change, and the relative variations of Ne and Ni at a height of ~500 km were similar, being consistent with our observations. With the increase of Ne and Ni, the coulombic and elastic collisions of electrons and ions increase, and thermal energy is converted into kinetic energy to compensate for the lost energy, resulting in the decrease of Te. Among them, the relative variation of No+ and Vz is more prominent, and the spatial range of the perturbation is ~350 km. After leaving the EQ abnormal area, these parameters returned to their original state.
Figure 5 presents the abnormal perturbation phenomenon recorded by orbit 3775_1 on 8 October 2018, 8 days before the southeast of Loyalty Islands Ms 6.9 EQ, which is very similar to the one shown in Figure 4. In the area just ~100 km northwest of the epicenter, the Te, Ne, No+, and Vz data show evident synchronous variations. The regional extension of the perturbation was also very similar, covering about 350 km. The difference from Figure 4 is that the northward shift distance of the disturbed area is shortened by ~100 km compared with the epicentral latitude, and the disturbance variations of the Te, Ne, No+, and Vz are more prominent. Among them, the intensity of No+ in orbit 3775_1 is about five times higher than the one in orbit 2939_1. After investigation, we identified that the phenomenon could be due to the moderate magnetic storm that happened on 8 October, which led to the overall significant increase of No+, while the order of magnitude of electron parameters did not change significantly. Despite this, the variation is spatially coincident with the incoming EQs, so a possible interaction with the seismo-induced phenomenon could not be excluded, even if it is more plausible than the external perturbation source.
In this study, we analyzed the electric field data recorded by the Electric Field Detector (EFD) onboard the CSES-01 to determine the possible driving sources of plasma perturbations. The electric field data use the geographic coordinate system (+X indicates the direction that the center of the earth points to the prime meridian along the equatorial plane, and +Z indicates the direction that the center of the earth points to the North Pole) [24]. As presented in Figure 4 and Figure 5, there were disturbances in the vertical direction of the Ultra Low Frequency band (ULF; the range is 0.5–16 Hz, with a resolution of 1 μV/m) waveform of the EQs’ anomalous orbits, which were completely synchronized with the plasma perturbations at the same positions.
Figure 6 and Figure 7 show the simultaneous perturbation of multiple plasma parameters recorded in orbits 3458_1 on 17 September 2018, 11 days before the Ms 7.4 Indonesia EQ, and orbit 3806_1 on 10 October 2018, 1 day before the Ms 7.1 Papua New Guinea EQ, which have similar characteristics as Figure 4 and Figure 5. Certain synchronous variations in Te, Ne, No+, Vz, Ex, and Ez data above the area of ~100 km southeast of the epicenter are discernible. On other days, no clear perturbations are shown. Among them, the relative variation characteristics of No+ and Vz are the most significant plasma, compared to the relative smoothy feature of Te and Ne values in this area. A noticeable difference between Figure 4 and Figure 5 is that the locations of the disturbances in these two EQs occurred south of the epicenters. At the same time, the two Loyalty Islands EQs appeared in the north of the epicenters. The different geomagnetic latitudes of these EQs, as shown in Figure 1, could explain this apparent discrepancy, even if they were all in the same geomagnetic southern hemisphere.

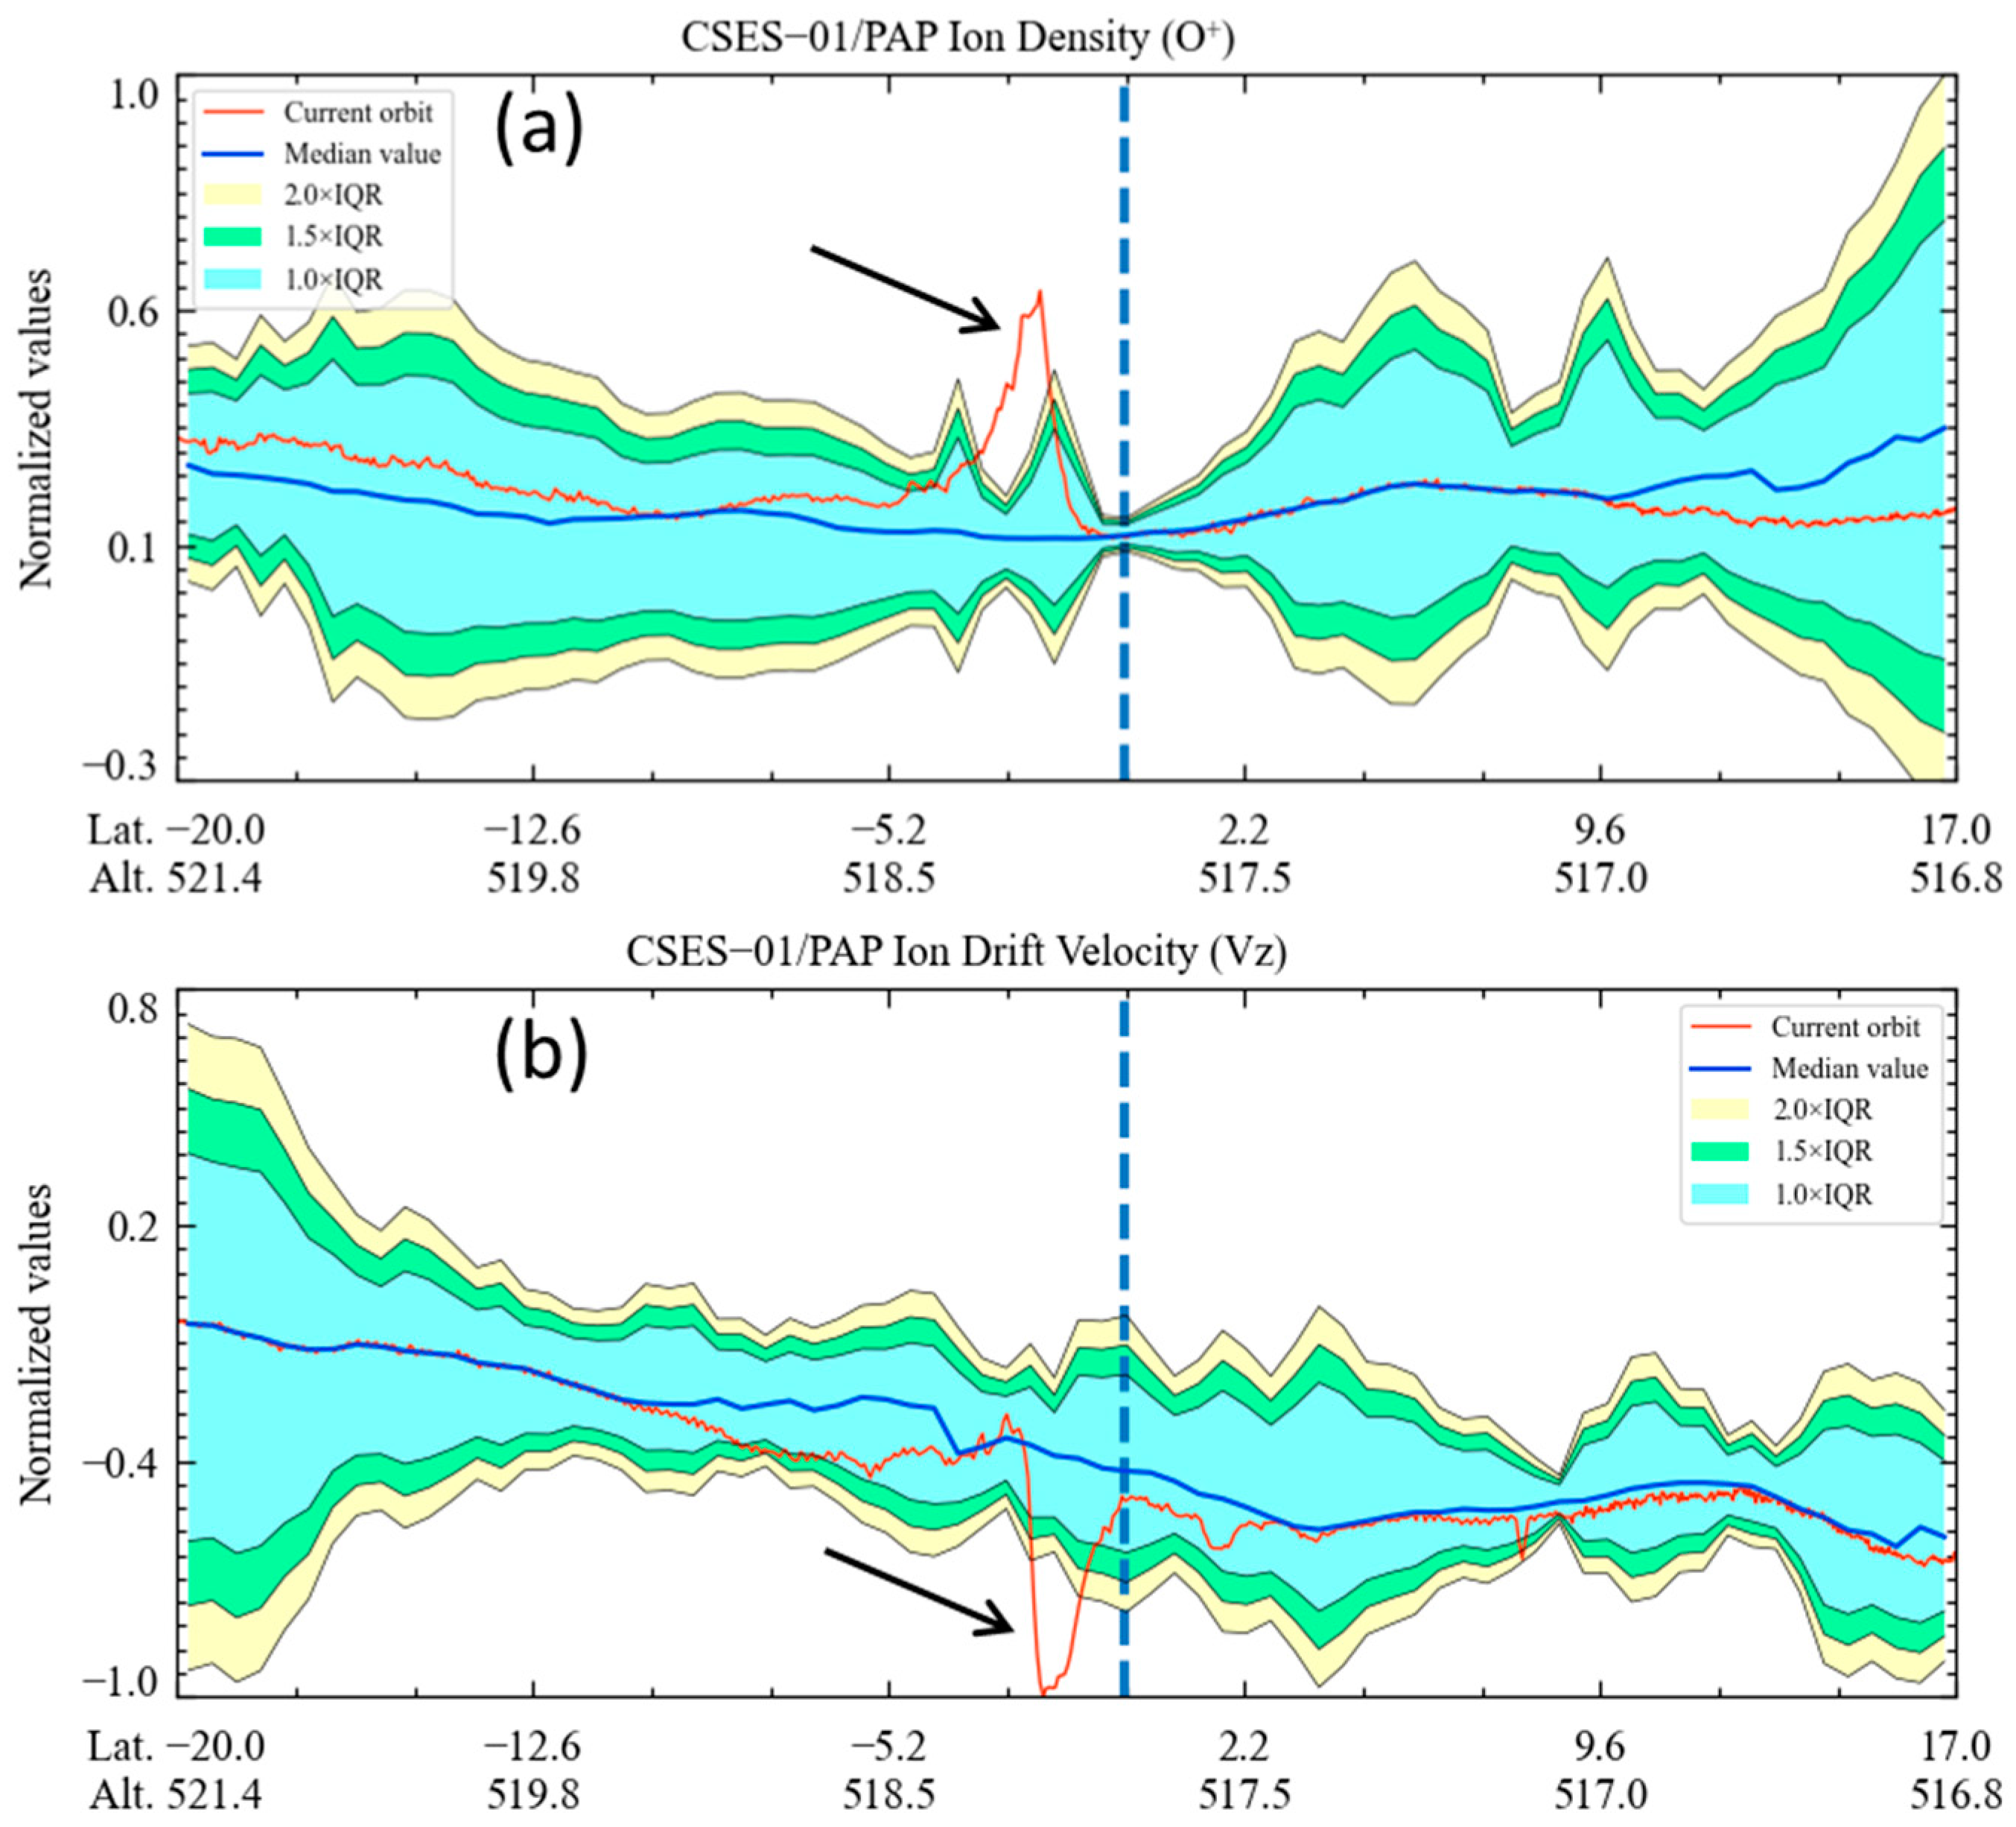
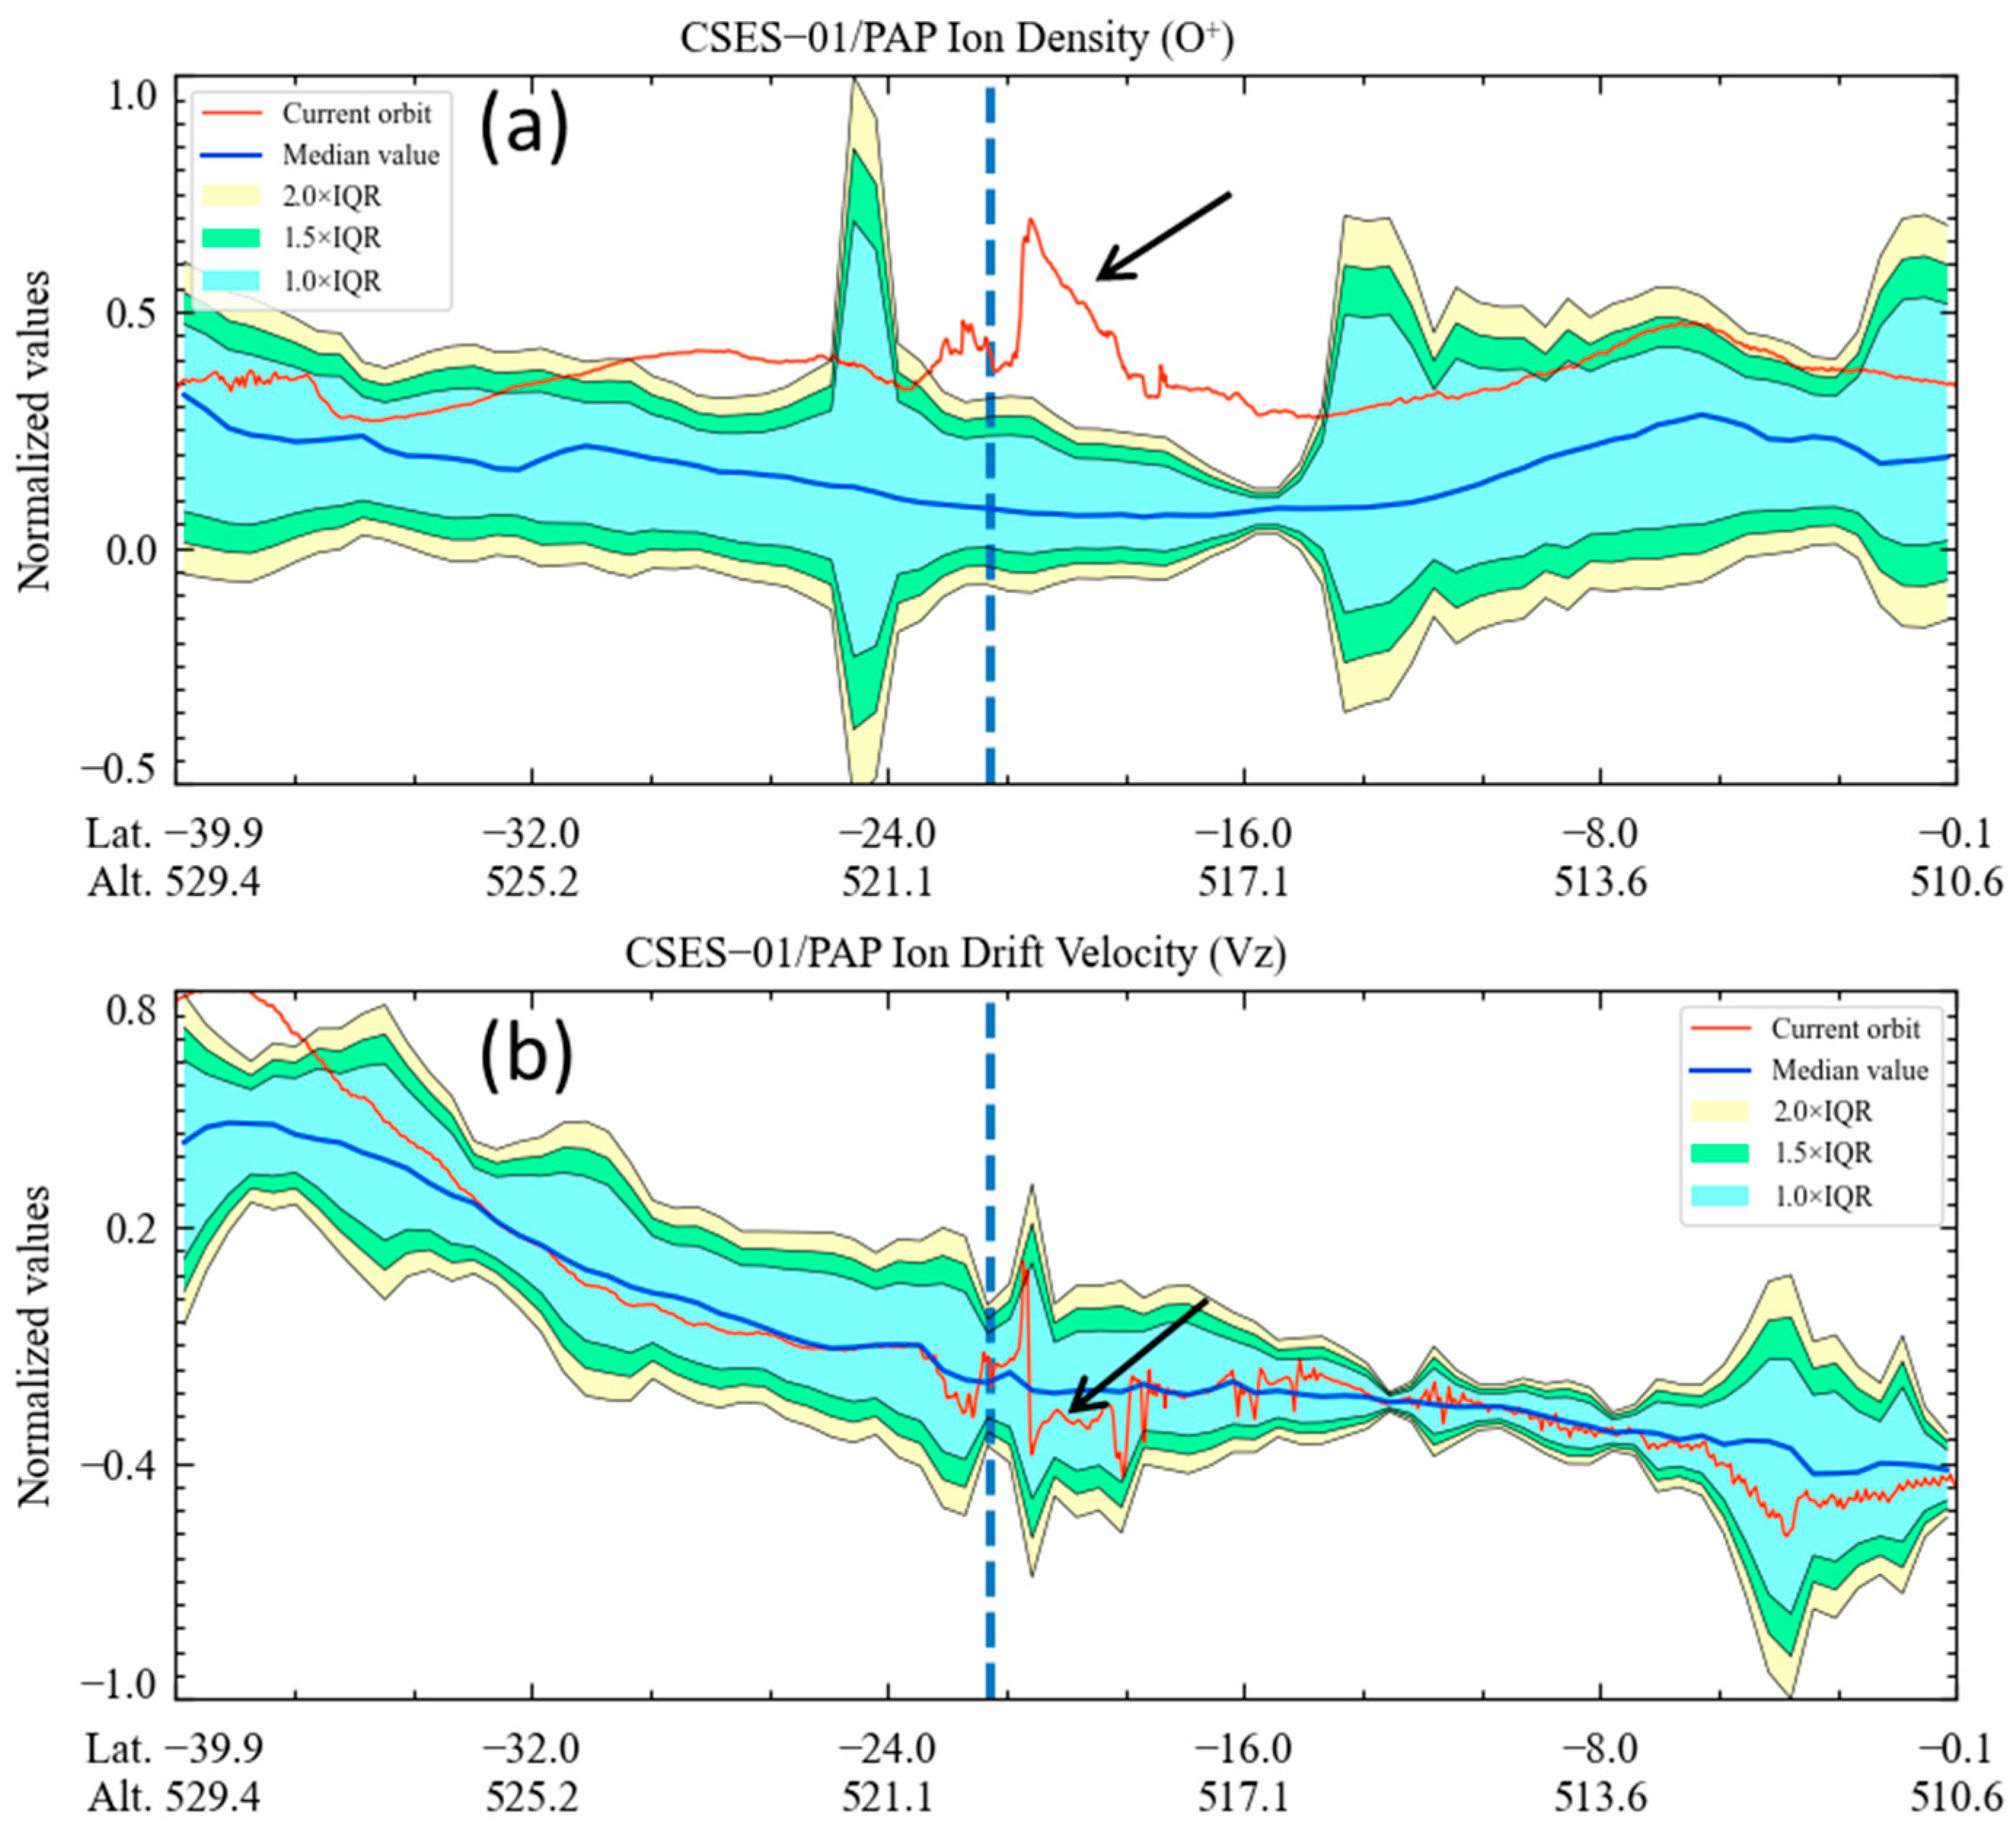
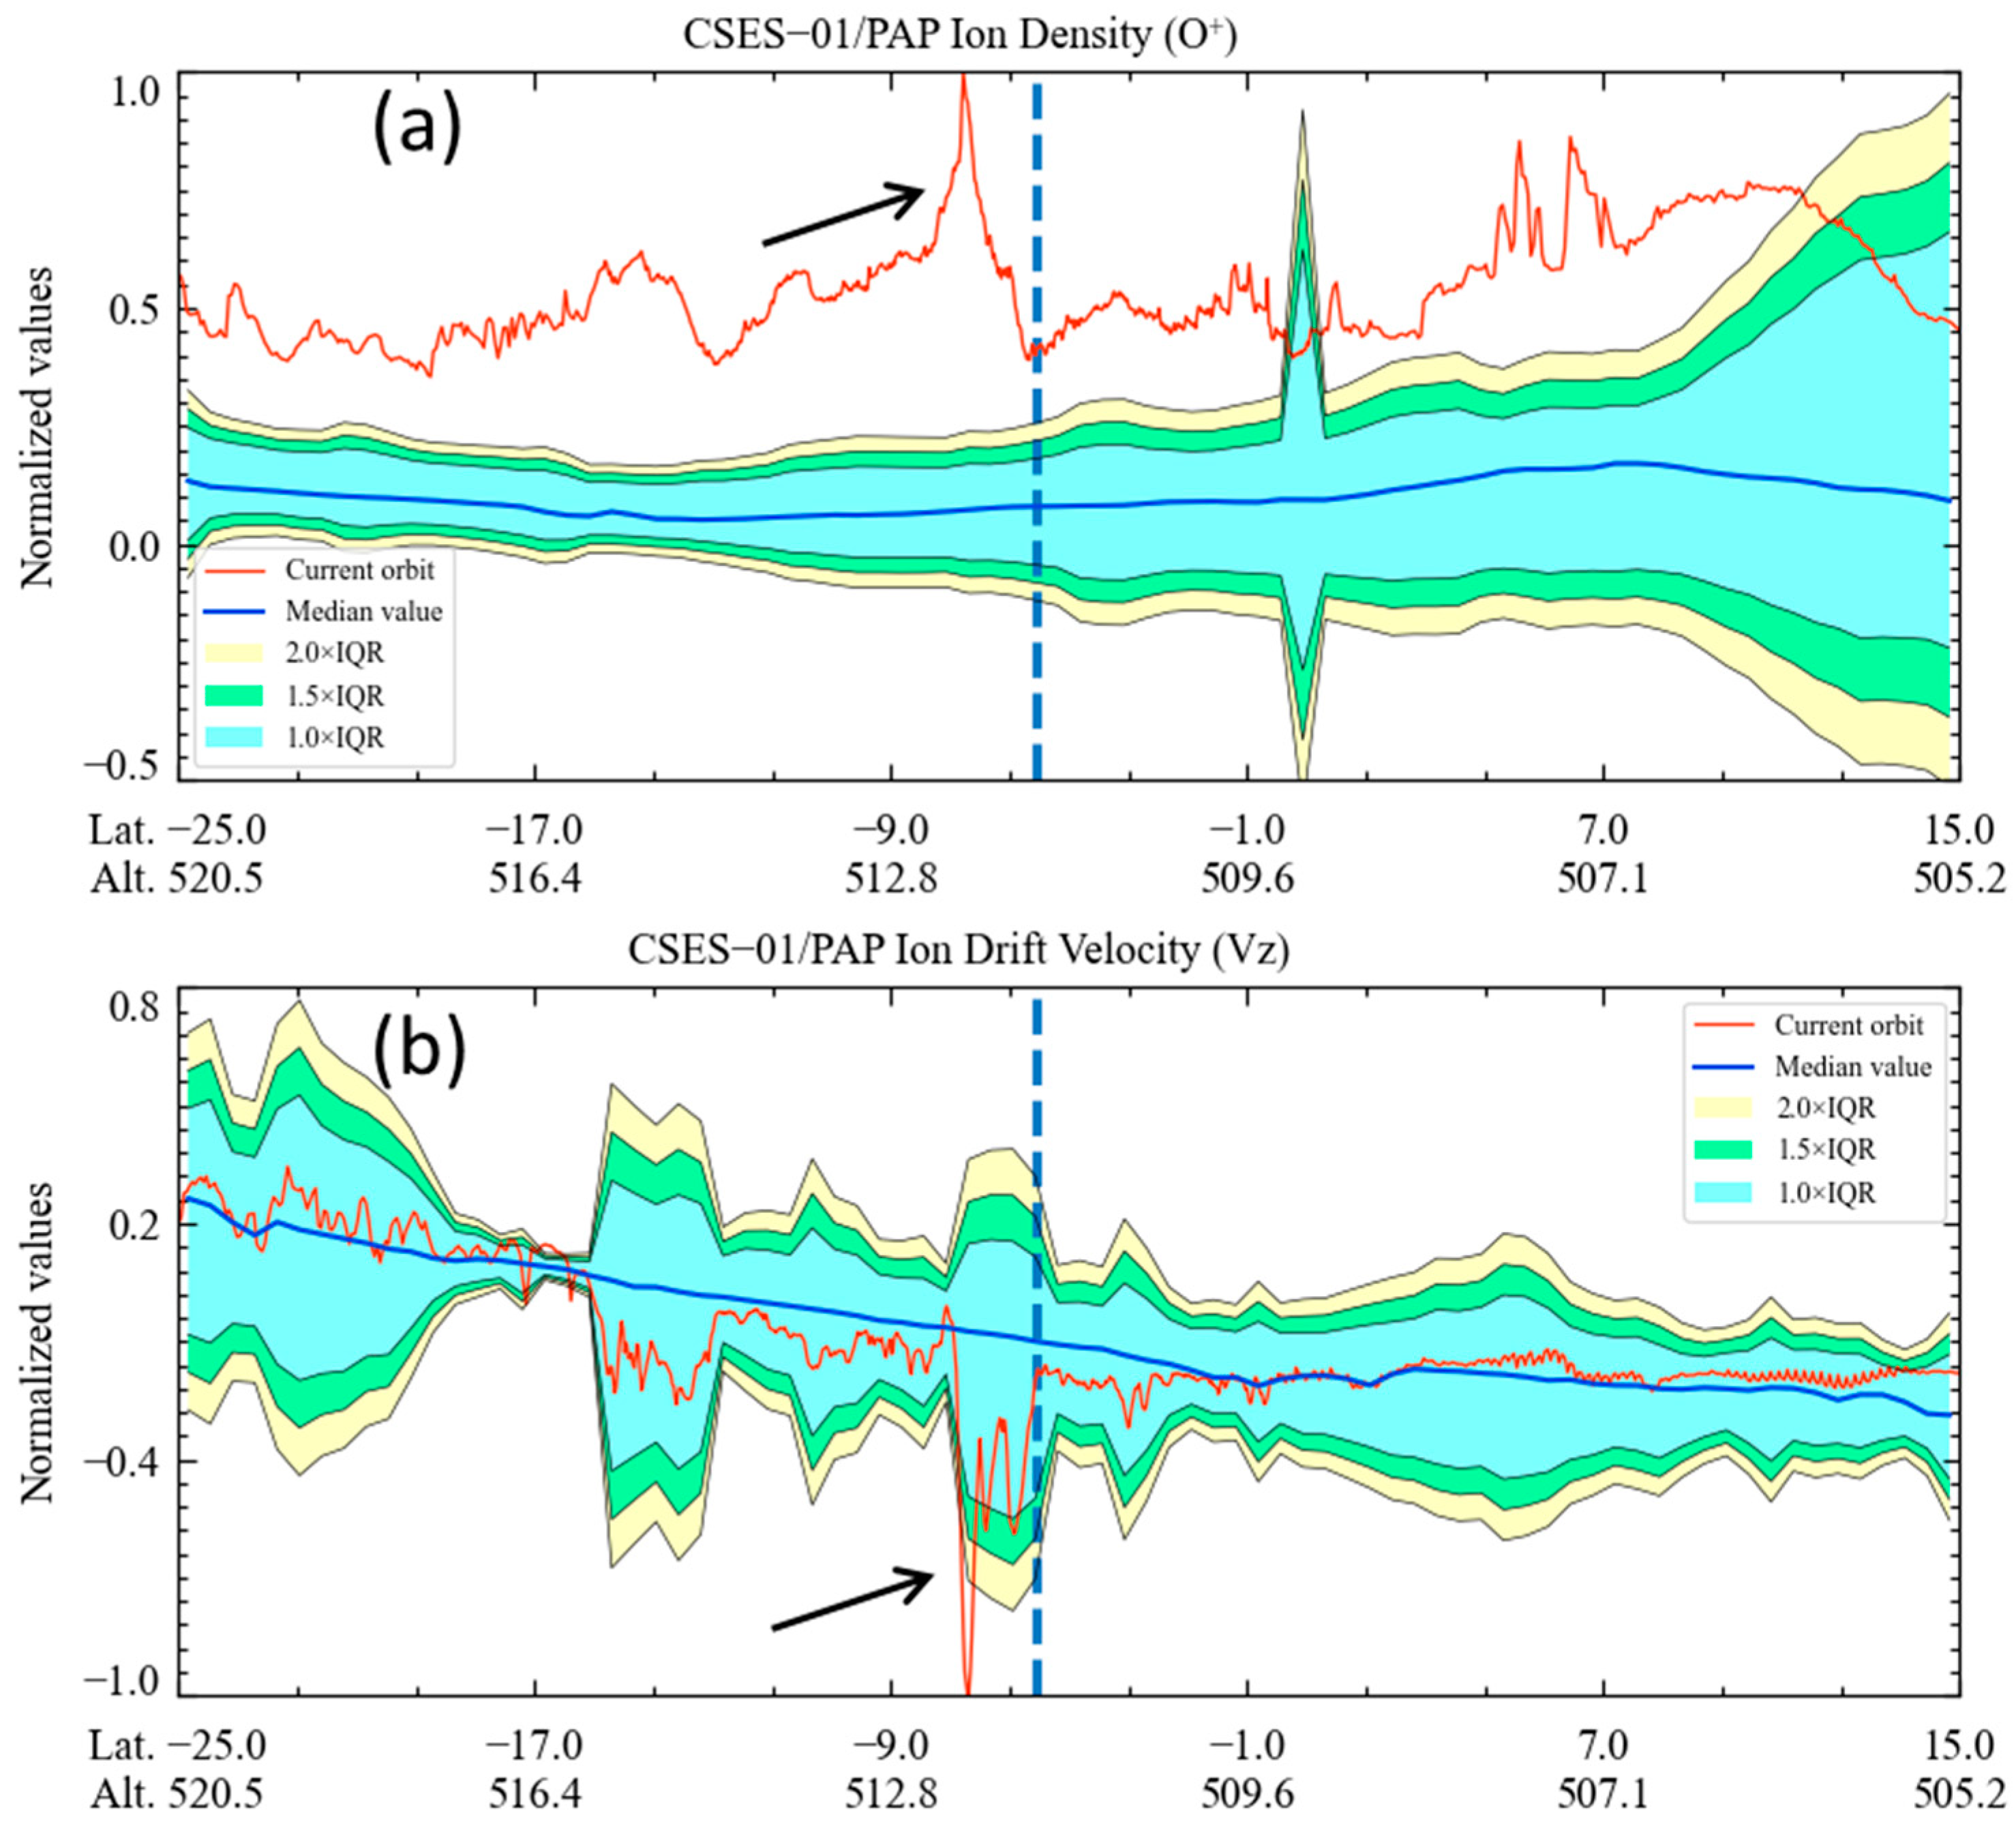
3.2. Multi-Orbit Analysis

The special orbital design of CSES-01 allows it to revisit identical locations every five days at the same LT [21]. The analysis in Section 3.1 illustrates that the pre-EQ characteristics of No+ and Vz are more significant than the electron parameters. This phenomenon is probably due to the 1 s sampling rate of PAP, which is higher than the 3 s sampling rate of LAP, resulting in a higher detection sensitivity for PAP [14]. Therefore, in this section, we further analyzed the performance of No+ and Vz based on the revisiting orbit data (multi-orbit data) by using a quartile analysis method to test and extract the possible seismic anomalies.
Considering the PAP’s contamination, we selected revisiting orbits in the short term, about 25–30 days around the EQs, to ensure the dataset’s reliability and reduce some factors related to seasonal changes, longitude position differences, etc. Their relative changes can somewhat reflect the precursor characteristics of EQ events that occurred in close locations in this short time.
Taking Figure 8 as an example, five revisiting orbits of orbit 2939_1 (shown in Figure 4) on 14 August were chosen to build a background trend, which are 2787_1 (ten days before, 4 August), 2863_1 (five days before, 9 August), 3015_1 (five days after, 19 August), 3243_1 (twenty-five days after, 3 September), and 3319_1 (thirty days after, 8 September). In the meantime, on 24 and 29 August, the observations were greatly disturbed by the strong geomagnetic storm around 26 August (as shown in Figure 2), so they were not selected for analysis of seismo-ionospheric anomalies. We used the inter-quartile ranges (IQR) method for comparing the No+ and Vz data of orbit 2939_1 with their backgrounds and thus identified the anomalous data. The median and IQR values are statistical parameters, which are equal to the second quartile and the difference between the third (Q3) and first quartiles (Q1) of these revisiting orbits, respectively. The pre-defined allowed ranges were calculated by adding Q3 and Q1 and subtracting multiple IQR values to extract the anomaly for No+ and Vz. Normally, it is best to choose the multiple as 1.5 or 2.0, but no more than 2.0. Otherwise, some samples would not be classified as anomalous, although they are [25].
Figure 8, Figure 9, Figure 10 and Figure 11 separately show the No+ and Vz results for anomalous orbits 2939_1, 3775_1, 3458_1, and 3806_1, represented by red curves. The median values of the background trends are plotted by blue lines, the upper/lower bounds by different color blocks, and the blue dotted lines denote the locations of the epicentral latitudes. The observations of the current orbit that significantly exceeded the given thresholds were judged as anomalous parts, denoted by arrow indications.
It is noted that the absolute values of No+ in orbit 3775_1 and orbit 3806_1 (shown in Figure 10 and Figure 11) are far beyond the upper boundaries, and the latitude ranges affected are up to about 40°, while in orbit 2939_1 and orbit 3458_1 (shown in Figure 8 and Figure 9), the No+ data did not exceed the upper boundary in such a large range except for the candidate seismo-ionospheric anomaly area. Meanwhile, the Vz values in these orbits are stable, rarely exceeding the threshold ranges of 2.0 times IQR, except for the sudden disturbances in the EQ abnormal areas.

4. Discussion

4.1. Spatial Distributions of EQ Precursor

According to the seismo-ionospheric coupling mechanism, the ionospheric disturbances caused by EQs should not only show time series characteristics but also particular spatial distribution features [26,27,28]. Compared with the anomaly information in the longitude direction reported by the previous research, this study pays more attention to the spatial anomaly distribution characteristics in the latitude direction. The reason is that the distance in longitude between adjacent satellite orbits around the EQ epicenter is about 24° (~2600 km) each day, which is insufficient to monitor longitudinal spatial variations. Although the longitude distance between adjacent tracks in 5 days is reduced to about 4.7° (~500 km), the time span is too large to detect whole-EQ precursory information. On the other hand, the CSES-01’s flight speed is 7.6 km per second, so it only takes tens of seconds to observe hundreds of kilometers in the latitude direction, which can comprehensively investigate the possible pre-EQ anomalies in the flighting orbit area.
As shown in Figure 4 and Figure 5, the significant perturbations of Te, Ne, No+, and Vz before Ms 7.1 EQ in Loyalty islands and Ms 6.9 EQ in the southeast of Loyalty islands appeared synchronously in the area 100–200 km northwest of the epicenters, and the spatial extension of these perturbations is about 350 km. According to Liu and Wan’s statistical analysis of the spatial-temporal distribution characteristics of the ionospheric anomalous disturbances before Ms ≥ 6.0 EQs in China [28], the main seismo-ionospheric perturbations do not occur directly above the epicenter locations but shift towards the magnetic equator, which is consistent with these detection results.
Moreover, as a known fixed-position high-power artificial source, the impact of the terrestrial very low-frequency (VLF) transmitters on the ionospheric environment could be an important reference for studying the seismo-ionospheric disturbance effect. Liu et al. [14] have presented the observation results when CSES-01 passes above the NAA (44.65°N, −67.28°E, transmission frequency 24 kHz, transmission power 885 kW) and NWC (−21.82°N, 114.17°E, transmission frequency 19.8 kHz, transmission power 1000 kW) stations [29,30], which are currently the most powerful VLF sources in the northern and southern hemispheres. Under the influence of the ground signal, the plasma parameters (e.g., Ne, Te, No+, and Vz) of the ionosphere F layer appear to exhibit significantly synchronous heating disturbances not above the stations but in the corresponding area approximately 205 km south of the NAA station and 220 km north of the NWC station [14], which is very similar to the observed phenomena in this pre-EQ study in Figure 4 and Figure 5.
Notably, the abnormal perturbations before Ms 7.4 EQ in Indonesia and Ms 7.1 EQ in Papua New Guinea, as shown in Figure 6 and Figure 7, are located in the area of ~100 km southeast of the epicenters, which are opposite to those in Figure 4 and Figure 5. A reason for the difference could be that the epicenter latitudes of Indonesia EQ and Papua New Guinea EQ are lower and are located south of the magnetic equatorial region.
As is well known, the fountain effect, i.e., the ionosphere plasma above the magnetic equator, drifts along the magnetic lines to form a double-peak structure, which is the so-called “Equatorial Ionospheric Anomaly (EIA)” [31,32]. Under the effect of the fountain effect, the ionospheric plasma anomalies, possibly excited by the strong EQs in the south of the magnetic equator, could be further transported to the area south of the epicenters. According to Hanson and Abdu et al. [33,34], the fountain effect caused by the eastward electric field generally ends at 17–19 LT. Still, the bimodal structure of EIA will continue until even early morning, and then the plasma disturbance phenomena can be recorded by CSES-01 flying over the areas.

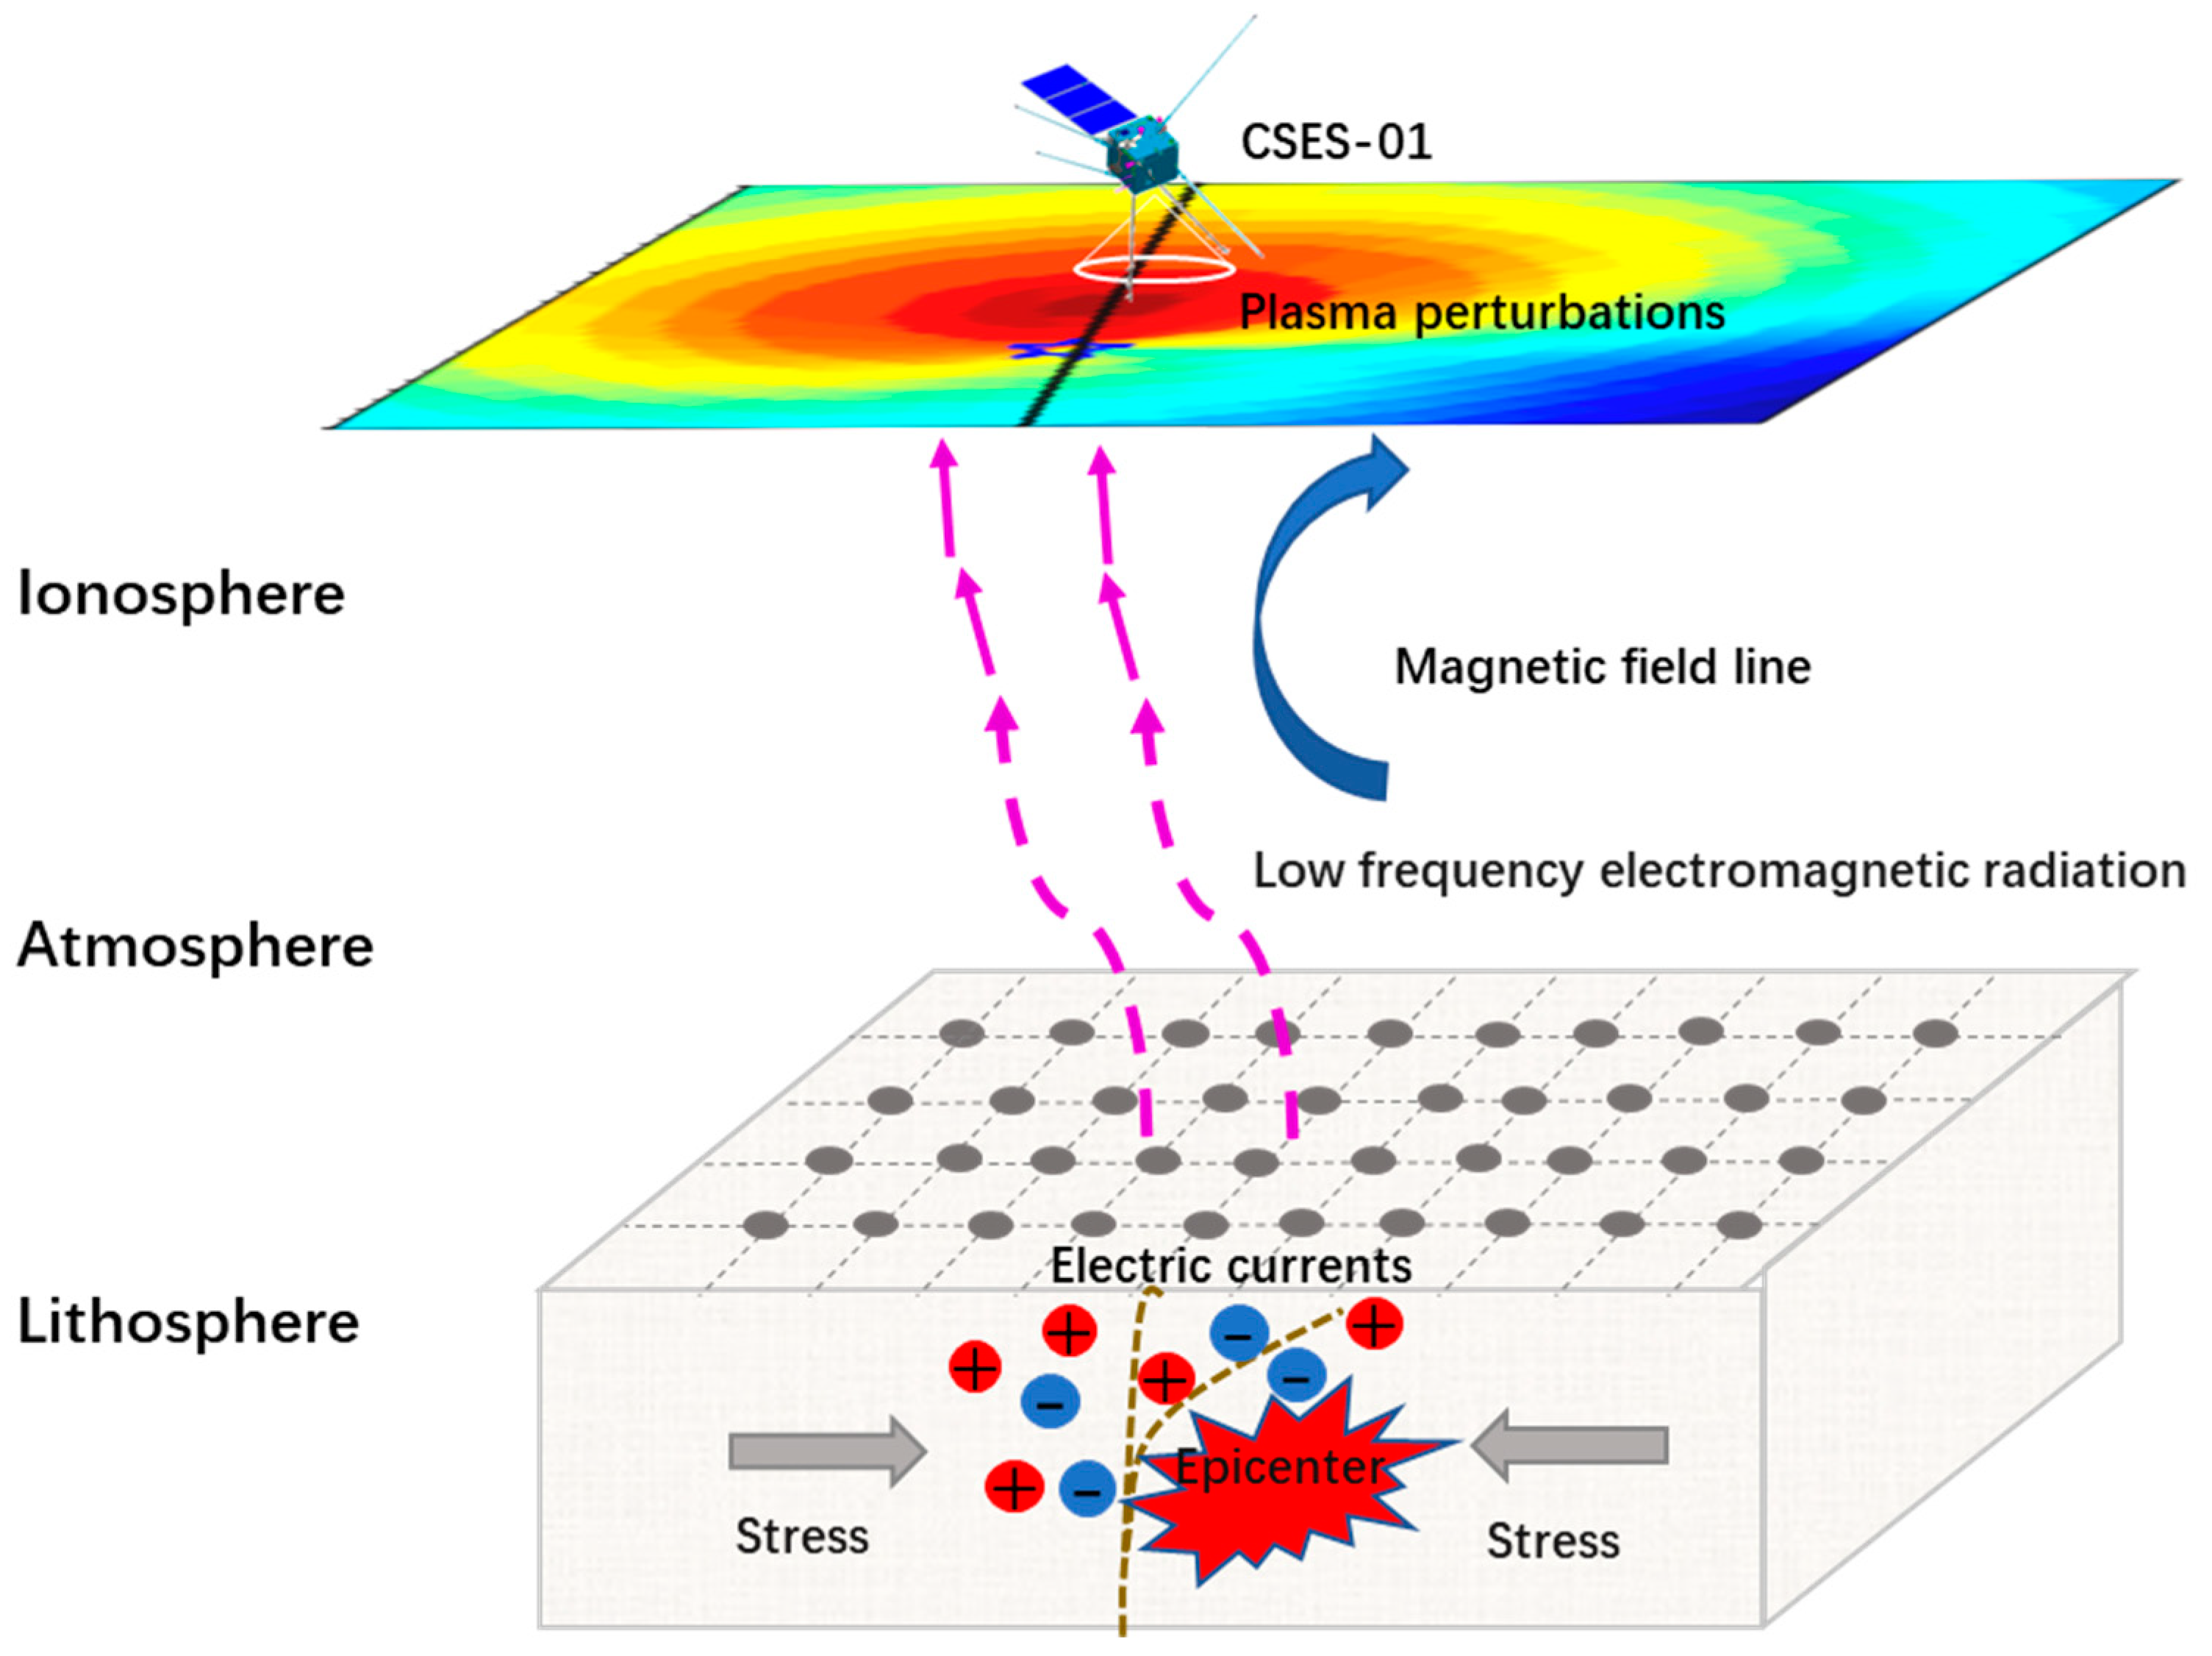
4.2. Mechanism of the Seismo-Ionospheric Coupling

At present, the research on the mechanism of seismo-ionospheric coupling is mostly in the qualitative analysis stage, and some numerical simulation theories are still constantly developing. There are three main transmission channels that describe the seismo-ionospheric coupling model, such as the acoustic channel, the geochemical channel, and the electromagnetic channel [27,35,36,37].
Despite some “up-down” evidence regarding solar activity and geomagnetic storms before some strong earthquakes, it is observed that the triggering mechanism can be a result of seismic/tectonic processes at depth, i.e., a “bottom-up” process, as defined by Freund et al. [38,39,40]. Before strong earthquakes, the igneous and high-grade metamorphic rocks are subjected to defect-positive holes in the oxygen anion sublattice. These charge carriers are highly mobile, able to flow out of stressed rocks into surrounding unstressed rocks. They form electric currents, which emit electromagnetic radiation, sometimes in pulses, sometimes sustained, and may cause ionospheric perturbations and earthquake lights.
Using numerical simulations, Kuo et al. [27,41] demonstrated that observations of nighttime plasma bubbles within the affected region can be used as precursors for EQ prediction. Pressurized rocks can stimulate charged hole carriers and form currents along the stress gradient direction, causing an increase in atmospheric conductivity and jointly triggering the upward electric current over the seismo-active region, ultimately causing ionospheric plasma density enhancement.
Ruzhin et al. [42], based on observations of total electron content (TEC) perturbations over the seismic region, reported an enhancement of the electric field detected in the ionsphere over the epicenter a few days prior to the main shock, and the plasma density can either increase or decrease (or both) in the perturbed region. The extra electric field E that is generated in the ionosphere over the seismic preparation zone is considered to be the main source of these ionospheric anomalies. The plasma transfer caused by the extra electric field in the direction of E × B drift may produce regions of TEC enhancement (plasma aggregation) and weakening (plasma outflow).
Based on the previous research results and synchronous perturbations of the ULF electric field waveform data and the plasma multi-parameter data presented in Section 3.1, we suggest that large-scale crustal deformation preceded the strong EQ-induced electric current changes in the subsurface, thus giving rise to the upward low-frequency electromagnetic radiation over the epicenter aera, and the electrodynamic effect of the electric field on the plasma induced the plasma perturbation in the ionosphere. The energy propagated along the direction of the magnetic field line in the ionosphere, making the location of the plasma disturbance center shift in a latitude direction [43,44], which can be detected by CSES-01. The possible plasma perturbation process induced by the seismo-ionospheric coupling is shown in Figure 12.

4.3. Difference with Magnetic Storm Anomaly

The geomagnetic and solar data shown in Figure 2 indicate that several geomagnetic storms occurred from August to October 2018, resulting in a complex ionospheric environment. Based on the data of four seismic candidate anomalous orbits during this period and their revisiting orbits, we compared the different performances of No+ and Vz under the influence of intense geomagnetic storms and strong EQs.
As shown in Figure 2, the Dst index on 8 and 10 October in 2018 is lower than −30 nT, and the Kp index is greater than 3, which indicates that a moderate geomagnetic storm occurred on these two days. Furthermore, from Figure 10a and Figure 11a, we can find that due to the influence of a strong geomagnetic storm, the values of No+ in orbit 3775_1 on 8 October and orbit 3806_1 on 10 October in 2018 are far beyond the upper boundaries, about 200–300% higher than the median values, and the affected latitude ranges are as large as more than 40°. Meanwhile, in the local areas of seismic anomaly disturbances, the values of No+ increased significantly based on the influence of the geomagnetic storm, which seems to reflect the combined effects of strong EQs and the intense geomagnetic storm on the ionospheric plasma environment.
On the other hand, orbit 2939_1 on 29 August in 2018 and orbit 3458_1 on 28 September in 2018, as presented in Figure 8a and Figure 9a, were not affected by the geomagnetic storm, but they were preceded by a few days of strong EQs. The No+ data did not exceed the upper boundary in such a large range but only greatly enhanced in the local EQ anomaly areas that extended for hundreds of kilometers, which increased about 100–200% to the median values. According to previous studies, the seismic anomaly is a regional and local anomaly that is unlikely to cause a global disturbance [21,28]. These observation results are consistent with this view.
Based on the data sets obtained from the MICS spectrometer onboard the CRRES satellite, Fu et al. [45] made a statistical analysis of 12 cases of intense geomagnetic storms in 1991. The results proved that oxygen ions (O+) in the ionosphere are the main component of the ring current particles during the main phases of intense geomagnetic storms. The increase and decrease of O+ in the ionosphere are the primary factors leading to the rapid decline and growth of the Dst index during the main and recovery phases of the geomagnetic storm. Although the observation height of the CRRES is higher than the CSES-01, the role of the O+ in the ionospheric environment could be an important reference for studying the seismo-ionospheric disturbance effect.
Ouyang and Liu et al. [12,14] reported significant disturbances of No+ before Ms7.9 Tonga Islands EQ in 2006 detected by DEMETER satellite and Ms 7.3 Venezuela EQ in 2018 recorded by CSES-01, indicating that No+ is a promising parameter for analyzing seismo-ionospheric perturbation. Therefore, monitoring the relative variation of No+ is important for analyzing the ionospheric anomaly.
It is interesting to find that, as represented in Figure 10b and Figure 11b, the trends of Vz in orbit 3775_1 on 8 October and orbit 3806_1 on 10 October in 2018, during the geomagnetic storm, are pretty different from those of No+. Vz is almost within the upper and lower boundaries, and there is no particular change compared with the background trend except for the sudden reverse perturbation over the seismic area, which seems consequently to be related to the incoming strong EQ. The vertical ion drift velocity seems not to be affected by the geomagnetic storm that occurred in the past two days but is susceptible to seismic activities. This character of Vz is very precious and important for the research of strong EQ precursors, which can directly indicate the vertical motion characteristic of plasma and is not easily influenced by the geomagnetic storm.

5. Conclusions

In this work, we analyzed the characteristics of ionospheric plasma perturbations before four strong EQs with magnitudes ranging from Ms 6.9 to Ms 7.4 occurred in southeast Asia and northern Oceania (in the south of the circum-Pacific seismic belt) from August to October 2018, which were observed by PAP and LAP onboard CSES-01 and were supported by the ULF waveform results of EFD. The different variations of No+ and Vz under intense geomagnetic storms and strong EQ were compared. Our findings support the possibility of applying in-situ plasma observation of LEO satellites to examine ionospheric pre-EQ signatures, which could be useful to understand seismo-ionospheric precursors better. The main results of this study are summarized as follows:
(1)
The No+, Ne, Te, and Vz values show significant synchronous disturbances at the same position near the epicenters from 1 to 15 days before the series of strong EQs occurred in southeast Asia and northern Oceania within 50 days. Regarding time and space characteristics, these plasma perturbations are possibly explained as seismo-ionospheric precursors.
(2)
The No+ and Vz seemed like promising parameters for analyzing ionospheric disturbances excited by strong seismic activity. Local ionospheric perturbations caused by strong EQs are often accompanied by a change in Vz, which is not easily influenced by the geomagnetic storm. Meanwhile, the variation of No+ could reflect the combined effects induced by strong EQ and intense geomagnetic storms on the ionospheric plasma environment.
(3)
Based on the long-term data analysis results of CSES-01, the absolute value differences of plasma in different locations are large. It may be more effective to extract precursory seismic anomalies by long-term monitoring of the critical areas and checking the relative abnormal changes of the revisiting orbits.

Author Contributions

D.L., Z.Z. and X.S. contributed to the conception and methodology. D.L. analyzed the data and wrote the original draft. H.H., Q.W. and D.Y. wrote some programs. C.L., R.Y. and Y.G. checked and organized the database. Z.Z. reviewed the expression. All authors have read and agreed to the published version of the manuscript.

Funding

This research is supported by the National Natural Science Foundation of China (grant number 41874174), the Natural Science Foundation of Beijing (grant number 8184091), and the ISSI-BJ project.

Data Availability Statement

The CSES-01’s plasma observation data used in this paper can be downloaded from the CSES data service website: https://www.leos.ac.cn (accessed on 1 September 2022). The earthquake data were downloaded at: http://news.ceic.ac.cn (accessed on 10 February 2023) and https://earthquake.usgs.gov (accessed on 8 May 2023), and the geomagnetic index data were downloaded at: http://wdc.kugi.kyoto-u.ac.jp (accessed on 5 March 2023).

Acknowledgments

This work utilizes the data from the CSES mission. We acknowledge the experts who helped improve the quality of this paper.

Conflicts of Interest

The authors declare no conflict of interest.

References

  1. Pulinets, S.A.; Boyarchuk, K.A.; Hegai, V.V.; Kim, V.P.; Lomonosov, A.M. Quasielectrostatic model of atmosphere-thermosphere-ionosphere coupling. Adv. Space Res. 2000, 26, 1209–1218. [Google Scholar] [CrossRef]
  2. Yokoyama, T.; Su, S.Y.; Fukao, S. Plasma blobs and irregularities concurrently observed by ROCSAT-1 and Equatorial At-mosphere Radar. J. Geophys. Res. Space Phys. 2007, 112, 515–526. [Google Scholar] [CrossRef]
  3. Liu, J.Y.; Chen, C.H.; Lin, C.H.; Tsai, H.F.; Kamogawa, M. Ionospheric disturbances triggered by the 11 March 2011 M9.0 Tohoku earthquake. J. Geophys. Res. Space Phys. 2011, 116, A06319. [Google Scholar] [CrossRef]
  4. Pulinets, S.; Ouzounov, D. Lithosphere–Atmosphere–Ionosphere Coupling (LAIC) model—An unified concept for earthquake precursors validation. J. Asian Earth Sci. 2011, 41, 371–382. [Google Scholar] [CrossRef]
  5. Macmillan, S.; Olsen, N. Observatory data and the Swarm mission. Earth Planets Space 2013, 65, 1355–1362. [Google Scholar] [CrossRef]
  6. Maruyama, T.; Shinagawa, H. Infrasonic sounds excited by seismic waves of the 2011 Tohoku-oki earthquake as visualized in ionograms. J. Geophys. Res. Space Phys. 2014, 119, 4094–4108. [Google Scholar] [CrossRef]
  7. Parrot, M.; Benoist, D.; Berthelier, J.; Błęcki, J.J.; Chapuis, Y.; Colin, F.; Elie, F.; Fergeau, P.; Lagoutte, D.; Lefeuvre, F.; et al. The magnetic field experiment IMSC and its data processing onboard DEMETER: Scientific objectives, description and first results. Plan. Space Sci. 2006, 54, 441–455. [Google Scholar] [CrossRef]
  8. Cussac, T.; Clair, M.A.; Ultré-Guerard, P.; Buisson, F.; Rey, N. The DEMETER microsatellite and ground segment. Plan. Space Sci. 2006, 54, 413–427. [Google Scholar] [CrossRef]
  9. Berthelier, J.; Godefroy, M.; Leblanc, F.; Seran, E.; Peschard, D.; Gilbert, P.; Artru, J. IAP, the thermal plasma analyzer on DEMETER. Plan. Space Sci. 2006, 54, 487–501. [Google Scholar] [CrossRef]
  10. De Santis, A.; Marchetti, D.; Pavón-Carrasco, F.J.; Cianchini, G.; Perrone, L.; Abbattista, C.; Alfonsi, L.; Amoruso, L.; Campuzano, S.A.; Carbone, M.; et al. Precursory worldwide signatures of earthquake occurrences on Swarm satellite data. Sci. Rep. 2019, 9, 20287. [Google Scholar] [CrossRef]
  11. Liu, J.Y.; Chen, Y.I.; Pulinets, S.A.; Tsai, Y.B.; Chuo, Y.J. Seismo-ionospheric signatures prior to M ≥ 6.0 Taiwan earthquakes. Geophys. Res. Lett. 2000, 27, 3113–3116. [Google Scholar] [CrossRef]
  12. Ouyang, X.; Zhang, X.; Shen, X.; Huang, J.; Liu, J.; Zeren, Z.; Zhao, S. Disturbance of O+ Density Before Major Earthquake Detected by DEMETER Satellite. Chin. J. Space Sci. 2011, 31, 607–617. [Google Scholar] [CrossRef]
  13. Piersanti, M.; Materassi, M.; Battiston, R.; Carbone, V.; Cicone, A.; D’angelo, G.; Diego, P.; Ubertini, P. Magnetospheric–Ionospheric–Lithospheric Coupling Model. 1: Observations during the 5 August 2018 Bayan Earthquake. Remote Sens. 2020, 12, 3299. [Google Scholar] [CrossRef]
  14. Liu, D.; Zeren, Z.; Shen, X.; Zhao, S.; Yan, R.; Wang, X.; Liu, C.; Guan, Y.; Zhu, X.; Miao, Y.; et al. Typical ionospheric disturbances revealed by the plasma analyzer package onboard the China Seismo-Electromagnetic Satellite. Adv. Space Res. 2021, 68, 3796–3805. [Google Scholar] [CrossRef]
  15. Li, M.; Shen, X.; Parrot, M.; Zhang, X.; Zhang, Y.; Yu, C.; Yan, R.; Liu, D.; Lu, H.; Guo, F.; et al. Primary Joint Statistical Seismic Influence on Ionospheric Parameters Recorded by the CSES and DEMETER Satellites. J. Geophys. Res. Space Phys. 2020, 125, e2020JA028116. [Google Scholar] [CrossRef]
  16. Li, Z.; Yang, B.; Huang, J.; Yin, H.; Yang, X.; Liu, H.; Zhang, F.; Lu, H. Analysis of pre-earthquake space electric field disturbance observed by CSES. Atmosphere 2022, 13, 934. [Google Scholar] [CrossRef]
  17. Song, R.; Hattori, K.; Zhang, X.; Sanaka, S. Seismic-ionospheric effects prior to four earthquakes in Indonesia detected by the China seismo-electromagnetic satellite. J. Atmos. Terr. Phys. 2020, 205, 105291. [Google Scholar] [CrossRef]
  18. Zeren, Z.; Yan, R.; Lin, J.; Wang, Q.; Yang, Y.; Lv, F.; Huang, J.; Cui, J.; Liu, Q.; Zhao, S.; et al. The Possible Seismo-Ionospheric Perturbations Recorded by the China-Seismo-Electromagnetic Satellite. Remote Sens. 2022, 14, 905. [Google Scholar] [CrossRef]
  19. Liu, J.; Qiao, X.; Zhang, X.; Wang, Z.; Zhou, C.; Zhang, Y. Using a Spatial Analysis Method to Study the Seismo-Ionospheric Disturbances of Electron Density Observed by China Seismo-Electromagnetic Satellite. Front. Earth Sci. 2022, 10, 811658. [Google Scholar] [CrossRef]
  20. Oyama, K.-I.; Devi, M.; Ryu, K.; Chen, C.H.; Liu, J.Y.; Liu, H.; Bankov, L.; Kodama, T. Modifications of the ionosphere prior to large earthquakes: Report from the Ionosphere Precursor Study Group. Geosci. Lett. 2016, 3, 6. [Google Scholar] [CrossRef]
  21. Yang, Y.; Zhima, Z.; Shen, X.; Chu, W.; Huang, J.; Wang, Q.; Yan, R.; Xu, S.; Lu, H.; Liu, D. The First Intense Geomagnetic Storm Event Recorded by the China Seismo-Electromagnetic Satellite. Space Weather. 2020, 18, e2019SW002243. [Google Scholar] [CrossRef]
  22. Marchitelli, V.; Harabaglia, P.; Troise, C.; De Natale, G. On the correlation between solar activity and large earthquakes worldwide. Sci. Rep. 2020, 10, 11495. [Google Scholar] [CrossRef] [PubMed]
  23. Dobrovolsky, I.P.; Zubkov, S.I.; Miachkin, V.I. Estimation of the size of earthquake preparation zones. Pure Appl. Geophys. 1979, 117, 1025–1044. [Google Scholar] [CrossRef]
  24. Huang, J.; Lei, J.; Li, S.; Zeren, Z.; Li, C.; Zhu, X.; Yu, W. The Electric Field Detector (EFD) onboard the ZH-1 satellite and first observational results. Earth Planet. Phys. 2018, 2, 469–478. [Google Scholar] [CrossRef]
  25. Zhang, Y.; Wang, T.; Chen, W.; Zhu, K.; Marchetti, D.; Cheng, Y.; Fan, M.; Wang, S.; Wen, J.; Zhang, D.; et al. Are There One or More Geophysical Coupling Mechanisms before Earthquakes? The Case Study of Lushan (China) 2013. Remote Sens. 2023, 15, 1521. [Google Scholar] [CrossRef]
  26. Takeuchi, A.; Lau, B.; Freund, F. Current and surface potential induced by stress-activated positive holes in igneous rocks. Phys. Chem. Earth 2006, 31, 240–247. [Google Scholar] [CrossRef]
  27. Kuo, C.L.; Huba, J.D.; Joyce, G.; Lee, L.C. Ionosphere plasma bubbles and density variations induced by pre-earthquake rock currents and associated surface charges. J. Geophys. Res. Space Phys. 2011, 116, A10317. [Google Scholar] [CrossRef]
  28. Liu, J.; Wan, W. Spatial-temporal distribution of the ionospheric perturbations prior to MS ≥ 6.0 earthquakes in China main land. Chin. J. Geophys. 2014, 57, 2181–2189. [Google Scholar] [CrossRef]
  29. Bell, T.; Graf, K.; Inan, U.; Piddyachiy, D.; Parrot, M. DEMETER observations of ionospheric heating by powerful VLF transmitters. Geophys. Res. Lett. 2011, 38, L11103. [Google Scholar] [CrossRef]
  30. Tao, D.; Liu, W.; Ma, Y. Plasma perturbations in the coexisting environment of VLF transmitter emission, lightning strokes and seismic activity. Sci. China Technol. Sci. 2018, 61, 678–686. [Google Scholar] [CrossRef]
  31. Appleton, E.V. Two Anomalies in the Ionosphere. Nature 1946, 157, 691. [Google Scholar] [CrossRef]
  32. Whalen, J.A. Mapping a bubble at dip equator and anomaly with oblique ionospheric soundings of range spread F. J. Geophys. Res. 1996, 101, 5185–5193. [Google Scholar] [CrossRef]
  33. Hanson, W.B.; Moffett, R.J. Ionization transport effects in the equatorial F region. J. Geophys. Res. 1966, 71, 5559–5572. [Google Scholar] [CrossRef]
  34. Abdu, M.A. Major phenomena of the equatorial ionosphere-thermosphere system under disturbed conditions. J. Atmos. Terres. Phys. 1997, 59, 1505–1519. [Google Scholar] [CrossRef]
  35. Wu, L.; Qi, Y.; Mao, W.; Lu, J.; Ding, Y.; Peng, B.; Xie, B. Scrutinizing and rooting the multiple anomalies of Nepal earthquake sequence in 2015 with the deviation–time–space criterion and homologous lithosphere–coversphere–atmosphere–ionosphere coupling physics. Nat. Hazards Earth Syst Sci. 2023, 23, 231–249. [Google Scholar] [CrossRef]
  36. Guo, Y.; Zhang, X.; Liu, J.; Yang, M.; Yang, X.; Du, X.; Lü, J.; Xiao, J. Seismo-Ionospheric Effects Prior to Two Earthquakes in Taiwan Detected by the China Seismo-Electromagnetic Satellite. Atmosphere 2022, 13, 1523. [Google Scholar] [CrossRef]
  37. Akhoondzadeh, M.; Parrot, M.; Saradjian, M.R. Electron and ion density variations before strong earthquakes (M > 6.0) using DEMETER and GPS data. Nat. Hazards Earth Syst. Sci. 2010, 10, 7–18. [Google Scholar] [CrossRef]
  38. Freund, F.T.; Kulahci, I.G.; Cyr, G.; Ling, J.; Winnick, M.; Tregloan-Reed, J.; Freund, M.M. Air ionization at rock surfaces and pre-earthquake signals. J. Atmos. Solar-Terr. Phys. 2009, 71, 1824–1834. [Google Scholar] [CrossRef]
  39. Freund, F.T. Earthquake forewarning—A multidisciplinary challenge from the ground up to space. Acta Geophys. 2013, 61, 775–807. [Google Scholar] [CrossRef]
  40. Freund, F.T.; Daneshvar, M.M.; Ebrahimi, M. Atmospheric Storm Anomalies Prior to Major Earthquakes in the Japan Region. Sustainability 2022, 14, 10241. [Google Scholar] [CrossRef]
  41. Kuo, C.L.; Lee, L.C.; Huba, J.D. An improved coupling model for the lithosphere-atmosphere-ionosphere system. J. Geophys. Res. Space Phys. 2014, 119, 3189–3205. [Google Scholar] [CrossRef]
  42. Ruzhin, Y.Y.; Sorokin, V.M.; Yashchenko, A.K. Physical mechanism of ionospheric total electron content perturbations over a seismoactive region. Geomagn. Aeron. 2014, 54, 337–346. [Google Scholar] [CrossRef]
  43. Wait, J.R. Mode conversion and refraction effects in the Earth-ionosphere waveguide for VLF radio waves. J. Geophys. Res. Atmos. 1968, 73, 3537–3548. [Google Scholar] [CrossRef]
  44. Zhao, S.; Liao, L.; Zhang, X. Trans-ionospheric VLF wave power absorption of terrestrial VLF signal. Chin. J. Geophys. 2017, 60, 3004–3014. [Google Scholar] [CrossRef]
  45. Fu, S.; Pu, Z.; Zong, Q.; Xiao, C.; Xie, L.; Wilken, B. Ion composition variations in the ring current during intense magnetic storms and their relationship with evolution of storms. Chin. J. Geophys. 2001, 44, 1–11. [Google Scholar] [CrossRef]
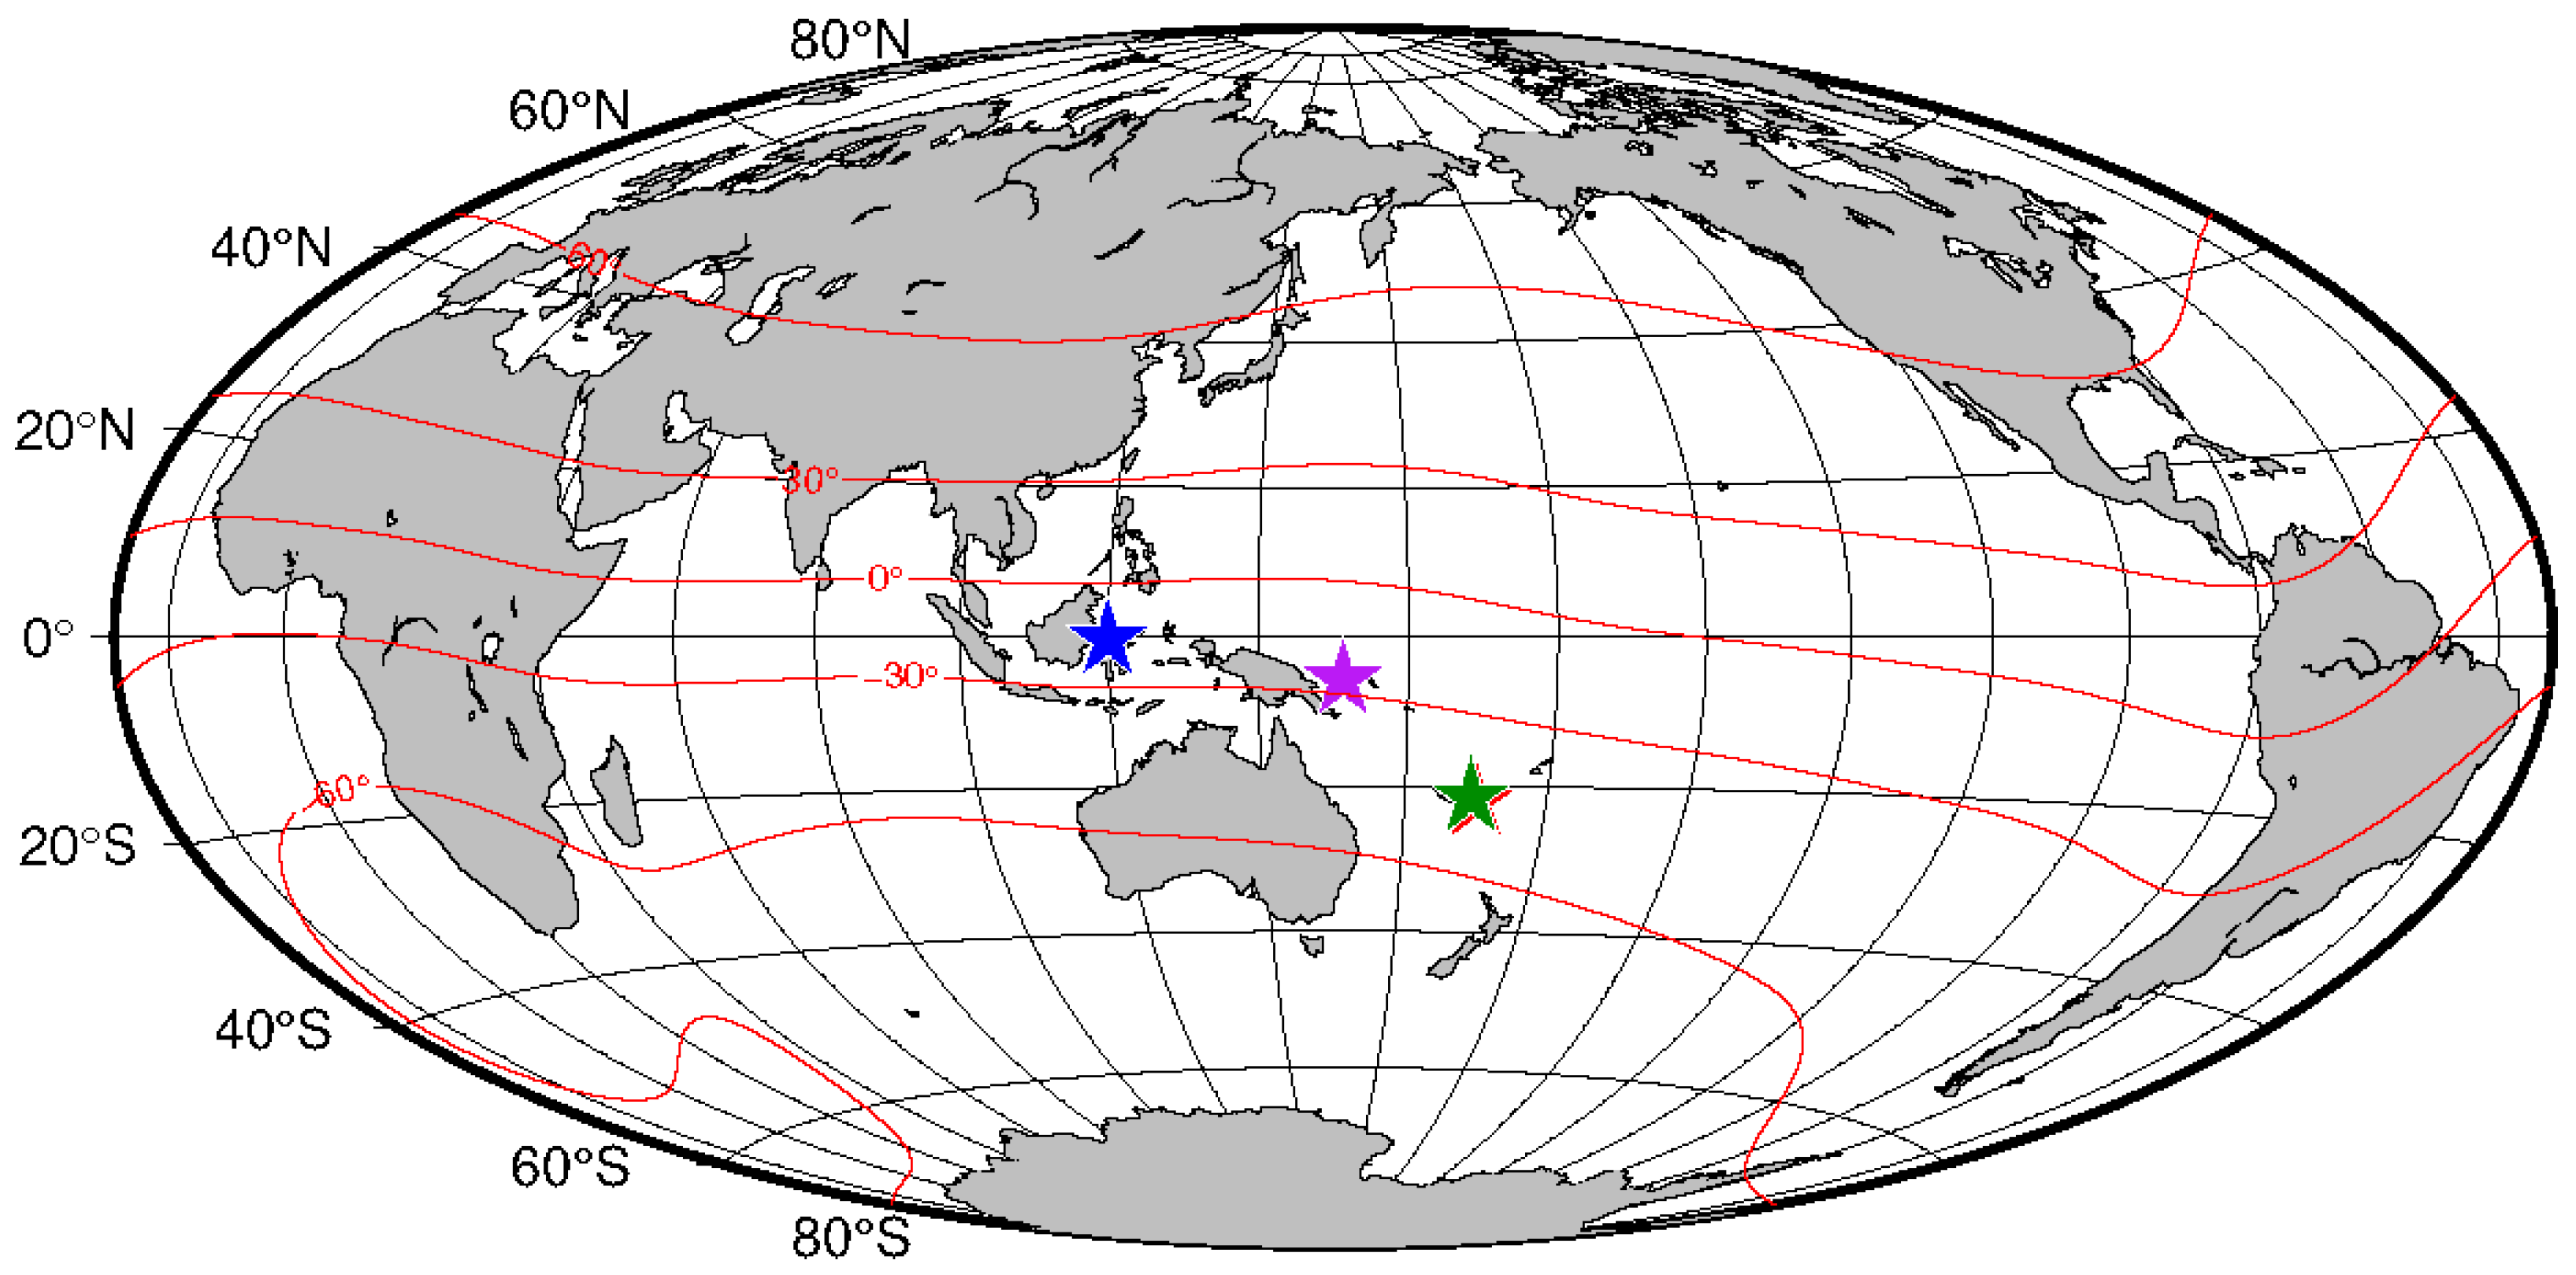
Figure 1. Location of the four investigated EQs that occurred in southeast Asia and northern Oceania in 2018. The stars represent the epicenters, and the red lines are the geomagnetic latitude lines. The green star represents the Loyalty Islands Ms 7.1 EQ, and the red star represents the Southeast of Loyalty Islands Ms 6.9 EQ, and the blue star represents the Indonesia Ms 7.4 EQ, and the purple star represents the Papua New Guinea Ms 7.1 EQ.
Remotesensing 15 05735 g001
Figure 2. The space weather index from August to October 2018. From top to bottom: (a) the space weather index for August 2018, (b) the space weather index for September 2018, and (c) the space weather index for October 2018. The red vertical lines represent the times of four strong EQs.
Remotesensing 15 05735 g002
Figure 3. The range of orbital regions selected for data analysis is shown in the black dashed-bordered rectangle, taking the Ms 7.4 Indonesia EQ as an example. The red star represents the epicenter, and the blue lines are the ascending orbits of the CSES-01 during the period. Format of annotation information: mmdd-orbit number.
Remotesensing 15 05735 g003
Figure 4. The synchronous abnormal perturbations of Te, Ne, No+, Vz, Ex, and Ez of orbit 2939_1 occurred on 14 August 2018, 15 days before the Ms 7.1 Loyalty Islands EQ influential area. The red star represents the epicenter position, the blue oblique line in the left diagram is the orbit track, the red circles indicate the regions where the perturbation occur for each parameter, and the dotted lines represent the latitude location of the epicenter.
Remotesensing 15 05735 g004
Figure 5. Same format as Figure 4, but shows that the synchronous abnormal perturbations recorded by orbit 3775_1 on 8 October 2018, 8 days before the Ms 6.9 Southeast of Loyalty Islands EQ influential area.
Remotesensing 15 05735 g005
Figure 6. Same format as Figure 4, but the synchronous abnormal perturbations of Te, No+, Vz, Ex, and Ez recorded by orbit 3458_1 on 17 September 2018, 11 days before the Ms 7.4 Indonesia EQ influential area.
Remotesensing 15 05735 g006
Figure 7. Same format as Figure 4, but for the synchronous abnormal perturbations of Te, Ne, No+, Vz, Ex, and Ez of orbit 3806_1 on 10 October 2018, 1 day before the Ms 7.1 Papua New Guinea EQ influential area.
Remotesensing 15 05735 g007
Figure 8. The variation of the (a) No+ and (b) Vz detected by orbit 2939_1 with its revisiting orbits from 4 August to 8 September, which are impacted by the Ms 7.1 Loyalty Islands EQ, instead of the geomagnetic storm.
Remotesensing 15 05735 g008
Figure 9. Same format as Figure 8, but for the variation of the (a) No+ and (b) Vz detected by orbit 3458_1 with its revisiting orbits from 2 September to 27 September, which are impacted by the Ms 7.4 Indonesia EQ, instead of the geomagnetic storm.
Remotesensing 15 05735 g009
Figure 10. Same format as Figure 8, but for the variation of the (a) No+ and (b) Vz detected by orbit 3775_1 with its revisiting orbits from 28 September to 23 October, which were jointly affected by strong geomagnetic storms and the Ms 6.9 Southeast of Loyalty Islands EQ.
Remotesensing 15 05735 g010
Figure 11. Same format as Figure 8, but for the variation of the (a) No+ and (b) Vz detected by the orbit 3806_1 with its revisiting orbits from 15 September to 10 October, which are jointly affected by a strong geomagnetic storm and the Ms 7.1 Papua New Guinea EQ.
Remotesensing 15 05735 g011
Figure 12. The possible schematic diagram of the plasma perturbation process induced by the seismo-ionospheric coupling.
Remotesensing 15 05735 g012
Table 1. Information on the four strong EQs that occurred in southeast Asia and northern Oceania in 2018.
No.RegionDate and Time (UTC)Magnitude (Ms/Mw) 1Latitude (°N)Longitude (°E)Focal Depth (km)
1Loyalty Islands29 August 2018 at 03:51:547.1/7.1−21.95170.1020
2Southeast of Loyalty Islands16 August 2018 at 01:03:426.9/6.5−21.65169.6117
3Indonesia28 September 2018 at 10:02:447.4/7.5−0.25119.9020
4Papua New Guinea10 October 2018 at 20:48:187.1/7.0−5.70151.2539
1 The moment magnitude Mw and focal depth were retrieved from USGS, and the other information was retrieved from CENC.
Disclaimer/Publisher’s Note: The statements, opinions and data contained in all publications are solely those of the individual author(s) and contributor(s) and not of MDPI and/or the editor(s). MDPI and/or the editor(s) disclaim responsibility for any injury to people or property resulting from any ideas, methods, instructions or products referred to in the content.

