Technical Note

The Impact of Side-Scan Sonar Resolution and Acoustic Shadow Phenomenon on the Quality of Sonar Imagery and Data Interpretation Capabilities

Department of Navigation and Marine Hydrography, Faculty of Navigation and Naval Weapon, Polish Naval Academy, 81-127 Gdynia, Poland
Remote Sens. 2023, 15(23), 5599; https://doi.org/10.3390/rs15235599
Submission received: 3 October 2023 / Revised: 28 November 2023 / Accepted: 30 November 2023 / Published: 1 December 2023
(This article belongs to the Special Issue Advances in Remote Sensing of the Inland and Coastal Water Zones II)

Abstract

:
Side-scan sonar is designed and used for a variety of survey work, in both military and civilian fields. These systems provide acoustic imageries that play a significant role in a variety of marine and inland applications. For this reason, it is extremely important that the recorded sonar image is characterized by high resolution, detail and sharpness. This article is mainly aimed at the demonstration of the impact of side-scan sonar resolution on the imaging quality. The article also presents the importance of acoustic shadow in the process of analyzing sonar data and identifying underwater objects. The real measurements were carried out using two independent survey systems: hull-mounted sonar and towed side-scan sonar. Six different shipwrecks lying in the Baltic Sea were selected as the objects of research. The results presented in the article also constitute evidence of how the sonar technology has changed over time. The survey findings show that by maintaining the appropriate operational conditions and meeting several requirements, it is possible to obtain photographic-quality sonar images, which may be crucial in the process of data interpretation and shipwreck identification.

Graphical Abstract

1. Introduction

The ocean covers more than 70% of Earth, but only 24.9% of the ocean floor has been mapped [1]. The importance of mapping the world ocean has received much attention in various publications [2,3,4,5]. Exploring the oceans and seas will help us to better know their processes and mineral resources and to protect oceans for the future generations. Global mapping of the ocean, collecting actual bathymetric data and sharing this information ensure a better understanding of our marine environment. One of the many ways to obtain information about the seabed, depths and features lying on the seafloor is to conduct hydrographic surveys [6,7]. Hydrographic survey is a crucial activity in many underwater applications, such as ocean surveys, offshore oil and gas exploration, pipeline and underwater cables survey or mine clearance [8,9].
Over the last few decades, we have witnessed the huge expansion of seabed mapping tools used for searching for and detecting underwater targets, navigational obstacles [10] and other bottom features that can be hazardous to shipping [11]. Prior to the advent of side-scan sonar (SSS), wire-drag surveying was the only method of searching large areas for obstructions, lost vessels and aircraft [12]. The development of new electronic technologies—single beam echosounder (SBES), multibeam echosounder (MBES) and side-scan sonar—eventually caused the wire-dragging system to go out of use [13,14,15].
Side-scan sonar, which was developed in the 1960s [16,17,18], is designed and used for a variety of survey work. It is widely used in both military and civilian fields, primarily for hydroacoustic mapping the seafloor in order to locate shipwrecks, lost airplanes, mines and mine-like objects [19], all types of debris lying on the bottom, detecting cables and pipelines [20,21] or marine archaeological sites [22]. At present, side-scan sonar is considered one of the most effective systems for the geological and geomorphological mapping of the seabed [23,24,25], environmental examination, benthic habitat mapping [26] and underwater resource exploration [27,28,29]. In recent years, law enforcement agencies have increasingly used SSS in the search and detection of drowning victims, sunken property and other evidence of crimes [30,31,32]. Using the side-scan sonar technique, it is now possible to produce accurate, aerial-like images of the seafloor [7,33]. However, the interpretation of acoustic data (sonograms) requires extensive knowledge and skills, and its acquisition requires many years of practical experience [34]. What is more, interpretation of side-scan sonar images requires an understanding of the intrinsic limitations of the data acquisition system and fundamental knowledge of how a sonogram is created and what are its inherent features [35]. According to Zhu et al. [36], object detection and recognition from sonar images are mostly based on the manual interpretation and skills of the sonar operator. Yu et al. [37] share this opinion, but at the same time, point out that more often the automatic target recognition (ATR) from SSS images, such as the machine learning (ML) method and deep learning (DL) method, are used.
Side-scan sonars are most often built and used in several configurations. These systems are mounted on a towfish and towed by a vessel attached to the ship’s hull (hull-mounted sonars, HMS) or directly mounted on an AUV/USV for deepwater imaging [38]. In shallow waters, where towing would be impossible, SSS is used as a pole-mounted sonar installed from the bow or side of the boat. The side-scan sonar consists of two linear transducers designed to generate short acoustic pulses within the beam, which is wide in the vertical plane (40–60°) and narrow in horizontal plane (0.2–4°) [39]. The beams intercept the seafloor in thin stripes and the backscatter signal are recorded as time series across the stripes, revealing textural differences in the seafloor.
Successive pulses produce thin lines of data that, when combined, create a complete and accurate image of the seabed visible on a monitor screen. This image changes continuously, according to the change in the ship’s position. The amplitude of the reflected signals depends on the backscatter strength and the composition of the seabed material or targets [40]. The reflected acoustic wave is received by the same pair of transducers and is converted into an electrical signal, which, after being amplified and digitized, is sent to the topside unit. The energy returned from the seafloor insonification (backscatter) is displayed as a function of travel-time using a nominal sound velocity in the water column [41].
Underwater targets such as wrecks or other man-made objects will sometimes protrude above the seafloor, and thus cast a recognizable shadow [42]. Objects different in composition than the bottom surface will stand out from the surroundings and present a change in the acoustic backscatter. Strong reflectors are traditionally plotted as dark, and shadows as light [43]. The importance of the acoustic shadow is unquestionable because the information value that the shadow carries is often much more valuable than the echo itself. Pailhas et al. [44] claim that contemporary side-scan ATR algorithms heavily depend on the target’s shadow for detection and classification. They believe that at low resolution, information about the target is contained mainly in its shadow. Reed et al. [45] think similarly, and at the same time, they are of the opinion that the appearance of the shadow region is more constant than the highlight area and is subject to change with the sonar conditions. This has led to active research being carried out in shadow extraction techniques.
Sonar frequency is a factor influencing the quality of images [46]. In order to increase the sonar resolution—and by doing so, the overall quality of sonar images—manufacturers have chosen to increase the frequency [47]. At higher frequencies, the sound wavelengths are shorter and SSS is capable of picking out finer roughness more effectively. Shultz et al. [48] point out, however, that sometimes an increase in the acoustic signal frequency may not result in an improved quality of the imagery as increased false reflection features (clutter) may cause difficulties in distinguishing underwater objects. The along-track resolution of SSS is dependent on the horizontal beamwidth, which cannot be controlled by the operator [49]. Other parameters that affect the along-track resolution and can be selected by the operator are the towing speed, operating range and ping rate. In turn, the across-track resolution (range resolution) mainly depends on the pulse length of the acoustic beam [50]. The range resolution is also a function of the speed of sound in water and the local grazing angle.
At present, SSS systems are available at many frequencies and resolutions and users can select the appropriate one based on the future purpose of the survey performed. Low-frequency side-scan sonar operates at frequencies of a few kHz to tens of kHz, ensonifying many kilometers in a single pass; however, the resolution of these systems is low [51]. A high-frequency (HF) sonar features higher spatial resolution over limited ranges. For this reason, the frequencies used for sidescan systems are generally relatively high (in the order of hundreds of kHz).
If the towfish altitude is less than one quarter of the maximum slant range, SSSs present reasonably undistorted images with minimal computational effort. The quality of sonar data and accuracy of interpretation can be improved if the operator has a fundamental knowledge of the sonar theory and underwater acoustics. The experience and practical skills of the sonar user also affect the quality of the data recorded using SSS. To maximize the along-track resolution, they began to produce systems with extremely narrow horizontal beam patterns.
In this article, the impact of sonar resolution on the quality of acoustic imagery is presented. The paper also demonstrates the invaluable role of the acoustic shadow in the analysis and interpretation of sonar data. Some wrecks in the Baltic Sea were identified thanks to, among other things, the unusual properties of acoustic shadows.

2. Materials and Methods

2.1. Underwater Targets Selected for the Research

In order to demonstrate the influence of the side-scan sonar resolution on the quality of sonar imagery, three underwater objects were selected, and research was carried out using a towed system and hull-mounted sonar. The targets of the research were the shipwrecks of the German tanker Franken, minesweeper Delfin and passenger ship MV Wilhelm Gustloff, all located in the Baltic Sea, Polish Exclusive Economic Zone (EEZ). Franken (179 × 22 m, draft 10.2 m) was a supply ship of the German Kriegsmarine, built at the Deutsche Werke A.G. in Kiel in 1937, launched on 8 June 1939 [52]. The ship operated in the Baltic Sea, supplying the German navy with fuel during WWII. She was sunk near Hela on 8 April 1945 after bombardment by a Russian aircraft. The wreck lies at a depth of 47–72 m. The bow of the Franken is located 420 m away in the NE direction. Minesweeper Delfin (41.9 × 7.7 m) was built in New York at the Robert Jacob Islands shipyard in 1942 [53]. Delfin was used not only for her intended purpose in the trawling service, but also periodically performed supervisory tasks. The Delfin hull was wooden to protect it from damage in contact with magnetic mines. The place where the Delfin lies at the bottom is seven nautical miles from Hel and four nautical miles from Jastarnia at a depth of 16–18 m. MV Wilhelm Gustloff was a military transport ship built in 1937 in the Hamburg shipyard of the Blohm und Voss company. She was 208 m long and over 23 m wide. In the beginning, WG was a passenger ship, then a hospital ship, and from 1940, it served as a training base for submarine crews, located in Gdynia. Wilhelm Gustloff was sunk on 30 January 1945 by Soviet submarine S-13 in the Baltic Sea [54].
In order to demonstrate the influence and importance of acoustic shadow on the possibilities of the visualization and interpretation of sonar data, a survey was performed on three additional underwater objects. The wreck of the Norwegian motor freighter MS Goya, the wreck of the fishing boat KOŁ-38 and the wreck of the passenger liner SS Steuben were selected for testing. The motor ship Goya was built and launched in April 1941 in one of the Norwegian shipyards. The Goya, with a capacity of 5230 GRT, 141.2 m in length and 17 m in width, initially served as a merchant transport ship in the Baltic Sea [55]. In 1942, she became an auxiliary ship of the Kriegsmarine, later a tender of the training submarine flotilla. In the last year of the war, it was intended to evacuate soldiers, wounded and refugees west from the Baltic ports. The transport ship Goya was sunk 22 nautical miles North of Rozewie and lies at a depth of 74 m. General von Steuben was a German steamship built in Munchen in 1923 at the Vulcan shipyard. A luxurious passenger ship with a length of 168 m, a width of 19.8 m and a draft of 8.5 m, it had a speed of 16 knots. In 1938, she was renamed Steuben. During WWII, the ship served as a troop accommodation vessel, and from 1944, as an armed transport ship. Steuben was torpedoed in 1945 by Soviet submarine S-13 and sunk with an estimated total number of victims of 4000 [56]. Koł-38 was a 17 m long fishing boat that sank in 2003. It lies at a depth of 51 m. The location of all the targets designated for research is shown on the chart in Figure 1.

2.2. Sonar Systems Used for the Research

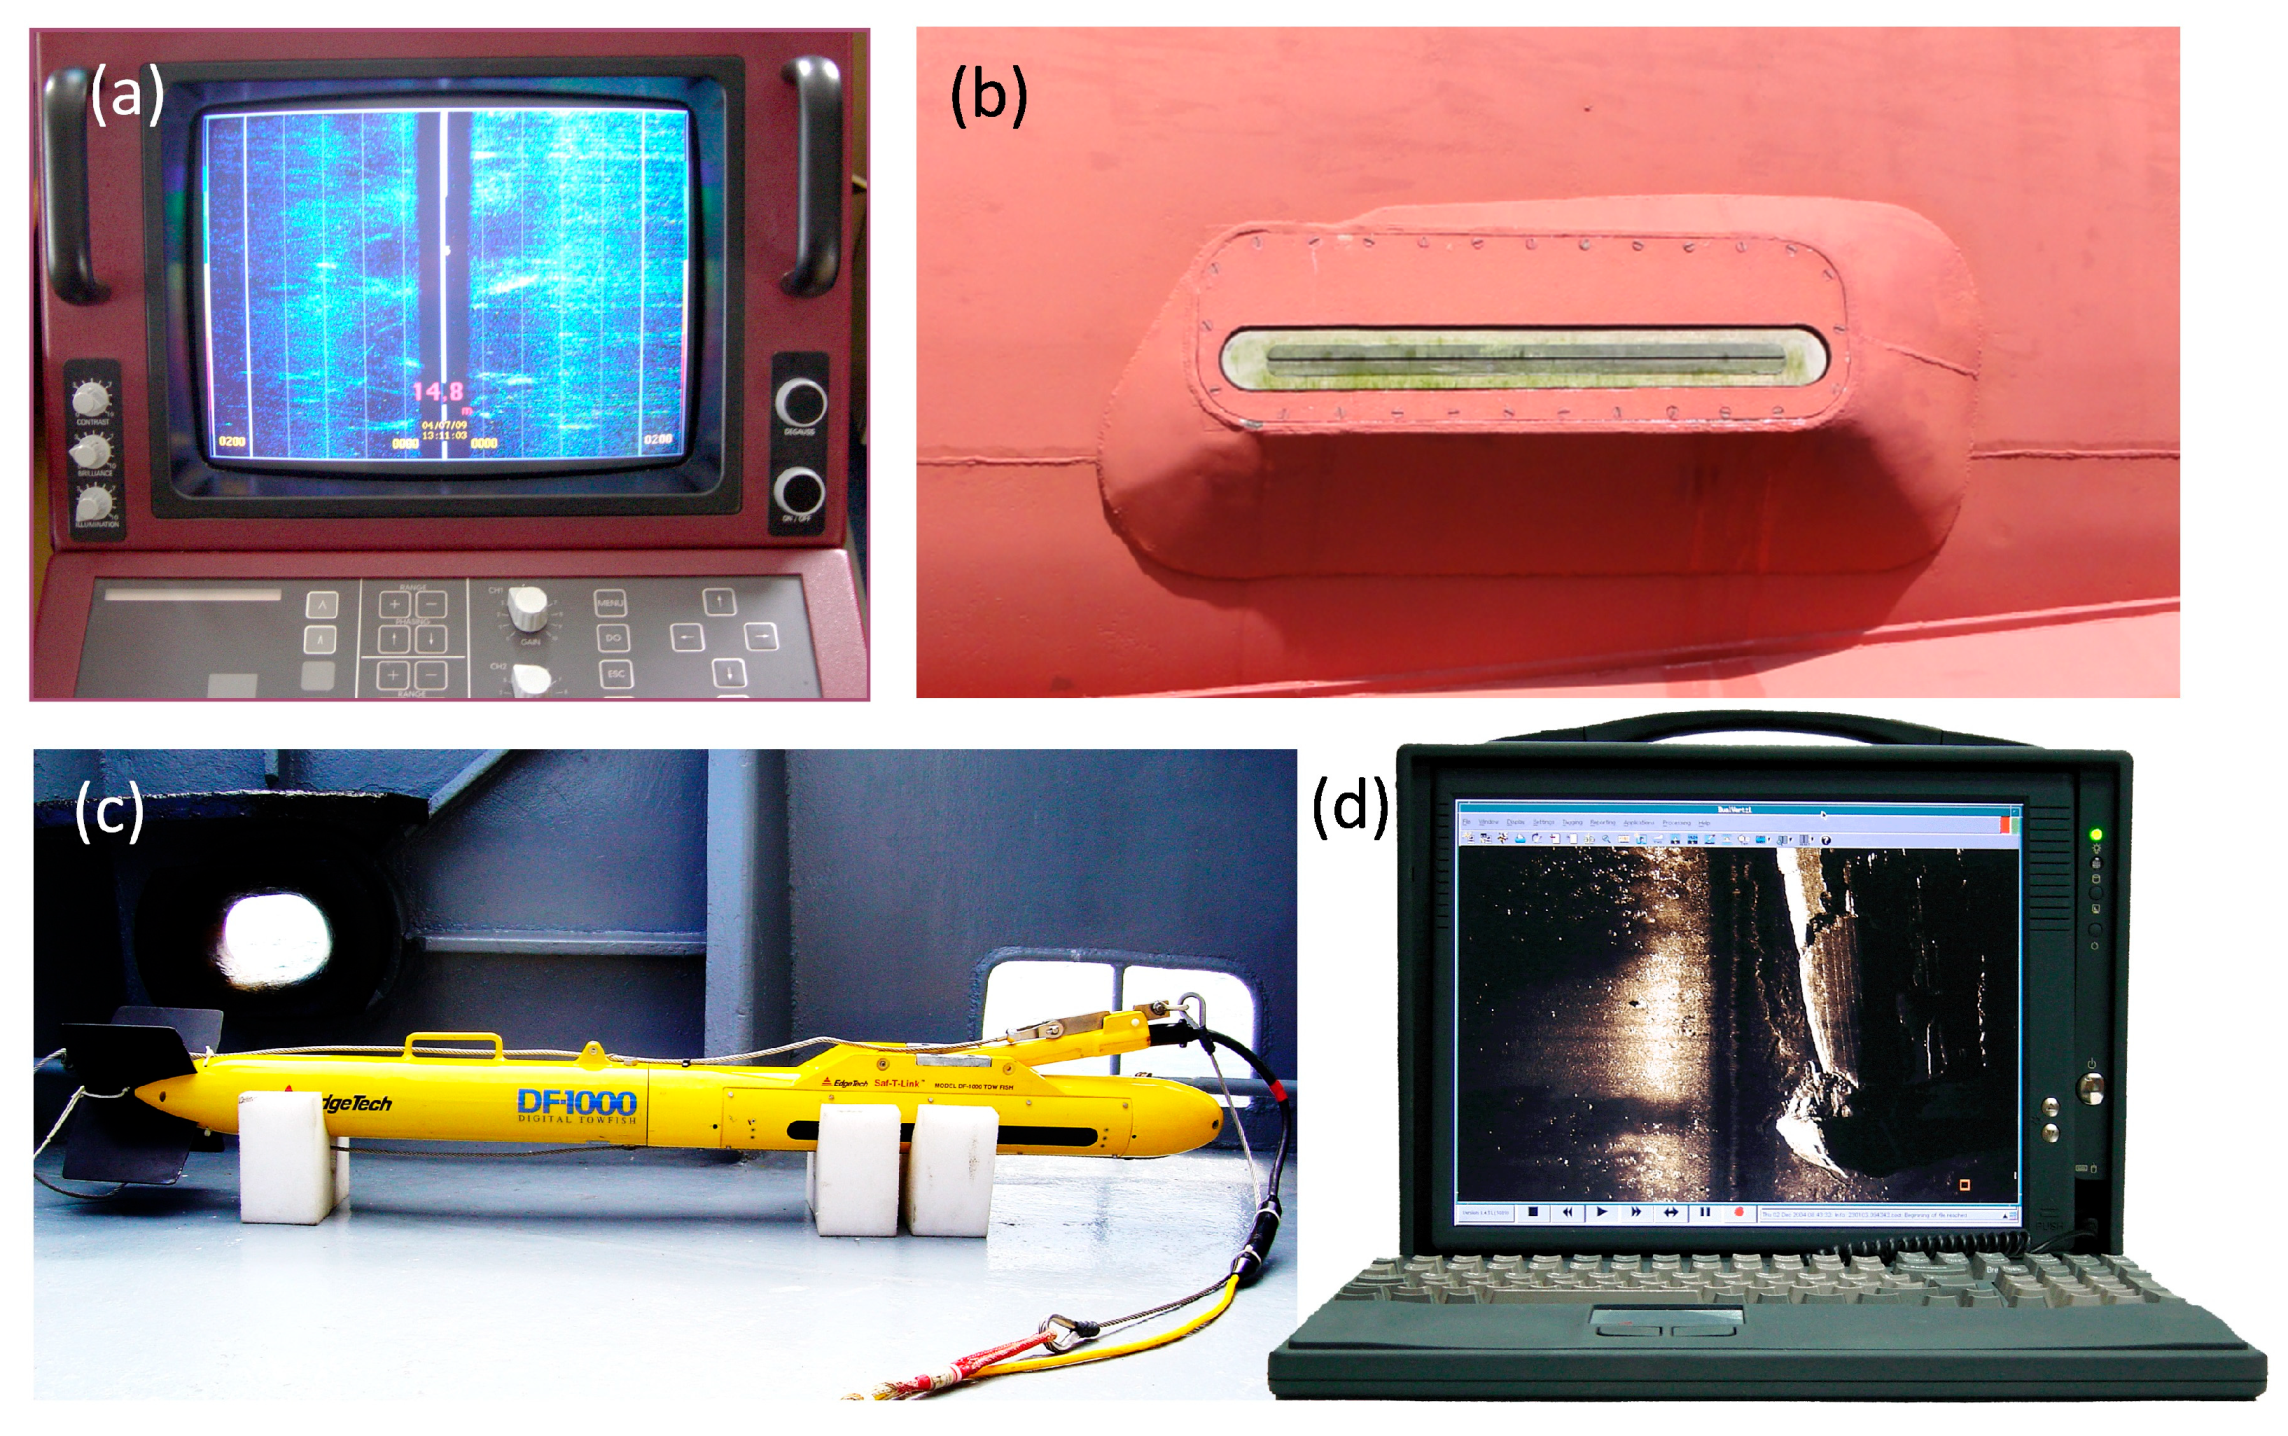
Two sonar systems were used in the research: EdgeTech DF-1000 side-scan sonar (EdgeTech, Wareham, MA, USA) and hull-mounted sonar Acson-100 (Autocomp Management, Szczecin, Poland). DF-1000 is a sonar designed for towing operation, during which the digital communications link enables both standard 100 kHz frequency and high-resolution 500 kHz frequency data to be simultaneously transmitted to the surface for processing. System components include model DF-1000 digital underwater towfish, modem device (DCI card), towfish power supply, tow cable and PC-based sonar processor. The main characteristics of the DF-1000 are presented in Table 1.
Acson-100 is an analog, hull-mounted sonar whose transducers are permanently mounted in the ship’s hull, below the waterline. This system is a low frequency sonar utilizing 100 hHz acoustic signal. The basic features of Acson-100 are shown in Table 2.
Towing side-scan sonar is a common, very convenient and low-cost method for surveying in deep waters. By reducing the distance between the transducer and seafloor, the maximum shadow effect is achieved. The ability to tow the sonar below the thermocline layer is also a valuable advantage. Moreover, separating the transducers from the hull of the towing vessel resulted in a reduction in the impact of the vessel motion on the sonar imagery. In shallow waters, under 20 m of depth, towed SSS is exposed to ships and surface interferences due to the sonar attitude in the water column. What is more, there is the risk of running the fish aground. Hull-mounted sonars are mostly used in shallow waters, inland reservoirs and harbors. The positioning of targets by HMS is more accurate than the towing method. The disadvantage of this type of sonar is its lower resolving power due to the transducer–seafloor distance and the geometry of the propagating acoustic pulse. Figure 2 shows the towed and hull-mounted sonars along with the data acquisition consoles that were applied to the research at sea.

2.3. Field Survey and Data Acquisition

These studies were conducted within the boundaries of the Polish EEZ, in six different locations of the Baltic Sea. The Polish Navy hydrographic ship Arctowski was used as a survey platform. In order to properly use the side-scan sonars, several survey lines were planned parallel to the long axes of the wrecks and at a specific lateral distance from the objects. For this purpose, the Qinsy software package ver. 7.5 (developed by Quality Positioning Service, Zeist, The Netherlands) was used. The DF-1000 was towed at an altitude of 10–20% of the sonar range at a speed of 2–4 knots. A 200 m long lightweight Kevlar cable was used for measurements. During the survey, the sea was calm and there were no waves. Before the survey started, the speed of sound in the water column was measured and its average value was entered into the CODA DA-25 data acquisition system. The towfish was positioned using the layback and offset method. The side-scan sonar data were acquired using an Edgetech DF-1000 towfish, operated at 100 and 500 kHz. During field operations, the sonar was tuned and adjusted to find the optimal combination of control settings and sonar height that yielded the best resolution. These data were displayed on the recorder aboard the ship. Vessel speed from the navigation computer was continually input to the side-scan sonar system for automatic longitudinal correction of the sonar records.
Sonar surveys comprised consecutive passes recorded over each shipwreck, ensonifying it from both the right and left side of the wreck. Typical recommendations for planning tracklines in sonar surveys can be found in the International Hydrographic Organization (IHO) publication [6]. These passes were later processed on a computer workstation and analyzed to choose the appropriate sonograms for comparison. In order to accurately determine the position of a side-scan sonar targets, first the position of the vessel was determined and then that position was translated to the towfish. The typical inputs for the layback estimation to work were distance between GPS antenna and A-frame, height of the cable block on A-frame, towfish depth and the amount of tow cable deployed astern. The layback was calculated from:
S l = a l + 0.9   x   c a b l e   o u t 2 h a + S d 2 ,
where:
  • S l side scan sonar layback [m];
  • a l distance between GPS antenna and A-frame [m];
  • h a height of cable block on A-frame above water line [m];
  • S d depth of side-scan sonar [m].
The depth of side-scan sonar was calculated based on two variables:
S d = W d S a ,
where:
  • W d water depth [m].
  • S a side scan sonar altitude [m].
The factor 0.9 in Formula (1) results from the fact that the sonar cable paid out does not take a straight line path from the tow point to the towfish. The tow cable is actually in an irregular catenary in both the horizontal and vertical planes. The geometric variables necessary to calculate the sonar position are shown in Figure 3.
The sonar data were logged digitally to the hard drive of the computer system and each ping was tagged with all pertinent data, such as towfish position, heading speed, time, date, altitude, depth, etc. Digital data collection permitted the application of slant range corrections to all imageries.

3. Results

As a result of the sonar surveys of six shipwrecks in the Baltic Sea, acoustic backscatter data were recorded from two independent systems: the hull-mounted sonar Acson-100 and the EdgeTech DF-1000 towed side-scan sonar. Then, some sonar imageries from the first and second system were selected, especially those showing a similar layout of the wrecks. The first two wrecks, Franken and Delfin, lay in the Bay of Gdańsk.
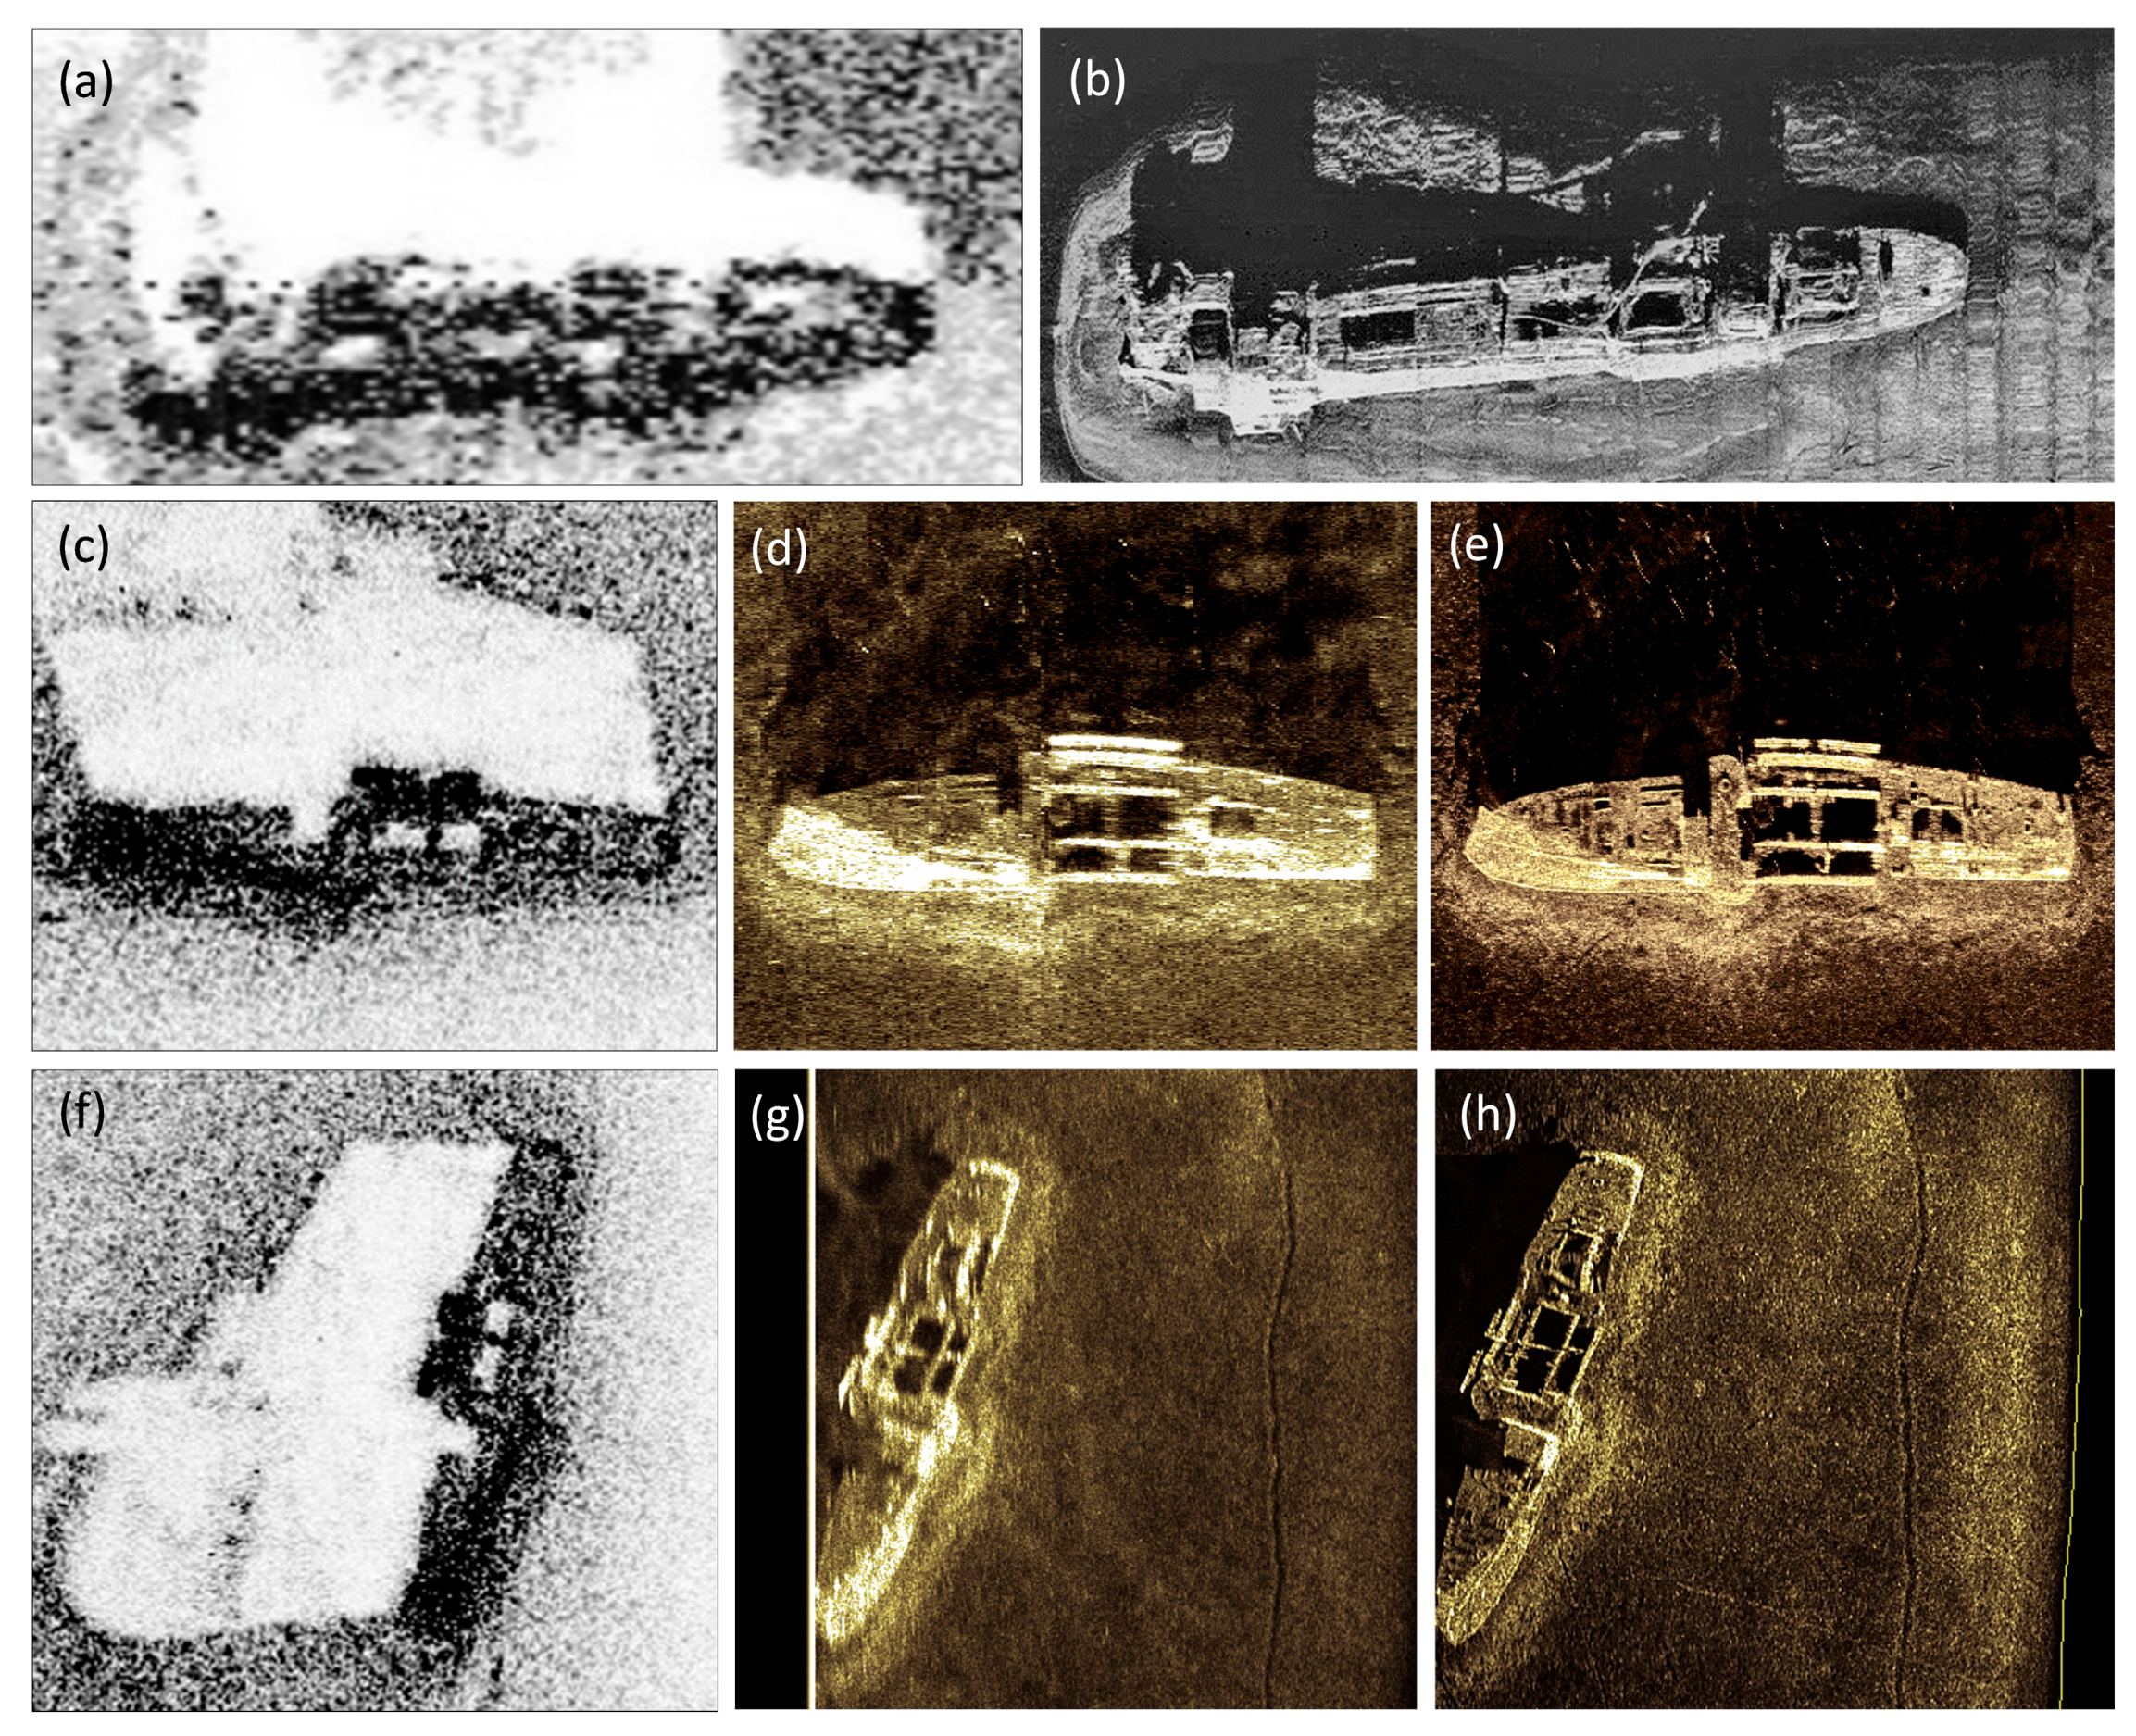
The first test object was the German transport ship, Franken. Figure 4a,b present the ship’s sonar images, which differ significantly, mainly in terms of quality. The imagery in Figure 4a is blurred, not very sharp and lacks the required detail. The lack of detail makes it difficult to clearly determine the object we are dealing with. For comparison, the sonogram in Figure 4b is sharper and clearer. The image is vivid, making it easy to identify a ship’s hull with holds, a superstructure and a funnel at the stern.
Figure 4c–h are the examples of how the imagery resolution varies with the change in the acoustic signal frequency and the sonar technology. Of all six pictures, the sonograms in Figure 4c,f have the worst quality. These data were recorded with an analog hull-mounted sonar operating at a rather low frequency of 100 kHz. The two subsequent sonograms (Figure 4d,g) feature slightly better resolution. Even though these data were also recorded on the 100 kHz low-frequency channel, they are definitely more readable than those presented in Figure 4c,f. The last two sonograms in Figure 4e,h are the acoustic data derived from the DF-1000 sonar but recorded at a frequency of 500 kHz. These images are characterized by high resolution and sharp contrast, and closely resemble photographic quality photos.
The third research object was the Wilhelm Gustloff shipwreck, lying at a depth of 45 m. Figure 5a shows a sonogram obtained using a hull-mounted sonar operating at a frequency of f = 100 kHz. The image shows the general outline of the hull, with a distinct acoustic shadow. However, many construction details cannot be distinguished, which can be indicated in the imageries presented in Figure 5b,c. These were recorded with a towed sonar at a frequency of f = 500 kHz from the left and right sides of the wreck. These data are an example of good quality images in which one can recognize elements of relatively small size, such as stern bitts, anchor hawsers, mast or bottom stringers.
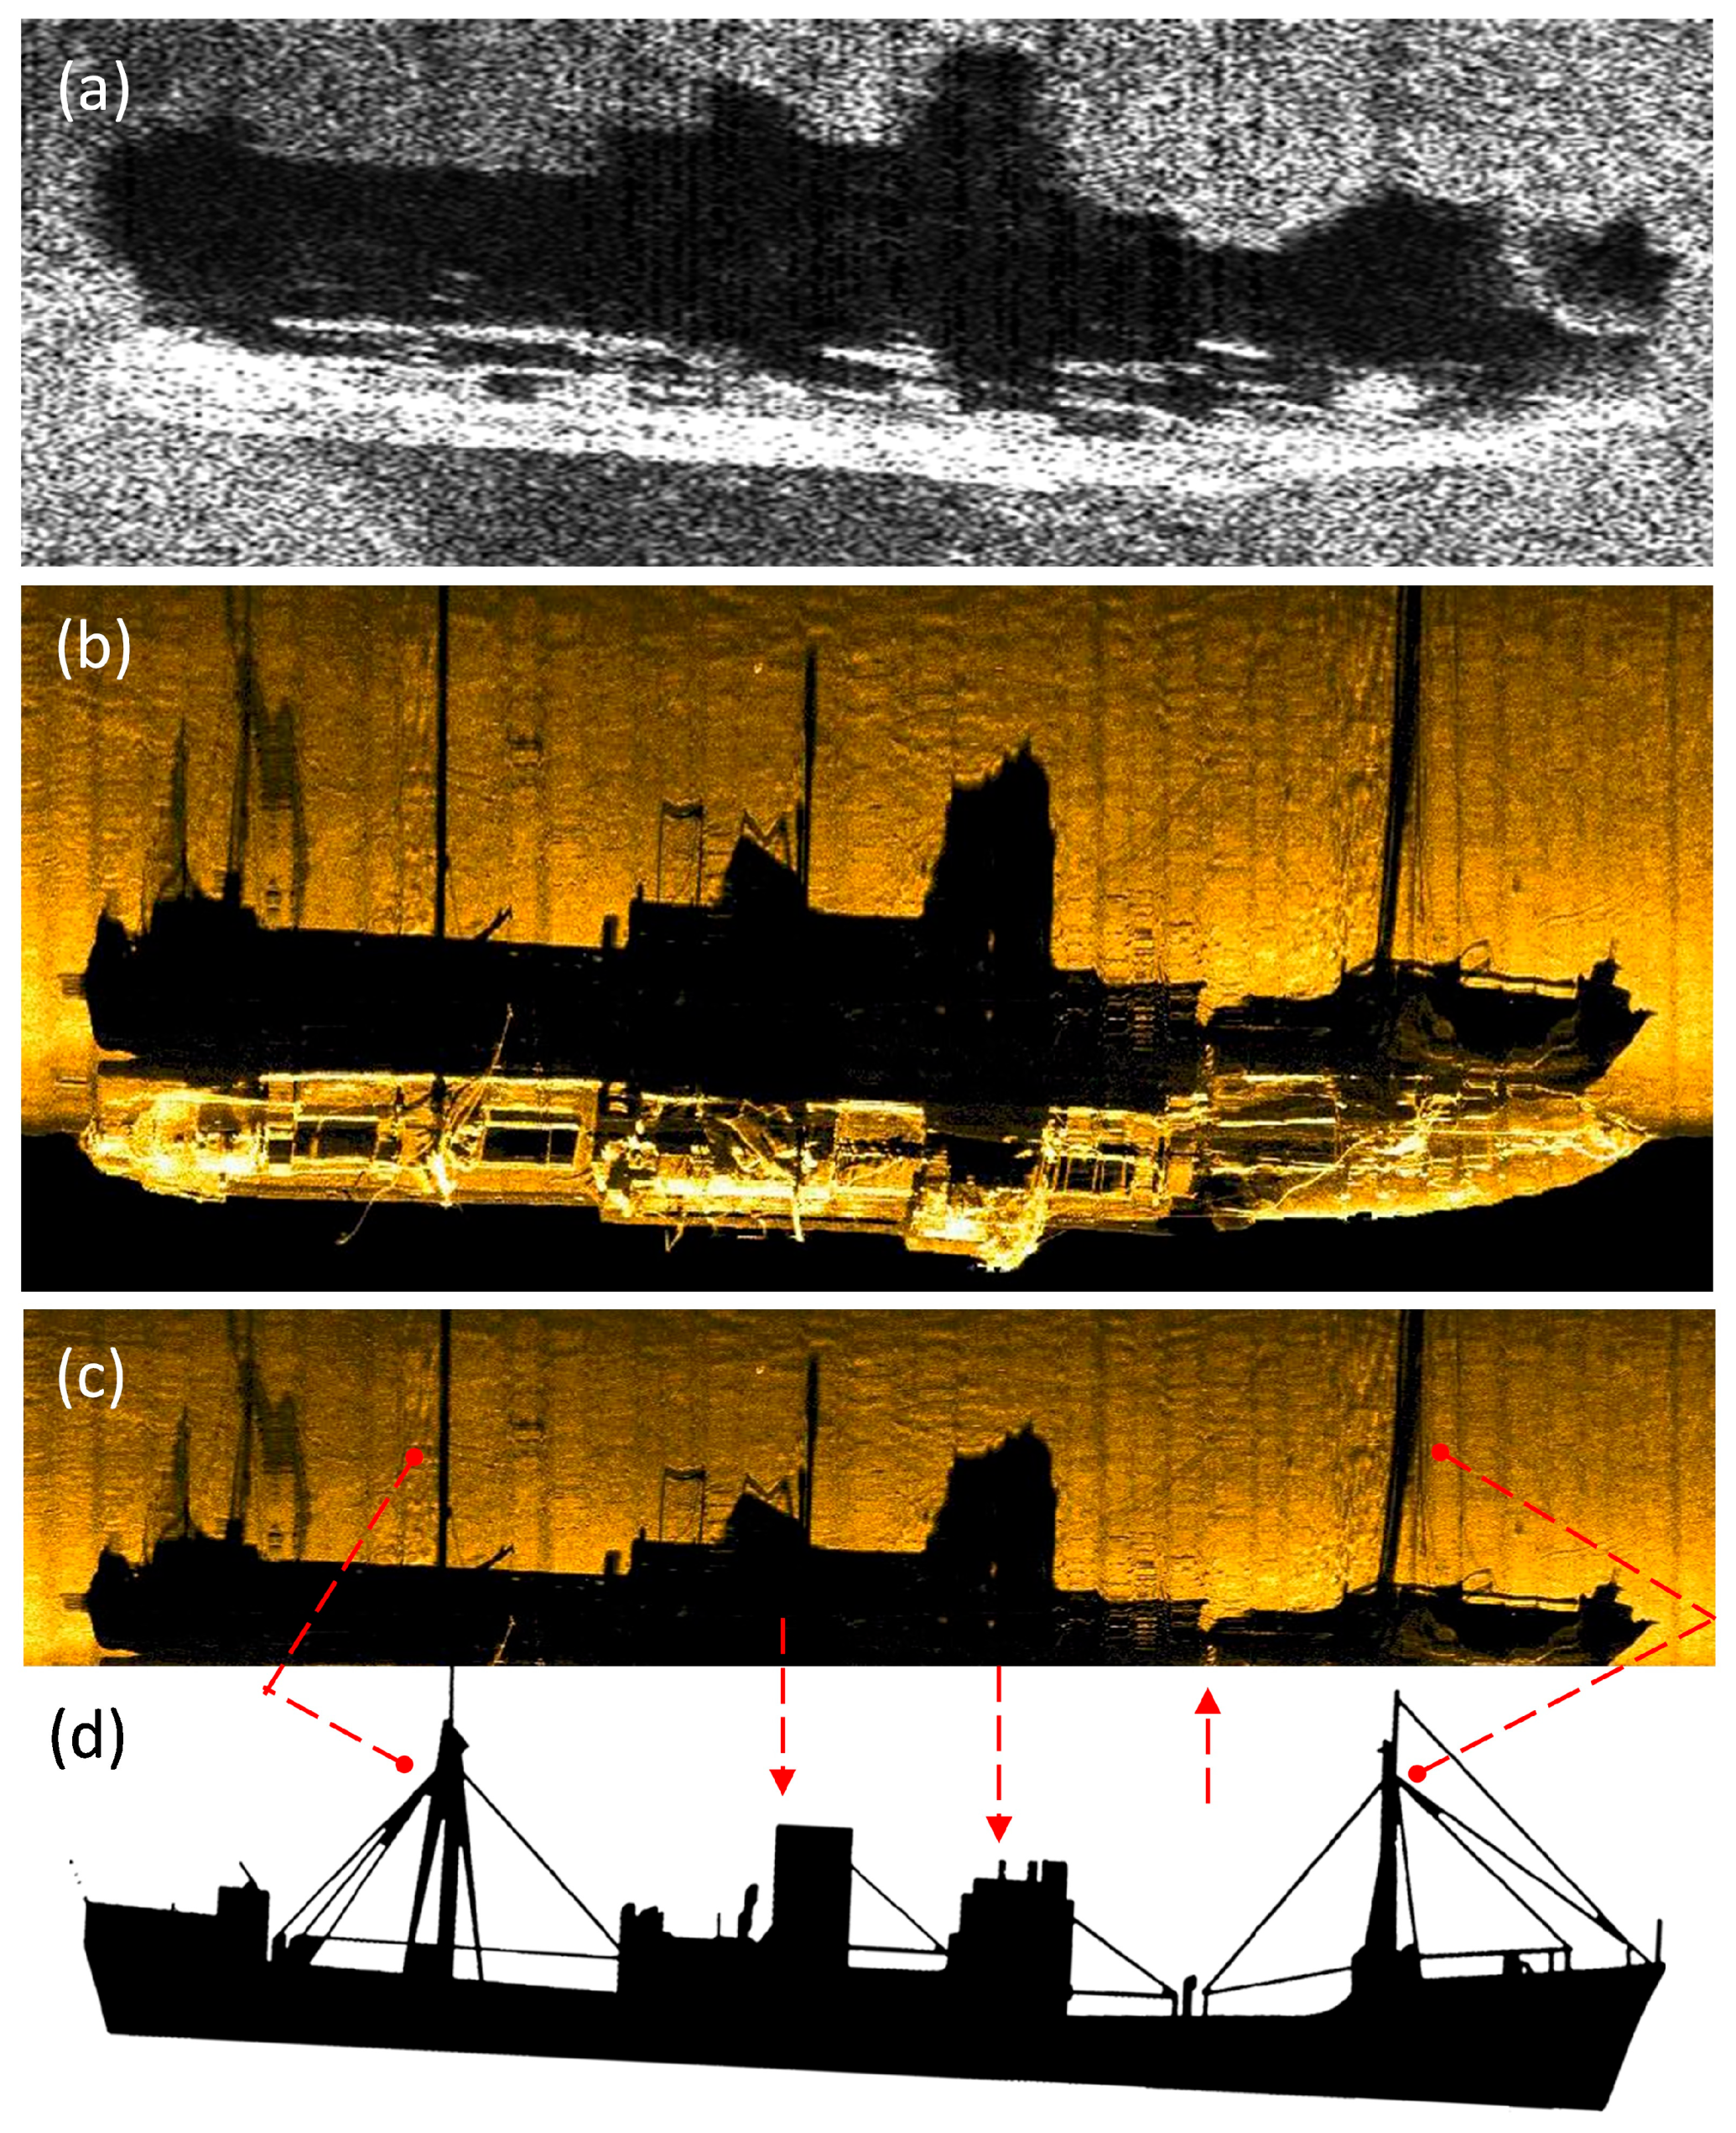
The next three test objects were selected to demonstrate the practical importance of the acoustic shadow phenomenon in sonar research. The Goya wreck stands on an even keel and its hull is intact. This is a great object for capturing acoustic shadowing on a sonogram. Figure 6a,b are also a good example of how the quality of sonar imagery changes as a function of the frequency of the acoustic signal. The sonogram shows the entire shadow cast by the wreck, except for the masts, the shadow of which, due to their physical dimensions, does not fit in the waterfall display window.
Figure 6c shows the outline of the acoustic shadow cast by the wreck’s hull on the seafloor surface. This shadow was derived from the sonar imagery for the purpose of comparison with the silhouette of the ship in reality (Figure 6d). It is worth noting a number of similarities between these two materials. For identification purposes, the silhouette in Figure 6d has been shaded in black, just like the resulting sonar shadow. This comparison is proof that the acoustic shadow phenomenon plays a significant role in the analysis of sonar data. The shadow is an accurate projection of the ship’s silhouette, often demonstrating the physical condition of the hull. In the case of the Goya wreck, the acoustic shadow also reveals where the ship’s hull was cracked. Therefore, the acoustic shadow can be an irreplaceable interpretative tool that plays a fundamental role in identifying the wreck and finding out its identity.
The wreck of the fishing cutter KOŁ-38, which sank in 2003, lies quite deep (51 m) and during the research using a towed side-scan sonar, the crew of Arctowski was forced to deploy almost the entire 200 m of cable to obtain the desired sonar height above the sea bottom. In the first stage, the data were recorded using the Acson-100 hull-mounted sonar, but the survey results were not good enough to conclude that it was the wreck of a sunken cutter. The sonogram in Figure 7a actually shows a black echo with a barely visible acoustic shadow. Only the use of the towed sonar and a high frequency of 500 kHz enabled the recording of several sonograms, based on which it was concluded that the searched wreck of a fishing boat was found. Analysis of the acoustic shadow demonstrated in Figure 7c and a comparison with the historical photo (Figure 7d) confirmed the assumption that the fishing boat KOŁ-38 was lying at the bottom. The sonograms in Figure 7b,c are further evidence that the importance of acoustic shadowing in marine research is undeniable and indisputable.
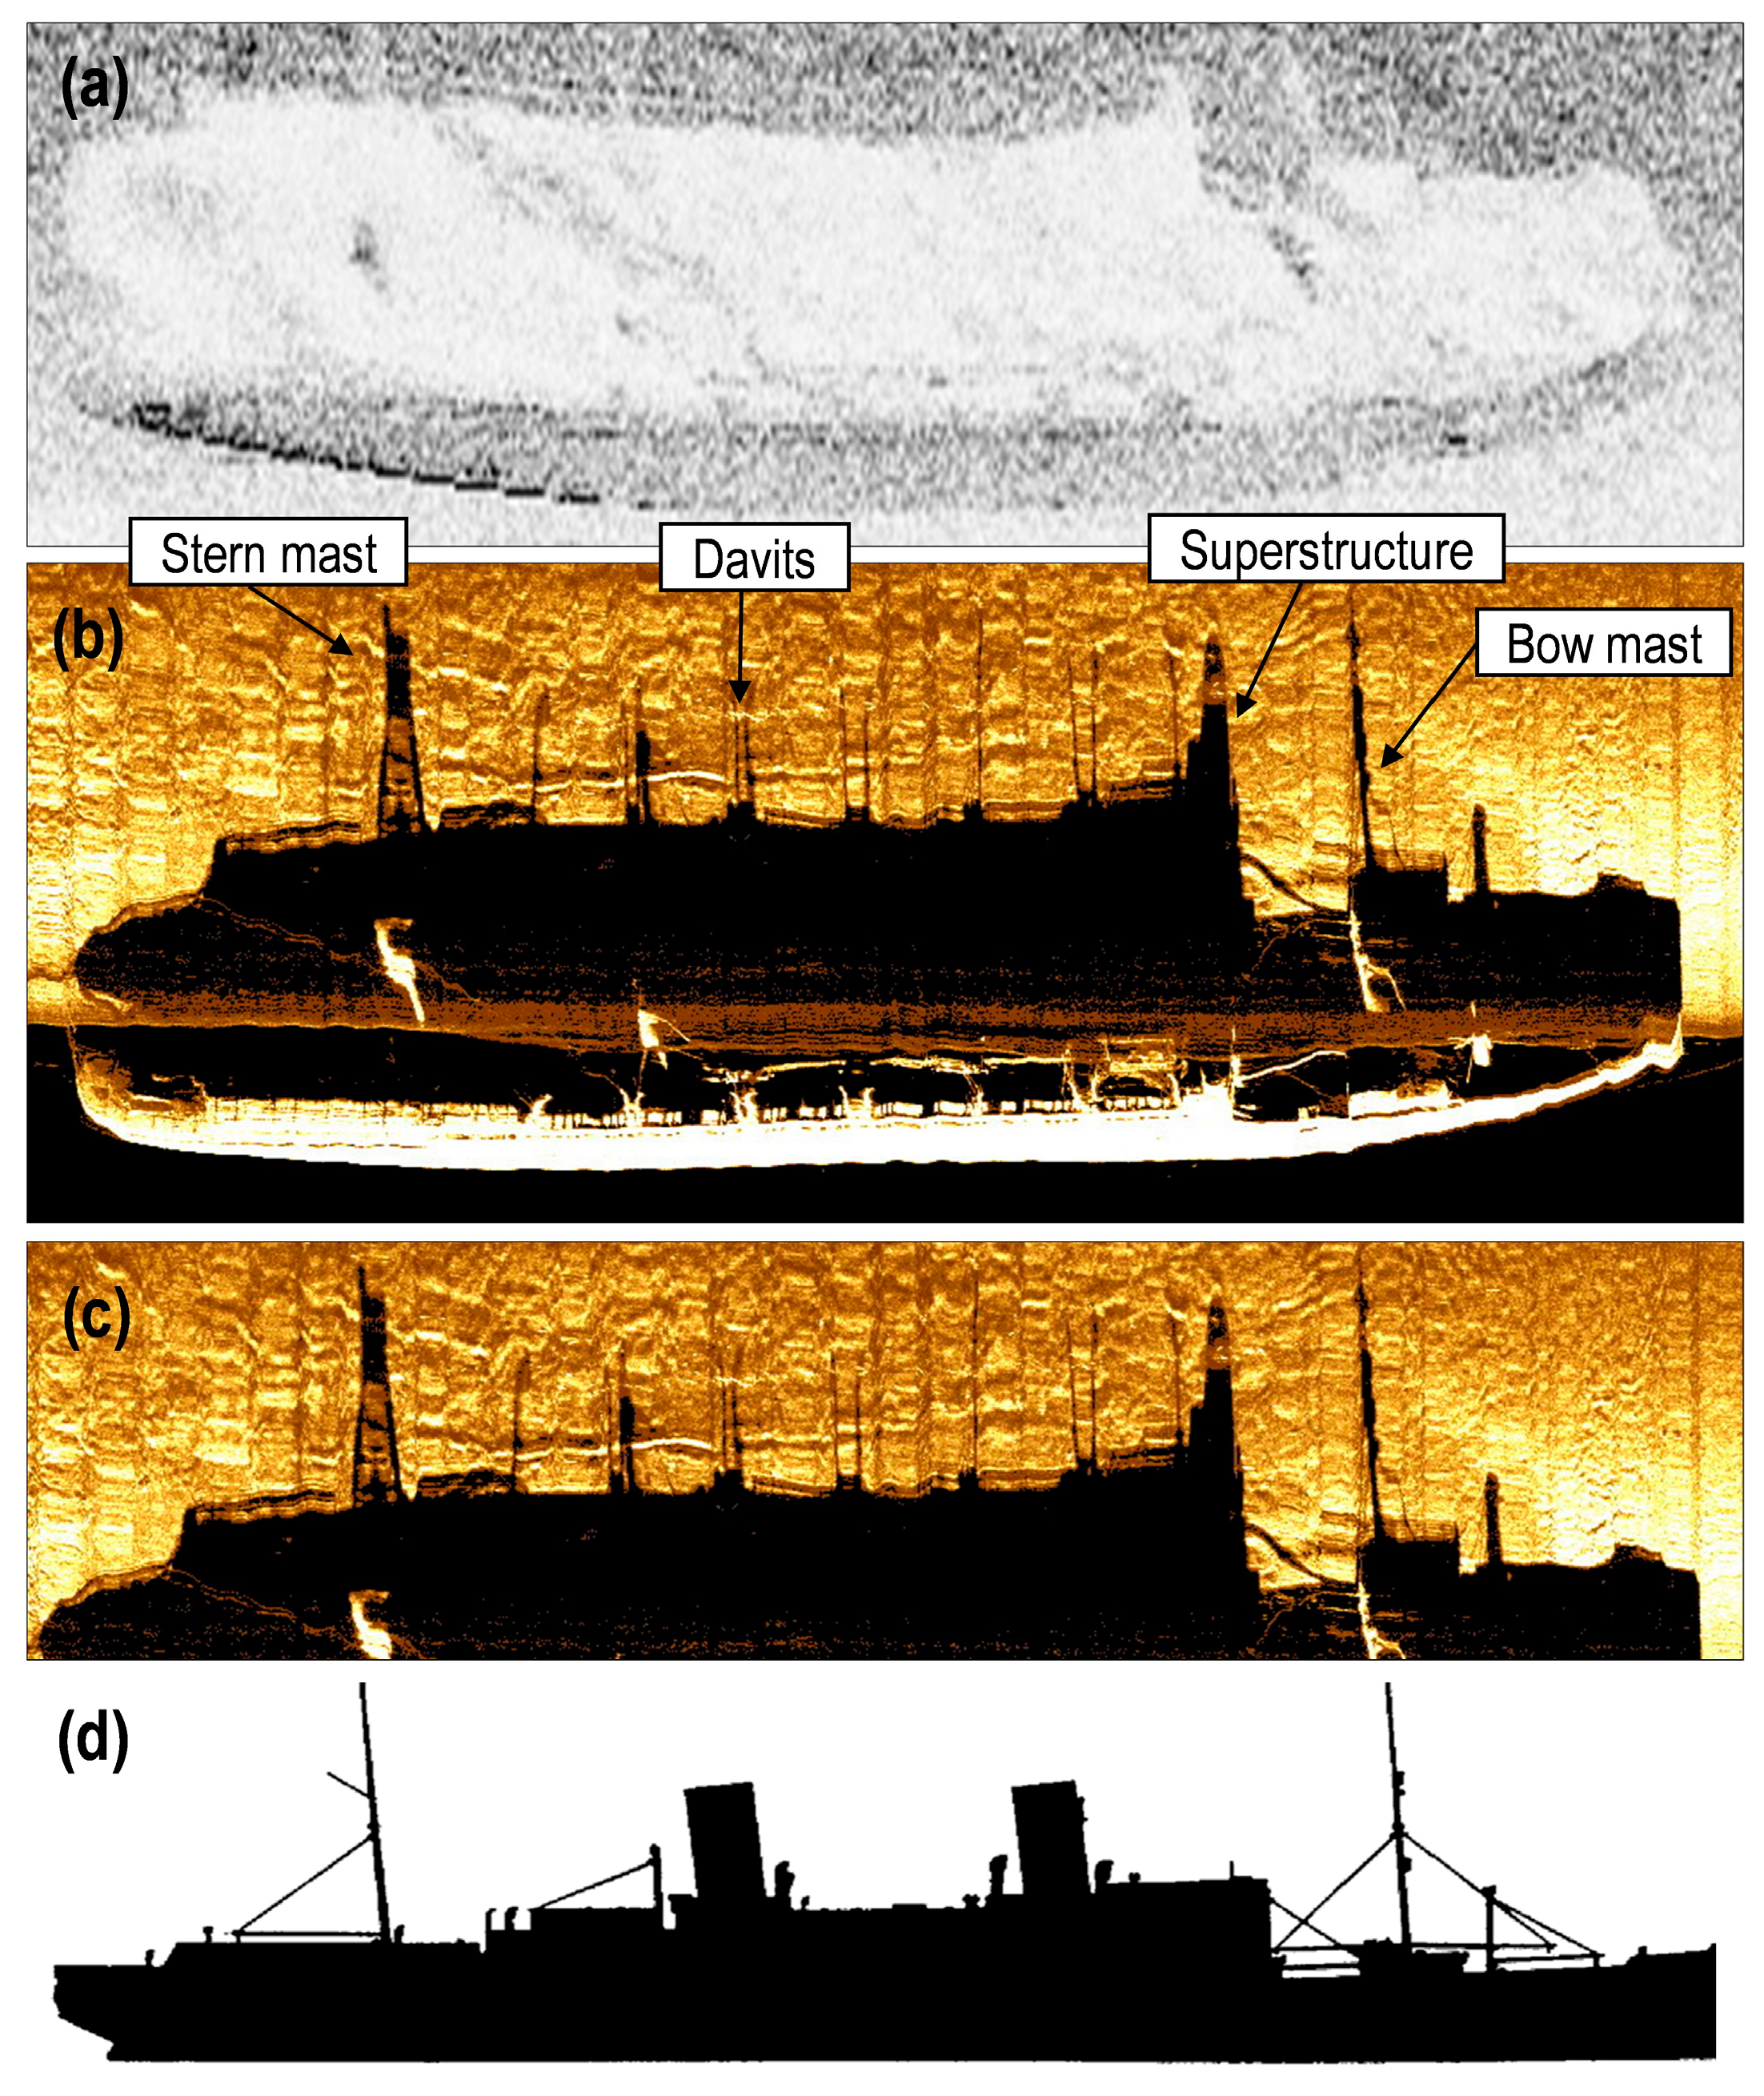
The last shipwreck examined using sonar systems was the wreck of the SS Steuben. This wreck has been searched for 59 years by many researchers, but fate meant that the location of this wreck was confirmed by the crew of the Arctowski ship. During the research of this wreck, several sonograms were recorded using both the Acson-100 and the EdgeTech DF-1000 sonars. The measurements made using the sonar systems showed that the length of the wreck was 160 m, the height of the object was 20 m and the orientation at the bottom was 231°. One of the most interesting sonograms is presented in Figure 8b. The greatest value of this record is the acoustic shadow, clear and sharp, which made it possible to compare it with the silhouette of the ship (Figure 8d). For comparison, the hull-mounted sonar also recorded an image of this wreck, but neither the echo nor the acoustic shadow not represent much value (Figure 8a). For comparative analysis, a shadow from the sonogram was extracted (Figure 8c) and, on the same scale, compared with the silhouette of the ship, intentionally filled with black. As a result, compliance was achieved in the position, size and contours of many structural elements of the hull, masts, booms, boat davits and the superstructure.

4. Discussion

A side-scan sonar system is defined by a number of parameters, among which the resolution is unquestionably quite important. The resolution of the SSS defines the image quality and can be divided, among others, into along-track and across-track resolution. The sonar resolution is an important characteristic because it provides the measure of the detail that is possible to demonstrate on the sonogram. The sonar images recorded using the Acson-100 hull-mounted sonar do not show high resolution, mainly due to the low frequency of the acoustic signal applied to the sonar operation and the reasonable transducer–shipwreck distance. Some sonograms had low resolution and showed only large physical objects on the seafloor. The DF-1000 dual-frequency towed side-scan sonar provides a higher resolution of recorded data, which consequently results in higher imagery detail. The sonar images are sharp and clear, and therefore easy to interpret. With the appropriate processing, acoustic images can be made to resemble easily recognizable photo-like images. The most important feature of the DF-1000 is that sonar signals are digitized in the towfish, so there is no loss of data over long cable lengths.
Side-scan sonar resolution is one of the most important parameters, which is mainly controlled by the transducer beamwidth and pulse length. Feldens emphasized in [57] that the along-track resolution of the sonar mosaics depends on the survey speed and ping rate. He pointed out that in the case of large-scale studies of marine habitats, higher survey speeds and larger sonar operating ranges are often required, which result in reduced along-track resolution. In the German part of the Baltic Sea, larger areas were surveyed with a sonar mosaic resolution of 1 m, while some areas were surveyed at a resolution of 0.25 m. In the case of the study of the six wrecks in the Polish part of the Baltic Sea, the side-scan sonar was towed at a speed of 2–4 knots and the sonar operating range was between 20 m and 75 m. Such survey parameters made it possible to obtain an appropriately high resolution of the recorded sonar images.
Some scientists [58] claim that the resolutions of recorded sonar data are mostly dependent on the sonar specifications. Savini [59] claims that the resolution is not the only parameter affecting the quality of sonar images. The underwater environment (current, density, salinity, etc.) can significantly affect the accuracy of the data and the possibility of its interpretation. Other factors such as the course over ground of the research vessel, the height of the towfish above the seabed and the sonar range in use will also determine the quality of the sonar imagery. Kaeser et al. [60] draw attention to another important aspect of the resolution and quality of sonar images. In their opinion, in addition to the technical parameters of side-scan sonar devices and environmental conditions, the quality of recorded sonar data also depends on the experience and practical skills of the person responsible for using the sonar equipment, data recording and their final processing. Liu et al. [61] proposed a method for sonar image quality improvement. They introduced a pulse compression technique based on the deconvolution algorithm to overcome the limitations of inherent sonar system parameters and to improve the range resolution. To obtain a high resolution in the horizontal direction, synthetic aperture sonar has been developed [62].
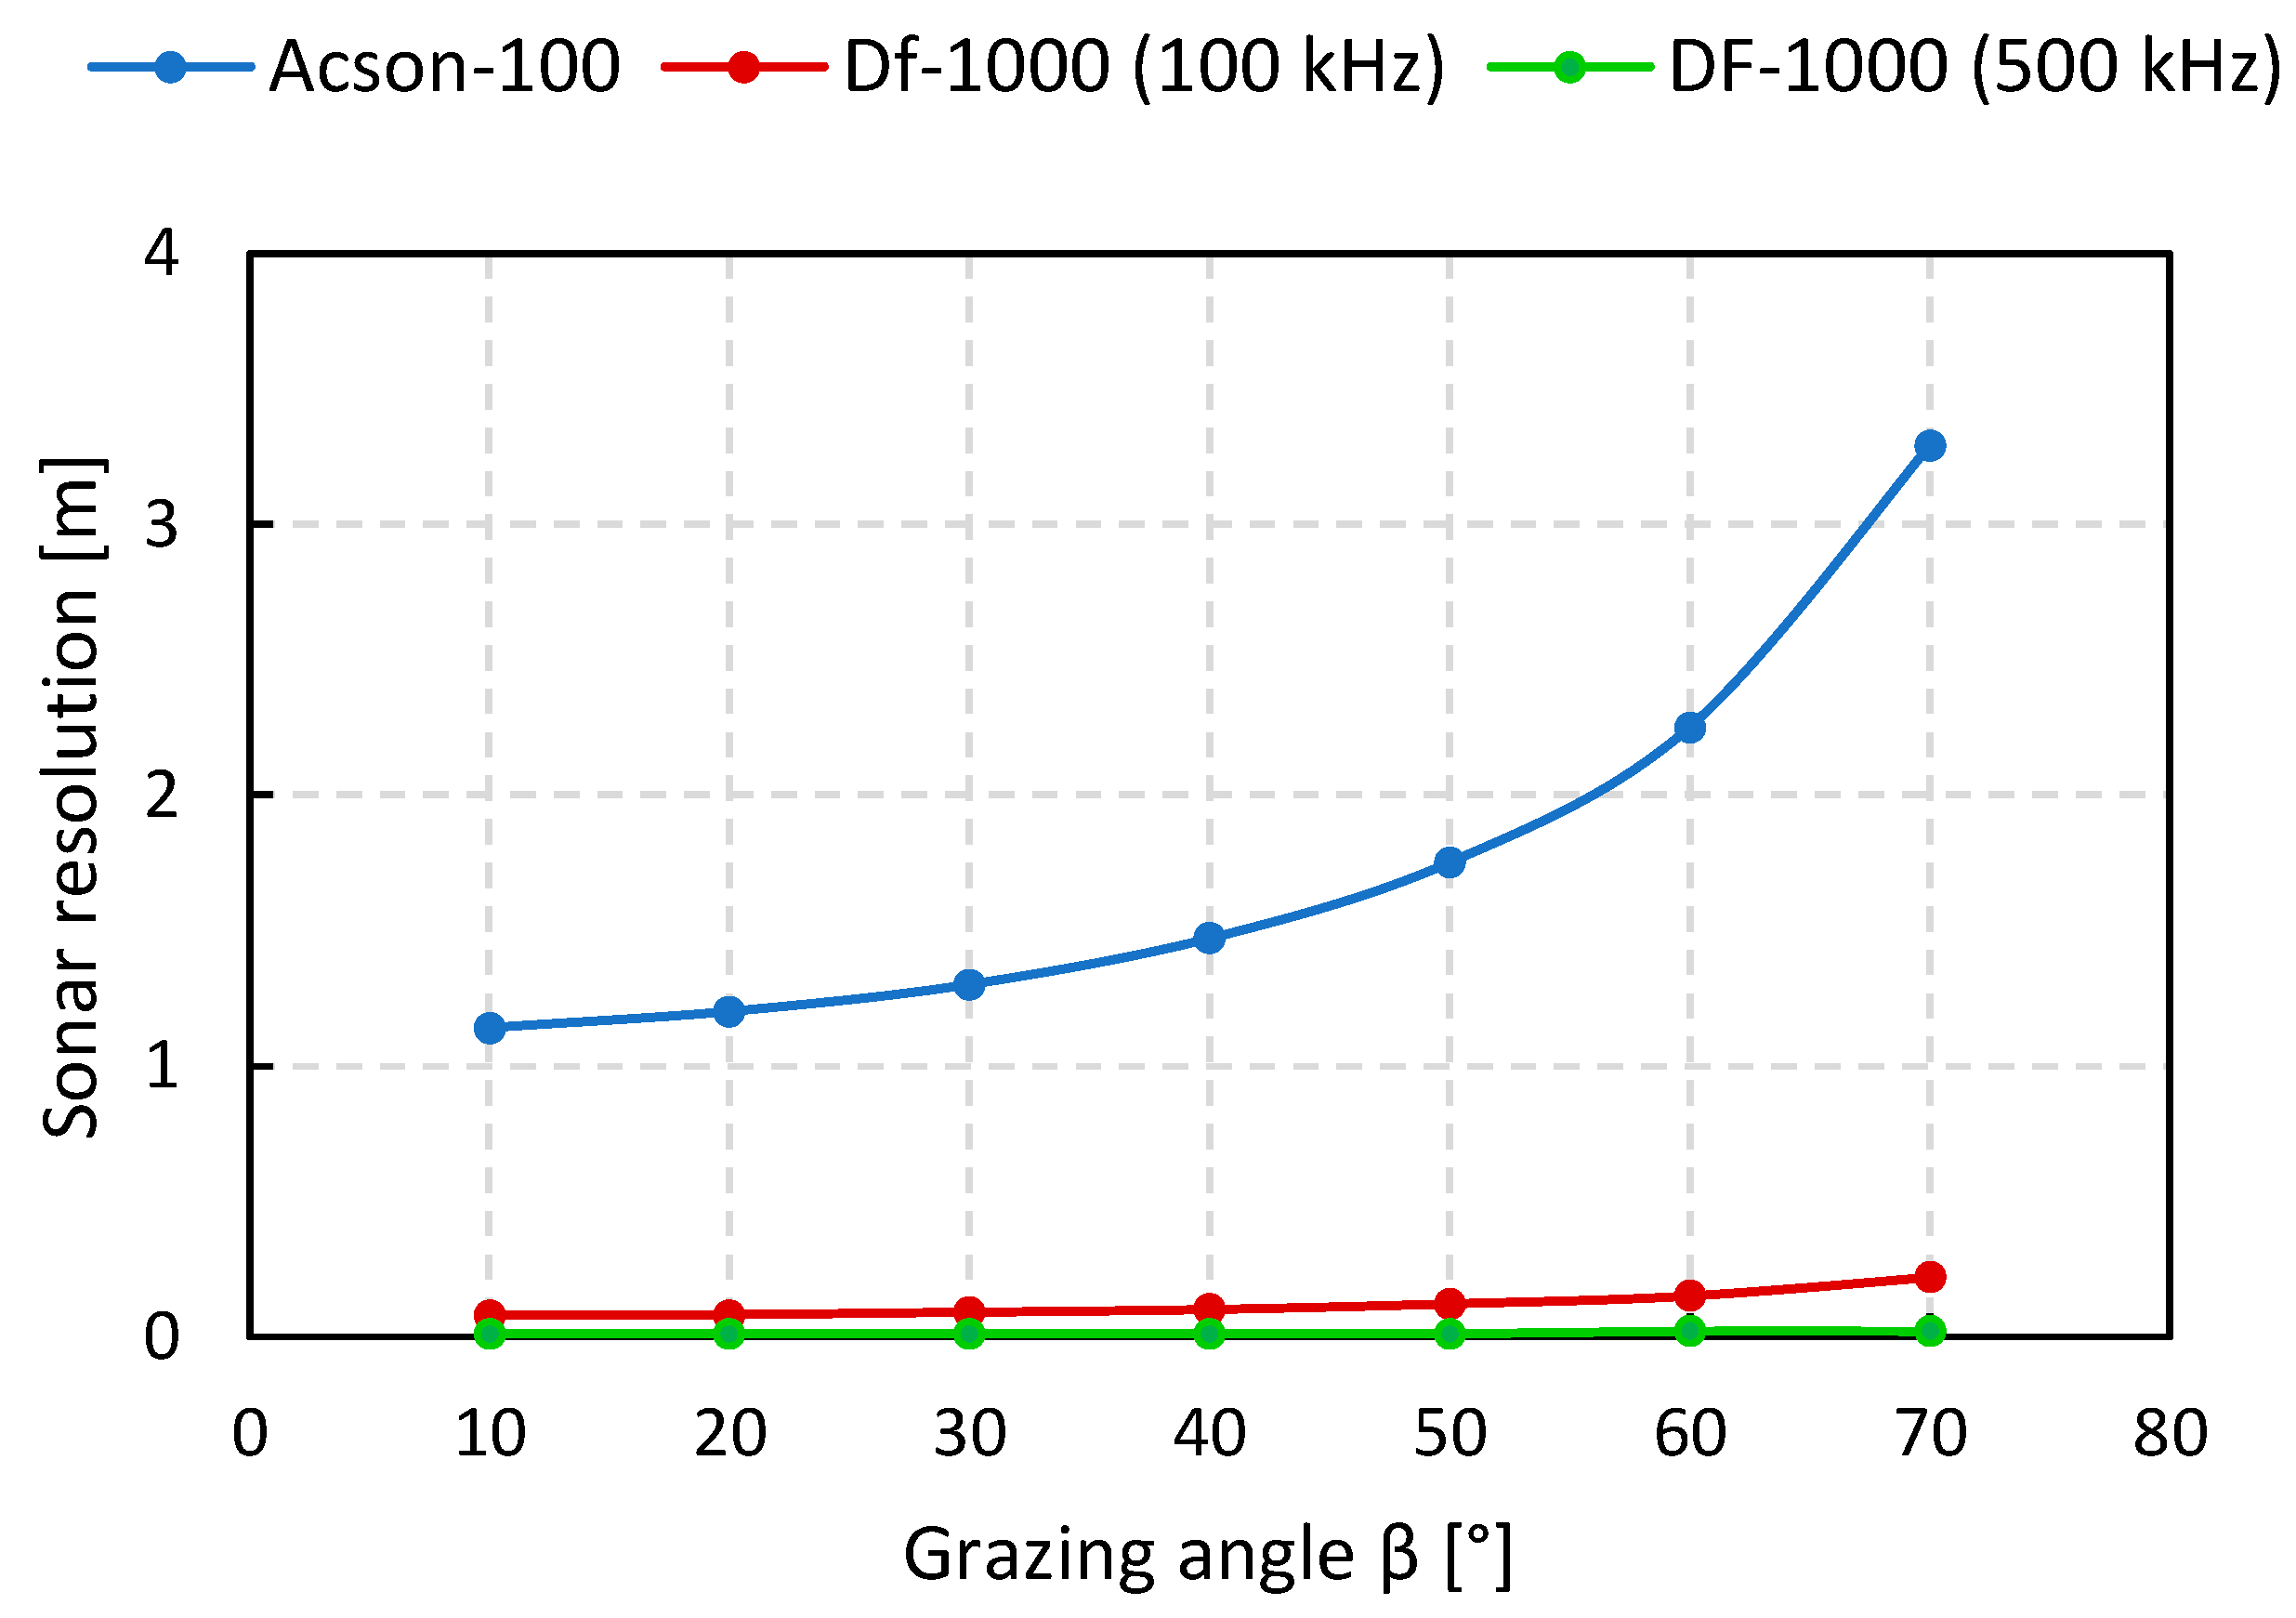
In order to compare the capabilities of two sonar systems, calculations of the theoretical resolution were made, and these are presented in Figure 9 and Figure 10. The across-track resolution Ry is calculated based on the formula [63]:
R y = c · τ 2 · cos β
where: c—sound speed in the water [m/s]; τ—pulse length [s]; and β—grazing angle [°].
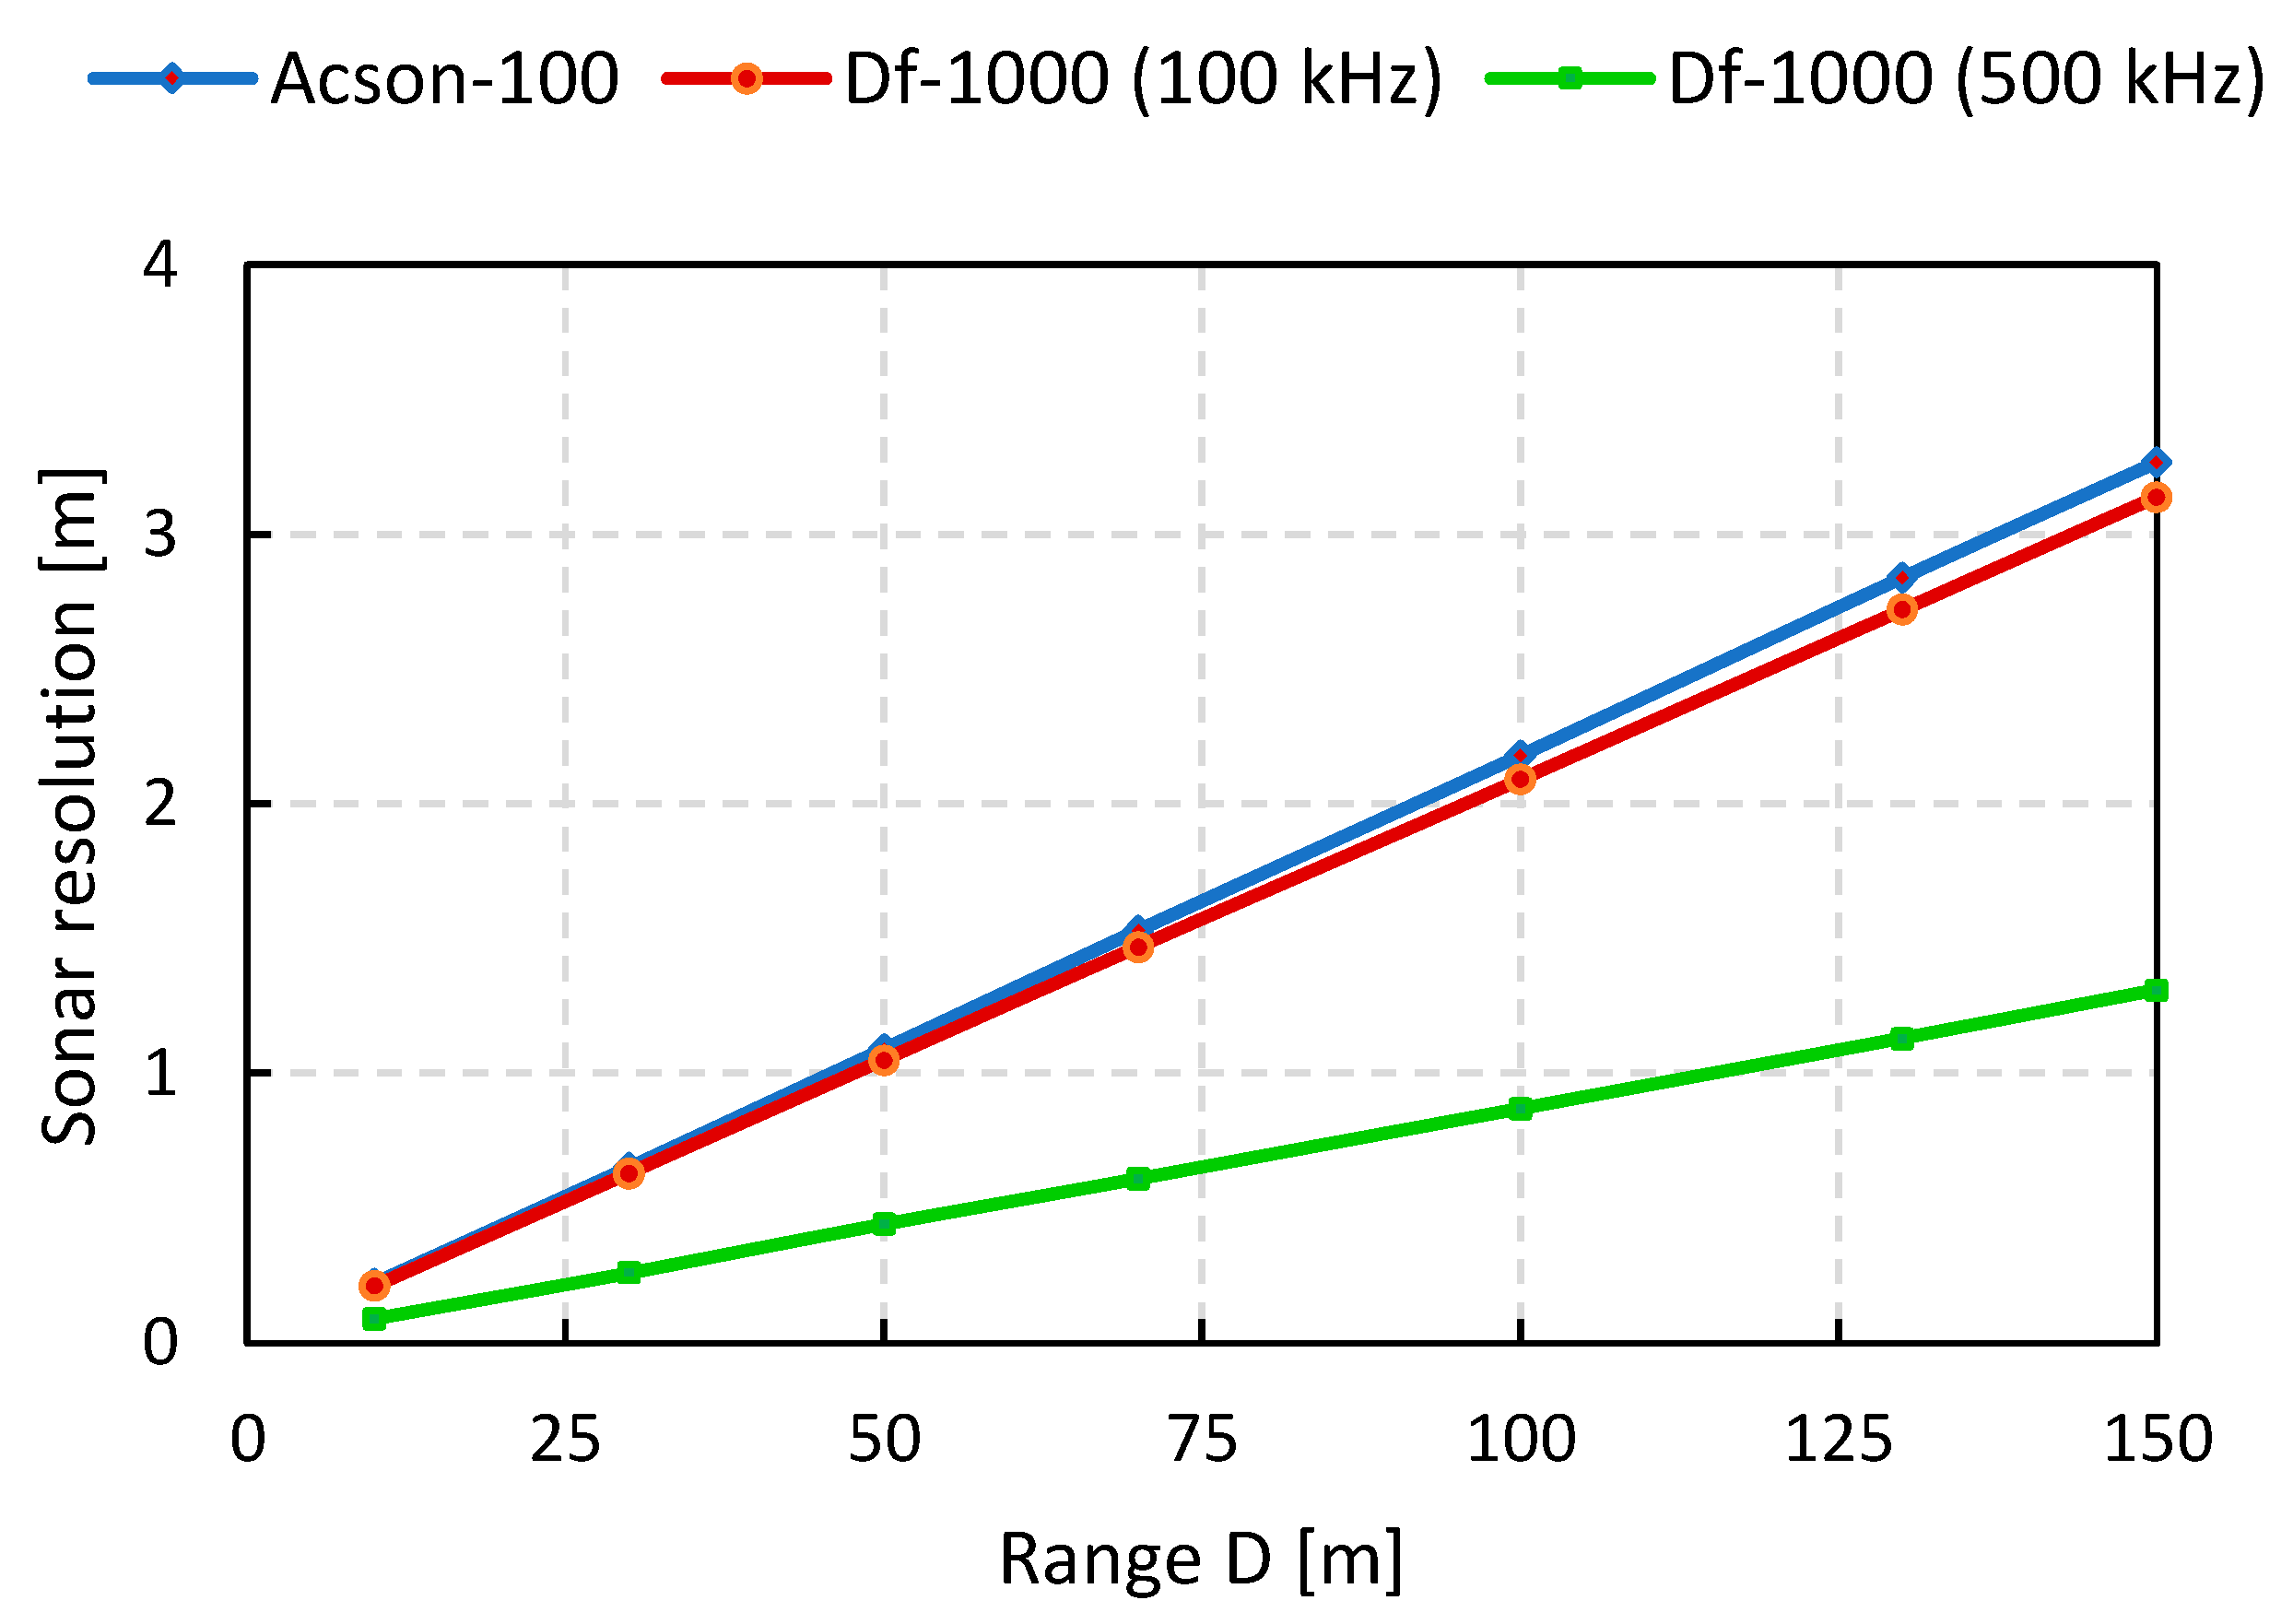
The along-track resolution Rx is dependent on the sonar horizontal aperture beam angle, the effective range and the tow-speed of the SSS [64]. Rx is calculated using [65]:
R x = D · sin θ h
where: D—distance to target from sonar system [m], θ h —horizontal beamwidth [°].
The graphs (Figure 9 and Figure 10) show that the DF-1000 sonar (EdgeTech, Wareham, MA, USA) has higher resolutions, especially for the frequency channel f = 500 kHz. These data translate directly into the high quality of the sonar imageries obtained during the survey. More detailed sonar images are provided by side-scan sonars operating at even higher frequencies of 900 kHz or 1600 kHz. An example of such a sonar is EdgeTech 4215i (EdgeTech, Wareham, MA, USA) or Klein System 4K-UHR (Klein Marine Systems, Inc., Salem, MA, USA). Unfortunately, as the frequency of the emitted signal increases, the sonar operating range decreases.
According to Bowens [66], acoustic shadow can be the most important sonar imagery feature as it provides a three-dimensional quality to a two-dimensional survey. What is more, shadows are often the most important tool for interpreting sonar images. The shadow cast behind an object, protruding above the seafloor, is the sign indicating that the feature has just been ensonified and detected. The presence of shadows was an important clue to recognizing the shape of the Steuben, Goya and Koł-38 shipwrecks and the overall condition of these objects. Schultz et al. [48] are of the opinion that for certain angles, the sonar acoustic shadow illustrates the morphology of the feature better than the feature itself, indicates the vertical nature of the object and may provide more information than the shape of the target. Quinn et al. [67] noticed that the lower the towfish height, the more profound the acoustic shadows, and therefore the easier it is to detect protruding underwater targets. The shadow phenomenon is extremely important for the operator, who relies on their position, shape and intensity in order to precisely interpret the sonar record. Moreover, acoustic shadow is the first indication of the presence of the bottom object. Thanks to the shadows, it is possible to calculate the height of the object protruding above the seafloor. High-resolution acoustic images allow the classification of objects from their cast shadow.
The more matches and similarities obtained when analyzing the acoustic shadow and historical data of the ship, the greater the probability of positive identification of the discovered wreck. However, it should be remembered that the acoustic shadows cast by objects are a function of the angle at which the sonar beam hits the object. A wreck ensonified from one angle may cast a very distinct shadow, while, if swept from another angle, will produce no shadow at all.

5. Conclusions

The aim of this paper was to demonstrate the impact of sonar technology resolution on the quality of hydroacoustic backscatter data, as well as the significance of the acoustic shadow phenomenon in the process of the visualization and interpretation of sonar imagery.
For this purpose, research at sea was carried out in six different locations of the Baltic Sea in the Polish Exclusive Economic Zone. Two side-scan sonars—one hull-mounted and one towed—were applied to the investigation of six shipwrecks, and the research provided many images that were compared with each other. The results clearly show that the parameter of resolution plays a key role in recording high-quality, near-optical sonar images of the seafloor and underwater targets.
The article also draws attention to the fact that towing side-scan sonar astern of the vessel has several advantages, including the ability to operate it at a height above the seafloor and obtain the optimum geometry and acoustic shadow. The position of the side-scan sonar’s transducer relative to the underwater object is a significant issue that influences the probability of target detection and visualization.

Funding

This research received no external funding.

Data Availability Statement

No new data were created or analyzed in this study. Data sharing is not applicable to this article.

Acknowledgments

The author would like to thank the crew of the Polish Navy Hydrographic Ship Arctowski for 19 years of joint service, for exemplary and professional performance of hydrographic tasks at sea, for the opportunity to participate in joint research cruises, and for all the marine surveys carried out on Baltic Sea shipwrecks.

Conflicts of Interest

The author declares no conflict of interest.

References

  1. SeaBed2030. Available online: https://seabed2030.org/our-mission/ion%20—%20Seabed%202030 (accessed on 3 September 2023).
  2. Wölfl, A.C.; Snaith, H.; Amirebrahimi, S.; Devey, C.W.; Dorschel, B.; Ferrini, V.; Huvenne, V.A.I.; Jakobsson, M.; Jencks, J.; Johnston, G.; et al. Seafloor Mapping—The Challenge of a Truly Global Ocean Bathymetry. Front. Mar. Sci. 2019, 6, 283. [Google Scholar] [CrossRef]
  3. Thompson, A.F.; Sallée, J.-B. Jets and topography: Jet transitions and the impact on transport in the Antarctic circumpolar current. J. Phys. Oceanogr. 2012, 42, 956–972. [Google Scholar] [CrossRef]
  4. Fenty, I.; Willis, J.K.; Khazendar, A.; Dinardo, S.; Forsberg, R.; Fukumori, I.; Holland, D.; Jakobsson, M.; Moller, D.; Morison, J.; et al. Oceans melting Greenland: Early results from NASA’S ocean-ice mission in Greenland. Oceanography 2016, 29, 72–83. [Google Scholar] [CrossRef]
  5. Sala, E.; Lubchenco, J.; Grorud-Colvert, K.; Novelli, C.; Roberts, C.; Sumaila, U.R. Assessing real progress towards effective ocean protection. Mar. Policy 2018, 91, 11–13. [Google Scholar] [CrossRef]
  6. IHO Publication. Manual on Hydrography, 1st ed.; International Hydrographic Organization: Monte Carlo, Monaco, 2011. [Google Scholar]
  7. Mayer, L.A. Frontiers in seafloor mapping and visualization. Mar. Geophys. Res. 2006, 27, 7–17. [Google Scholar] [CrossRef]
  8. Eleftherakis, D.; Vicen-Bueno, R. Sensors to Increase the Security of Underwater Communication Cables: A Review of Underwater Monitoring Sensors. Sensors 2020, 20, 737. [Google Scholar] [CrossRef]
  9. Sun, K.; Cui, W.; Chen, C. Review of Underwater Sensing Technologies and Applications. Sensors 2021, 21, 7849. [Google Scholar] [CrossRef]
  10. Feng, H.; Yu, J.; Huang, Y.; Cui, J.; Qiao, J.; Wang, Z.; Xie, Z.; Ren, K. Automatic tracking method for submarine cables and pipelines of AUV based on side scan sonar. Ocean Eng. 2023, 280, 114689. [Google Scholar] [CrossRef]
  11. Theberge, A. Appendix: The History of Seafloor Mapping. In Ocean Globe; Breman, J., Ed.; ESRI Press: Redlands, CA, USA, 2010; pp. 237–274. [Google Scholar]
  12. Pijanowski, B.C.; Brown, C.J. Grand Challenges in Acoustic Remote Sensing: Discoveries to Support a Better Understanding of Our Changing Planet. Front. Remote Sens. 2022, 2, 824848. [Google Scholar] [CrossRef]
  13. Farr, H.K. Multibeam bathymetric sonar: Sea beam and hydro chart. Mar. Geod. 1980, 4, 77–93. [Google Scholar] [CrossRef]
  14. Glenn, M.F. Introducing an operational multi-beam array sonar. Int. Hydrogr. Rev. 1970, 47, 35. [Google Scholar]
  15. Renard, V.; Allenou, J.P. SeaBeam multibeam echo sounding in Jean Charcot: Description, evaluation and first results. Intern. Hydrog. Rev. 1979, 1, 35–67. [Google Scholar]
  16. Grządziel, A. Side Scan Sonar—Method of searching for and detecting of underwater objects. Marit. Rev. 2006, 1, 48–63. [Google Scholar]
  17. Wu, Z.; Yang, F.; Tang, Y. Side-Scan Sonar and Sub-Bottom Profiler Surveying. In High-Resolution Seafloor Survey and Applications; Springer: Berlin/Heidelberg, Germany, 2021; pp. 95–122. [Google Scholar]
  18. Blondel, P. Handbook of Sidescan Sonar; Praxis Publishing Ltd.: Chichester, UK, 2009; ISBN 978-3-540-49886-5. [Google Scholar]
  19. Barngrover, C.; Althoff, A.; DeGuzman, P.; Kastner, R. A brain–computer interface (BCI) for the detection of mine-like objects in sidescan sonar imagery. IEEE J. Ocean. Eng. 2015, 41, 123–138. [Google Scholar] [CrossRef]
  20. Fatan, M.; Daliri, M.R.; Shahri, A.M. Underwater cable detection in the images using edge classification based on texture information. Measurement 2016, 91, 309–317. [Google Scholar] [CrossRef]
  21. Williams, D.P. Fast target detection in synthetic aperture sonar imagery: A new algorithm and large-scale performance analysis. IEEE J. Ocean. Eng. 2014, 40, 71–92. [Google Scholar] [CrossRef]
  22. Singh, H.; Adams, J.; Mindell, D.; Foley, B. Imaging underwater for archaeology. J. Field Archaeol. 2000, 27, 319–328. [Google Scholar]
  23. Johnson, H.P.; Helferty, M. The geological interpretation of side–scan sonar. Rev. Geophys. 1990, 28, 357–380. [Google Scholar] [CrossRef]
  24. McKinney, T.F.; Stubblefield, W.L.; Swift, D.J.P. Large-scale current lineations on the central New Jersey shelf: Investigations by side-scan sonar. Mar. Geol. 1974, 17, 79–102. [Google Scholar] [CrossRef]
  25. Morales, J.A.; Delgado, I. Side-Scan Sonar Imaging of Sediment Bedload. In Encyclopedia of Estuaries; Encyclopedia of Earth Sciences Series; Kennish, M.J., Ed.; Springer: Dordrecht, The Netherlands, 2016; pp. 602–605. [Google Scholar] [CrossRef]
  26. Greene, A.; Rahman, A.; Kline, R.; Rahman, M. Side scan sonar: A cost-efficient alternative method for measuring seagrass cover in shallow environments. Estuar. Coast. Shelf Sci. 2018, 207, 250–258. [Google Scholar] [CrossRef]
  27. Li, J.; Jiang, P.; Zhu, H. A Local Region-Based Level Set Method With Markov Random Field for Side-Scan Sonar Image Multi-Level Segmentation. IEEE Sens. J. 2021, 21, 510–519. [Google Scholar] [CrossRef]
  28. Lucieer, V.L. Object-oriented classification of sidescan sonar data for mapping benthic marine habitats. Int. J. Remote Sens. 2008, 29, 905–921. [Google Scholar] [CrossRef]
  29. Ge, Q.; Ruan, F.; Qiao, B.; Zhang, Q.; Zuo, X.; Dang, L. Side-Scan Sonar Image Classification Based on Style Transfer and Pre-Trained Convolutional Neural Networks. Electronics 2021, 10, 1823. [Google Scholar] [CrossRef]
  30. Dumser, T.K.; Türkay, M. Postmortem changes of human bodies on the Bathyal Sea floor—Two cases of aircraft accidents above the open sea. J. Forensic Sci. 2008, 53, 1049–1052. [Google Scholar] [CrossRef]
  31. Ralston, G.; Pinksen, J. Underwater technology used to bring closure to families of drowning victims. J. Ocean Technol. 2010, 5, 20–25. [Google Scholar]
  32. Parker, R.; Ruffell, A.; Hughes, D.; Pringle, J. Geophysics and the search of freshwater bodies: A review. Sci. Justice 2010, 50, 141–149. [Google Scholar] [CrossRef]
  33. Hughes Clarke, J.E.; Mayer, L.A.; Wells, D.E. Shallow-water imaging multibeam sonars: A new tool for investigating seafloor processes in the coastal zone and on the continental shelf. Mar. Geophys. Res. 1996, 18, 607–629. [Google Scholar] [CrossRef]
  34. Pergent, G.; Monnier, B.; Clabaut, P.; Gascon, G.; Pergent-Martini, C.; Valette-Sansevin, A. Innovative method for optimizing Side-Scan Sonar mapping: The blind band unveiled. Estuar. Coast. Shelf Sci. 2017, 194, 77–83. [Google Scholar] [CrossRef]
  35. Blondel, P.; Murton, B.J. Handbook of Seafloor Sonar ImageryI; John Wiley & Sons Publisher: Chichester, UK, 1997; p. 314. ISBN 0-471-96217-1. [Google Scholar]
  36. Zhu, B.; Wang, X.; Chu, Z.; Yang, Y.; Shi, J. Active Learning for Recognition of Shipwreck Target in Side-Scan Sonar Image. Remote Sens. 2019, 11, 243. [Google Scholar] [CrossRef]
  37. Yu, Y.; Zhao, J.; Gong, Q.; Huang, C.; Zheng, G.; Ma, J. Real-Time Underwater Maritime Object Detection in Side-Scan Sonar Images Based on Transformer-YOLOv5. Remote Sens. 2021, 13, 3555. [Google Scholar] [CrossRef]
  38. Tang, Y.; Wang, L.; Jin, S.; Zhao, J.; Huang, C.; Yu, Y. AUV-Based Side-Scan Sonar Real-Time Method for Underwater-Target Detection. J. Mar. Sci. Eng. 2023, 11, 690. [Google Scholar] [CrossRef]
  39. Grządziel, A. Side-scan sonar geometry—The key to understanding and interpreting sonar images. Marit. Rev. 2004, 7–8, 14–28. [Google Scholar]
  40. Fakiris, E.; Papatheodorou, G.; Geraga, M.; Ferentinos, G. An automatic target detection algorithm for swath Sonar backscatter imagery, using image texture and independent component analysis. Remote Sens. 2016, 8, 373. [Google Scholar] [CrossRef]
  41. Yan, J.; Meng, J.; Zhao, J. Bottom Detection from Backscatter Data of Conventional Side Scan Sonars through 1D-UNet. Remote Sens. 2021, 13, 1024. [Google Scholar] [CrossRef]
  42. Gong, W.; Tian, J.; Liu, J. Underwater Object Classification Method Based on Depthwise Separable Convolution Feature Fusion in Sonar Images. Appl. Sci. 2022, 12, 3268. [Google Scholar] [CrossRef]
  43. Sinai, A.; Amar, A.; Gilboa, A. Mine-Like Objects detection in Side-Scan Sonar images using a shadows-highlights geometrical features space. In Proceedings of the OCEANS 2016 MTS/IEEE Monterey, Monterey, CA, USA, 19–23 September 2016; pp. 1–6. [Google Scholar] [CrossRef]
  44. Pailhas, Y.; Petillot, Y.; Capus, C. High-Resolution Sonars: What Resolution Do We Need for Target Recognition? EURASIP J. Adv. Signal Process. 2010, 2010, 205095. [Google Scholar] [CrossRef]
  45. Reed, S.; Petillot, Y.; Bell, J. Automated approach to classification of mine-like objects in sidescan sonar using highlight and shadow information. IEE Proc. Radar Sonar Navig. 2004, 151, 48–56. [Google Scholar] [CrossRef]
  46. Kumudham, R.; Rajendran, V. Super resolution enhancement of underwater sonar images. SN Appl. Sci. 2019, 1, 852. [Google Scholar] [CrossRef]
  47. Fitzgerald, D.M.; Zarillo, G.A.; Johnston, S. Recent Developments in the Geomorphic Investigation of Engineered Tidal Inlets. Coast. Eng. J. 2003, 45, 565–600. [Google Scholar] [CrossRef]
  48. Schultz, J.J.; Healy, C.A.; Parker, K.; Lowers, B. Detecting submerged objects: The application of side scan sonar to forensic contexts. Forensic Sci. Int. 2013, 231, 306–316. [Google Scholar] [CrossRef]
  49. Lurton, X. An Introduction to Underwater Acoustics: Principles and Applications, 2nd ed.; Springer Science & Business Media: Berlin, Germany, 2010. [Google Scholar]
  50. Burdic, W.S. Underwater Acoustic System Analysis, 2nd ed.; Peninsula Publishing: Westport, CO, USA, 2003; p. 489. ISBN 978-0932146632. [Google Scholar]
  51. Mazel, C. Side Scan Sonar Record Interpretation; Klein Associates: Oakland, CA, USA, 1985; p. 146. ISBN 0932146503. [Google Scholar]
  52. Hac, B. Preliminary Action Plan for the Retrieval Activities on the Franken Shipwreck. Report from the Research Expedition Carried out on the Franken Shipwreck on 23rd–28th April 2018 in the Framework of the Project “Reduction of the Negative Impact of Oil Spills from the Franken Shipwreck” The MARE Foundation, Warsaw. 2018. Available online: https://fundacjamare.pl/file/repository/MARE_report_EN_FRANKEN_1_.pdf (accessed on 29 September 2023).
  53. Soroka, M. Polish Navy Ships 1945–1980; Wyd. Morskie: Gdańsk, Poland, 1986; p. 201. [Google Scholar]
  54. Gelewski, T.M. Wilhelm Gustloff i General von Steuben Statki Śmierci czy Zbrodnia Wojenna na Morzu? A.E.L. Publishing House: Gdańsk, Poland, 1997; ISBN 83-903896-4-9. (In Polish) [Google Scholar]
  55. Grządziel, A. Baltic Titanics—History and current state. M/s Goya. Marit. Rev. 2005, 3, 37–49. [Google Scholar]
  56. Grooss, P. The Naval War in the Baltic 1939–1945; Naval Institute Press: Barnsley, UK, 2017; p. 416. ISBN 152670000X. [Google Scholar]
  57. Feldens, P. Super Resolution by Deep Learning Improves Boulder Detection in Side Scan Sonar Backscatter Mosaics. Remote Sens. 2020, 12, 2284. [Google Scholar] [CrossRef]
  58. Atallah, L.; Shang, C.; Bates, R. Object detection at different resolution in archaeological side-scan sonar images. Eur. Ocean. 2005, 1, 287–292. [Google Scholar] [CrossRef]
  59. Savini, A. Side-scan Sonar as a tool for seafloor imagery: Examples from the Mediterranean continental margin. In Sonar Systems; Kolev, N., Ed.; InTech: Vienna, Austria, 2011. [Google Scholar] [CrossRef]
  60. Kaeser, A.J.; Litts, T.L.; Tracy, T. Using low-cost side-scan sonar for benthic mapping throughout the lower Flint River, Georgia, USA. River Res. Appl. 2013, 29, 634–644. [Google Scholar] [CrossRef]
  61. Liu, J.; Pang, Y.; Yan, L.; Zhu, H. An Image Quality Improvement Method in Side-Scan Sonar Based on Deconvolution. Remote Sens. 2023, 15, 4908. [Google Scholar] [CrossRef]
  62. Brown, D.C.; Gerg, I.D.; Blanford, T.E. Interpolation Kernels for Synthetic Aperture Sonar Along-Track Motion Estimation. IEEE J. Ocean. Eng. 2020, 45, 1497–1505. [Google Scholar] [CrossRef]
  63. Łukaszewicz, D.; Rowiński, L. Experimental evaluation of high frequency side scan sonar as object search and identification tool. Hydroacoustics 2006, 9, 109–118. [Google Scholar]
  64. Lekkerkerk, H.-J.; Theijs, M.J. Handbook of Offshore Surveying. Acquisition Sensors, 2nd ed.; Skilltrade BV: Voorschoten, The Netherlands, 2012. [Google Scholar]
  65. Łukaszewicz, D.; Rowiński, L. Possibilities of detection and identification objects located on the sea bottom by means of a simple sidescan sonar. Hydroacoustics 2005, 8, 111–116. [Google Scholar]
  66. Bowens, A. Underwater Archaeology: The NAS Guide to Principles and Practice; Wiley-Blackwell: West Sussex, UK, 2009. [Google Scholar]
  67. Quinn, R.; Dean, M.; Lawrence, M.; Liscoe, S.; Boland, D. Backscatter responses and resolution considerations in archaeological side-scan sonar surveys: A control experiment. J. Archaeol. Sci. 2005, 32, 1252–1264. [Google Scholar] [CrossRef]
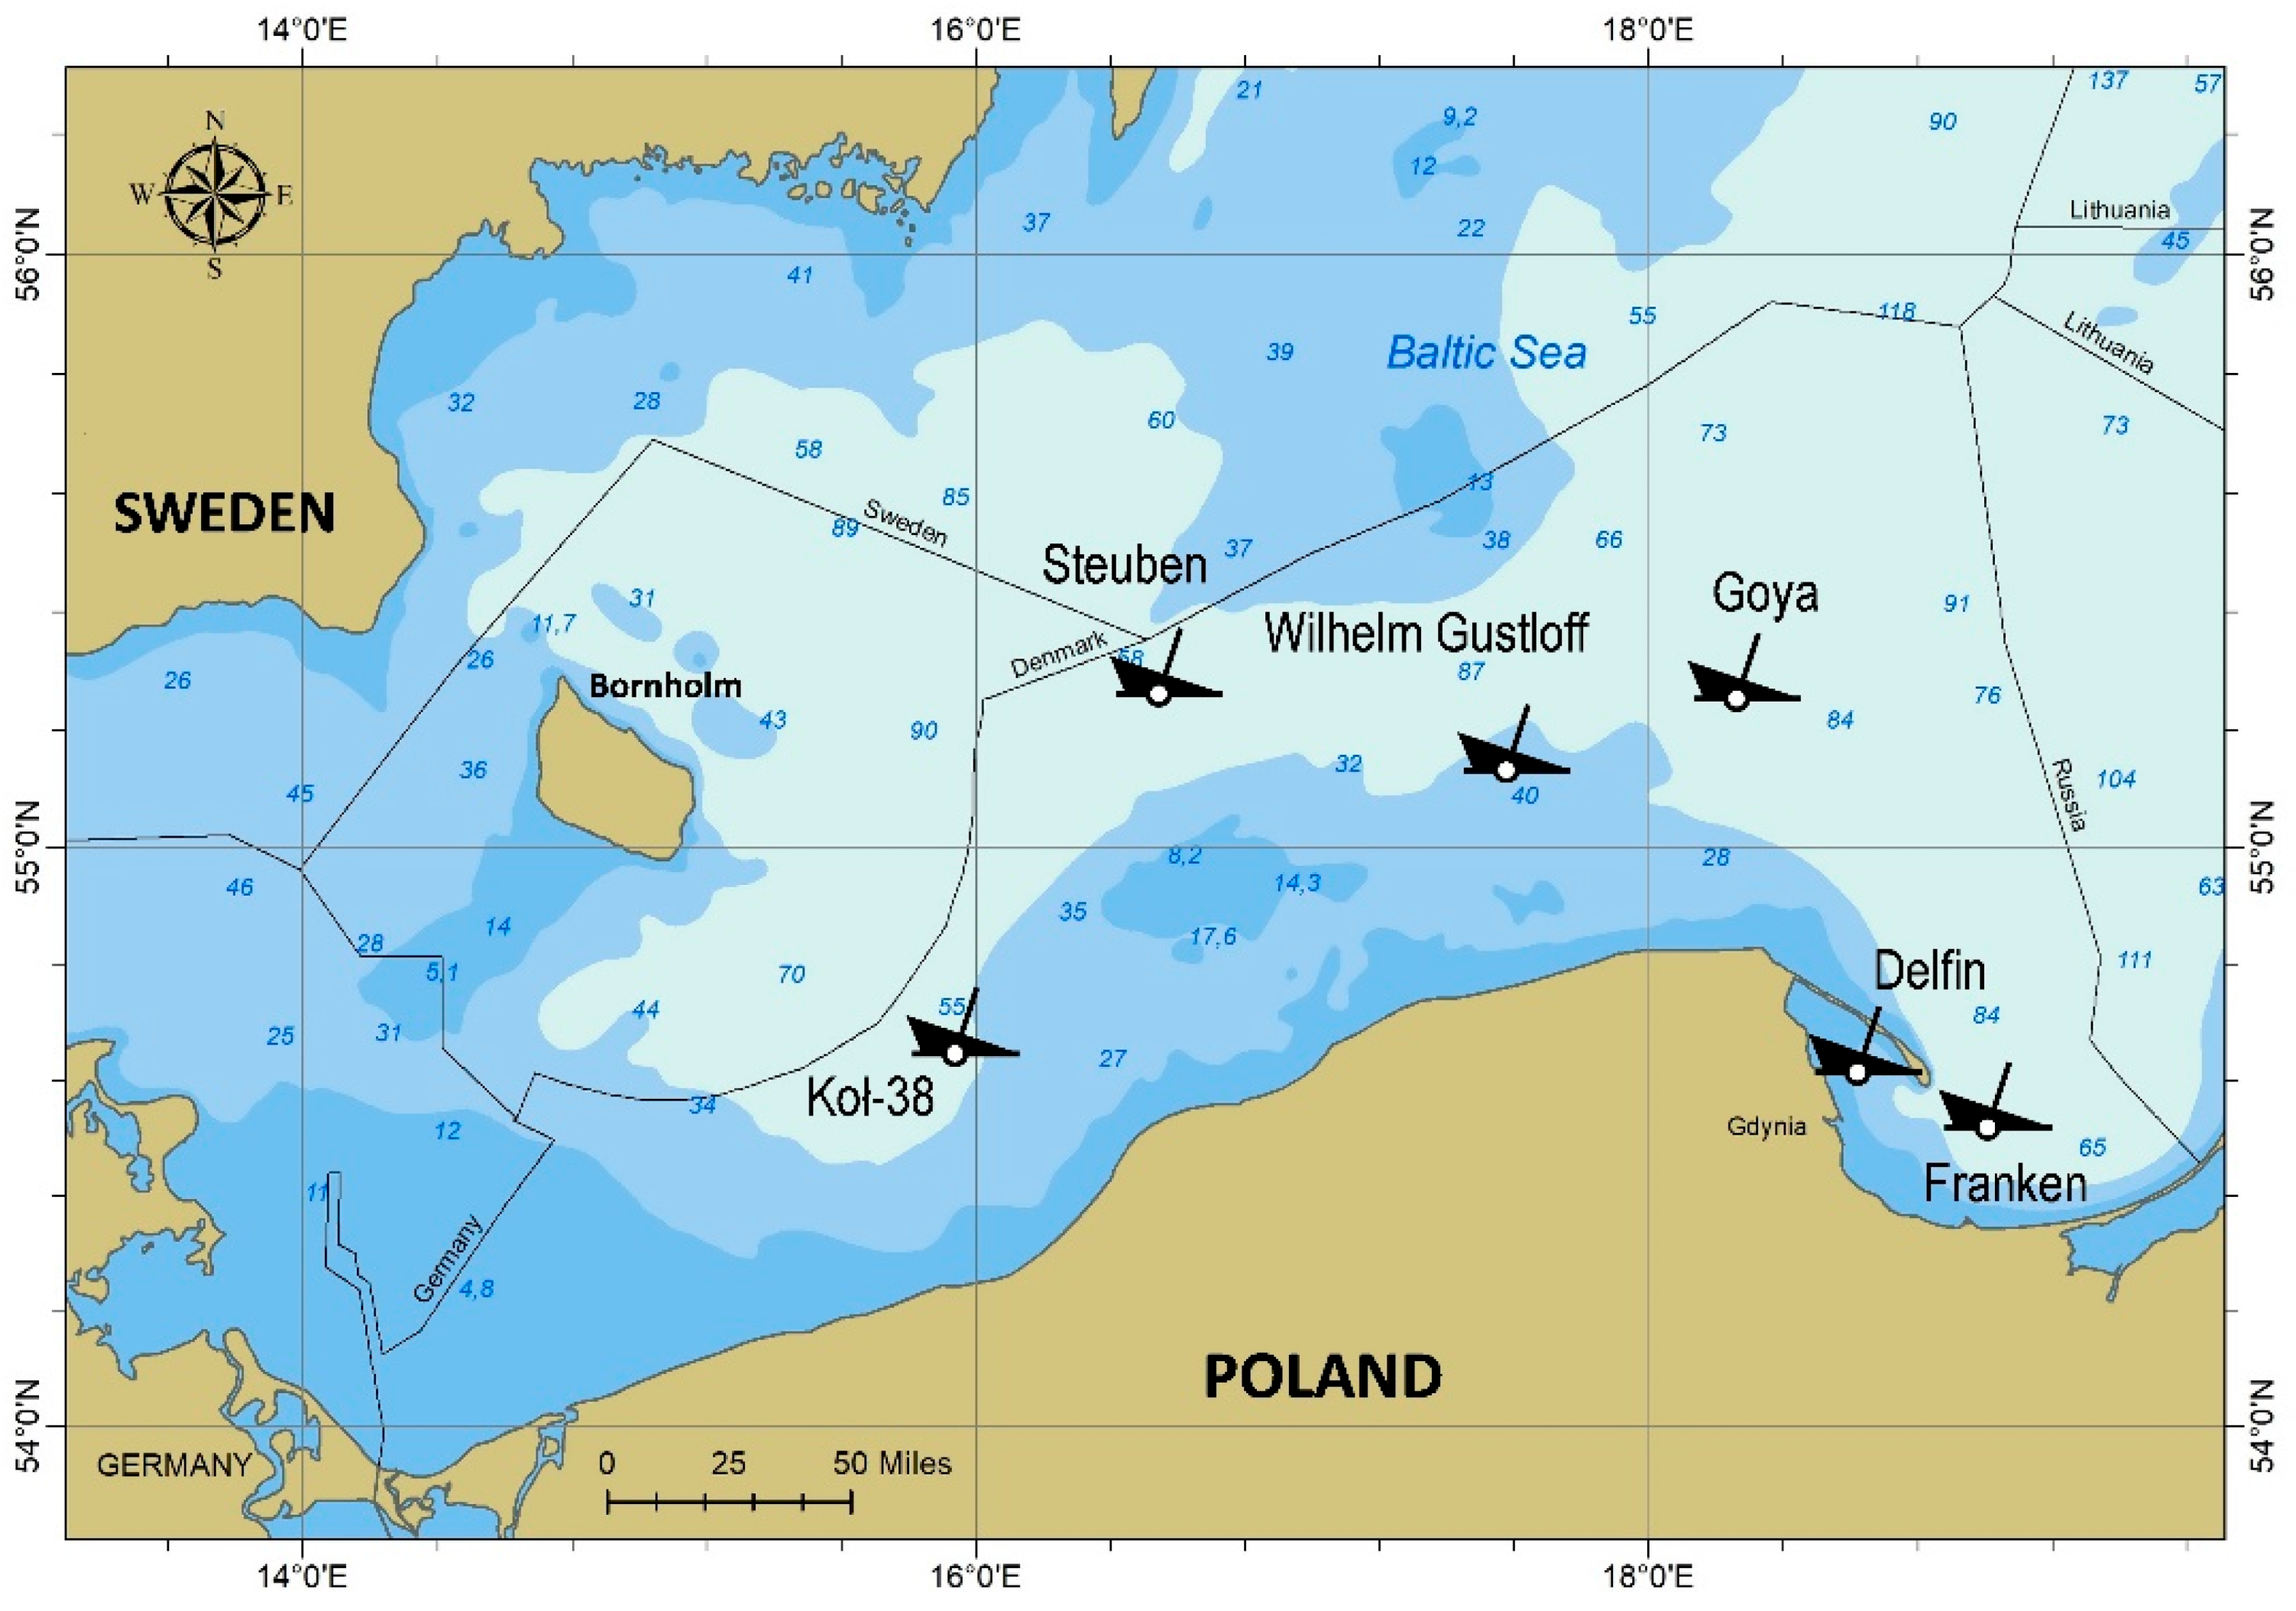
Figure 1. The location of all underwater objects selected for the side-scan sonar investigation.
Remotesensing 15 05599 g001
Figure 2. Sonar equipment used for field operation and data acquisition: (a) console of Acson-100 side-scan sonar; (b) transducer of the Acson-100 mounted in the hull of the hydrographic ship Arctowski; (c) DF-1000 fish on the deck ready for deployment; (d) CODA DA-25 data acquisition system.
Remotesensing 15 05599 g002
Figure 3. Input data for towfish position estimation. S l side scan sonar layback, a l distance between GPS antenna and A-frame, h a height of cable block on A-frame above water line, S d depth of side-scan sonar, W d water depth, S a side scan sonar altitude.
Remotesensing 15 05599 g003
Figure 4. Comparison of the quality of the sonar imageries of the shipwrecks: (a) sonogram of the Franken acquired with hull-mounted sonar, f = 100 kHz; (b) sonogram of the Franken acquired with towed SSS, f = 500 kHz; (c) sonogram of the Delfin acquired with hull-mounted sonar, f = 100 kHz; (d) sonogram of the Delfin acquired with towed SSS, f = 100 kHz; (e) sonogram of the Delfin acquired with towed SSS, f = 500 kHz; (f) sonogram of the Delfin acquired with hull-mounted sonar, f = 100 kHz; (g) sonogram of the Delfin acquired with towed SSS, f = 100 kHz; (h) sonogram of the Delfin acquired with towed SSS, f = 500 kHz.
Remotesensing 15 05599 g004
Figure 5. Comparison of the quality of the sonar imageries of the Wilhelm Gustloff shipwreck: (a) sonogram recorded with hull-mounted sonar, f = 100 kHz; (b) sonograph recorded with towed sonar, f = 500 kHz; (c) sonogram recorded with towed sonar, f = 500 kHz, in a different color palette.
Remotesensing 15 05599 g005
Figure 6. Acoustic shadow formation on the example of the Goya shipwreck: (a) sonogram recorded with hull-mounted sonar, f = 100 kHz; (b) sonograph recorded with towed sonar, f = 500 kHz; (c) acoustic shadow extracted from sonar imagery; (d) ship silhouette of the Goya intentionally filled with black for comparison purposes.
Remotesensing 15 05599 g006
Figure 7. Sonar images of the shipwreck of the fishing boat: (a) sonograph acquired with hull-mounted sonar, f = 100 kHz; (b) sonograph acquired with towed side-scan sonar, f = 500 kHz; (c) sonograph acquired with towed side-scan sonar, f = 500 kHz; (d) silhouette of a fishing boat.
Remotesensing 15 05599 g007
Figure 8. Acoustic shadow formation on the example of the SS Steuben shipwreck: (a) sonogram recorded with hull-mounted sonar; (b) sonogram recorded with towed side-scan sonar; (c) hydroacoustic shadow extracted from sonogram acquired with towed side-scan sonar, f = 500 kHz; (d) ship silhouette of the Steuben intentionally filled with black for comparison purposes.
Remotesensing 15 05599 g008
Figure 9. Theoretical across-track resolution of the side-scan sonars, Acson-100 and EdgeTech DF-1000.
Remotesensing 15 05599 g009
Figure 10. Theoretical along-track resolution of the side-scan sonars, Acson-100 and EdgeTech DF-1000.
Remotesensing 15 05599 g010
Table 1. The basic specifications of EdgeTech DF-1000 side-scan sonar.
ParameterValue
Frequency100 kHz (standard)
500 kHz (high resolution)
Pulse length0.1 ms (100 kHz)
0.01 ms (500 kHz)
Beamwidth (horizontal)1.2° (100 kHz)
0.5° (500 kHz)
Beamwidth (vertical)50° tilted down 20°
A/D resolution12 bits/sample
HeadingBuilt-in flux gate compass
Tow speed12.7 knots maximum
Size11.4 cm × 158 cm
Weight30 kg
Table 2. The basic specifications of Acson-100 side-scan sonar.
ParameterValue
Frequency100 kHz
Pulse length1 ms
Beamwidth (horizontal)1.25°
Beamwidth (vertical)75°
Acoustic power800 W
Max depth100 m
Ranges0–500 m
Disclaimer/Publisher’s Note: The statements, opinions and data contained in all publications are solely those of the individual author(s) and contributor(s) and not of MDPI and/or the editor(s). MDPI and/or the editor(s) disclaim responsibility for any injury to people or property resulting from any ideas, methods, instructions or products referred to in the content.