Abstract
The European Space Agency (ESA) developed the Sentinel-2 Multispectral Imager (MSI), which offers a higher spatial resolution and shorter repeat coverage, making it an important source for the remote-sensing monitoring of water bodies. Atmospheric correction is crucial for the monitoring of water quality. To compare the applicability of seven publicly available atmospheric correction processors (ACOLITE, C2RCC, C2XC, iCOR, POLYMER, SeaDAS, and Sen2Cor), we chose complex and diverse lakes in Qinghai Province, China, as the research area. The lakes were divided into three types based on the waveform characteristics of Rrs: turbid water bodies (class I lakes) represented by the Dabusun Lake (DBX), clean water bodies (class II lakes) represented by the Qinghai Lake (QHH), and relatively clean water bodies (class III lakes) represented by the Longyangxia Reservoir (LYX). Compared with the in situ Rrs, it was found that for the DBX, the Sen2Cor processor performed best. The POLYMER processor exhibited a good performance in the QHH. The C2XC processor performed well with the LYX. Using the Sen2Cor, POLYMER, and C2XC processors for classes I, II, and III, respectively, compared with the Sentinel-3 OLCI Level-2 Water Full Resolution (L2-WFR) products, it was found that the estimated Rrs from the POLYMER had the highest consistency. Slight deviations were observed in the estimation results for both the Sen2Cor and C2XC.
1. Introduction
Qinghai Province (31°39′–39°19′N, 89°35′–103°04′E) is located in the northwest of China and the northeast of the Qinghai–Tibet Plateau. It has 231 lakes with areas greater than 1 km2, and the total area of these lakes is approximately 14,374.56 km2 [1]. The lakes in Qinghai Province are diverse and complex. In addition to freshwater lakes (such as the Longyangxia Reservoir), there are many saltwater and salt lakes, such as Qinghai Lake, the largest inland saltwater lake in China, and Qarhan Lake, the largest salt lake in China. The turbidity of the Qinghai Lake varies greatly with a distribution between 0.2 and 210 NTU. There are also certain differences in the chlorophyll-α concentration and suspended particulate matter in the water. Different atmospheric correction processors perform differently for waterbodies with different optical properties [2]. The European Space Agency (ESA) successfully launched the Sentinel-2A and Sentinel-2B satellites in June 2015 and March 2017, respectively, carrying Multi-Spectral Imager (MSI) sensors. MSI consists of 13 bands with spatial resolutions of 10 m (four bands), 20 m (six bands), and 60 m (three bands). The alternating coverage of the two stars lasted for five days. Its high spatial resolution, short repeat coverage, and unique vegetation red-edge band make it an important tool for monitoring inland water bodies [3].
Approximately 80–90% of the radiance received by satellite sensors from water bodies is a result of atmospheric interference [4]. For case 1 bodies of water (oceanic waters), many standard atmospheric correction algorithms have been developed based on the ‘black pixel’ hypothesis in the near-infrared (NIR) band [5,6]. This hypothesis assumes that the signals in the NIR band received by the sensors are mainly affected by atmospheric and air–water interface effects [7], because water itself is strongly absorbed, making the reflectance leaving the water almost negligible. Therefore, it is possible to extrapolate the signal to the visible-light (VIS) band using an aerosol model [8,9]. For case 2 bodies of water (coastal and inland water), owing to the influence of suspended sediments [10], the reflectance of remote sensing (Rrs) in the NIR wavelength range is not zero [11,12]. Many researchers have developed a variety of atmospheric correction algorithms suitable for case 2 water bodies through methods such as modifying the standard ‘black pixel’ assumption [13,14], a physical model based on a spectral optimisation method [15,16], and machine learning neural networks [17,18,19].
For the Sentinel-2 MSI imager, algorithms optimising the ‘black pixel’ hypothesis include the Atmospheric Correction for Operational Land Imager ‘lite’ (ACOLITE), the Image Correction for Atmospheric Effects (iCOR), the Sentinel 2 Atmospheric Correction (Sen2Cor), and the SeaWiFS Data Analysis System (SeaDAS). The ACOLITE includes two processors: the Exponential Function (EXP) and Dark Spectrum Fitting (DSF). The ACOLITE-EXP extends the ‘black pixel’ hypothesis to the short-wave infrared (SWIR) band; the processor assumes that the SWIR signal is considered to be solely caused by aerosols and Rayleigh scattering. After the Rayleigh correction, the remaining signal is expanded from the SWIR to the VIS and NIR bands using the EXP [20,21]. For high-resolution sensors without SWIR bands, the ACOLITE-DSF automatically captures all bands of a scene or sub-scene to estimate the atmospheric path reflectance (ρpath) using the lowest observed top-of-atmosphere reflectance (ρTOA) [22,23,24]. Overall, the DSF performed better than the EXP [25]. Inland water areas influenced by neighbouring pixels had higher pixel radiation values [26]. The iCOR processor uses a Similarity Environmental Correction (SIMEC) method [27] based on the NIR similarity spectrum to detect and correct adjacency effects [11]. For atmospheric effects, the processor subdivides the raw images into 15 × 15 km2 tiles and selects the lowest radiance value from among all the bands as the approximate dark target spectrum for each tile. It then uses MODTRAN5 lookup tables (LUTs) to eliminate atmospheric effects [28]. The Sen2Cor processor uses a Dense Dark Vegetation (DDV) algorithm to retrieve the relationship between the SWIR red (red) and blue bands (blue) [29] to obtain the aerosol optical thickness (AOT) [29,30]. The SeaDAS processor assumes that at 765 nm/865 nm, both the aerosol reflectance and the water-leaving reflectance have spatial homogeneity and uses these two ratios as correction parameters after a Rayleigh scattering correction [11].
Based on a spectral optimisation method, the polynomial-based algorithm applied to the MERIS (POLYMER) uses the entire spectral range from the blue to NIR bands to address the impact of sunlight [3,31,32]. It employs a simple polynomial atmospheric model representing atmospheric scattering, and the water reflectance above the water–air interface is obtained using a bio-optical ocean water reflectance model [15]. The neural network-based atmospheric correction algorithm, Case 2 Regional CoastColour (C2RCC), depends on a large database of simulated water, including reflectances and related top-of-atmosphere radiances. Neural networks are utilised for training to perform the spectrum inversion process, and specifically to calculate the radiance of water leaving the top of the atmosphere [17]. Nearly five million data points were collected from various waterbody types for training of the neural network. Using different databases, we trained three processors: the C2RCC, Case2eXtreme (C2X), and C2X-COMPLEX (C2XC) [33]. The C2RCC training dataset covers typical coastal areas. The C2X processor training set is the largest and includes extreme cases [33]. The C2XC processor training was set between C2RCC and C2X. Some studies found that the C2X processors have a higher degree of uncertainty [34].
Many studies have validated the abovementioned processors in different regions; however, current research has mainly focused on evaluating the optimal atmospheric correction method for a single lake. For example, the ACOLITE and Sen2Cor algorithms achieved satisfactory results in the treatment of turbid water [24]. In cleaner inland water bodies, the POLYMER, C2RCC, and C2XC are more suitable [34,35,36]. Although the applicability of atmospheric correction processors to Chinese lake groups has been discussed and analysed, no optimal atmospheric correction method has been identified for each type of water body [37]. However, the performances of atmospheric correction processors may vary for different types of water bodies. Therefore, we chose the Qinghai Province, which has diverse water body types, as the study area, and lakes with an area of more than 50 km2 were considered as research objects. Lakes were classified based on their water reflectance spectral classification. We compared the estimated results using seven common atmospheric correction processors for the Sentinel-2 remote sensing images (ACOLITE, C2RCC, C2XC, iCOR, POLYMER, SeaDAS, and Sen2Cor) and discussed the applicability of different types of water body atmospheric correction processors.
2. Materials and Methods
2.1. Study Area
Qinghai Province has a geography featuring a high middle-low terrain, and its eastern region is a transition zone between the Tibetan Plateau and the Loess Plateau, with a complex topography and diverse landforms. Qinghai Province has numerous lakes and ranks second in China. It is the birthplace of the Yangtze, Yellow, and Lancang Rivers and contains complex and rich types of water bodies, such as salt lakes, saltwater lakes, and freshwater lakes. Some of these lakes, such as the Kusai Lake and Zonag Lake, are located in the uninhabited areas of Hoh Xil and are difficult to reach. In this study, 35 lakes with areas greater than 50 km2 were selected as research areas, as shown in Figure 1 and Table 1.
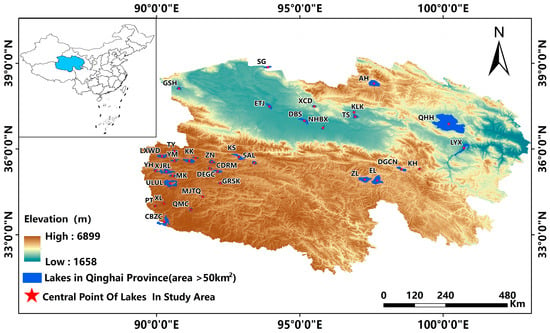
Figure 1.
Location of the study area in Qinghai Province. The red star indicates the centre position of each lake.

Table 1.
Information on lake location in the study area.
2.2. Data
2.2.1. Image Data
The data used in this study were obtained from Sentinel-2 MSI (S2-MSI), Sentinel-3 Ocean, and Land Colour Instrument (S3-OLCI) images. Currently, for case 2, for water with optical properties, the S3-OLCI Level-2 Water Full Resolution (L2-WFR) products are strongly consistent with the in situ Rrs [38,39,40]. Therefore, the L2-WFR was selected for evaluating the atmospheric correction processor for S2-MSI. The 39-scene cloud-free and flare-free L1C-level images and L2-WFR data transited concurrently with the S2-MSI (see Table 1 for details) were freely downloaded from the ESA Copernicus Open Access Centre (https://dataspace.copernicus.eu/, accessed on 20 October 2022). The L1C-level image of S2-MSI is the product of geometric precision correction. The S3-OLCI was not geometrically corrected, and there were geometric deviations. This study used national S2-MSI image data as a base map, automatically obtained ground control points of S2-MSI and S3-OLCI images, and reprojected S3-OLCI images onto S2-MSI images to ensure consistent geometric information between the S2-MSI and S3-OLCI images in the subsequent research process [41].
2.2.2. In Situ Data
Qinghai Lake, Dabusun Salt Lake, and Longyangxia Reservoir were selected as representative areas of typical lakes, and field water spectrum measurements were conducted on the 16 August 2021, 5 July 2022, and 11 July 2022, respectively. A total of 49 measured data points and on-site measured water quality data points were collected, including water colour index and turbidity. The sampling point information is shown in Figure 2.
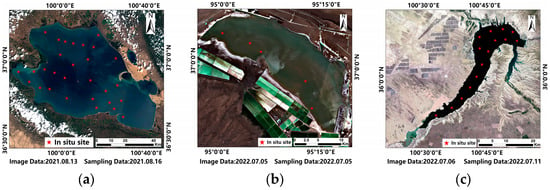
Figure 2.
Locations of sampled lakes. Red markers represent locations of in situ data. (a) Qinghai Lake. (b) Dabusun Lake. (c) Longyangxia Reservoir.
For each sampling point, a Trios spectrometer was used to continuously measure the ratio of the upwelling radiance (), the reflectance of the sun and the sky glint (), and the downwelling irradiance () based on the ‘surface method’ [42] and the remote sensing reflectance Rrs (λ) at each sampling point was calculated using Equation (1) [43].
where is the ratio of the upwelling radiance, is the downwelling irradiance, and is the reflectance of the sun and the sky glint.
Additionally, we measured the turbidity in situ using an American Orion AQ3010 turbidimeter and the water colour index using a Forel-Ule Index (FUI) colorimeter for each sampling point. The in situ data from Dabusun Lake show that the FUI ranges between 15 and 18 levels, the turbidity ranges between 30 and 150 NTU, and the reflectance spectrum displays the characteristics of typical turbid water bodies (as shown in Figure 3). It also exhibits strong reflections in the wavelength range of 580–800 nm [44]. The FUI of Qinghai Lake is between approximately 3 to 6 levels, the turbidity between 0.06 and 1.5 NTU, and its spectral characteristics display the characteristics of typical clean water bodies. The reflectance spectrum gradually changed between 500 and 600 nm. Above 700 nm, the water body absorbs strongly, and its reflectivity is almost zero. The FUI of the Longyangxia Reservoir was between 7 and 8, and the turbidity was between 1.4 and 3.3 NTU. Compared to Qinghai Lake, the water body of the Longyangxia Reservoir is slightly cloudy. At wavelengths between 500 and 600 nm, the reflectance of the water bodies gradually increased with increasing wavelength [45].
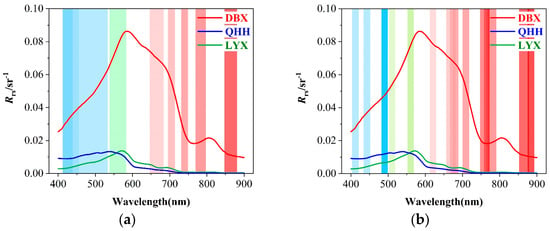
Figure 3.
In situ reflectance data of typical lake and reservoir water. The solid line is the average of the sampling points for each lake, DBX is represented in red, QHH is represented in blue, and LYX is represented in green. The vertical lines of different colours represent 400–900 nm. (a) Of the 8 wavebands (B1–B7 and B8A) corresponding to the Sentinel-2 MSI images, B1 and B2 partially overlap, with the colour transition indicating a shared area. (b) 17 wavebands (B2–B18), correspond to the Sentinel-3 OLCI images, and the wavelength ranges of different wavebands above 650 nm overlap.
2.3. Method
2.3.1. Spectral Classification of 35 Water Bodies in Qinghai Province
We used the S3-OLCI image L2-WFR to classify the lakes in our research area. The lake boundaries generated by the Sentinel-3 image water mask were obtained and used as inputs for the formation of a 3 × 3 km2 grid. We calculated the mean lake Rrs at the centre of the grid. Based on the spectral curve characteristics and in situ data of the three typical lakes, we classified the lakes with spectral characteristics similar to those of the typical lakes to further study the applicability of the atmospheric correction processor to water bodies of the same type.
2.3.2. Seven Atmospheric Correction Processors
Seven commonly used atmospheric correction processors were evaluated in this study: ACOLITE V20210802 [25]; C2RCC V1.1 [33]; C2XC V1.1, iCOR V3.0 [27]; POLYMER V4.13 [16]; SeaDAS/l2gen V8.2 [46]; Sen2Cor V2.11 [47]. Accordingly, the ACOLITE, C2RCC, C2XC, POLYMER, and SeaDAS are processors specifically designed for water bodies. The iCOR processor is the only atmospheric correction processor that considers the adjacent corrections. The Sen2cor is the default atmospheric correction processor for S2-MSI.
2.3.3. Accuracy Evaluation Method for Atmospheric Correction Processors
According to the spectral response function, the in situ Rrs convolution was calculated as Rrs at 443, 490, 560, 665, and 705 nm of the S2-MSI image using Equation (2).
where is the Rrs after spectral normalization, are the lower and upper limits of the band range, respectively, is the spectral response function, and is the in situ Rrs at .
The processor accuracy was evaluated by scoring the estimated Rrs results of seven processors [39,48,49]. The single-band score was calculated by comparing the results of each atmospheric correction processor for its corresponding band with all statistical indicators (R2, S, I, Bias, RMSE, MRE). Each band has a maximum score of 12. The score of a single processor is the score of all the bands divided by the number of bands, and the final score of each processor is the score of the single processor divided by the average score of all processors. A final score greater than one indicates good performance of the atmospheric correction processor. Table 2 presents the scoring criteria for each statistical indicator.

Table 2.
Atmospheric correction processor scoring rules.
The six statistical indicators can be expressed as the square of the correlation coefficient (R2), slope (S), intercept (I) of the linear regression, bias (Bias), root-mean-square error (RMSE), and mean relative error (MRE).
- Square of the correlation coefficient (R2): R2 represents the consistency between the processor-estimated and in situ results. The higher the R2 value, the higher the correlation between the processor-estimated results and the in situ results.
- 2.
- Intercept (I) and slope (S): The closer the slope and intercept of the linear fit are to 1 and 0, respectively, the more suitable is the processor for estimating in situ data.
- 3.
- Bias (Bias): This Bias can be used to judge the degree of overestimation or underestimation of the processor-estimated results relative to the in situ data. A positive value indicates that the in situ data are overestimated compared with the processor-corrected result, whereas a negative value indicates an underestimation.
- 4.
- Root-mean-square error (RMSE) and mean relative error (MRE): RMSE can be used to measure the absolute deviation between the processor estimates and the in situ data, whereas MRE represents the relative difference of each processor estimate.
3. Results
3.1. Classification Results for 35 Water Bodies in Qinghai Province
Using three representative lakes as examples, the water bodies in the study area were divided into three types based on the S3-OLCI image of the L2-WFR. The classification results are shown in Figure 4. Taking Rrs (665 nm) > 0.01 sr−1 as the threshold, six lakes with similar spectral characteristics were classified as class I lakes (class I).
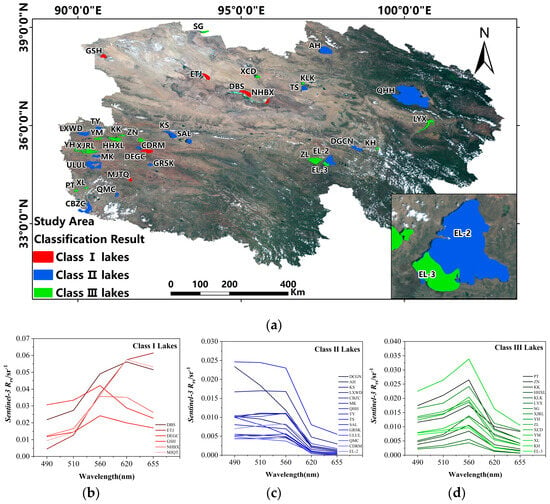
Figure 4.
Map of lake and reservoir classification in Qinghai Province. (a) Spatial distribution of the three types of lakes. (b) Spectral characteristics of the reflectance of class I lake S3 OLCI images. (c) Spectral characteristics of reflectance of class II lakes. (d) Spectral characteristics of reflectance of class III lakes.
In addition, we used the second judgment condition of Rrs (490 nm/560 nm) > 0.8 to classify 14 lakes meeting this condition as class II lakes (class II), with Qinghai Lake as the typical representative. Lakes with Rrs (490 nm/560 nm) ≤ 0.8 were classified as class III lakes (class III), represented by Longyangxia Reservoir. However, Eling Lake is unique. This lake is influenced by the inflow of rivers and shore vegetation, which leads to significant differences in the reflectance spectra between the river mouth and the centre of the lake. Specifically, Rrs (490 nm/560 nm) in the centre of the lake was significantly lower than that in the river mouth. Therefore, Eling Lake can be classified as either Eling Lake-2(EL-2, class II) or Eling Lake-3 (EL-3, class III).
3.2. Accuracy Evaluation of Seven Atmospheric Correction Processors for the Different Classifications of Water Bodies
We conducted a linear fit between the in situ Rrs values of three representative lakes (Dabusun Lake, Qinghai Lake, and Longyangxia Reservoir) and the estimated Rrs values from seven different atmospheric correction processors. A comprehensive evaluation of the performances of these processors is shown in Figure 5. For class I (Dabusun Lake), the ACOLITE and Sen2Cor processors performed relatively better than the other atmospheric correction processors because their fitted lines are closer to the 1:1 line. For class II (Qinghai Lake), both the C2RCC and POLYMER processors had slopes (S) greater than 0.7, intercepts (I) at lower than 0.002, and R2 values greater than 0.5. The estimated Rrs values of the atmospheric correction processors showed a high consistency and correlation with the in situ Rrs. For class III (Longyangxia Reservoir), the C2XC processor had a slope (S) of approximately 1.03, an intercept (I) of approximately 0, and a high degree of overlap between the fitted and 1:1 lines. Its performance is the best from among all processors. Both the C2RCC and POLYMER processors had R2 values greater than 0.79, indicating a high degree of correlation between the estimated Rrs from the atmospheric correction processors and the in situ Rrs. The ACOLITE processor had a fitted line nearly parallel to the 1:1 line, indicating a high accuracy.
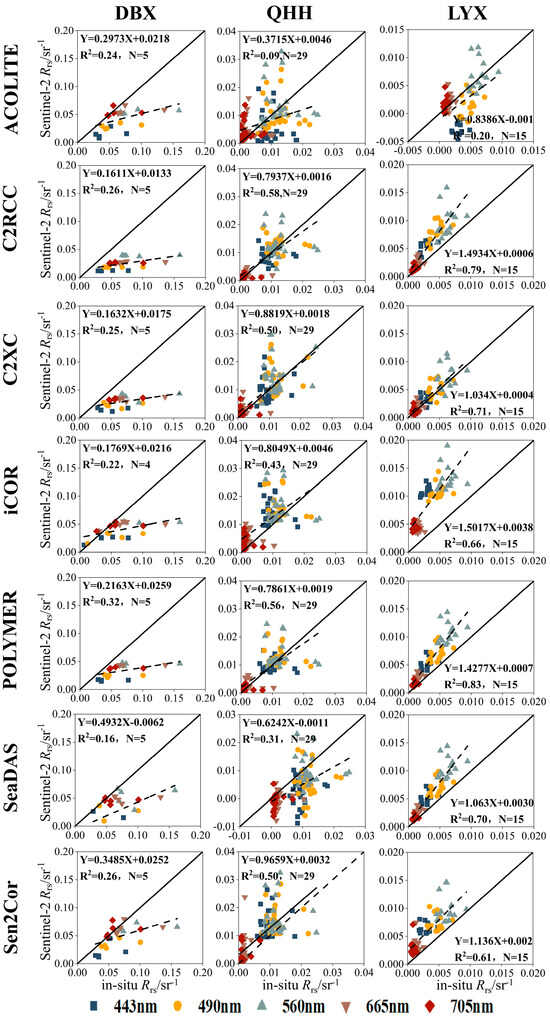
Figure 5.
There are three typical lake reservoirs: Dabusun Lake, Qinghai Lake, and Longyangxia Reservoir. Scatter plot of in situ measured reflectance spectra versus S2- MSI reflectance spectra of different atmospheric correction processors (ACOLITE, C2RCC, C2XC, iCOR, POLYMER, SeaDAS, Sen2Cor). The solid lines represent the 1:1 line, and the dashed lines represent the linear regression line.
According to our findings, we observed significant differences in the performances of the seven atmospheric correction processors when applied to different types of water bodies. We used an accuracy evaluation method for seven atmospheric correction processors to provide a quantitative description of their performances. For the Dabusun Lake, the final scores of the Sen2Cor, ACOLITE, and POLYMER processors were greater than 1, indicating a good performance. The Sen2Cor processor performed best and achieved the highest score (1.38). For the Qinghai Lake, the performances of the POLYMER, C2RCC, and C2XC processors were the best, with final scores greater than 1. The POLYMER processor exhibited the best performance and obtained the highest score (1.49) from among them. It is worth noting that all four processors, C2XC, C2RCC, POLYMER, and ACOLITE, demonstrated a good processing performance for the Longyangxia Reservoir, with the C2XC processor achieving the highest final score (1.37). Overall, the Sen2Cor processor performed best for turbid water bodies such as Dabusun Lake, whereas it showed poor performance for clean water bodies. For clean water bodies, such as Qinghai Lake, and relatively clean water bodies, such as Longyangxia Reservoir, both the C2XC and C2RCC processors, which are based on neural networks, exhibited a good performance, but they were not suitable for turbid water bodies. Surprisingly, the POLYMER processor demonstrated a good performance for all lakes (Figure 6).

Figure 6.
Estimated Rrs results and the in situ Rrs evaluation scores of the seven atmospheric correction processors (ACOLITE, C2RCC, C2XC, iCOR, POLYMER, SeaDAS and Sen2Cor) for three typical lakes (a) Dabusun Lake, (b) Qinghai Lake, and (c) Longyangxia Reservoir.
3.3. Atmospheric Correction Results of 35 Water Bodies
According to the determined optimal atmospheric correction processor for each typical lake, the in situ Rrs values were used as the true values for verifying the estimated Rrs products of the S2-MSI images on the 5 July 2022 (Dabusun Lake) with a 1-day difference, 13 August 2021 (Qinghai Lake) with a 3-day difference, and 6 July 2022 (Longyangxia Reservoir) with a 5-day difference. When the Sen2Cor processor was applied to Dabusun Lake, the MRE decreased gradually with increasing wavelengths. The MRE was less than 30% at 560, 665, and 705 nm, reaching its lowest value at 665 nm. The POLYMER processor was applied to Qinghai Lake, and the results show that the MRE gradually increased with increasing wavelength. At 443, 490, and 560 nm, the MRE was less than 30%, with the minimum value occurring at 443 nm. The C2XC processor was used for Longyangxia Reservoir, and its MRE was less than 30% at 490 nm. Dabusun Lake, Qinghai Lake, and Longyangxia Reservoir showed a consistent trend in RMSE with wavelength. The overall pattern was an initial increase followed by a decrease, reaching a maximum at 560 nm and a minimum at 705 nm. Furthermore, our study found that the atmospheric correction processor estimated the reflectance products with good spatial continuity (Figure 7).
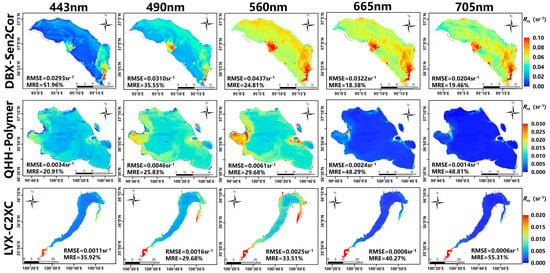
Figure 7.
Dabusun Lake, Qinghai Lake, and Longyangxia Reservoir S2-MSI images at 443, 490, 560, 665, and 705 nm of the atmospheric correction processor Rrs product.
Simultaneously, we applied the three best processors to all study areas to observe the distribution characteristics of the Rrs products in the S2-MSI images (Figure 8). Class I water bodies are relatively turbid with a high reflectance, and the Rrs of the entire lake is approximately 0–0.1 sr−1 (Figure 8a). The class II water bodies are relatively clear, with an Rrs of approximately 0–0.03 sr−1 (Figure 8b). The water bodies in class III are slightly more turbid than those of class II, with an Rrs of approximately 0–0.05 sr−1 (Figure 8c).
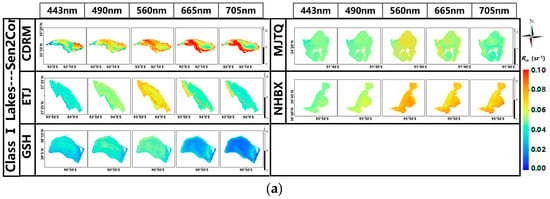
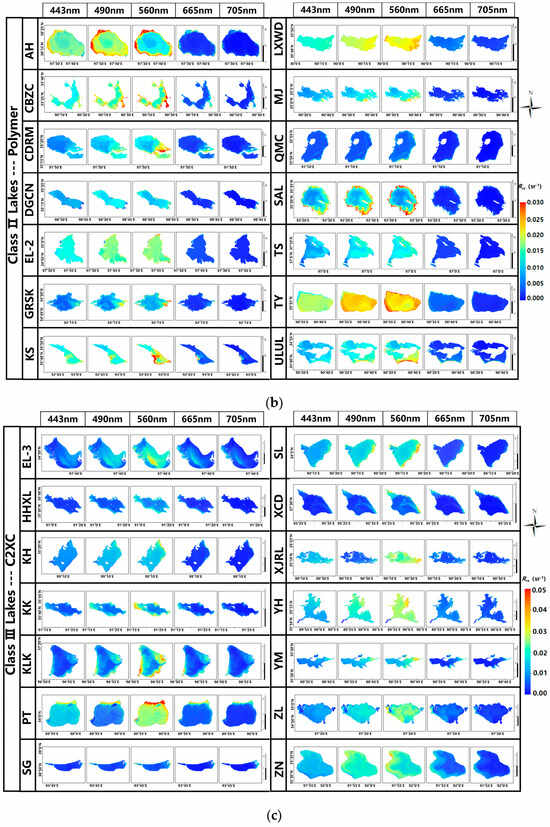
Figure 8.
S2-MSI images of the three types of lakes at 443, 490, 560, 665, and 705 nm of the Rrs product. (a) class Ⅰ lakes using Sen2Cor processor. (b) class Ⅱ lakes using POLYMER processor. (c) class Ⅲ lakes using C2XC processor.
4. Discussion
4.1. Suitability Analysis of Different Types of Water Body Atmospheric Correction Algorithms
For the S2-MSI images, the central wavelengths of the coastal aerosol, blue, green, red, and vegetation red-edge bands were approximately 443, 490, 560, 655, and 705 nm, respectively. The central wavelengths of the S3-OLCI images of bands B3, B4, B6, B8, and B11 were 442.5, 490, 560, 665 and 708.75 nm, respectively. The two images have consistent or similar central wavelengths in these bands. Equation (2) was used to transform the in situ Rrs values into the wavelength range of the S2-MSI and S3-OLCI images. The error between the data from different sensor images was evaluated. As shown in Figure 9, there was a high degree of consistency between the Rrs values of the three typical lake S2-MSI and S3-OLCI images, with all R2 values greater than 0.99.

Figure 9.
Three typical lake reservoirs (a) Dabusun Lake, (b) Qinghai Lake, and (c) Longyangxia Reservoir. The relationship between the S3-OLCI image and the S2-MSI image in terms of reflectance; solid lines represent 1:1 lines, and dotted lines represent linear regression lines.
Based on the three classification results for the 35 lakes and taking the L2-WFR product of S3-OLCI as the true value, optimal atmospheric correction processors were applied to each lake type. The MRE and RMSE for the 35 lakes were calculated, respectively (as shown in Figure 10). In terms of overall accuracy, class II lakes > class III lakes > class I lakes. This may be due to the fact that class I water bodies are turbid water bodies and the Rrs of these water bodies is large, so the calculated error is relatively large.
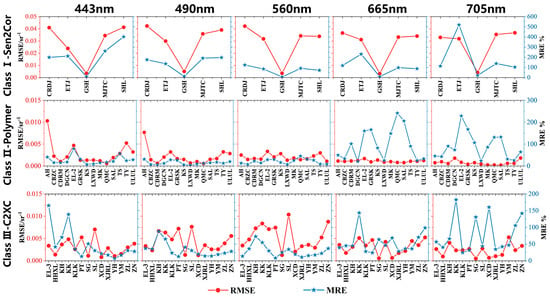
Figure 10.
Statistical results of the error estimation of Rrs of different bands of three types of lake reservoir optimal atmospheric correction processors are represented by RMSE and MRE.
Next, we considered the application effects of the three optimal atmospheric correction processors according to different types of water bodies for the 35 lakes (Figure 11). For class I lakes, the Sen2Cor processor overestimated the Rrs values of the S2 MSI images to a certain extent. This may be due to an underestimation of the radiance of the atmospheric path by the Sen2Cor processor, which was derived from land pixels (Figure 11a).
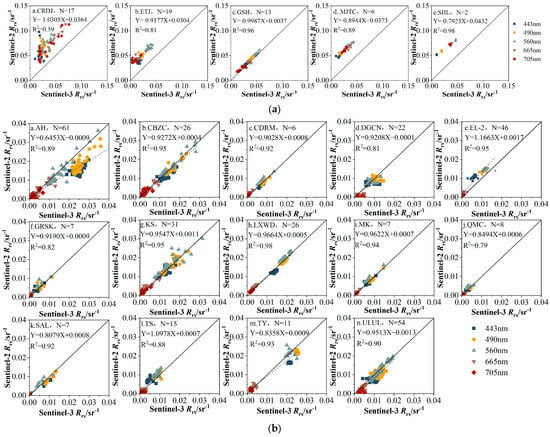
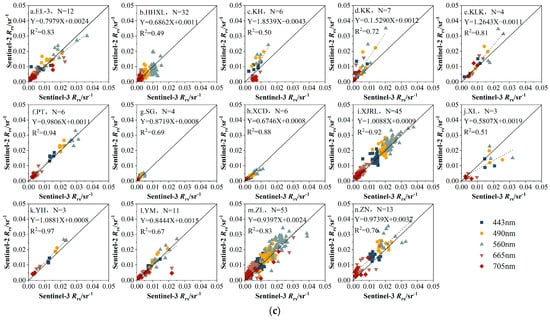
Figure 11.
Scatter plots of Rrs estimated for the three types of lakes using the optimal atmospheric correction processor and the same time period S3 OLCI image Rrs. The solid lines represent the 1:1 lines and the dotted lines represent the linear regression lines. (a) Results estimated by Sen2Cor processor for class I lakes. (b) Results estimated by the POLYMER processor for class II lakes. (c) Results estimated by the C2XC processor for class III lakes.
For class II lakes, the POLYMER processor provided good estimation results for S2 MSI Rrs with correlation coefficients (R2) of above 0.79. The R2 of Lexiewudan Lake (LXWD) reached 0.98, showing a high consistency between the Rrs of S2 MSI and the Rrs of S3 OLCI. The slopes of Aha Lake (AH), Quemocuo Lake (QMC), Salt Lake (SAL), and Taiyang Lake (TY) were below 0.9, indicating an underestimation of their Rrs values. The slopes of Eling Lake-2 (EL-2) and Toso Lake (TS) were slightly greater than 1, suggesting a slight overestimation of Rrs (Figure 11b).
Although the estimated Rrs results of the C2XC processor also exhibited a good accuracy for class III lakes, they were slightly inferior to those of class II lakes. The slopes of Kuhai (KH), Kekao Lake (KK), Keluke Lake (KLK), and Yonghong Lake (YH) were all greater than 1, and the estimated Rrs values of these four lakes were overestimated to some extent after correction by the processor. However, the slopes of Eling Lake-3 (EL-3), Hoh Xil Lake (HHXL), Xiaochaidan Lake (XCD), and Xuelian Lake (XL) were less than 0.8, and the Rrs values of these four lakes were underestimated (Figure 11c).
4.2. Applicability Analysis of Different Atmospheric Correction Processors
For S2-MSI, the POLYMER processor accurately estimated the Rrs values of turbid water bodies (such as Dabusun Lake) and clean water bodies (Qinghai Lake and Longyangxia Reservoir). This may be because, during atmospheric correction, two key parameters, the chlorophyll concentration and the backscattering coefficient of non-covariant particles, were introduced into the bio-optical water reflectance model. The introduction of the backscattering coefficient of noncovariant particles makes this model more suitable for case 2 (water). Based on neural network models, the C2RCC and C2XC processors exhibited better estimation effects for clean water bodies (Qinghai Lake and Longyangxia Reservoir). This is due to the fact that the inversion algorithm of ‘secondary water body regional offshore water colour’ based on bio-optical models has collected a database of five million cases, but most of these sample sets come from typical sea areas and ocean waters around the globe, making them more suitable for clean water bodies. The Sen2Cor processor based on the ‘black pixel’ hypothesis can acquire AOT values based on image retrieval considering that the reflectance of inland water bodies in the NIR band is no longer zero and shows a better performance for turbid water bodies.
The atmospheric correction processor exhibits differences depending on the type of lake. For turbid water bodies, the Sen2cor processor performed better. Scholars have reached similar conclusions in the study of the Poyang Lake in China [50]. For clean water bodies, the POLYMER processor is better such as the Baltic Sea region [3]. For reservoirs with cleaner water bodies, we recommend using a C2XC processor.
5. Conclusions
Through a comparative analysis of the in situ data, we comprehensively assessed the estimation effect of seven common atmospheric correction processors on S2-MSI images. Our results revealed significant performance differences for different types of water bodies. The following conclusions were drawn.
- (1)
- The Sen2Cor, POLYMER, and ACOLITE processors exhibited a good performance for Dabusun Lake. For Qinghai Lake, the POLYMER, C2XC, and C2RCC processors exhibited a better performance, whereas for the Longyangxia Reservoir, C2XC, ACOLITE, C2RCC, and POLYMER exhibited a good performance.
- (2)
- The Sen2Cor processor performed best for turbid waters, such as the Dabusun Lake, and its performance was poor for clean water. Both the C2XC and C2RCC processors displayed a good performance for clean water bodies, such as the Qinghai Lake and Longyangxia Reservoir, but they were not suitable for turbid waters. The POLYMER processor demonstrated good accuracy for all lake types.
- (3)
- Based on the S3 OLCI image remote sensing reflectance waveform features, Rrs (665 nm) > 0.01 sr−1 are classified as class I lakes (Dabusun Lake is a typical representative), Rrs (665 nm) ≤ 0.01 sr−1 and Rrs (510 nm/560 nm) > 0.8 are classified as class II lakes (Qinghai Lake is a typical representative), and Rrs (665 nm) ≤ 0.01 sr−1 and Rrs (510 nm/560 nm) ≤ 0.8 are classified as class III lakes (Longyangxia Reservoir is a typical representative).
- (4)
- Compared with the Rrs values of the S3 OLCI images, the Rrs values estimated by the POLYMER processor for class II lakes showed a high consistency. The Sen2Cor processor overestimated the results for class I lakes. The C2XC processor slightly underestimated or overestimated the results for class III lakes.
Author Contributions
Conceptualisation, Q.S.; Methodology, W.L. and J.S.; Software, J.S.; Validation, W.X.; Formal Analysis, Q.S. and Y.Y.; Investigation, H.G.; Resources, Y.Z. (Yuting Zhou); Data Curation, J.L.; Writing—Original Draft Preparation, W.L.; Writing—Review and Editing, Y.H., Q.S. and Y.Y.; Visualisation, Y.Z. (Yuting Zhang); Supervision, Q.S.; Project Administration, Q.S.; Funding Acquisition, Q.S. All authors have read and agreed to the published version of the manuscript.
Funding
This research was funded by The National Key Research and Development Program of China (grant number 2021YFB3901101).
Data Availability Statement
The data presented in this study are available upon request from the corresponding author.
Acknowledgments
The authors would like to thank Qian Shen from the Key Laboratory of Digital Earth Science, Aerospace Information Research Institute, Chinese Academy of Sciences for the help with writing. We are also grateful to all the anonymous reviewers for their constructive comments on this study.
Conflicts of Interest
The authors declare no conflict of interest.
Abbreviations
| Rrs | reflectance of remote sensing |
| ρpath | the atmospheric path reflectance |
| ρTOA | the top-of-atmosphere reflectance |
| Lu(λ) | the ratio of the upwelling radiance |
| Es(λ) | the downwelling irradiance |
| Lsky(λ) | the reflectance of the sun and sky glint |
| AOT | the aerosol optical thickness |
| ACOLITE | Atmospheric Correction for Operational Land Imager ‘lite’ |
| iCOR | Image Correction for Atmospheric Effects |
| Sen2Cor | Sentinel 2 Atmospheric Correction |
| SeaDAS | the SeaWiFS Data Analysis System |
| POLYMER | the polynomial-based algorithm applied to MERIS |
| C2RCC | Case 2 Regional CoastColour |
| C2XC | C2X-COMPLEX |
| S2-MSI | Sentinel-2 Multi-Spectral Imager |
| S3-OLCI | Sentinel-3 Ocean and Land Colour Instrument |
| L2-WFR | Level-2 Water Full Resolution |
References
- Zhang, H.; Yao, X.; Xiao, J.; Wang, Y.; Sha, T.; Zhang, C. A Dataset of Boundaries of the Lakes (≥1.0 Km2) in Qinghai Province in 2020. Sci. Data Bank 2023, 2, 315–327. [Google Scholar] [CrossRef]
- Zhang, S.; Wang, D.; Gong, F.; Xu, Y.; He, X.; Zhang, X.; Fu, D. Evaluating Atmospheric Correction Methods for Sentinel−2 in Low−to−High−Turbidity Chinese Coastal Waters. Remote Sens. 2023, 15, 2353. [Google Scholar] [CrossRef]
- Warren, M.A.; Simis, S.G.H.; Martinez-Vicente, V.; Poser, K.; Bresciani, M.; Alikas, K.; Spyrakos, E.; Giardino, C.; Ansper, A. Assessment of Atmospheric Correction Algorithms for the Sentinel-2A MultiSpectral Imager over Coastal and Inland Waters. Remote Sens. Environ. 2019, 225, 267–289. [Google Scholar] [CrossRef]
- Gordon, H.R. Calibration Requirements and Methodology for Remote Sensors Viewing the Ocean in the Visible. Remote Sens. Environ. 1987, 22, 103–126. [Google Scholar] [CrossRef]
- Gordon, H.R. Atmospheric Correction of Ocean Color Imagery in the Earth Observing System Era. J. Geophys. Res. Atmos. 1997, 102, 17081–17106. [Google Scholar] [CrossRef]
- Mobley, C.; Werdell, J.; Franz, B.; Ahmad, Z.; Bailey, S. Atmospheric Correction for Satellite Ocean Color Radiometry; NASA: Washington, DC, USA, 2016.
- Gordon, H.R.; Wang, M. Retrieval of Water-Leaving Radiance and Aerosol Optical Thickness over the Oceans with SeaWiFS: A Preliminary Algorithm. Appl. Opt. 1994, 33, 443. [Google Scholar] [CrossRef]
- Antoine, D.; Morel, A. A Multiple Scattering Algorithm for Atmospheric Correction of Remotely Sensed Ocean Colour (MERIS Instrument): Principle and Implementation for Atmospheres Carrying Various Aerosols Including Absorbing Ones. Int. J. Remote Sens. 1999, 20, 1875–1916. [Google Scholar] [CrossRef]
- Prieur, L.; Sathyendranath, S. An Optical Classification of Coastal and Oceanic Waters Based on the Specific Spectral Absorption Curves of Phytoplankton Pigments, Dissolved Organic Matter, and Other Particulate Materials1: Optical Classification. Limnol. Oceanogr. 1981, 26, 671–689. [Google Scholar] [CrossRef]
- Moore, G.F.; Aiken, J.; Lavender, S.J. The Atmospheric Correction of Water Colour and the Quantitative Retrieval of Suspended Particulate Matter in Case II Waters: Application to MERIS. Int. J. Remote Sens. 1999, 20, 1713–1733. [Google Scholar] [CrossRef]
- Ruddick, K.G.; Ovidio, F.; Rijkeboer, M. Atmospheric Correction of SeaWiFS Imagery for Turbid Coastal and Inland Waters. Appl. Opt. 2000, 39, 897–912. [Google Scholar] [CrossRef]
- Hu, C.; Carder, K.L.; Muller-Karger, F.E. Atmospheric Correction of SeaWiFS Imagery over Turbid Coastal Waters: A Practical Method. Remote Sens. Environ. 2000, 74, 195–206. [Google Scholar] [CrossRef]
- Wang, M.; Shi, W. The NIR-SWIR Combined Atmospheric Correction Approach for MODIS Ocean Color Data Processing. Opt. Express 2007, 15, 15722–15733. [Google Scholar] [CrossRef]
- He, X.; Bai, Y.; Pan, D.; Tang, J.; Wang, D. Atmospheric Correction of Satellite Ocean Color Imagery Using the Ultraviolet Wavelength for Highly Turbid Waters. Opt. Express 2012, 20, 20754–20770. [Google Scholar] [CrossRef]
- Steinmetz, F.; Ramon, D. Sentinel-2 MSI and Sentinel-3 OLCI Consistent Ocean Colour Products Using POLYMER. In Proceedings of the Conference on Remote Sensing of the Open and Coastal Ocean and Inland Waters, Honolulu, HI, USA, 24–25 September 2018; Volume 10778, p. 107780E. [Google Scholar]
- Steinmetz, F.; Deschamps, P.-Y.; Ramon, D. Atmospheric Correction in Presence of Sun Glint: Application to MERIS. Opt. Express 2011, 19, 9783. [Google Scholar] [CrossRef] [PubMed]
- Schiller, H.; Doerffer, R. Neural Network for Emulation of an Inverse Model Operational Derivation of Case II Water Properties from MERIS Data. Int. J. Remote Sens. 1999, 20, 1735–1746. [Google Scholar] [CrossRef]
- Doerffer, R.; Goryl, P.; Brockmann, C.; Bourg, L. Algorithm Theoretical Basis Document (ATBD) for L2 Processing of MERIS Data of Case 2 Waters, 4th Reprocessing; Brockmann Consult: Hamburg, Germany, 2015. [Google Scholar]
- Callieco, F.; Dell’Acqua, F. A Comparison between Two Radiative Transfer Models for Atmospheric Correction over a Wide Range of Wavelengths. Int. J. Remote Sens. 2011, 32, 1357–1370. [Google Scholar] [CrossRef]
- Vanhellemont, Q.; Ruddick, K. Advantages of High Quality SWIR Bands for Ocean Colour Processing: Examples from Landsat-8. Remote Sens. Environ. 2015, 161, 89–106. [Google Scholar] [CrossRef]
- Vanhellemont, Q.; Ruddick, K. Turbid Wakes Associated with Offshore Wind Turbines Observed with Landsat 8. Remote Sens. Environ. 2014, 145, 105–115. [Google Scholar] [CrossRef]
- Vanhellemont, Q.; Ruddick, K. Atmospheric Correction of Metre-Scale Optical Satellite Data for Inland and Coastal Water Applications. Remote Sens. Environ. 2018, 216, 586–597. [Google Scholar] [CrossRef]
- Vanhellemont, Q. Sensitivity Analysis of the Dark Spectrum Fitting Atmospheric Correction for Metre- and Decametre-Scale Satellite Imagery Using Autonomous Hyperspectral Radiometry. Opt. Express 2020, 28, 29948–29965. [Google Scholar] [CrossRef]
- Vanhellemont, Q.; Ruddick, K. Atmospheric Correction of Sentinel-3/OLCI Data for Mapping of Suspended Particulate Matter and Chlorophyll-a Concentration in Belgian Turbid Coastal Waters. Remote Sens. Environ. 2021, 256, 112284. [Google Scholar] [CrossRef]
- Vanhellemont, Q. Adaptation of the Dark Spectrum Fitting Atmospheric Correction for Aquatic Applications of the Landsat and Sentinel-2 Archives. Remote Sens. Environ. 2019, 225, 175–192. [Google Scholar] [CrossRef]
- Sterckx, S.; Knaeps, E.; Ruddick, K. Detection and Correction of Adjacency Effects in Hyperspectral Airborne Data of Coastal and Inland Waters: The Use of the near Infrared Similarity Spectrum. Int. J. Remote Sens. 2011, 32, 6479–6505. [Google Scholar] [CrossRef]
- De Keukelaere, L.; Sterckx, S.; Adriaensen, S.; Knaeps, E.; Reusen, I.; Giardino, C.; Bresciani, M.; Hunter, P.; Neil, C.; Van der Zande, D.; et al. Atmospheric Correction of Landsat-8/OLI and Sentinel-2/MSI Data Using iCOR Algorithm: Validation for Coastal and Inland Waters. Eur. J. Remote Sens. 2018, 51, 525–542. [Google Scholar] [CrossRef]
- Sterckx, S.; Knaeps, S.; Kratzer, S.; Ruddick, K. SIMilarity Environment Correction (SIMEC) Applied to MERIS Data over Inland and Coastal Waters. Remote Sens. Environ. 2015, 157, 96–110. [Google Scholar] [CrossRef]
- Kaufman, Y.J.; Sendra, C. Algorithm for Automatic Atmospheric Corrections to Visible and Near-IR Satellite Imagery. Int. J. Remote Sens. 1988, 9, 1357–1381. [Google Scholar] [CrossRef]
- Novoa, S.; Doxaran, D.; Ody, A.; Vanhellemont, Q.; Lafon, V.; Lubac, B.; Gernez, P. Atmospheric Corrections and Multi-Conditional Algorithm for Multi-Sensor Remote Sensing of Suspended Particulate Matter in Low-to-High Turbidity Levels Coastal Waters. Remote Sens. 2017, 9, 61. [Google Scholar] [CrossRef]
- Wang, M.; Bailey, S.W. Correction of Sun Glint Contamination on the SeaWiFS Ocean and Atmosphere Products. Appl. Opt. 2001, 40, 4790–4798. [Google Scholar] [CrossRef]
- Harmel, T.; Chami, M.; Tormos, T.; Reynaud, N.; Danis, P.-A. Sunglint Correction of the Multi-Spectral Instrument (MSI)-SENTINEL-2 Imagery over Inland and Sea Waters from SWIR Bands. Remote Sens. Environ. 2018, 204, 308–321. [Google Scholar] [CrossRef]
- Brockmann, C.; Doerffer, R.; Peters, M.; Kerstin, S.; Embacher, S.; Ruescas, A. Evolution of the C2RCC Neural Network for Sentinel 2 and 3 for the Retrieval of Ocean Colour Products in Normal and Extreme Optically Complex Waters. Living Planet Symp. 2016, 740, 54. [Google Scholar]
- Soriano-González, J.; Urrego, E.P.; Sòria-Perpinyà, X.; Angelats, E.; Alcaraz, C.; Delegido, J.; Ruíz-Verdú, A.; Tenjo, C.; Vicente, E.; Moreno, J. Towards the Combination of C2RCC Processors for Improving Water Quality Retrieval in Inland and Coastal Areas. Remote Sens. 2022, 14, 1124. [Google Scholar] [CrossRef]
- Pereira-Sandoval, M.; Ruescas, A.; Urrego, P.; Ruiz-Verdú, A.; Delegido, J.; Tenjo, C.; Soria-Perpinyà, X.; Vicente, E.; Soria, J.; Moreno, J. Evaluation of Atmospheric Correction Algorithms over Spanish Inland Waters for Sentinel-2 Multi Spectral Imagery Data. Remote Sens. 2019, 11, 1469. [Google Scholar] [CrossRef]
- Katlane, R.; Dupouy, C.; Kilani, B.E.; Berges, J.C. Estimation of Chlorophyll and Turbidity Using Sentinel 2A and EO1 Data in Kneiss Archipelago Gulf of Gabes, Tunisia. Int. J. Geosci. 2020, 11, 708–728. [Google Scholar] [CrossRef]
- Li, S.; Song, K.; Li, Y.; Liu, G.; Wen, Z.; Shang, Y.; Lyu, L.; Fang, C. Performances of Atmospheric Correction Processors for Sentinel-2 MSI Imagery Over Typical Lakes Across China. IEEE J. Sel. Top. Appl. Earth Obs. Remote Sens. 2023, 16, 2065–2078. [Google Scholar] [CrossRef]
- Shen, M.; Duan, H.; Cao, Z.; Xue, K.; Qi, T.; Ma, J.; Liu, D.; Song, K.; Huang, C.; Song, X. Sentinel-3 OLCI Observations of Water Clarity in Large Lakes in Eastern China: Implications for SDG 6.3.2 Evaluation. Remote Sens. Environ. 2020, 247, 111950. [Google Scholar] [CrossRef]
- Li, Q.; Jiang, L.; Chen, Y.; Wang, L.; Wang, L. Evaluation of Seven Atmospheric Correction Algorithms for OLCI Images over the Coastal Waters of Qinhuangdao in Bohai Sea. Reg. Stud. Mar. Sci. 2022, 56, 102711. [Google Scholar] [CrossRef]
- Sánchez-Zapero, J.; Camacho, F.; Martínez-Sánchez, E.; Gorroño, J.; León-Tavares, J.; Benhadj, I.; Toté, C.; Swinnen, E.; Muñoz-Sabater, J. Global Estimates of Surface Albedo from Sentinel-3 OLCI and SLSTR Data for Copernicus Climate Change Service: Algorithm and Preliminary Validation. Remote Sens. Environ. 2023, 287, 113460. [Google Scholar] [CrossRef]
- Long, T.; Jiao, W.; He, G.; Wang, G.; Zhang, Z. Digital orthophoto map products and automated generation algorithms of Chinese optical satellites. Natl. Remote Sens. Bulletin. 2023, 27, 635–650. [Google Scholar] [CrossRef]
- Tang, J.; Tian, G.; Wang, X.; Wang, X.; Song, Q. The Methods of Water Spectra Measurement and Analysis I: Above-Water Method. J. Remote Sens. 2004, 8, 37–44. [Google Scholar]
- Mobley, C.D. Estimation of the Remote-Sensing Reflectance from above-Surface Measurements. Appl. Opt. 1999, 38, 7442–7455. [Google Scholar] [CrossRef]
- Yue, Y.; Qing, S.; Diao, R.; Hao, Y. Remote Sensing of Suspended Particulate Matter in Optically Complex Estuarine and Inland Waters Based on Optical Classification. J. Coast. Res. 2020, 102, 303–317. [Google Scholar] [CrossRef]
- Morel, A.; Prieur, L. Analysis of Variations in Ocean Color1: Ocean Color Analysis. Limnol. Oceanogr. 1977, 22, 709–722. [Google Scholar] [CrossRef]
- Pahlevan, N.; Mangin, A.; Balasubramanian, S.V.; Smith, B.; Alikas, K.; Arai, K.; Barbosa, C.; Bélanger, S.; Binding, C.; Bresciani, M.; et al. ACIX-Aqua: A Global Assessment of Atmospheric Correction Methods for Landsat-8 and Sentinel-2 over Lakes, Rivers, and Coastal Waters. Remote Sens. Environ. 2021, 258, 112366. [Google Scholar] [CrossRef]
- Mayer, B.; Kylling, A. Technical Note: The libRadtran Software Package for Radiative Transfer Calculations—Description and Examples of Use. Atmos. Chem. Phys. 2005, 5, 1855–1877. [Google Scholar] [CrossRef]
- Müller, D.; Krasemann, H.; Brewin, R.J.W.; Brockmann, C.; Deschamps, P.-Y.; Doerffer, R.; Fomferra, N.; Franz, B.A.; Grant, M.G.; Groom, S.B.; et al. The Ocean Colour Climate Change Initiative: I. A Methodology for Assessing Atmospheric Correction Processors Based on in-Situ Measurements. Remote Sens. Environ. 2015, 162, 242–256. [Google Scholar] [CrossRef]
- Qin, P.; Simis, S.G.H.; Tilstone, G.H. Radiometric Validation of Atmospheric Correction for MERIS in the Baltic Sea Based on Continuous Observations from Ships and AERONET-OC. Remote Sens. Environ. 2017, 200, 263–280. [Google Scholar] [CrossRef]
- Li, H.; Kuang, R.; Song, Z. Evaluation of Atmospheric Correction Methods for Sentinel-2 Image—A Case Study of Poyang Lake. Spacecr. Recovery Remote Sens. 2021, 42, 108–119. [Google Scholar] [CrossRef]
Disclaimer/Publisher’s Note: The statements, opinions and data contained in all publications are solely those of the individual author(s) and contributor(s) and not of MDPI and/or the editor(s). MDPI and/or the editor(s) disclaim responsibility for any injury to people or property resulting from any ideas, methods, instructions or products referred to in the content. |
© 2023 by the authors. Licensee MDPI, Basel, Switzerland. This article is an open access article distributed under the terms and conditions of the Creative Commons Attribution (CC BY) license (https://creativecommons.org/licenses/by/4.0/).