
Dynamic Plant–Herbivore Interactions between Bison Space Use and Vegetation Heterogeneity in a Tallgrass Prairie


Abstract
:1. Introduction
2. Methods
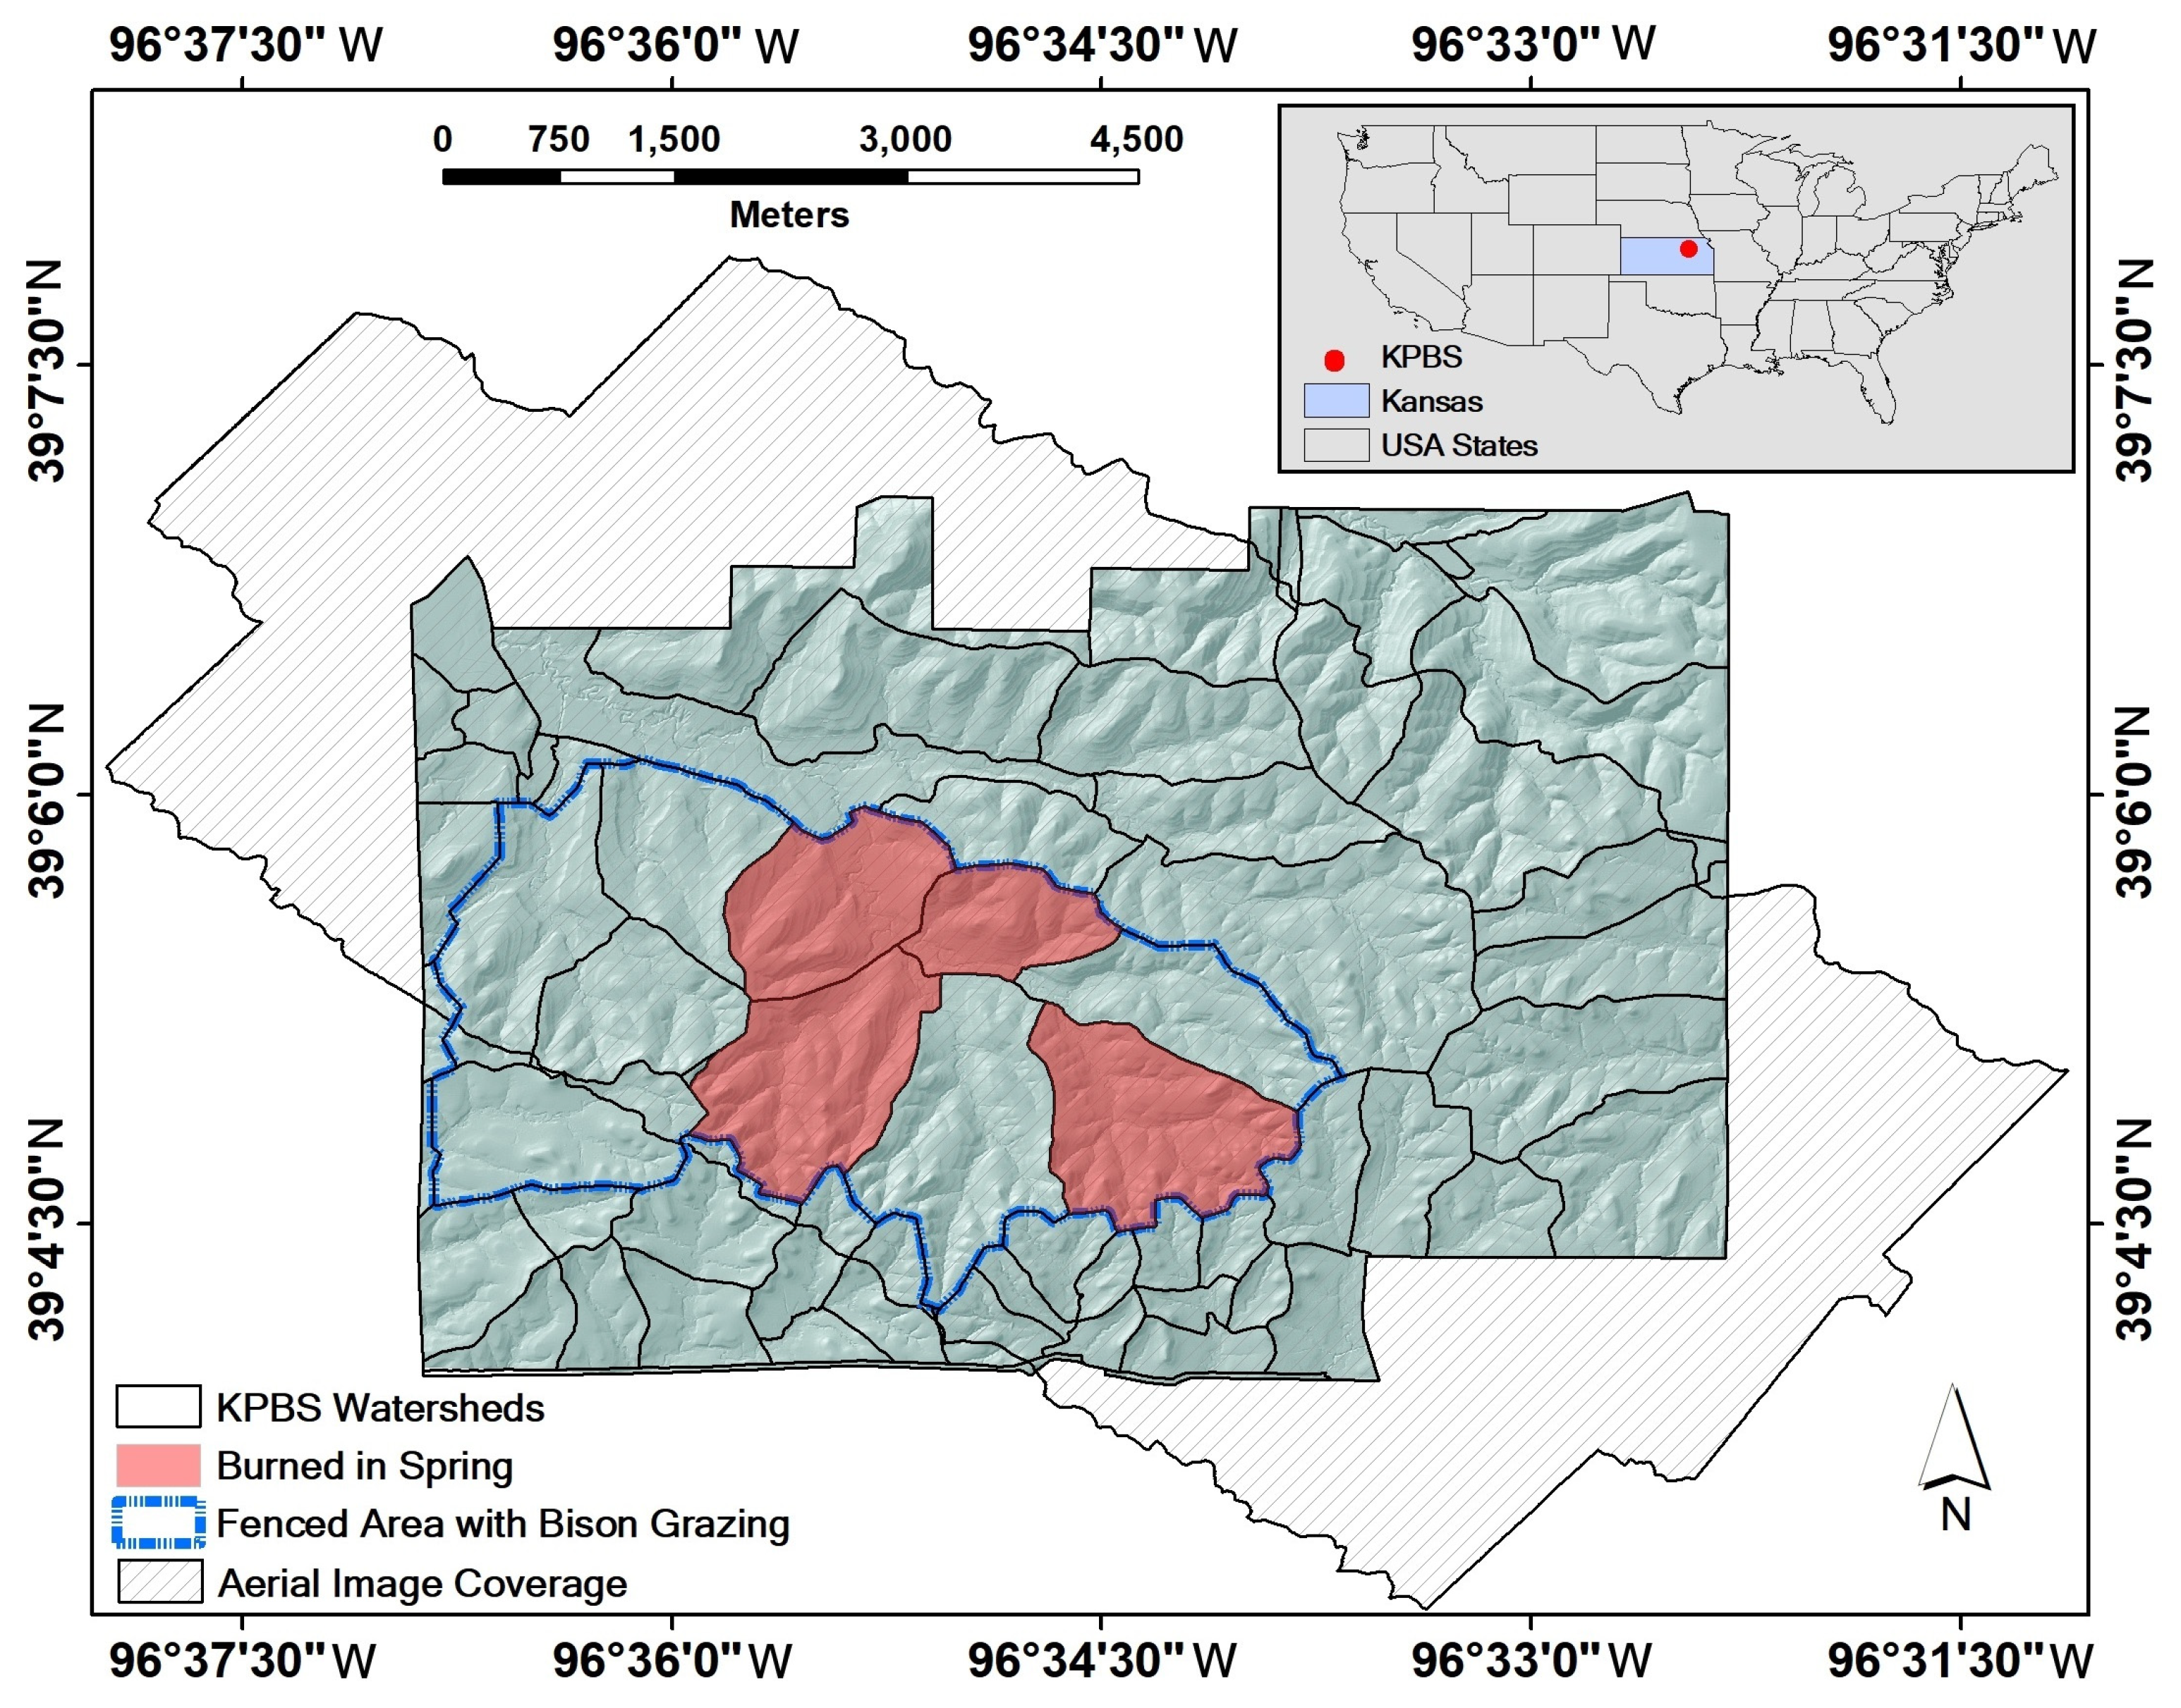
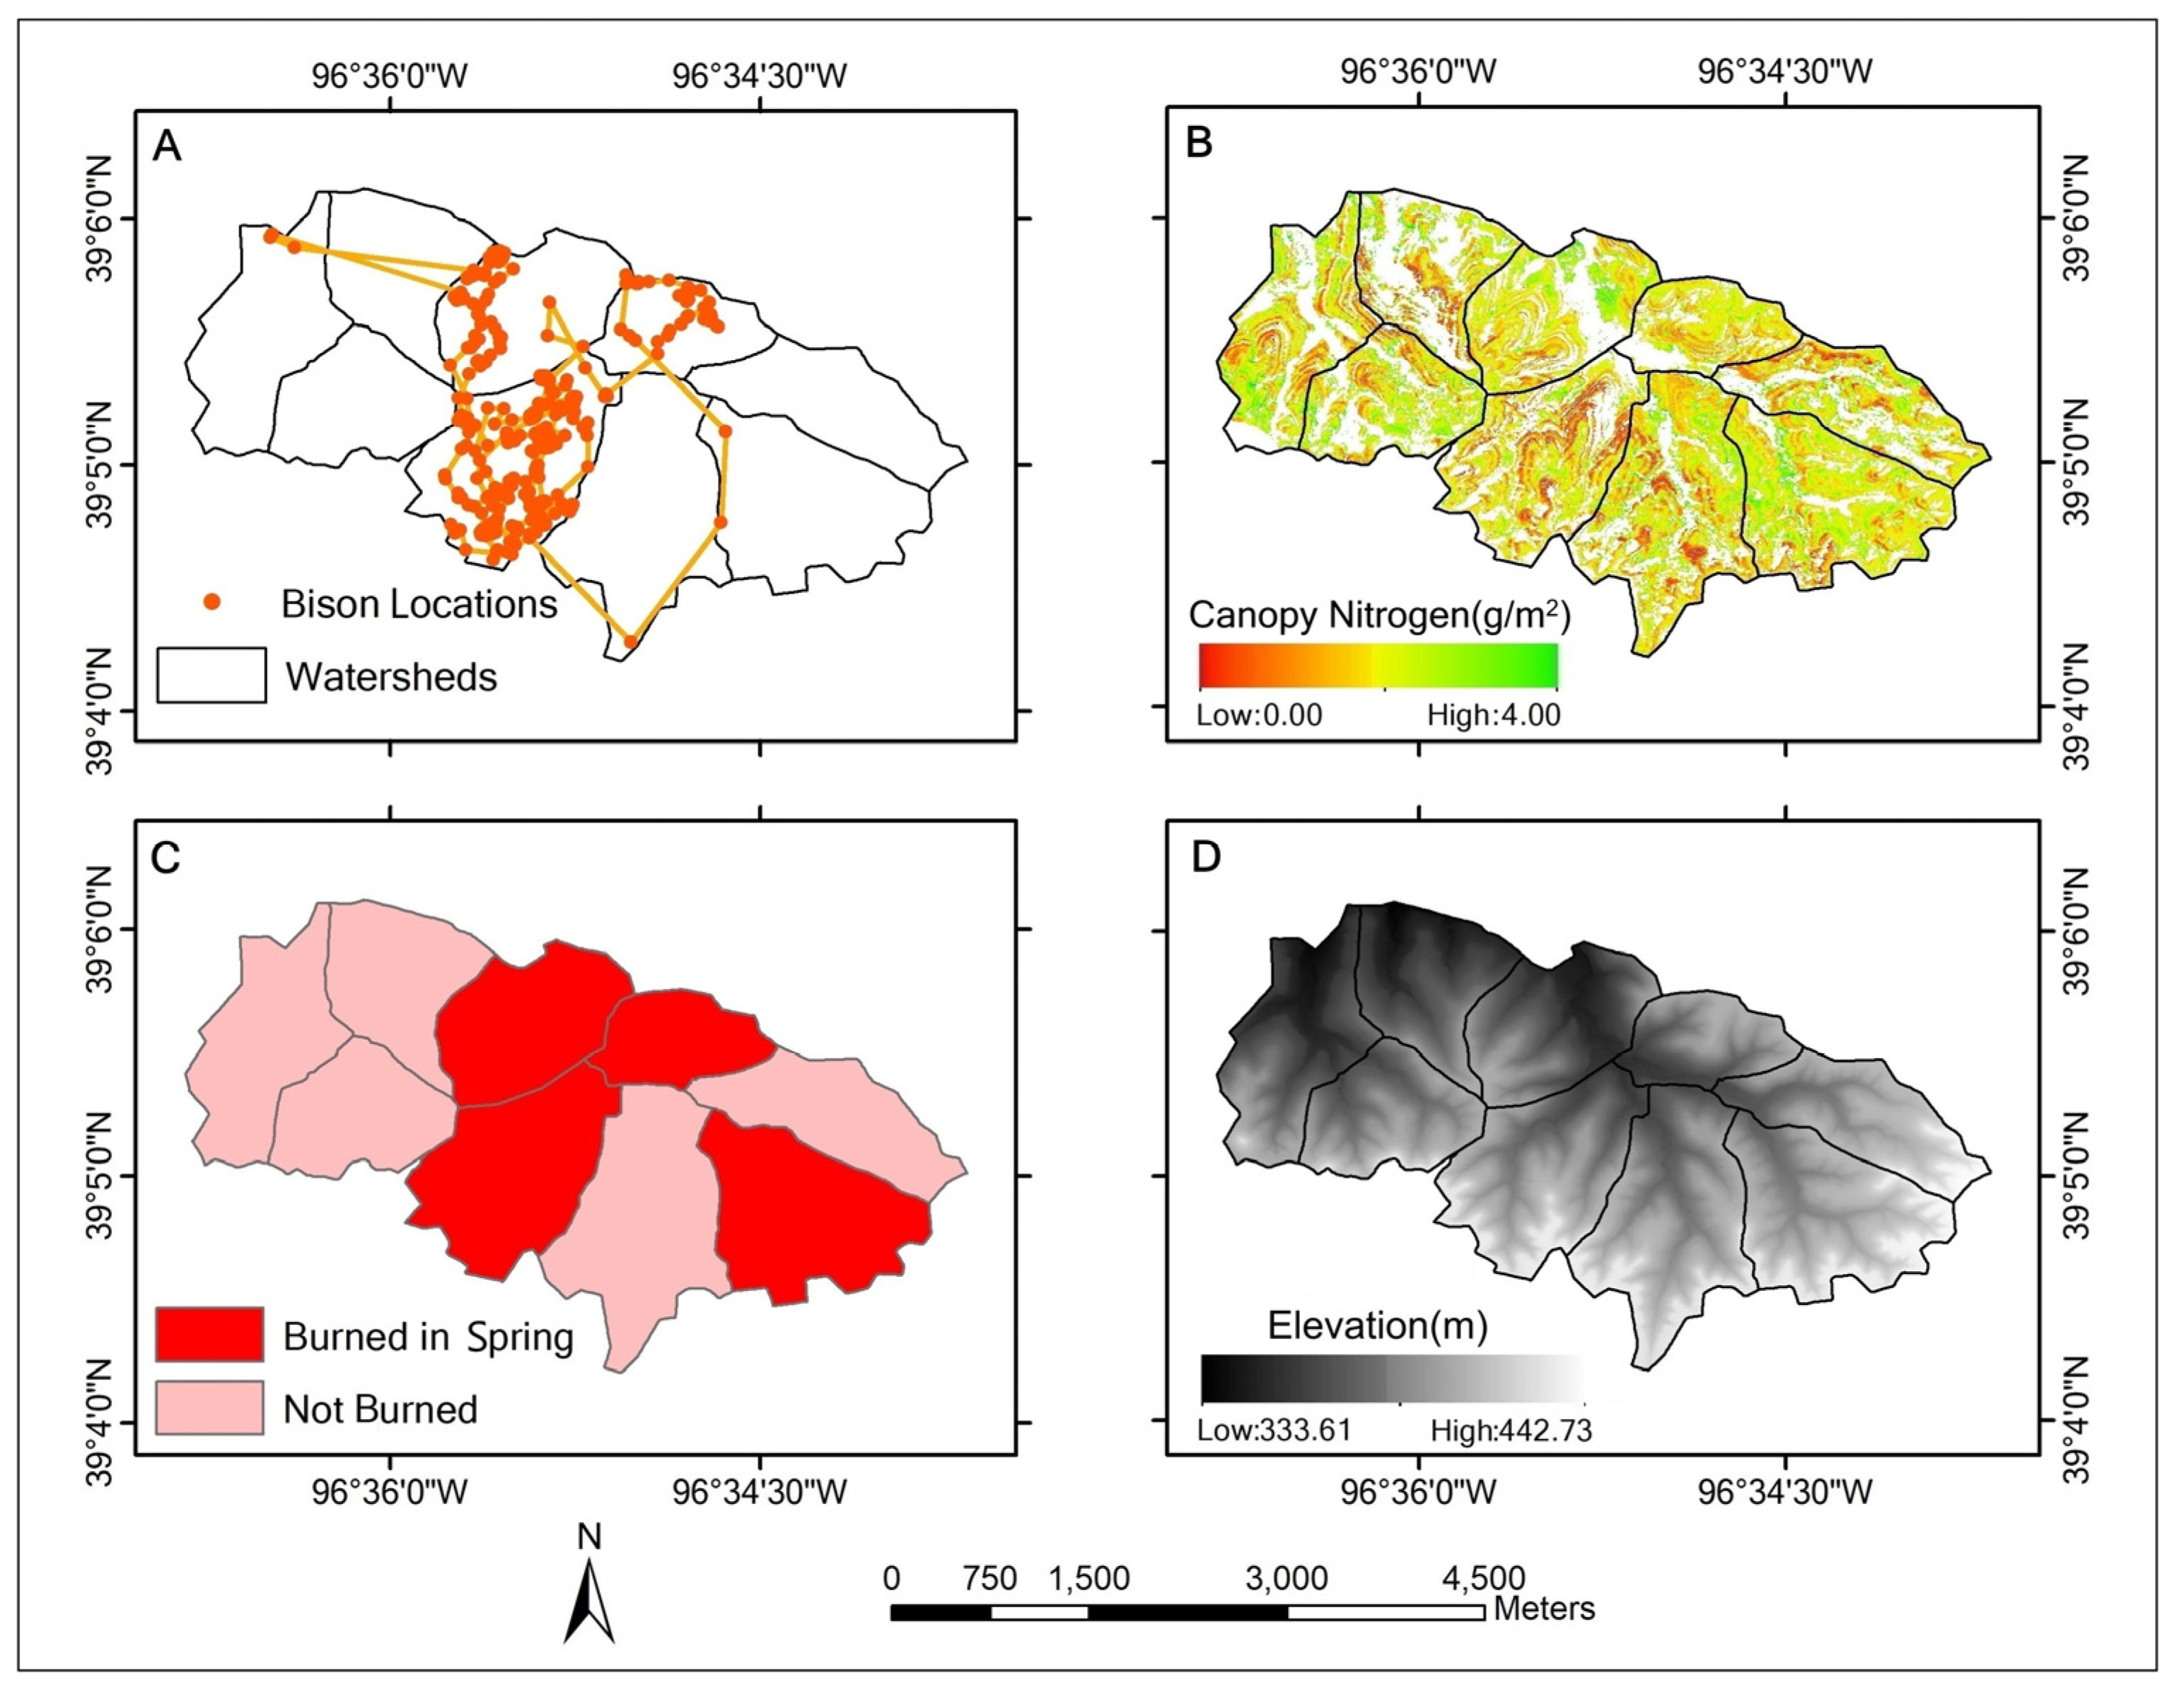
2.1. Study Area
2.2. Data Collection and Preprocessing
2.3. Data Analysis
2.3.1. Assessment of Bison Space Use at a Patch Scale
2.3.2. Quantification of Patch-Scale Vegetation Heterogeneity Related to Bison Space Use
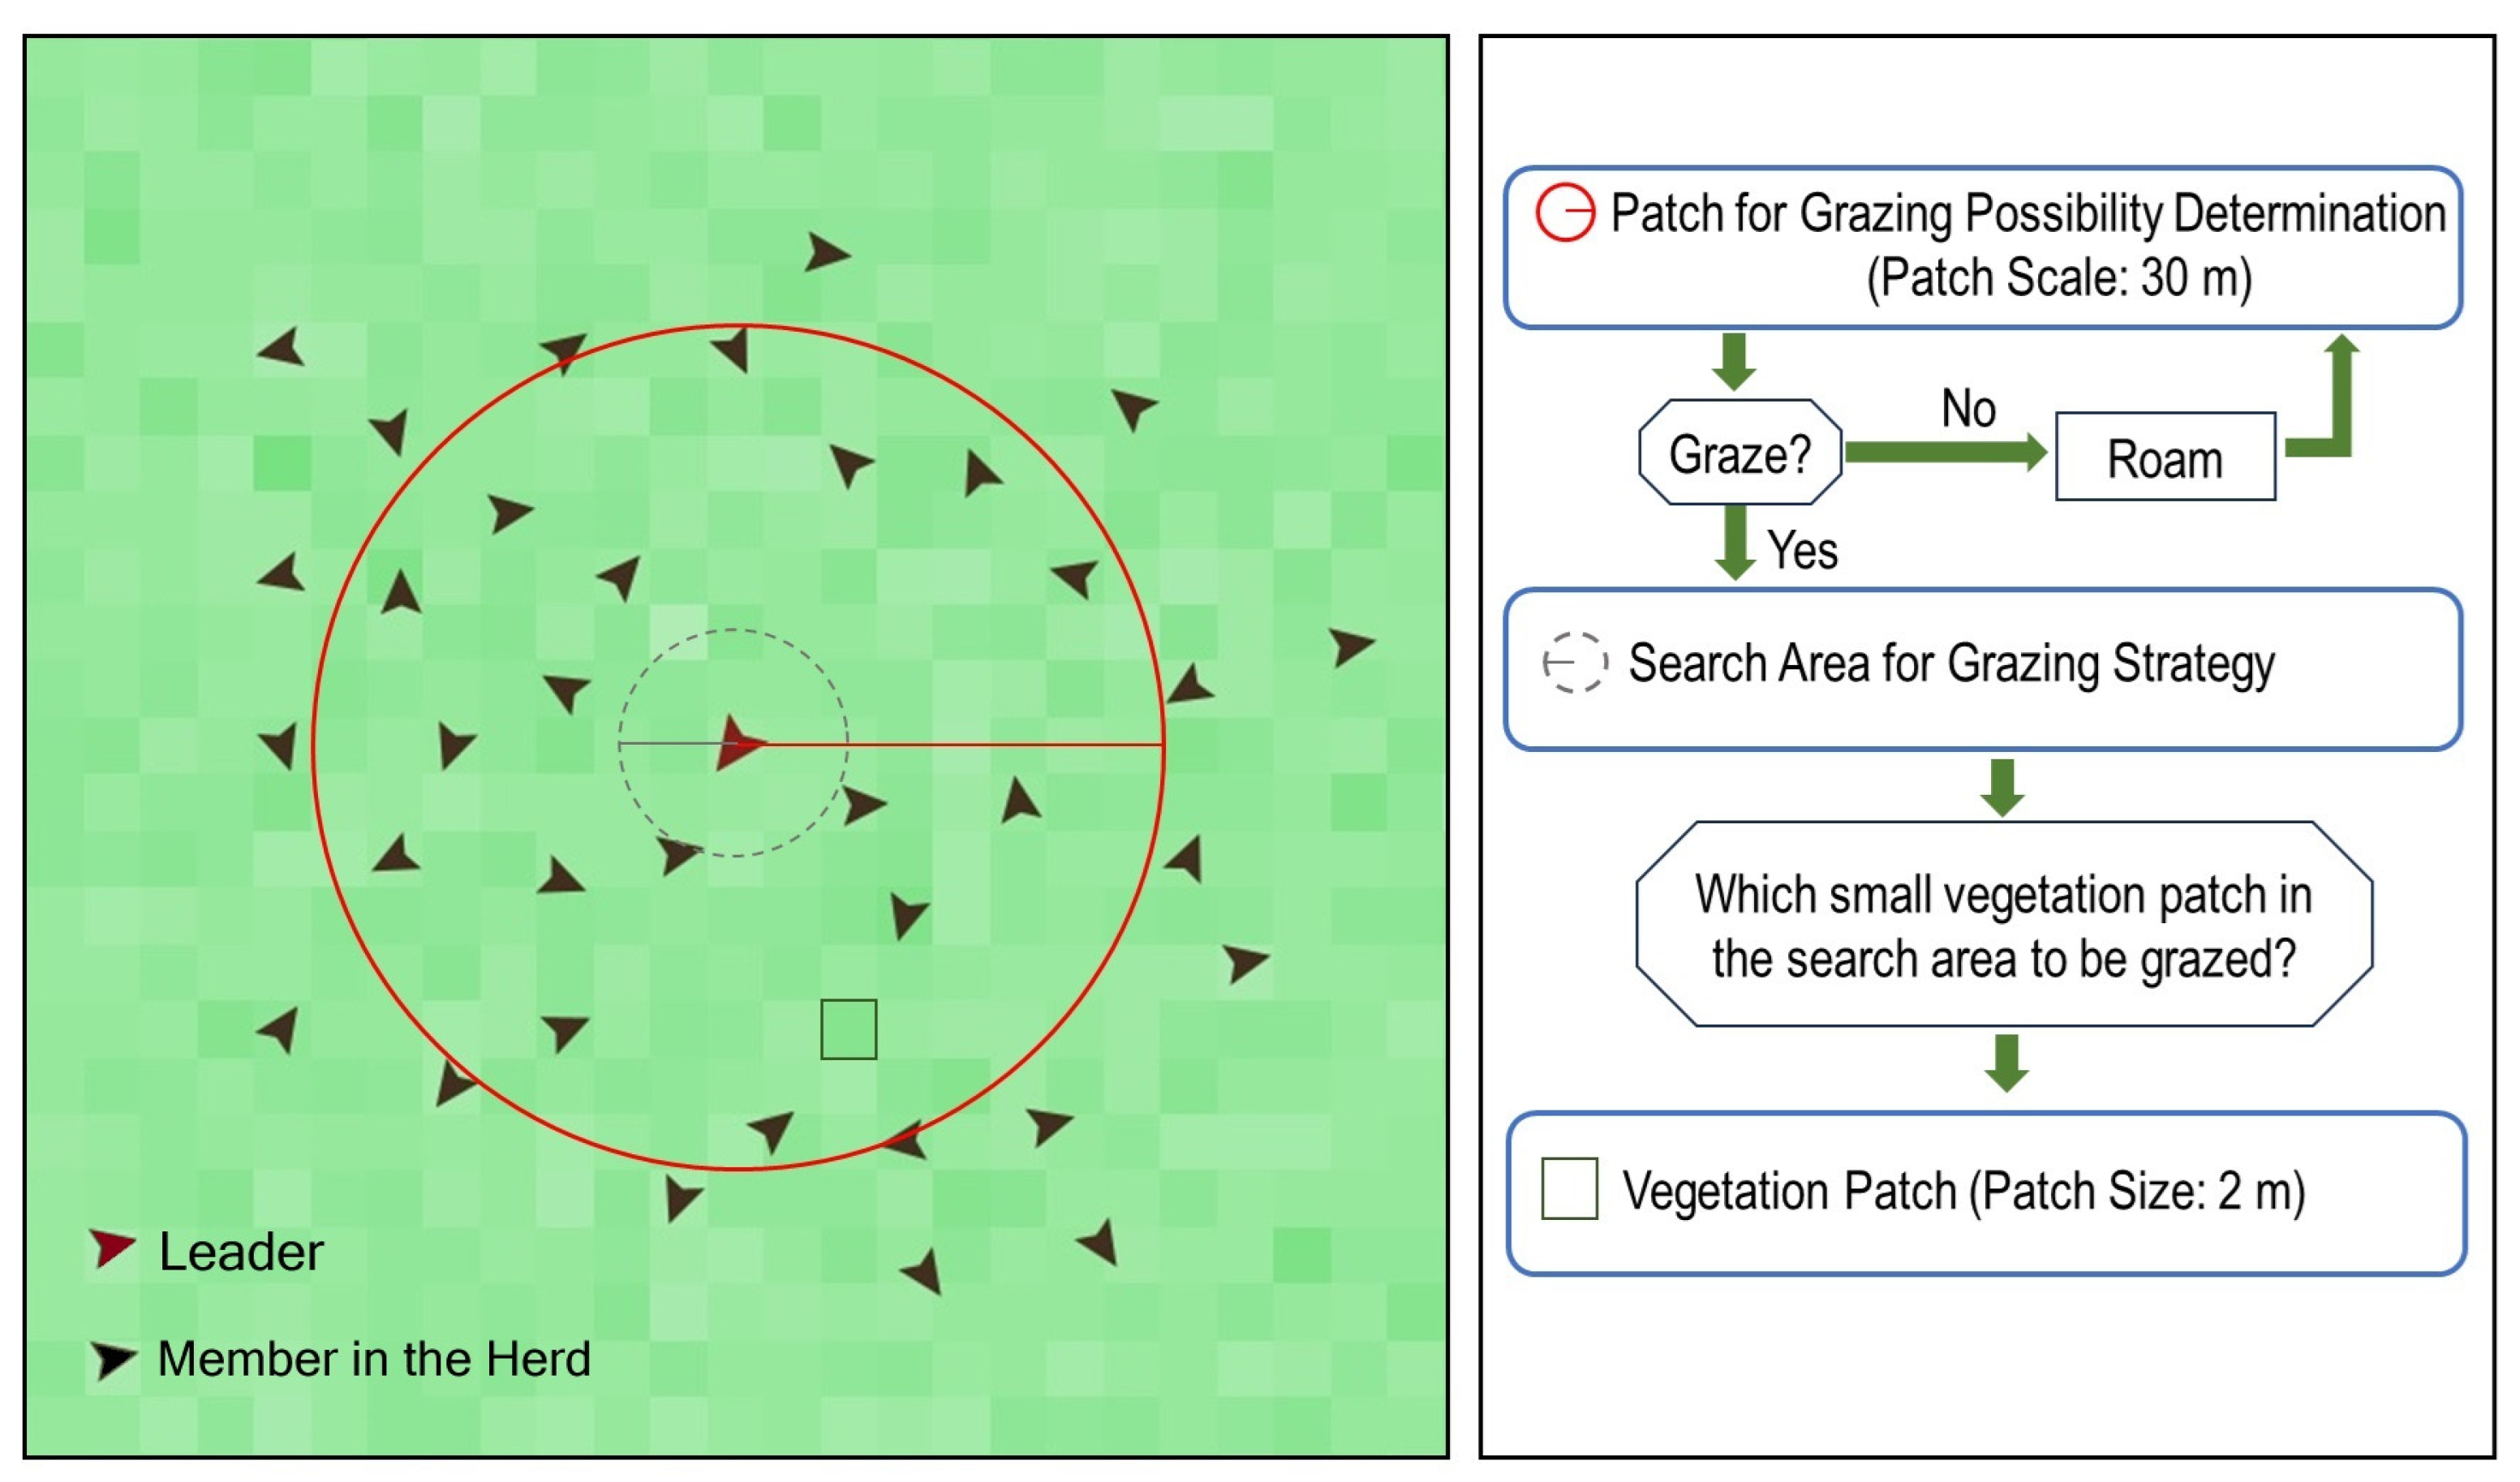
2.3.3. Simulation of Bison and Vegetation Interactions
3. Results
3.1. Assessment of Bison Space Use at a Patch Scale
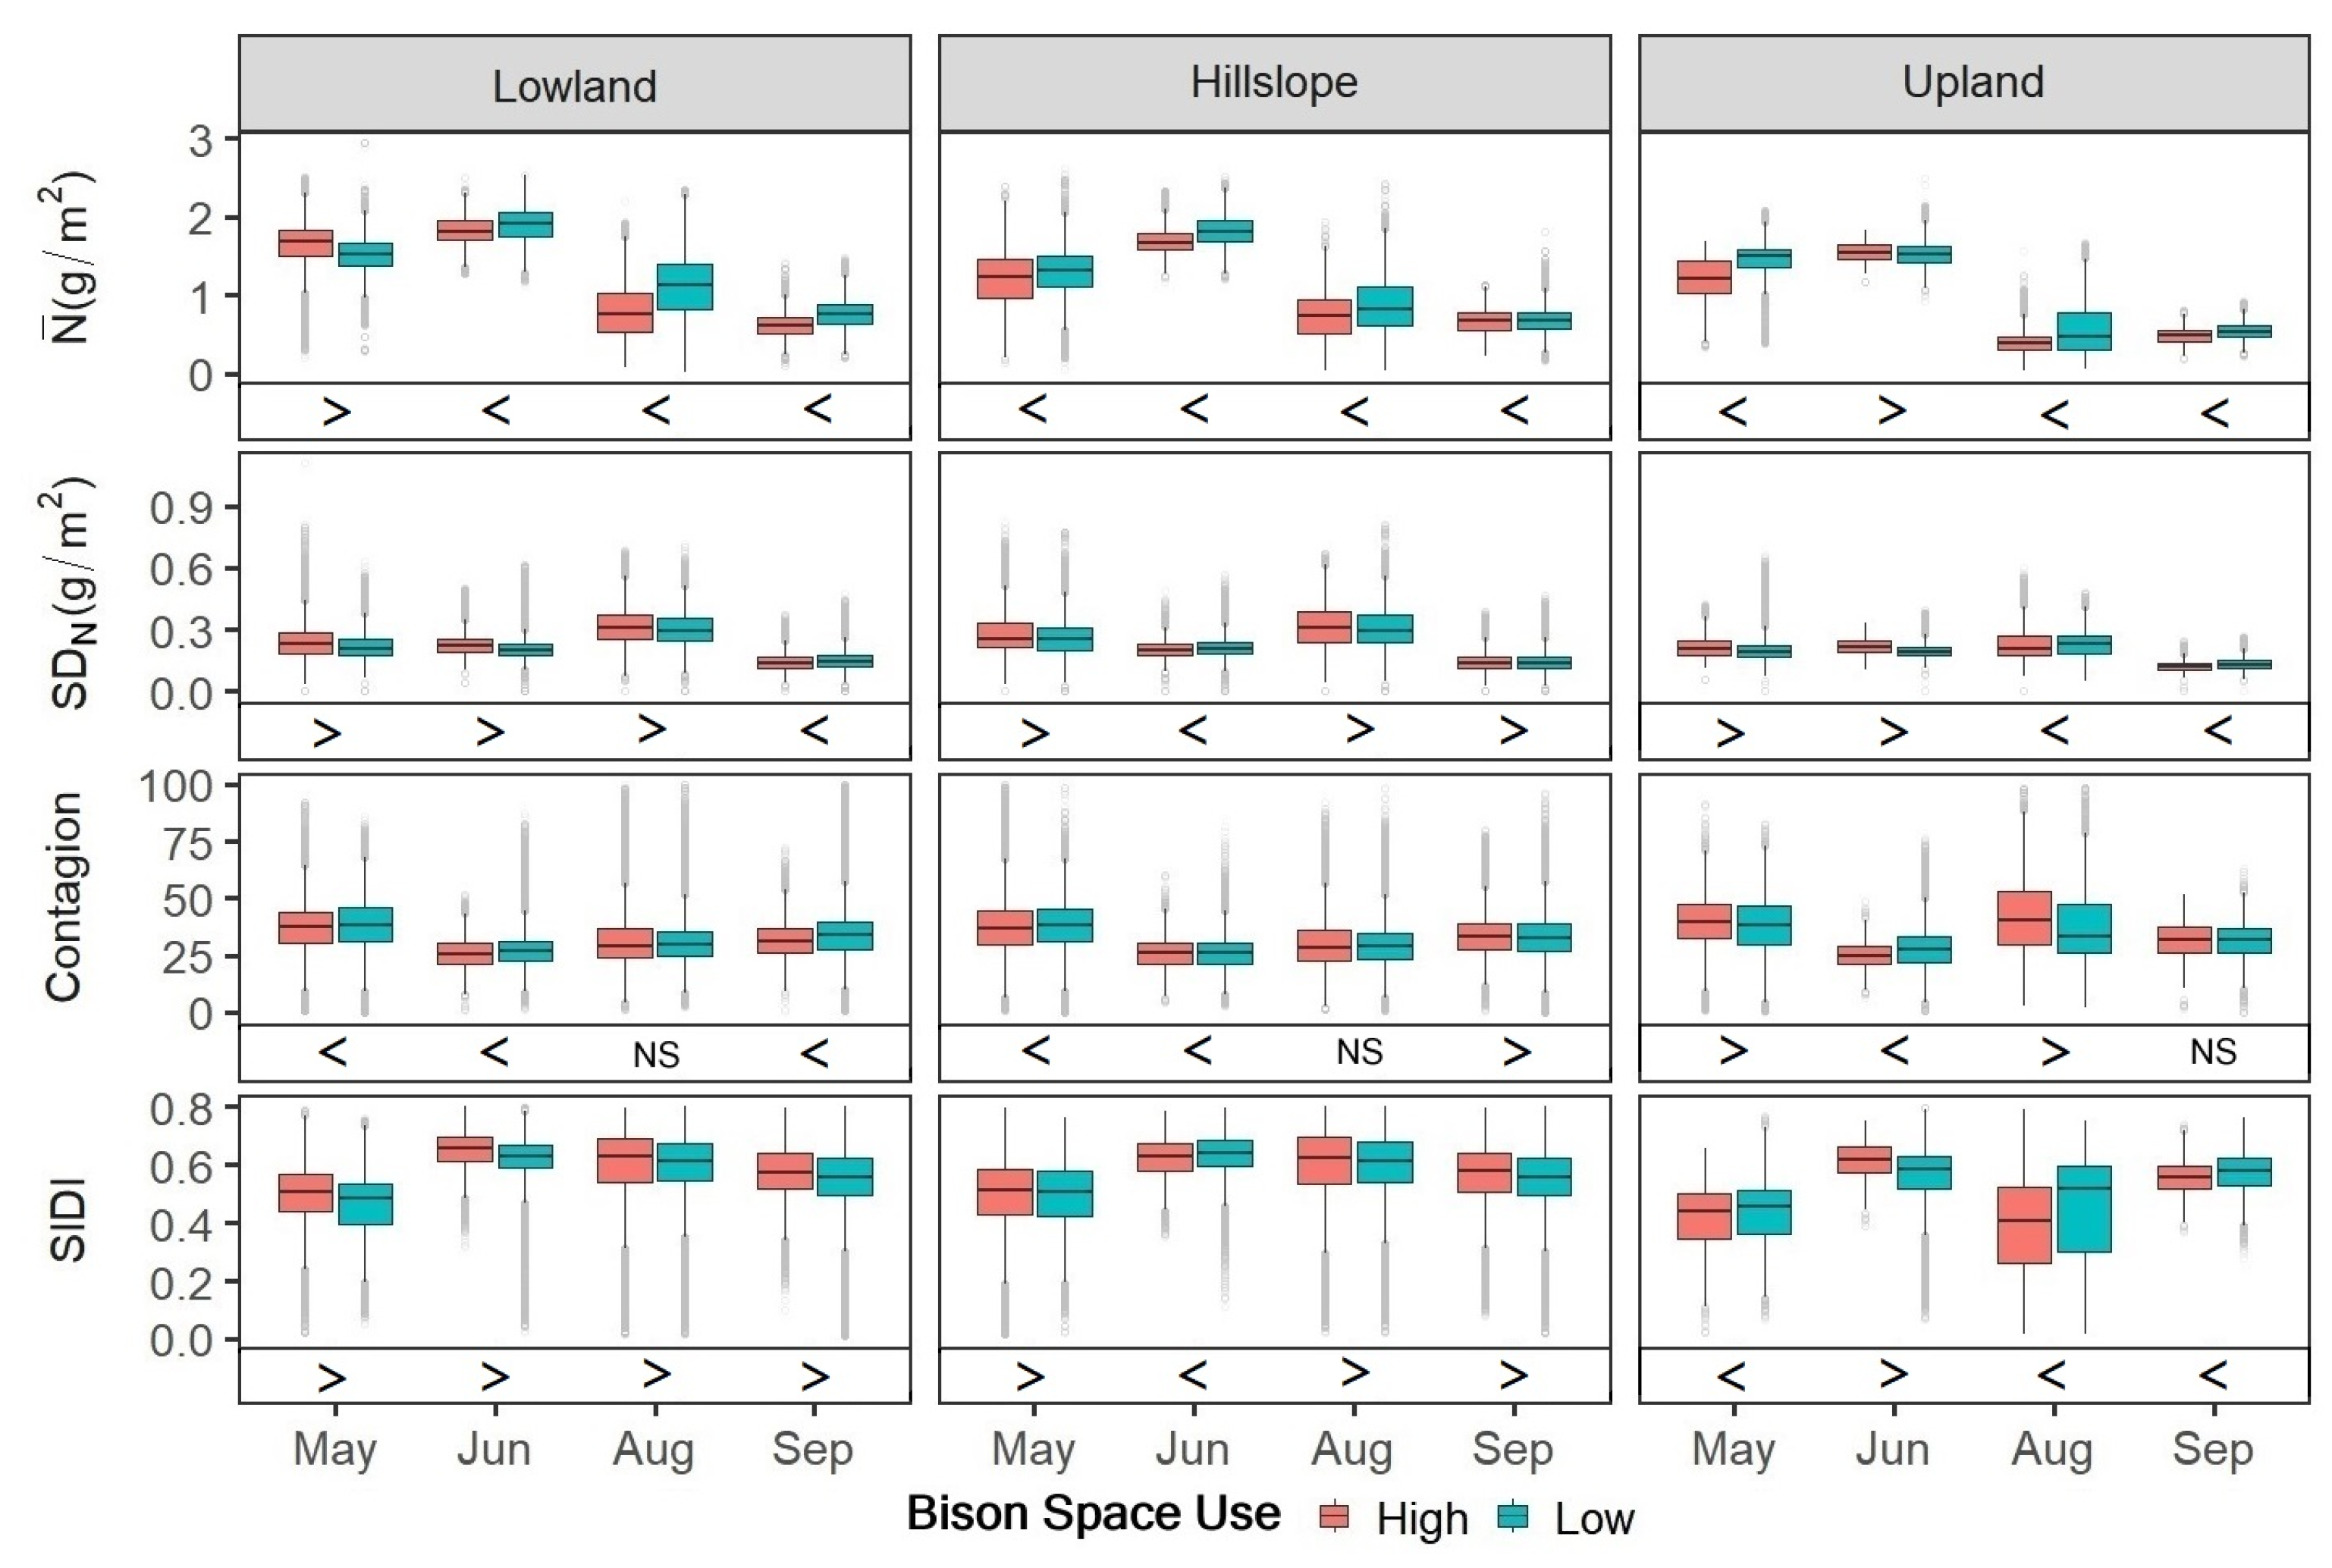
3.2. Quantification of Patch-Scale Vegetation Heterogeneity Related to Bison Space Use
3.3. Simulation of Bison and Vegetation Interactions
4. Discussion
5. Conclusions and Future Outlook
Author Contributions
Funding
Data Availability Statement
Acknowledgments
Conflicts of Interest
References
- Bamforth, D.B. Historical documents and bison ecology on the Great Plains. Plains Anthropol. 1987, 32, 1–16. [Google Scholar] [CrossRef]
- Collins, S.L.; Knapp, A.K.; Briggs, J.M.; Blair, J.M.; Steinauer, E.M. Modulation of diversity by grazing and mowing in native tallgrass prairie. Science 1998, 280, 745–747. [Google Scholar] [CrossRef] [PubMed]
- Knapp, A.K.; Blair, J.M.; Briggs, J.M.; Collins, S.L.; Hartnett, D.C.; Johnson, L.C.; Towne, E.G. The keystone role of bison in North American tallgrass prairie. Bioscience 1999, 49, 39–50. [Google Scholar] [CrossRef]
- Allred, B.W.; Fuhlendorf, S.D.; Hamilton, R.G. The role of herbivores in Great Plains conservation: Comparative ecology of bison and cattle. Ecosphere 2011, 2, art26. [Google Scholar] [CrossRef]
- Anderson, R.C. Evolution and origin of the Central Grassland of North America: Climate, fire, and mammalian grazers. J. Torrey Bot. Soc. 2006, 133, 626–647. [Google Scholar] [CrossRef]
- Augustine, D.J.; Frank, D.A. Effects of migratory grazers on spatial heterogeneity of soil nitrogen properties in a grassland ecosystem. Ecology 2001, 82, 3149–3162. [Google Scholar] [CrossRef]
- Frank, D.A.; Evans, R.D. Effects of native grazers on grassland N cycling in Yellowstone National Park. Ecology 1997, 78, 2238–2248. [Google Scholar] [CrossRef]
- Frank, D.A.; Groffman, P.M.; Evans, R.D.; Tracy, B.F. Ungulate stimulation of nitrogen cycling and retention in Yellowstone Park grasslands. Oecologia 2000, 123, 116–121. [Google Scholar] [CrossRef]
- Collins, S.L.; Calabrese, L.B. Effects of fire, grazing and topographic variation on vegetation structure in tallgrass prairie. J. Veg. Sci. 2012, 23, 563–575. [Google Scholar] [CrossRef]
- Raynor, E.J.; Beyer, H.L.; Briggs, J.M.; Joern, A. Complex variation in habitat selection strategies among individuals driven by extrinsic factors. Ecol. Evol. 2017, 7, 1802–1822. [Google Scholar] [CrossRef]
- Raynor, E.J.; Joern, A.; Nippert, J.B.; Briggs, J.M. Foraging decisions underlying restricted space use: Effects of fire and forage maturation on large herbivore nutrient uptake. Ecol. Evol. 2016, 6, 5843–5853. [Google Scholar] [CrossRef] [PubMed]
- Raynor, E.J.; Joern, A.; Briggs, J.M. Bison foraging responds to fire frequency in nutritionally heterogeneous grassland. Ecology 2015, 96, 1586–1597. [Google Scholar] [CrossRef]
- Allred, B.W.; Fuhlendorf, S.D.; Engle, D.M.; Elmore, R.D. Ungulate preference for burned patches reveals strength of fire-grazing interaction. Ecol. Evol. 2011, 1, 132–144. [Google Scholar] [CrossRef] [PubMed]
- Coppedge, B.R.; Shaw, J.H. Bison grazing patterns on seasonally burned tallgrass prairie. J. Range Manag. 1998, 51, 258–264. [Google Scholar] [CrossRef]
- Collins, S.L.; Smith, M.D. Scale-dependent interaction of fire and grazing on community heterogeneity in tallgrass prairie. Ecology 2006, 87, 2058–2067. [Google Scholar] [CrossRef] [PubMed]
- Tarleton, P.; Lamb, E.G. Modification of plant communities by bison in Riding Mountain National Park. Ecoscience 2021, 28, 67–80. [Google Scholar] [CrossRef]
- Ling, B.; Raynor, E.J.; Goodin, D.G.; Joern, A. Effects of fire and large herbivores on canopy nitrogen in a tallgrass prairie. Remote Sens. 2019, 11, 1364. [Google Scholar] [CrossRef]
- Towne, E.G.; Hartnett, D.C.; Cochran, R.C. Vegetation trends in tallgrass prairie from bison and cattle grazing. Ecol. Appl. 2005, 15, 1550–1559. [Google Scholar] [CrossRef]
- Bowles, M.L.; Jones, M.D. Repeated burning of eastern tallgrass prairie increases richness and diversity, stabilizing late successional vegetation. Ecol. Appl. 2013, 23, 464–478. [Google Scholar] [CrossRef]
- Nippert, J.B.; Ocheltree, T.W.; Skibbe, A.M.; Kangas, L.C.; Ham, J.M.; Shonkwiler Arnold, K.B.; Brunsell, N.A. Linking plant growth responses across topographic gradients in tallgrass prairie. Oecologia 2011, 166, 1131–1142. [Google Scholar] [CrossRef]
- Koerner, S.; Collins, S. Interactive effects of grazing, drought, and fire on grassland plant communities in North America and South Africa. Ecology 2014, 95, 98–109. [Google Scholar] [CrossRef] [PubMed]
- Fuhlendorf, S.D.; Engle, D.M.; Kerby, J.; Hamilton, R. Pyric herbivory: Rewilding landscapes through the recoupling of fire and grazing. Conserv. Biol. 2009, 23, 588–598. [Google Scholar] [CrossRef] [PubMed]
- Fuhlendorf, S.D.; Townsend, D.E.; Elmore, R.D.; Engle, D.M. Pyric-herbivory to promote rangeland heterogeneity: Evidence from small mammal communities. Rangel. Ecol. Manag. 2010, 63, 670–678. [Google Scholar] [CrossRef]
- Fuhlendorf, S.; Engle, D. Application of the fire–grazing interaction to restore a shifting mosaic on tallgrass prairie. J. Appl. Ecol. 2004, 41, 604–614. [Google Scholar] [CrossRef]
- Blair, J.M. Fire, N availability, and plant response in grasslands: A test of the transient maxima hypothesis. Ecology 1997, 78, 2359–2368. [Google Scholar] [CrossRef]
- Thapa, S.; de Jong, J.F.; Hof, A.; Subedi, N.; Joshi, L.; Prins, H. Fire and forage quality: Postfire regrowth quality and pyric herbivory in subtropical grasslands of Nepal. Ecol. Evol. 2022, 12, e8794. [Google Scholar] [CrossRef] [PubMed]
- Bailey, D.; Gross, J.; Laca, E.; Rittenhouse, L.; Coughenour, M.; Swift, D.; Sims, P. Mechanisms that result in large herbivore grazing distribution patterns. J. Range Manag. 1996, 49, 386–400. [Google Scholar] [CrossRef]
- Gregorini, P.; Tamminga, S.; Gunter, S.A. Behavior and daily grazing patterns of cattle. Prof. Anim. Sci. 2006, 22, 201–209. [Google Scholar] [CrossRef]
- Butts, D.J.; Thompson, N.E.; Christensen, S.A.; Williams, D.M.; Murillo, M.S. Data-driven agent-based model building for animal movement through Exploratory Data Analysis. Ecol. Model. 2022, 470, 110001. [Google Scholar] [CrossRef]
- Clemen, T.; Lenfers, U.A.; Dybulla, J.; Ferreira, S.M.; Kiker, G.A.; Martens, C.; Scheiter, S. A cross-scale modeling framework for decision support on elephant management in Kruger National Park, South Africa. Ecol. Inform. 2021, 62, 101266. [Google Scholar] [CrossRef]
- Smith, E.R.; Conrey, F.R. Agent-based modeling: A new approach for theory building in social psychology. Personal. Social. Psychol. Rev. 2007, 11, 87–104. [Google Scholar] [CrossRef]
- Wang, J.; Brown, D.G.; Riolo, R.L.; Page, S.E.; Agrawal, A. Exploratory analyses of local institutions for climate change adaptation in the Mongolian grasslands: An agent-based modeling approach. Glob. Environ. Change-Hum. Policy Dimens. 2013, 23, 1266–1276. [Google Scholar] [CrossRef]
- Hooten, M.B.; Hanks, E.M.; Johnson, D.S.; Alldredge, M.W. Reconciling resource utilization and resource selection functions. J. Anim. Ecol. 2013, 82, 1146–1154. [Google Scholar] [CrossRef] [PubMed]
- Bartlam-Brooks, H.L.A.; Bonyongo, M.C.; Harris, S. How landscape scale changes affect ecological processes in conservation areas: External factors influence land use by zebra (Equus burchelli) in the Okavango Delta. Ecol. Evol. 2013, 3, 2795–2805. [Google Scholar] [CrossRef] [PubMed]
- Kertson, B.N.; Spencer, R.D.; Marzluff, J.M.; Hepinstall-Cymerman, J.; Grue, C.E. Cougar space use and movements in the wildland-urban landscape of western Washington. Ecol. Appl. 2011, 21, 2866–2881. [Google Scholar] [CrossRef]
- Ling, B.; Goodin, D.G.; Mohler, R.L.; Laws, A.N.; Joern, A. Estimating canopy nitrogen content in a heterogeneous grassland with varying fire and grazing treatments: Konza Prairie, Kansas, USA. Remote Sens. 2014, 6, 4430–4453. [Google Scholar] [CrossRef]
- Konza Prairie Burn History. Available online: http://lter.konza.ksu.edu/konza-prairie-burn-history (accessed on 6 October 2023).
- GIS20 GIS Coverages Defining Konza Elevations. Available online: http://lter.konza.ksu.edu/gis-keywords/konza-prairie-biological-station?page=2 (accessed on 6 October 2023).
- Li, H.; Reynolds, J. A new contagion index to quantify spatial patterns of landscapes. Landsc. Ecol. 1993, 8, 155–162. [Google Scholar] [CrossRef]
- McGarigal, K.; Marks, B.J. FRAGSTATS: Spatial Pattern Analysis Program. for Quantifying Landscape Structure; US Department of Agriculture, Forest Service, Pacific Northwest Research Station: Portland, OR, USA, 1995; Volume 351.
- Fieberg, J.; Kochanny, C.O. Quantifying home-range overlap: The importance of the utilization distribution. J. Wildl. Manag. 2005, 69, 1346–1359. [Google Scholar] [CrossRef]
- Worton, B.J. Kernel methods for estimating the utilization distribution in home-range studies. Ecology 1989, 70, 164–168. [Google Scholar] [CrossRef]
- Benhamou, S. Dynamic approach to space and habitat use based on biased random bridges. PLoS ONE 2011, 6, e14592. [Google Scholar] [CrossRef]
- Long, R.A.; Muir, J.D.; Rachlow, J.L.; Kie, J.G. A comparison of two modeling approaches for evaluating wildlife-habitat relationships. J. Wildl. Manag. 2009, 73, 294–302. [Google Scholar] [CrossRef]
- Marzluff, J.M.; Millspaugh, J.J.; Hurvitz, P.; Handcock, M.S. Resource utilization by an avian nest predator: Relating resources to a probabilistic measure of animal space use. Ecology 2004, 85, 1411–1427. [Google Scholar] [CrossRef]
- Software to Implement Resource Utilization Function Estimation. Available online: http://www.stat.ucla.edu/~handcock/ruf/ (accessed on 6 October 2023).
- Marzluff, J.; Millspaugh, J.; Handcock, M. Relating resources to a probabilistic measure of space use: Forest fragments and Steller’s Jays. Ecology 2004, 85, 1411–1427. [Google Scholar] [CrossRef]
- Kasuya, E. Mann–Whitney U test when variances are unequal. Anim. Behav. 2001, 61, 1247–1249. [Google Scholar] [CrossRef]
- Wilensky, U. NetLogo; Center for Connected Learning and Computer-Based Modeling, Northwestern University: Evanston, IL, USA, 1999; Available online: http://ccl.northwestern.edu/netlogo/ (accessed on 6 October 2023).
- Belsky, A.J.; Carson, W.P.; Jensen, C.L.; Fox, G.A. Overcompensation by plants: Herbivore optimization or red herring? Evol. Ecol. 1993, 7, 109–121. [Google Scholar] [CrossRef]
- Hebblewhite, M.; Merrill, E.H.; McDermid, G.J. A multi-scale test of the forage maturation hypothesis in a partially migratory ungulate population. Ecol. Monogr. 2008, 78, 141–166. [Google Scholar] [CrossRef]


| Month | Natural Breaks of Canopy Nitrogen Values | |||
|---|---|---|---|---|
| L–ML | ML–M | M–MH | MH–H | |
| May | 0.83 | 1.36 | 1.82 | 2.27 |
| June | 1.46 | 1.74 | 2.00 | 2.27 |
| August | 0.50 | 0.90 | 1.28 | 1.71 |
| September | 0.32 | 0.50 | 0.69 | 0.92 |
| Metadata | Derived Data | Data Source |
|---|---|---|
| GPS locations | Bison space use | This research |
| Hyperspectral imagery | Continuous canopy nitrogen maps | Ling et al. [35] |
| Categorical canopy nitrogen maps | Ling et al. [17] | |
| Fire history records | Burning maps | This research |
| Digital elevation model | Slope | Ling et al. [17] |
| Topographic position divisions |
| Unstandardized RUF | Standardized RUF | |||||
|---|---|---|---|---|---|---|
| SE | ) | SE | ) | |||
| May | ||||||
| Intercept | −0.0258 | 0.3433 | 0.9413 | 0.3774 | 0.0206 | 0.0000 |
| Elevation | 0.0012 | 0.0008 | 0.1666 | 0.0161 | 0.0110 | 0.1667 |
| Slope | −0.0054 | 0.0018 | 0.0090 | −0.0238 | 0.0077 | 0.0089 |
| −0.0234 | 0.0258 | 0.3799 | −0.0092 | 0.0098 | 0.3645 | |
| −0.2042 | 0.0599 | 0.0047 | −0.0192 | 0.0054 | 0.0035 | |
| Contagion | 0.0004 | 0.0004 | 0.3565 | 0.0046 | 0.0045 | 0.3342 |
| SIDI | 0.1056 | 0.0712 | 0.1620 | 0.0139 | 0.0091 | 0.1509 |
| June | ||||||
| Intercept | −0.5474 | 0.2396 | 0.0398 | 0.2846 | 0.0275 | 0.0000 |
| Elevation | 0.0016 | 0.0006 | 0.0162 | 0.0235 | 0.0079 | 0.0110 |
| Slope | −0.0123 | 0.0010 | 0.0000 | −0.0558 | 0.0041 | 0.0000 |
| −0.0328 | 0.0175 | 0.0837 | −0.0065 | 0.0034 | 0.0763 | |
| −0.7865 | 0.1233 | 0.0000 | −0.0377 | 0.0060 | 0.0000 | |
| Contagion | 0.0022 | 0.0004 | 0.0001 | 0.0142 | 0.0025 | 0.0001 |
| SIDI | 0.7143 | 0.0828 | 0.0000 | 0.0462 | 0.0057 | 0.0000 |
| August | ||||||
| Intercept | −0.2536 | 0.1980 | 0.2226 | 0.2736 | 0.0189 | 0.0000 |
| Elevation | 0.0013 | 0.0005 | 0.0296 | 0.0216 | 0.0088 | 0.0287 |
| Slope | −0.0061 | 0.0019 | 0.0060 | −0.0287 | 0.0087 | 0.0057 |
| −0.0437 | 0.0183 | 0.0328 | −0.0152 | 0.0063 | 0.0319 | |
| −0.3401 | 0.0956 | 0.0035 | −0.0326 | 0.0091 | 0.0034 | |
| Contagion | 0.0012 | 0.0004 | 0.0065 | 0.0139 | 0.0043 | 0.0066 |
| SIDI | 0.2479 | 0.0839 | 0.0112 | 0.0364 | 0.0124 | 0.0116 |
| September | ||||||
| Intercept | 0.1492 | 0.1679 | 0.3919 | 0.2366 | 0.0172 | 0.0000 |
| Elevation | 0.0000 | 0.0004 | 0.9940 | −0.0004 | 0.0062 | 0.9527 |
| Slope | −0.0109 | 0.0019 | 0.0001 | −0.0515 | 0.0088 | 0.0001 |
| 0.0165 | 0.0473 | 0.7337 | 0.0024 | 0.0077 | 0.7564 | |
| −0.8085 | 0.2462 | 0.0065 | −0.0360 | 0.0108 | 0.0059 | |
| Contagion | 0.0014 | 0.0003 | 0.0006 | 0.0116 | 0.0025 | 0.0006 |
| SIDI | 0.3986 | 0.0992 | 0.0017 | 0.0349 | 0.0088 | 0.0018 |
| Unstandardized RUF | Standardized RUF | |||||
|---|---|---|---|---|---|---|
| SE | ) | SE | ) | |||
| May | ||||||
| Intercept | 0.3118 | 0.0757 | 0.0012 | 0.3795 | 0.0190 | 0.0000 |
| 0.0370 | 0.0311 | 0.2556 | 0.0093 | 0.0087 | 0.3037 | |
| −0.2517 | 0.0698 | 0.0032 | −0.0229 | 0.0066 | 0.0041 | |
| Contagion | 0.0008 | 0.0006 | 0.2061 | 0.0080 | 0.0063 | 0.2273 |
| SIDI | 0.0884 | 0.1045 | 0.4128 | 0.0090 | 0.0117 | 0.4578 |
| June | ||||||
| Intercept | 0.1144 | 0.0803 | 0.1780 | 0.3196 | 0.0249 | 0.0000 |
| −0.1087 | 0.0273 | 0.0016 | −0.0218 | 0.0054 | 0.0014 | |
| −0.8781 | 0.1587 | 0.0001 | −0.0424 | 0.0078 | 0.0001 | |
| Contagion | 0.0022 | 0.0006 | 0.0037 | 0.0144 | 0.0041 | 0.0038 |
| SIDI | 0.8274 | 0.1217 | 0.0000 | 0.0533 | 0.0080 | 0.0000 |
| August | ||||||
| Intercept | 0.2808 | 0.0398 | 0.0000 | 0.2940 | 0.0199 | 0.0000 |
| −0.0612 | 0.0186 | 0.0059 | −0.0213 | 0.0066 | 0.0068 | |
| −0.5124 | 0.1035 | 0.0003 | −0.0467 | 0.0094 | 0.0003 | |
| Contagion | 0.0013 | 0.0004 | 0.0057 | 0.0152 | 0.0047 | 0.0068 |
| SIDI | 0.2958 | 0.0685 | 0.0008 | 0.0466 | 0.0111 | 0.0010 |
| September | ||||||
| Intercept | 0.1014 | 0.0756 | 0.2043 | 0.2723 | 0.0193 | 0.0000 |
| −0.0301 | 0.0619 | 0.6358 | −0.0055 | 0.0106 | 0.6132 | |
| −0.9790 | 0.3188 | 0.0097 | −0.0414 | 0.0133 | 0.0089 | |
| Contagion | 0.0013 | 0.0004 | 0.0031 | 0.0103 | 0.0027 | 0.0026 |
| SIDI | 0.4903 | 0.1214 | 0.0016 | 0.0387 | 0.0094 | 0.0014 |
Disclaimer/Publisher’s Note: The statements, opinions and data contained in all publications are solely those of the individual author(s) and contributor(s) and not of MDPI and/or the editor(s). MDPI and/or the editor(s) disclaim responsibility for any injury to people or property resulting from any ideas, methods, instructions or products referred to in the content. |
© 2023 by the authors. Licensee MDPI, Basel, Switzerland. This article is an open access article distributed under the terms and conditions of the Creative Commons Attribution (CC BY) license (https://creativecommons.org/licenses/by/4.0/).
Share and Cite
Ling, B.; Raynor, E.J.; Joern, A.; Goodin, D.G. Dynamic Plant–Herbivore Interactions between Bison Space Use and Vegetation Heterogeneity in a Tallgrass Prairie. Remote Sens. 2023, 15, 5269. https://doi.org/10.3390/rs15225269
Ling B, Raynor EJ, Joern A, Goodin DG. Dynamic Plant–Herbivore Interactions between Bison Space Use and Vegetation Heterogeneity in a Tallgrass Prairie. Remote Sensing. 2023; 15(22):5269. https://doi.org/10.3390/rs15225269
Chicago/Turabian StyleLing, Bohua, Edward J. Raynor, Anthony Joern, and Douglas G. Goodin. 2023. "Dynamic Plant–Herbivore Interactions between Bison Space Use and Vegetation Heterogeneity in a Tallgrass Prairie" Remote Sensing 15, no. 22: 5269. https://doi.org/10.3390/rs15225269
APA StyleLing, B., Raynor, E. J., Joern, A., & Goodin, D. G. (2023). Dynamic Plant–Herbivore Interactions between Bison Space Use and Vegetation Heterogeneity in a Tallgrass Prairie. Remote Sensing, 15(22), 5269. https://doi.org/10.3390/rs15225269