Article

A New Strategy for Extracting 3D Deformation of Mining Areas from a Single-Geometry Synthetic Aperture Radar Dataset

1
College of Mining and Technology, Ural State Mining University, Ekaterinburg 620000, Russia
2
Chinese-Russian Institute, Ural Federal University, Ekaterinburg 620000, Russia
3
College of Civil Engineering, Saint Petersburg State University of Architecture and Civil Engineering, St. Petersburg 190005, Russia
4
School of Environment Science and Spatial Informatics, China University of Mining and Technology (CUMT), Xuzhou 221116, China
*
Author to whom correspondence should be addressed.
Remote Sens. 2023, 15(21), 5244; https://doi.org/10.3390/rs15215244
Submission received: 18 September 2023 / Revised: 31 October 2023 / Accepted: 3 November 2023 / Published: 4 November 2023

Abstract

:
This paper presents a strategy for extracting three-dimensional (3D) mining deformation from a single-geometry synthetic aperture radar (SAR) dataset. In light of the directionality of horizontal displacement caused by underground mining, we first re-model the proportional relationship between horizontal displacement and horizontal gradient of subsidence. Afterward, to improve the stability of the re-model, a solution strategy is proposed by setting different solution starting points and directions. The proposed method allows hiring of arbitrary single-geometry SAR data (e.g., air-borne, space-borne, and ground-borne SAR data) to reconstruct 3D displacements of mining areas. The proposed method has been validated through simulation and in-site data. The simulation data monitoring results indicate that the root mean square errors (RMSE) of the 3D displacements extracted by the proposed strategy are 0.45, 0.5, and 2.98 mm for the vertical subsidence, east–west, and north–south horizontal displacements, respectively. The in-site data monitoring results indicate that the RMSE of vertical subsidence compared with the leveling data are 7.3 mm. Furthermore, the MSBAS method was employed to further validate the reliability of the proposed method, the results show that the proposed method is effective to obtain the 3D deformation of the mining area, which greatly improves the applicability of SAR interferometry in the 3D deformation monitoring of the mining areas.

1. Introduction

Ground displacements that include subsidence and horizontal displacements are a complex spatio-temporal process caused by underground mining [1]. They can directly or indirectly lead to a series of geohazards, such as landslides, mining tremors, coal fires, and so forth [2,3]. Serious ground displacements can structurally damage buildings, highways, railways, underground lifeline pipelines, and surrounding residential areas, with ineluctable harmful consequences, and will bring huge economic losses and threaten the safety of people’s lives. Consequently, the three-dimensional (3D) displacements observations of underground mining play an indispensable role in ground displacements modeling and prediction, mechanism interpretation, and geohazard assessment [4,5].
The methods most frequently used to measure ground displacements in mining areas include: precise leveling, GNSS, and total station surveys [1,4,5,6]. In general, the observation stations are first arranged along the strike and tendency of the working surface, and the distance between the observation stations increases with the increase in the mining depth. Then, repeated monitoring is carried out, with low monitoring frequency in the early and late stages of mining, and high monitoring frequency in the middle stage of mining [1]. Although these traditional monitoring methods can achieve a high level of accuracy, their shortcomings are also obvious, such as being time-consuming, labor-intensive, and costly. Last but not least, their small coverage area and coarse spatial resolution cause the loss of key information and cannot fully reflect the characteristics of ground displacements [6,7].
Interferometric synthetic aperture radar (InSAR) technology has the capability to survey ground deformation in a broad area with high spatial resolution, high efficiency, and low cost through different SAR data sources (such as Sentinel-1A/B, TerraSAR-X, RadarSAT-2, etc.), which cannot be achieved by traditional geological survey techniques. And it has been successfully applied to mine ground deformation monitoring [8,9], deformation parameter inversion and prediction [10,11,12], building damage assessment [13,14], mining tremor and coal fire monitoring [2,15,16,17]. However, restricted by the side-looking imaging mode of SAR sensors, InSAR can only obtain the deformation along the line of sight (LOS) of the sensor; moreover, the mining ground deformation usually involves sinking and horizontal movement. Therefore, relying solely on LOS deformation cannot effectively reflect the surface 3D deformation patterns, which limits the application of InSAR in mine surveys [18,19].
In recent years, significant efforts have been made to reconstruct 3D mining displacements from InSAR/SAR-derived 1D/2D displacement. These can be classified into two groups according to the different data sources and technology used: (1) the multi-source InSAR/SAR technology, and (2) the combination of InSAR/SAR measurements and an external model/data. Reconstructing 3D displacements through a single LOS displacement is an ill-conditioned equation problem. Therefore, multi-source InSAR/SAR method makes the ill-conditioned equation regularization by adding redundant observations (e.g., combination of ascending and descending SAR data, DInSAR combined with multiple-aperture interferometry, or pixel offset tracking). Ng et al. [20] and Zhu et al. [21] combined the ascending and descending SAR data to obtained the 3D displacements of Appin mine and Xuzhou mine, respectively, based on the least square method. Huang et al. [22] obtained the 3D displacements of large deformation gradient in Yulin mine based on multi-source SAR data using the pixel offset tracking technology. However, the multi-source InSAR/SAR method theoretically requires synchronous SAR data from at least three independent imaging geometries to ensure the accuracy of the 3D displacement estimations, which is difficult to guarantee in most practical scenarios [6,11]. And the near-polar orbit configuration causes significantly poor accuracy for north–south horizontal displacement estimates [19,20,21]. Compared with the former method, InSAR/SAR measurements combined with external models/data can effectively reduce the requirements for SAR data, such as InSAR/SAR measurements combined with probability integral method [23,24,25] or the priori information to obtain 3D mining displacements [26,27,28]. The method proposed by Li et al. [28] is the most representative, which obtains 3D deformation from a single InSAR pair (SIP). This method using the proportional relationship between the gradient of the mining-induced vertical subsidence and the horizontal displacements, significantly liberate InSAR-based 3D mining displacements estimate from data limitations. Furthermore, the assistance of law of mining subsidence the accuracy along the northern direction is significantly improved. In 2019, Fan et al. [29] improved the SIP method (hereafter collectively referred to as the SIP-based method) according to the ground displacement characteristics of inclined coal seam. However, the SIP-based method still has some limitations. For example, it ignores the influence of the directionality of horizontal displacement on the initial model construction. Moreover, the SIP-based method has different stability for SAR data with different heading angles.
In this paper, we propose a strategy for extracting the 3D displacements of mining areas from a single-geometry SAR dataset. We first re-model the proportional relationship between horizontal displacement and horizontal gradient of vertical subsidence, according to the directionality of horizontal displacement caused by underground mining. Then, a solution strategy is proposed to make the re-model SIP-based method (hereafter referred to as the RSIP-based method) effective for arbitrary heading angle SAR data. The remainder of this paper is organized as follows. Section 2 briefly reviews and discusses the limitations of the SIP-based method, then illustrates the solution strategy of the RSIP-based method in detail. The experiment undertaken with simulation data and real data from the Fengfeng mining area, China, is presented to evaluate the proposed strategy in Section 3, followed by the discussion in Section 4, Finally, our conclusions are drawn in Section 5.

2. Experimental Principle

2.1. Brief Review of the SIP-Based Method

Assume that the size of the geocoded LOS deformation map is m × n. According to the proportional relationship between the horizontal displacement and tilt deformation caused by underground mining [1,28,29], the horizontal displacements of the ground point (i, j) along the east–west (U E (i, j)) and north–south (U N (i, j)) directions can be modeled as (see [28] for more details):
U E ( i , j ) = b · r · T E ( i , j ) = b · r · [ W ( i , j + 1 ) W ( i , j ) ] / Δ E U N ( i , j ) = b · r · T N ( i , j ) = b · r · [ W ( i + 1 , j ) W ( i , j ) ] / Δ N ( i = 1 , 2 , , m 1 ; j = 1 , 2 , , n 1 )
where m represents the number of rows in the north–south direction, and n represents the number of columns in the east–west direction; T E (i, j) and T N (i, j) are the tilt deformation in the east–west and north–south directions, respectively, which can be calculated by the vertical subsidence W(i, j); Δ E and Δ N are the east–west and north–south pixel sizes of the LOS deformation map, respectively; b is the horizontal displacement coefficient; r = H/tan β is the main influence radius; H is the mining depth; and β is the main influence angle. In general, the value ranges of b and tan β are 0.1–0.4 and 1.2–2.6, respectively, in China [1].
According to the geometric of SAR imaging, the LOS deformation ( D L O S (i, j)) of point (i, j) can be expressed as [5,6]:
D L O S ( i , j ) = W ( i , j ) · cos θ U E ( i , j ) · sin θ · cos α + U N ( i , j ) · sin θ · sin α
where θ and α are the incident angle and heading angle of the SAR sensor, respectively; the other symbols are the same as above.
Substituting (1) into (2), we can obtain:
D L O S ( i , j ) = C 1 · W ( i , j ) + C 2 · W ( i , j + 1 ) + C 3 · W ( i + 1 , j )
Let a1 = cos θ , a2 = sin θ ·cos α , a3 = sin θ ·sin α , then
C 1 = a 1 + b · r · a 2 / Δ E b · r · a 3 / Δ N C 2 = b · r · a 2 / Δ E C 3 = b · r · a 3 / Δ N
In (3), the number of observation equations (m − 1)·(n− 1) is less than the number of unknowns (m·n). Thus, the system is under-determined. Considering the main influence range (i.e., r) of the underground mining, the ground displacements farther away from the underground mining are smaller, so we can safely assume that the horizontal displacements of last row and column of the LOS deformation map are zeros [28]:
LOS ( i , n ) = a 1 · W ( i , n ) ( i = 1 , 2 , , m 1 ) LOS ( m , j ) = a 1 · W ( m , j ) ( j = 1 , 2 , , n )
Finally, the subsidence can be obtained by the back-substitution method based on (3) and (5). Then, the horizontal displacements in the east–west and north–south directions can be estimated by (1) [28].
Fan et al. [29] considered the influence of coal seam inclination, a correction term was added to the constructed east–west horizontal displacement model (U E F ) (assuming that the coal seam tendency is consistent with the east–west direction) according to the probability integration method:
U E F ( i , j ) = b · r · [ W ( i , j + 1 ) W ( i , j ) ] / Δ E + W ( i , j ) · cot θ 0 U N ( i , j ) = b · r · [ W ( i + 1 , j ) W ( i , j ) ] / Δ N ( i = 1 , 2 , , m 1 ; j = 1 , 2 , , n 1 )
where θ 0 = 90 − 0.5· α 0 is the mining influence propagation angle, and α 0 is the dip angle of coal seam.
Substituting (6) into (2), the same expression form as (3) can still be obtained. The only difference is the coefficient C1; there will be an additional constant term in C1 F :
C 1 F = a 1 + b · r · a 2 / Δ E b · r · a 3 / Δ N a 2 · cot θ 0
The model solution method is as described above; see [28,29] for more details about the SIP-based method.

2.2. Limitations of the SIP-Based Method

2.2.1. Directionality of Horizontal Displacement

In general, the displacement vector of each point on the surface displacement basin caused by underground mining is pointing towards the center of the basin. However, surface displacements only refer to the absolute value of subsidence and horizontal displacements, without indicating their directionality. Normally, it is stipulated that horizontal displacements pointing to east and north are positive and subsidence is negative. Take the east–west horizontal displacement as an example (the solid green line (Ue) in Figure 1): on the west side of the displacement basin (the left of the red dashed line in Figure 1), the direction of horizontal displacement points east, so the sign is positive, and the other side is the opposite.
When ignoring the directionality of horizontal displacement, the east–west horizontal displacement constructed by (1) and (6) (the column direction of the geocoded LOS deformation map corresponds to the east–west direction) is opposite to the actual one, as shown by the green dotted line (Ue-SIP-based) in Figure 1. The direction of the north–south horizontal displacement is consistent with the actual situation. Therefore, we reconstruct the model of proportional relationship between horizontal displacement and the gradient of the subsidence according to the directionality of horizontal displacement (here, we ignore the influence of coal seam inclination, which will be explained below) as:
U E R S I P ( i , j ) = b · r · [ W ( i , j ) W ( i , j + 1 ) ] / Δ E U N ( i , j ) = b · r · [ W ( i + 1 , j ) W ( i , j ) ] / Δ N ( i = 1 , 2 , , m 1 ; j = 1 , 2 , , n 1 )
Comparing (1) and (8), we can see that there is only a “−” difference in the east–west horizontal movement. Although this difference can be eliminated by manually multiplying −1 in the estimated east–west deformation, it is known from the SIP-based method that (1) or (6) is the basis of the method. Therefore, when the constructed model (1) or (6) is inconsistent with the actual situation, it will affect the solution of the subsidence, and the horizontal deformation is estimated by subsidence, its accuracy depends entirely on the subsidence. The conformity of the constructed model with the actual is very important for solving the 3D deformation.
Substituting (8) into (2), we can still obtain the same expression as (3), but the coefficients C1 and C2 in (3) will be changed, while C3 remains unchanged:
C 1 R S I P = a 1 b · r · a 2 / Δ E b · r · a 3 / Δ N C 2 R S I P = b · r · a 2 / Δ E C 3 R S I P = b · r · a 3 / Δ N
Equations (3), (8) and (9) are the fundamental model of the re-model SIP (RSIP)-based method. By substituting (9) and (4) into (3), respectively, the subsidence of the RSIP-based method (W R S I P (i, j)) and SIP-based method (W S I P (i, j)) will be obtained, and then subtract each other (see Appendix A for the derivation process of (10)):
Δ W = W R S I P ( i , j ) W S I P ( i , j ) = 2 · a 2 · U E R S I P ( i , j ) a 1 C 3 R S I P + C 2 R S I P
It can be seen from (10) that when the directionality of horizontal deformation is neglected, the subsidence obtained by the SIP-based method is deviated from the actual one. In the actual situation, the coefficients in (10) are constants, so the magnitude of the deviation Δ W is determined by the actual east–west horizontal deformation, and the sign of the deviation Δ W should be analyzed in combination of SAR imaging geometry and the direction of horizontal deformation. Assuming that the sign of the deviation Δ W is the same as the east–west horizontal deformation (see Figure 1), the subsidence obtained by the SIP-based method will be larger than the actual one on the west side of the surface displacement basin, and the other side will be the opposite (as shown by the W and W-SIP-based lines in Figure 1). The overestimation or underestimation of the subsidence obtained by the SIP-based method will cause the illusion of a “shift” of the subsidence basin (as shown by W-SIP-based in Figure 1), and the horizontal deformation calculated by the subsidence will also be “shifted”.

2.2.2. Inclination of Coal Seam

According to the definition of tilt in mining subsidence, tilt refers to the ratio of the relative movement of adjacent points in the vertical direction to the horizontal distance between two points, which reflects the slope of the surface displacement basin in a certain direction [1]:
T 2 3 = W 3 W 2 L 2 3
where W 2 and W 3 are the subsidence of points 2 and 3, respectively; L 2 3 is the horizontal distance between the two points; and T 2 3 is the tilt along the connection direction of points 2 and 3.
Fan et al. [29] consider the dip angle of coal seam, and assume that the inclination direction of the coal seam is consistent with the east–west direction. According to the horizontal deformation along the inclination direction U(y), the east–west horizontal displacement U E F (i, j) is derived by:
U ( y ) = b · r · [ W ( y + Δ y ) W ( y ) ] / Δ y + W ( y ) · cot θ 0 U E F ( i , j ) = b · r · [ W ( i , j + 1 ) W ( i , j ) ] / Δ E + W ( i , j ) · cot θ 0
where W(y) and Δ y are subsidence and horizontal distance along the inclination direction of coal seam, respectively.
By comparing the expressions of U(y) and U E F (i, j) in (12), we can find that the two equations are not strictly equal. Because the dimensions of the two equations are different, U(y) only considers the deformation along the inclination direction of coal seam, which is one-dimensional, while U E F (i, j) is affected by both the inclination and strike directions of coal seam, and is two-dimensional.
In practice, it is impossible to obtain the deformation W(y) that only contains the inclination direction, but the two-dimensional deformation W(i, j) can be obtained by InSAR or other method. According to the probability integration method [1,30] the W(i, j) = W(x, y) can be expressed as:
W ( x , y ) = W 0 D 1 r 2 e π ( η x ) 2 + ( ξ y ) 2 r 2 d η d ξ
where W 0 = m·q·cos α 0 is the maximum subsidence value under full mining conditions, m is the mining thickness, q is the subsidence coefficient, and α 0 is the dip angle of coal seam. r is the main influence radius, D is the underground mining volume, and η and ξ are integral variables.
Calculating the first derivative of (13), the tilt can be obtained as:
T ( x , y , φ ) = W 0 D 2 π r 4 [ ( η x ) cos φ + ( ξ y ) sin φ ] · e π ( η x ) 2 + ( ζ y ) 2 r 2 d η d ξ
where T(x, y, φ ) is the tilt of the point (x, y) along the direction of φ . According to the probability integration method, the horizontal deformation U(x, y, φ ) of point (x, y) along the direction of φ can be obtained (see [1,30] for the detailed derivation process):
U ( x , y , φ ) = W 0 D 2 π b r 3 [ ( η x ) cos φ + ( ξ y ) sin φ ] · e π ( η x ) 2 + ( ξ y ) 2 r 2 d η d ξ
where b is the horizontal displacement coefficient. Combining (14) and (15), we can obtain:
U ( x , y , φ ) = b · r · T ( x , y , φ )
Although (13)–(15) are derived based on the probability integration method, the derivation process does not involve the state of underground working face (e.g., inclined/steeply inclined coal seam, the number of working faces, etc.). It is purely considering the geometric relationship of deformation, so this relationship (16) is applicable in continuous deformation [30].
Therefore, by combining (16) and (11), we can calculate the horizontal deformation of the point (x, y) along the direction of φ , when using (1) and (8) to estimate the horizontal displacements of east–west and north–south directions without considering the influence of coal seam inclination.

2.2.3. The Stability of the RSIP/SIP-Based Method

The results of the RSIP/SIP-based method will diverge under certain conditions. Therefore, we did not distinguish between the coefficients C and C R S I P in the analysis, uniformly expressed by C.
According to (3), the subsidence W(i, j) of point (i, j) is:
W ( i , j ) = D L O S ( i , j ) C 2 · W ( i , j + 1 ) C 3 · W ( i + 1 , j ) C 1
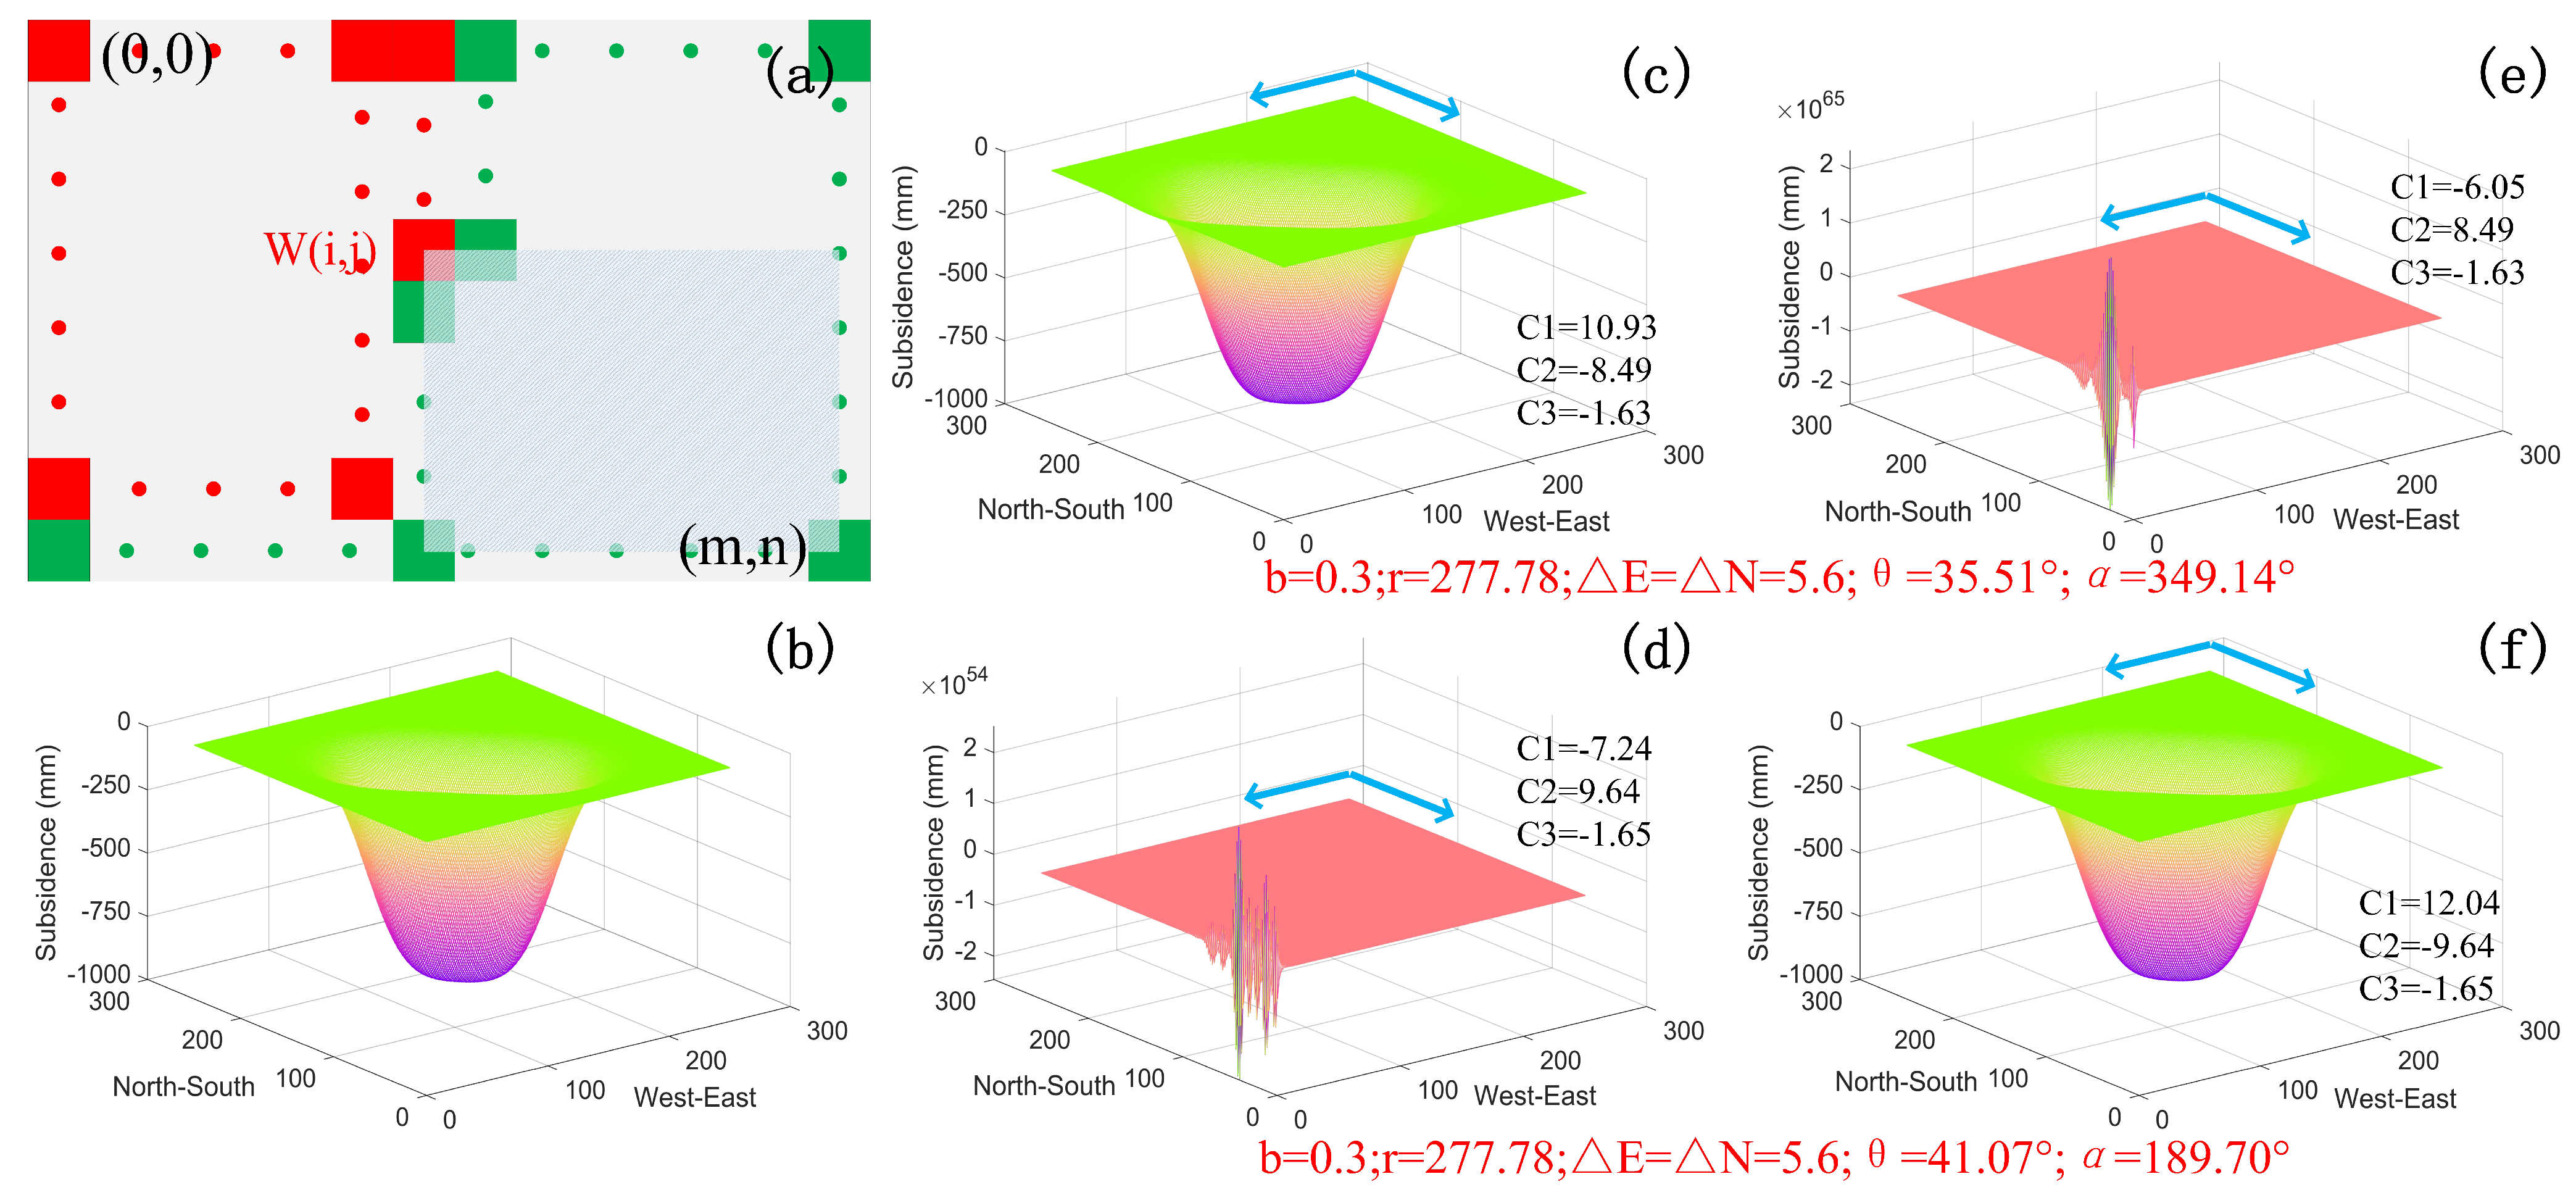
Theoretically, the accuracy of the W(i,j) of point (i,j) only depends on its LOS deformation D L O S (i,j) and the subsidence of two adjacent points (i,j+1) and (i+1,j). However, due to the fact that there are no redundant restrictions, the subsidence cannot be obtained at the same time. Instead, it is solved by back-substitution method [28,29]. Therefore, the accuracy of the W(i,j) is related to the LOS deformation of the traversed pixels and the deformation of the last row and column, as shown in the light blue shaded of Figure 2a.
Expanding (17), express W(i, j) with LOS deformation of the traversed pixels and the deformation of the last row and column, we can get the general terms of the coefficients of higher order terms (the general terms obtained by mathematical induction; see Appendix B for the specific form of (18)):
A L O S = ( 1 ) m i + n j 2 · ( ( m 1 i ) · ( n 1 j ) + 1 ) · C 2 n 1 j · C 3 m 1 i C 1 m + n i j 1 A n = ( 1 ) m i + n j 1 · ( m i ) · ( n j ) · C 3 m 1 i C 2 n j C 1 m + n i j 1 A m = ( 1 ) m i + n j 1 · ( m i ) · ( n j ) · C 3 m i C 2 n 1 j C 1 m + n i j 1
It can be seen from (32) (Appendix B) that the coefficients (18) of higher order terms plays a decisive role in the stability of the the RSIP/SIP-based method. When there is a small disturbance in the high-order terms D L O S (m− 1, n− 1), W(m− 1, n) or W(m, n− 1), which will be enlarged or reduced by coefficients A L O S , A n , and A m . Therefore, in order to obtain a stable solution, the coefficients must meet certain conditions. By analyzing the coefficients A L O S , A n , and A m (ignoring the constant term here), the coefficients can be expressed as:
A L O S = 1 C 1 C 2 n j 1 C 1 n j 1 · C 3 m i 1 C 1 m i 1 A n = C 2 n j C 1 n j · C 3 m 1 i C 1 m 1 i A m = C 2 n j 1 C 1 n j 1 · C 3 m i C 1 m i C 2 C 1 p · C 3 C 1 q
where the values of indexes p and q are related to the size of the LOS deformation map and the position of the pending pixel.
According to the limit theory lim n a n , a ∈ R. When |a| < 1, lim n a n = 0; |a| > 1, lim n a n = ∞. Therefore, in order to improve the stability and robustness of (17), it is necessary to make the coefficients |C2/C1| and |C3/C1| less than 1. Taking into account the influence of the constant term, in order to make (17) strictly converge, we use |C2/C1| + |C3/C1| < 1 as the condition for judging the stability of the RSIP/SIP-based method, that is,
C 2 C 1 + C 3 C 1 < 1 C 2 C 1 < 1 & & C 3 C 1 < 1
According to (20), we found that the SIP-based method is only valid for the ascending SAR data, while the RSIP-based method is only valid for the descending SAR data (see Section 4 for a detailed analysis). The results of RSIP/SIP-based methods for solving simulated LOS deformation in ascending and descending mode are shown in Figure 2. With the SIP-based method under descending conditions and the RSIP-based method under ascending conditions, the result is divergent because |C2/C1| + |C3/C1| > 1 (Figure 2d,e). Since the RSIP/SIP-based method is solved by back-substitution, the closer to the first row and column, the higher the degree of divergence.

2.3. Solution Strategy of the RSIP-Based Method

Since the RSIP-based method has strict restrictions on the coefficients (|C2/C1| + |C3/C1| < 1), it greatly limits the practical application of the RSIP-based method (only valid for descending SAR data). In order to make the RSIP-based method applicable to SAR data with arbitrary heading angle (e.g., ground-borne, air-borne, space-borne SAR data), we found through experiments that changing the starting point and direction of the solution can ingeniously avoid |C2/C1| + |C3/C1| > 1 caused by changes in heading angle, thereby improving the stability of the solution and suppressing the propagation of errors.
For mining subsidence, as long as the starting point of the solution is far enough away from the subsidence basin (judging by the mining depth of the working face), it is safe to assume that the horizontal deformation is zero, because the range of the subsidence basin is limited, usually 1 km 2 [6,28]. Therefore, it is feasible to choose any corner point of the LOS deformation map as the starting point for the solution.
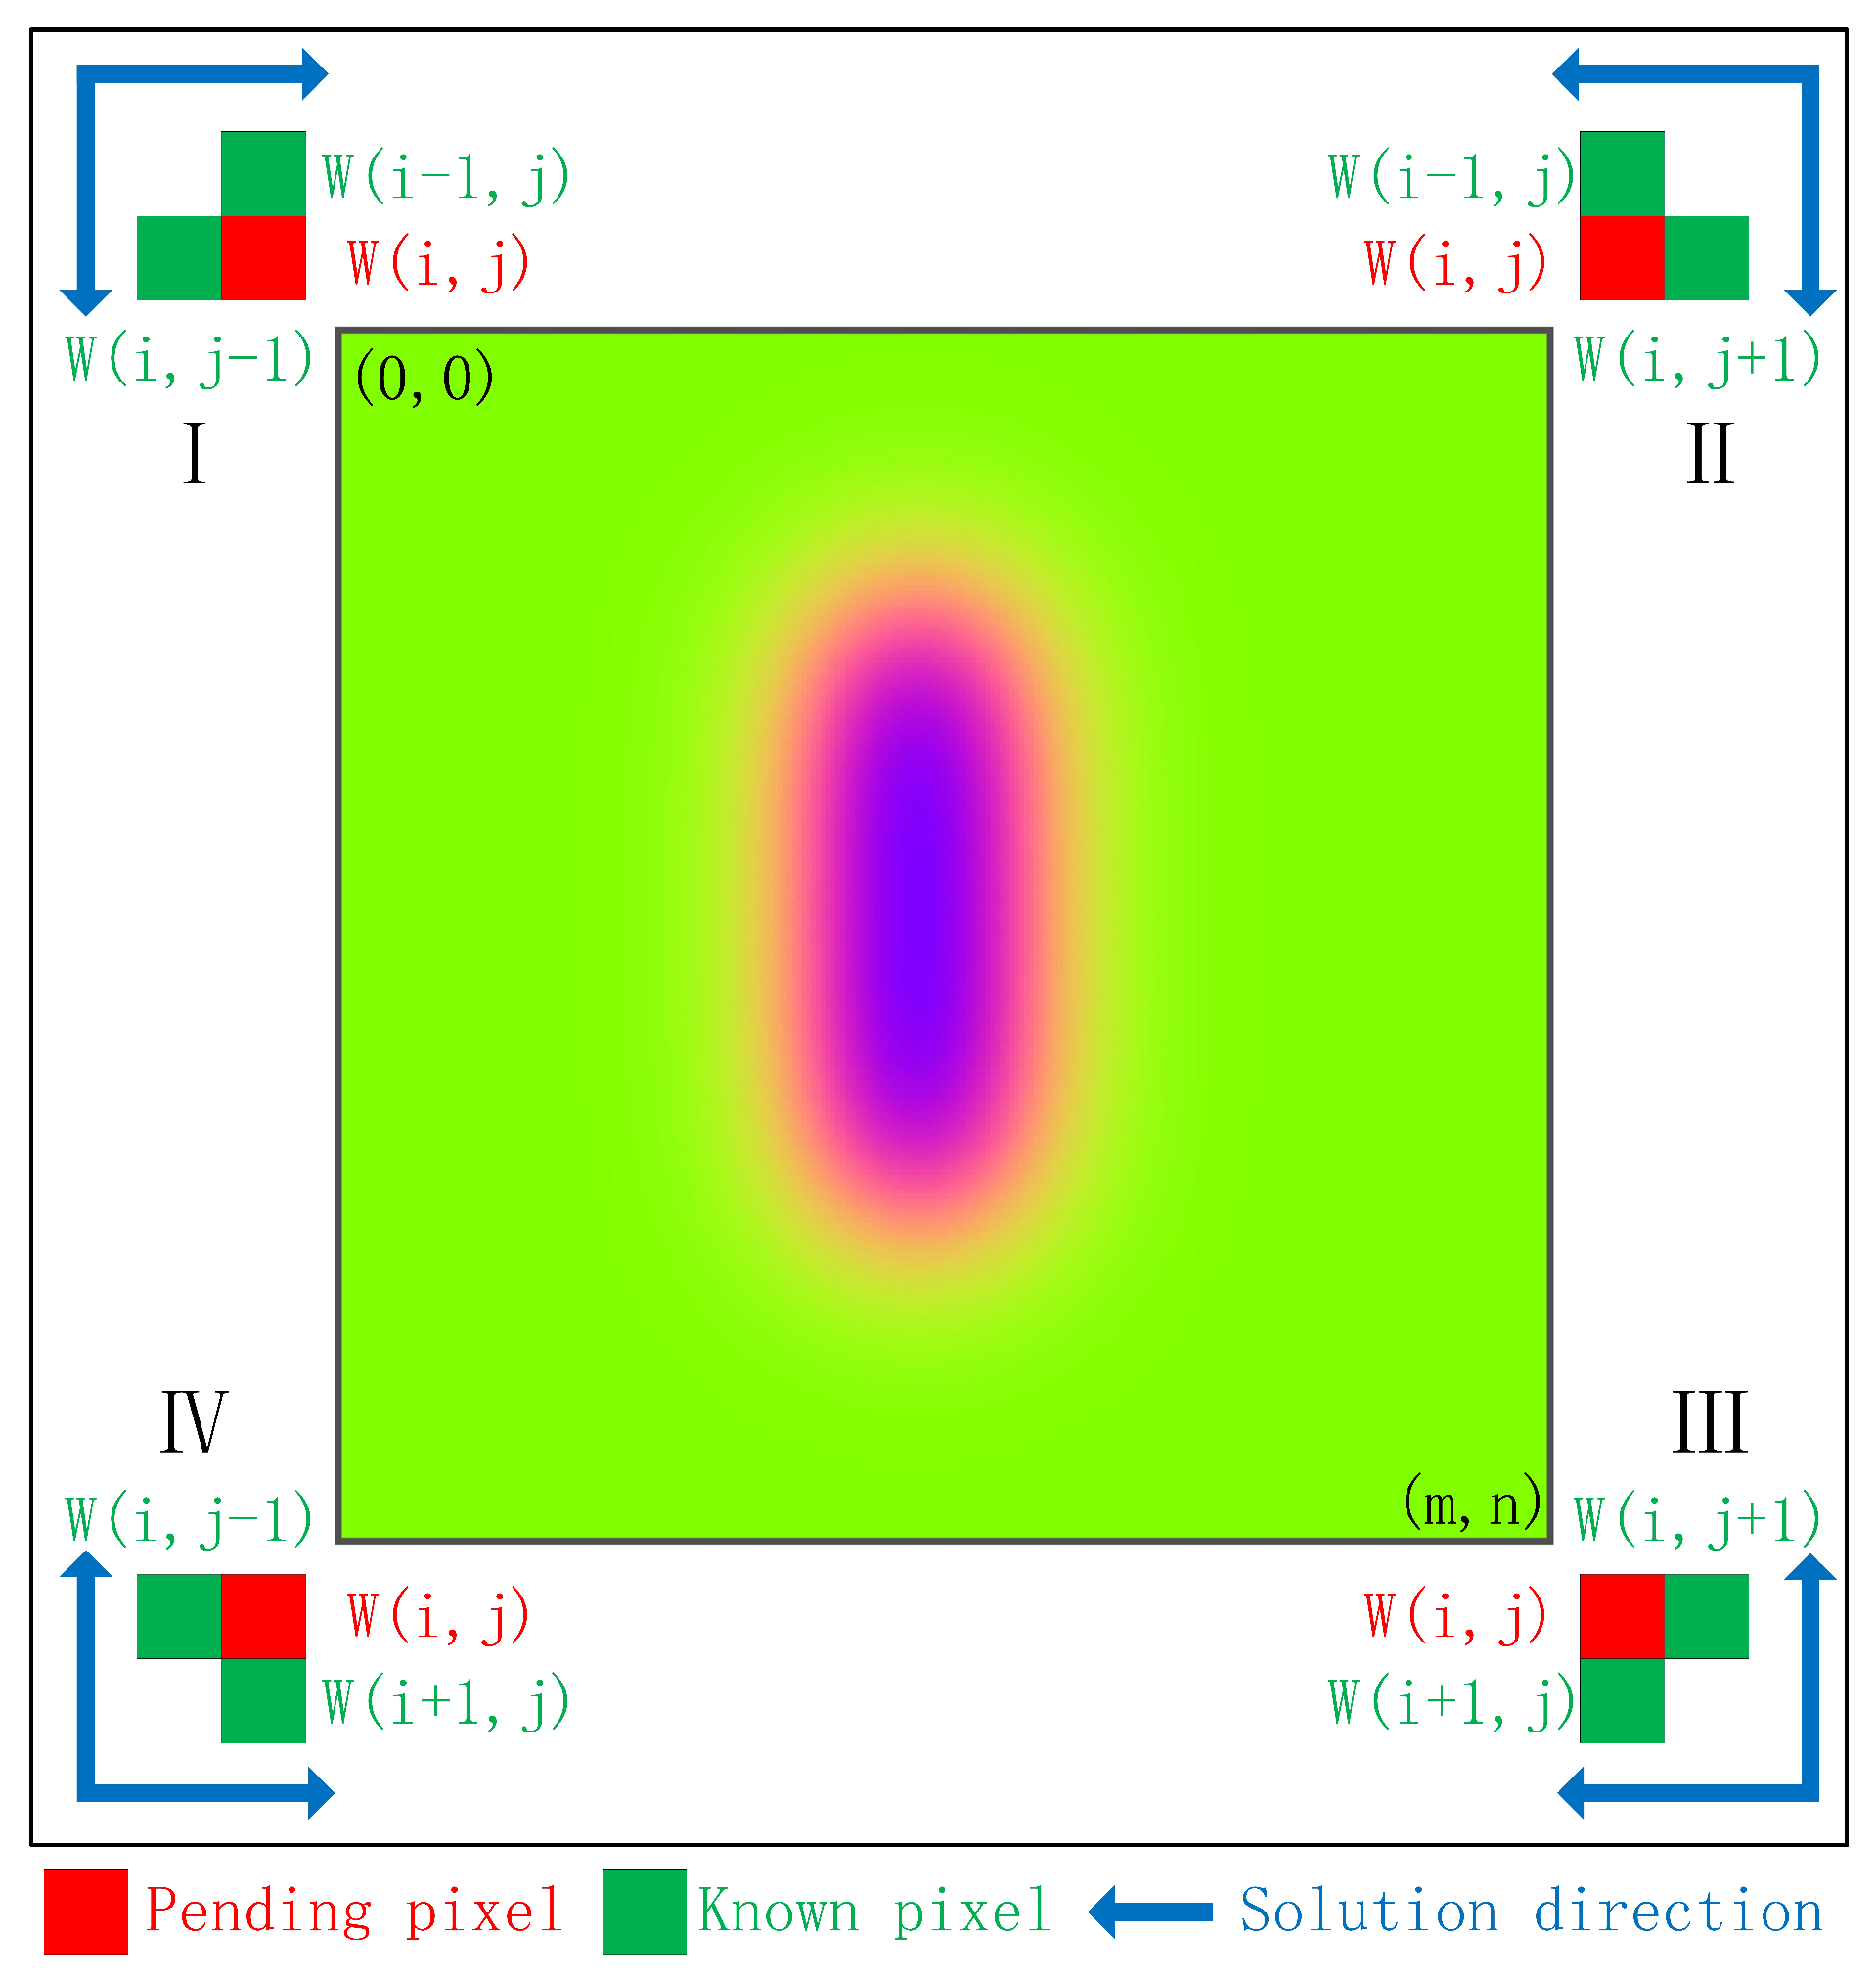
By setting different starting points and directions of the solution, we propose four solution strategies to improve the scope of application of the RSIP-based method (as shown in Figure 3), so that it can use SAR data with any heading angle to obtain 3D mining deformation. The four solution strategies are explained below:
Strategy I: The solution starting point is set at the upper left corner of the LOS deformation map (Figure 3). The solution direction is from northwest to southeast, and assuming that there is no horizontal deformation in the first row and first column. The model of Strategy I is:
U E 1 ( i , j ) = b · r · [ W ( i , j 1 ) W ( i , j ) ] / Δ E U N 1 ( i , j ) = b · r · [ W ( i , j ) W ( i 1 , j ) ] / Δ N ( i = 2 , 3 , , m ; j = 2 , 3 , , n )
Substituting (21) into (2), we can obtain:
D L O S ( i , j ) = C 1 R S I P 1 · W ( i , j ) + C 2 R S I P 1 · W ( i , j 1 ) + C 3 R S I P 1 · W ( i 1 , j )
where the coefficients are:
C 1 R S I P 1 = a 1 + b · r · a 2 / Δ E + b · r · a 3 / Δ N C 2 R S I P 1 = b · r · a 2 / Δ E C 3 R S I P 1 = b · r · a 3 / Δ N
Strategy II: The solution starting point is set at the upper right corner of the LOS deformation map (Figure 3). The solution direction is from northeast to southwest, and assuming that there is no horizontal deformation in the first row and last column. See Appendix C for the model and coefficients of Strategy II.
Strategy III: The solution starting point is set at the lower right corner of the LOS deformation map (Figure 3). The solution direction is from southeast to northwest, and assuming that there is no horizontal deformation in the last row and last column. The model and coefficients of Strategy III are the same as (3), (8) and (9), which is the RSIP-based method.
Strategy IV: The solution starting point is set at the lower left corner of the LOS deformation map (Figure 3). The solution direction is from southwest to northeast, and assuming that there is no horizontal deformation in the last row and first column. See Appendix C for the model and coefficients of Strategy IV.
Comparing the model coefficients of Strategy IV and SIP-based method, it can be seen that the coefficients of the two methods are the same, but the starting point and the direction of the solution are different. Therefore, the results of the two methods will also be different.
Combined with the proposed solution strategy, the model coefficients of the RSIP-based method can satisfy |C2/C1| + |C3/C1| < 1, in the case of any heading angle SAR image. The scope of the four strategies will be discussed in Section 4. The solution strategy of SIP-based method can be inferred according to the above content.

3. Simulation and Real Data Tests

3.1. Simulation Experiment

3.1.1. Simulation Experiment without Noise

In order to evaluate the effectiveness of the RSIP-based method combined with the proposed solution strategy, we first compared the results of the RSIP-based method and SIP-based method using noise-free simulation test. The SIP-based method proposed by Li et al. [28] was adopted because the dip angle of coal seam has no influence on the model construction.
The mining subsidence prediction software (MSPS) [31] independently developed by the China University of Mining and Technology is used to simulate subsidence, east–west, and north–south horizontal displacements. The length and width of the simulated working face are 700 m and 150 m, respectively, the mining thickness is 2.5 m, the dip angle is 30 (tilt to the southeast), the average mining depth H is 537.5 m, the horizontal displacement coefficient b is 0.3, the main influence angle tangent tan β is 1.8, and the subsidence coefficient is 0.7. We set the strike azimuth of the working face to 45 , making the strike main section of the simulated subsidence basin inconsistent with the north direction, to explain that when the working face has a dip angle, it will not affect the horizontal displacements in any direction estimated by the RSIP/SIP-based method. The simulated 3D displacements are shown in Figure 4a–c.
Since the SIP-based method is only valid for ascending orbit data (see Section 4 for details), we project the simulated 3D displacements (Figure 4a–c) into the LOS direction, based on the imaging geometry of RadarSAT-2 ascending SAR data (heading angle α : 349.14 , incidence angle θ : 35.51 , resolutions: 5 × 5 m).
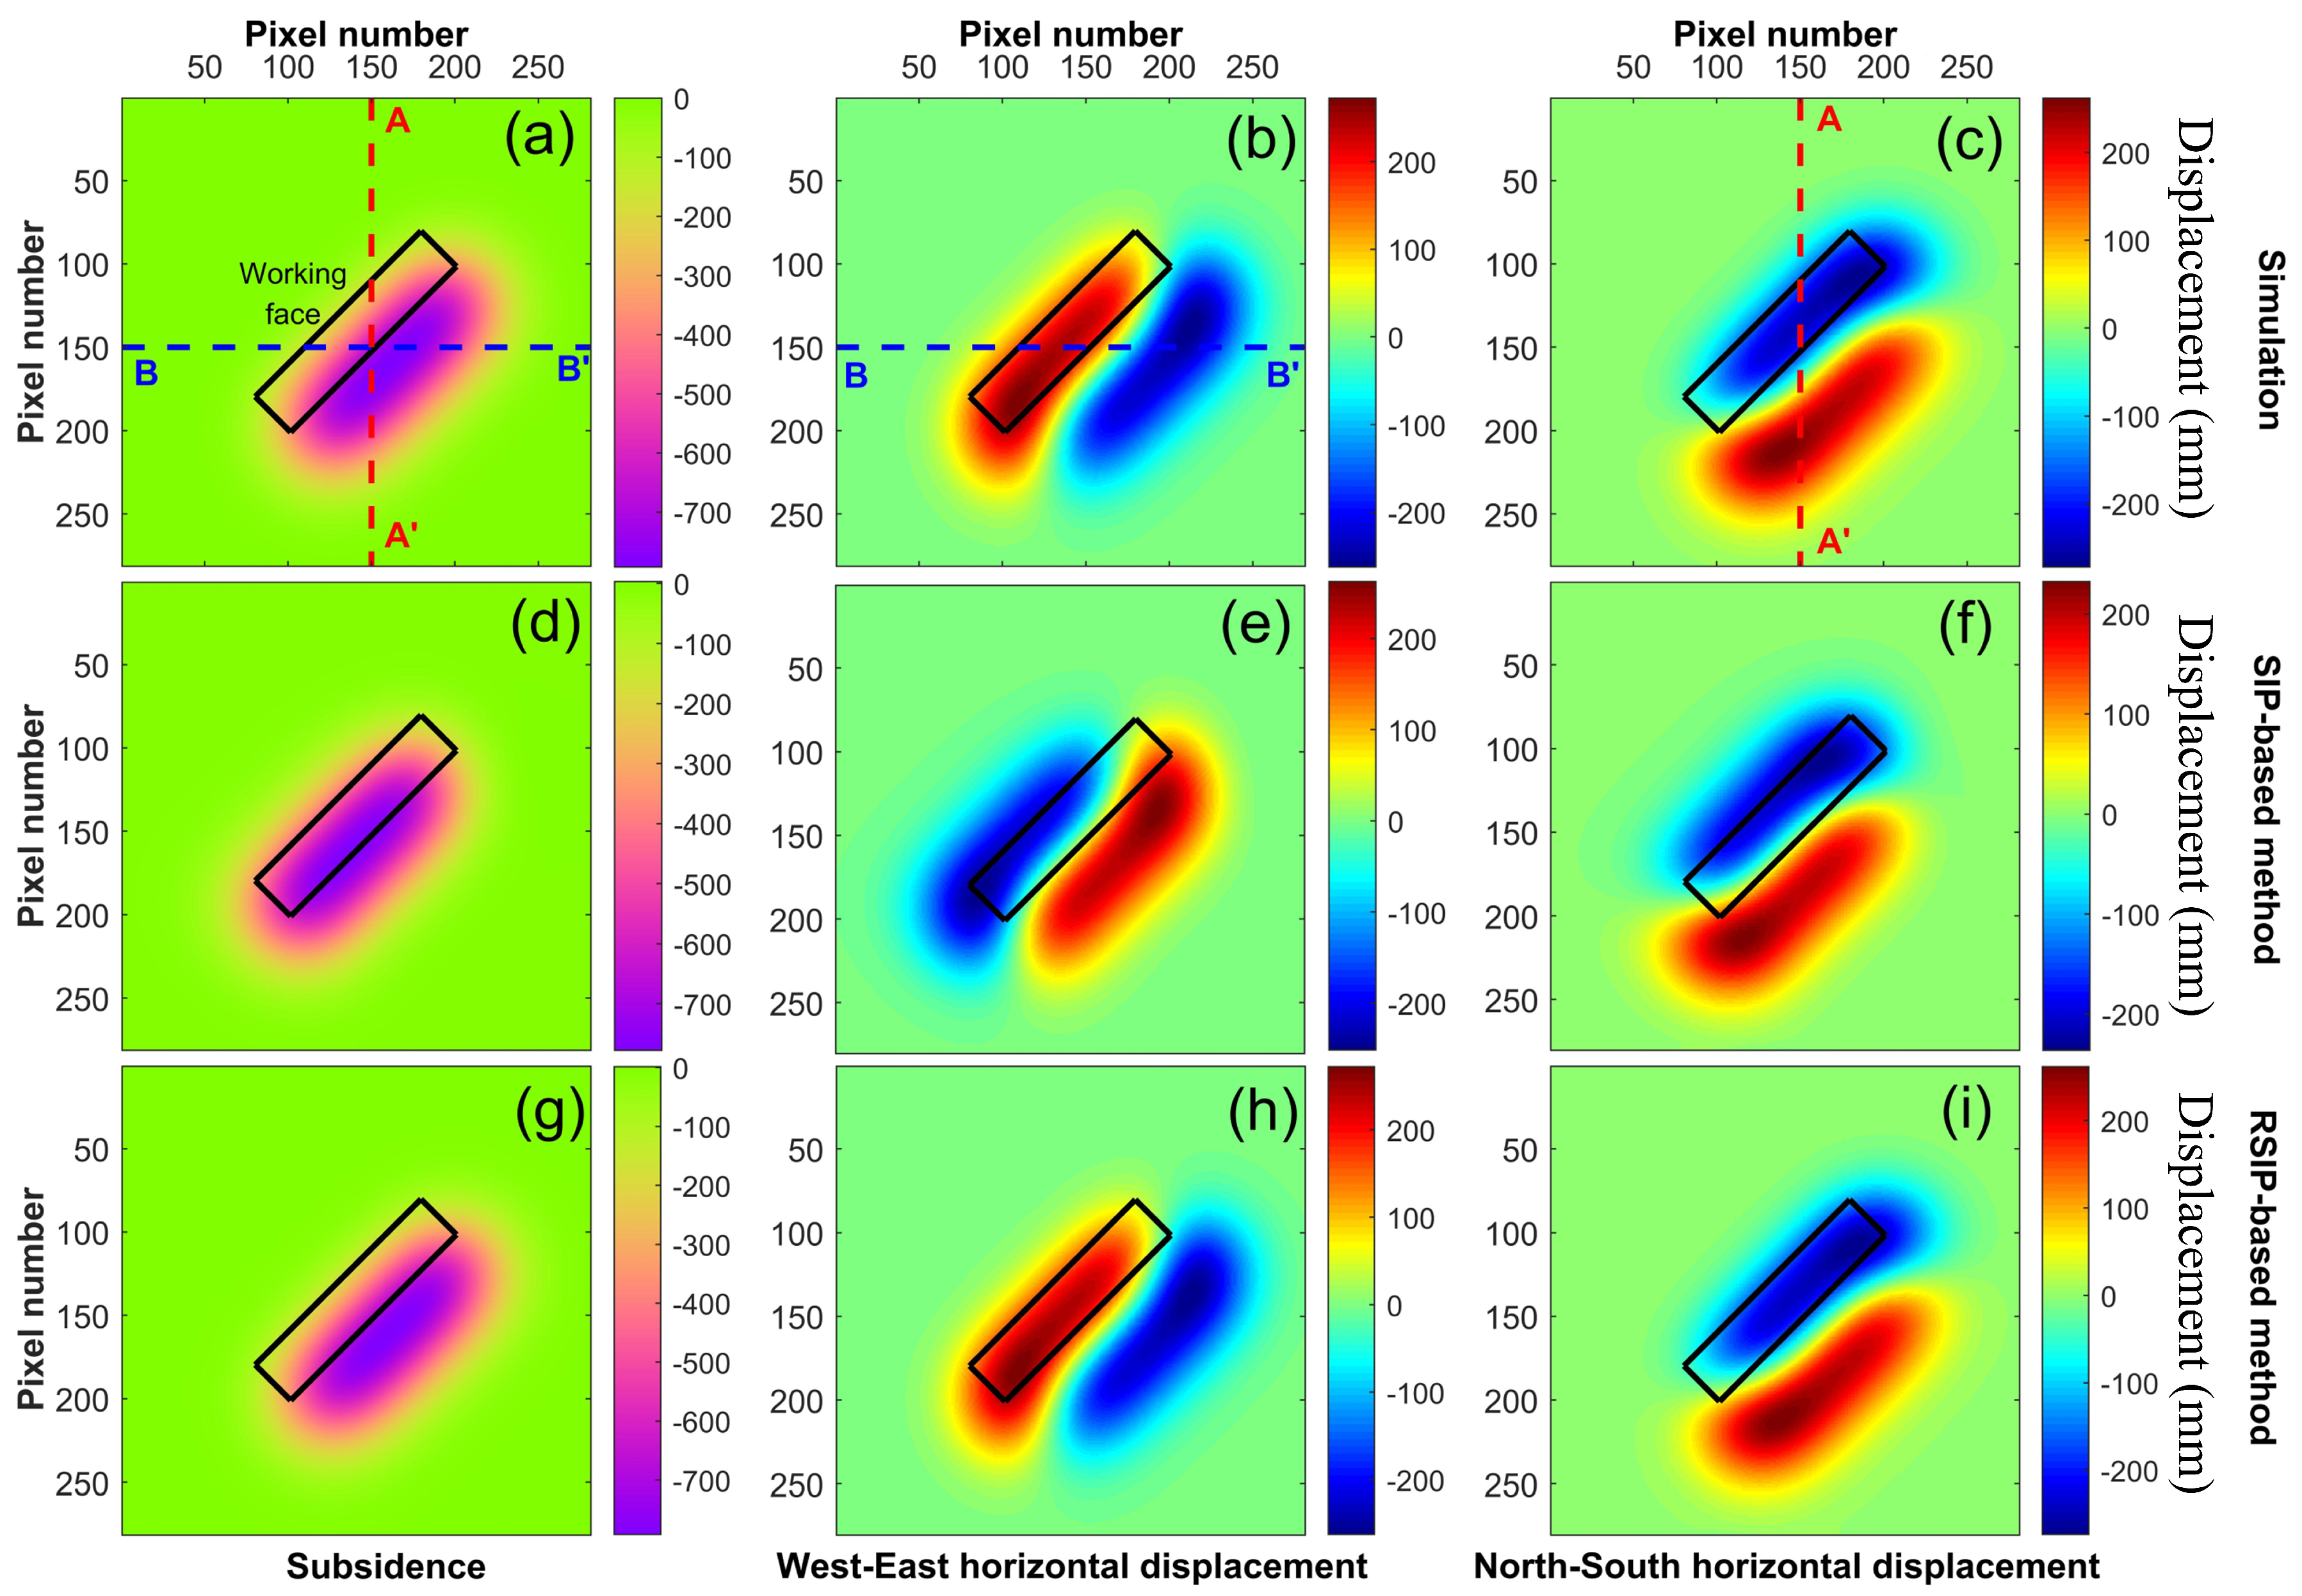
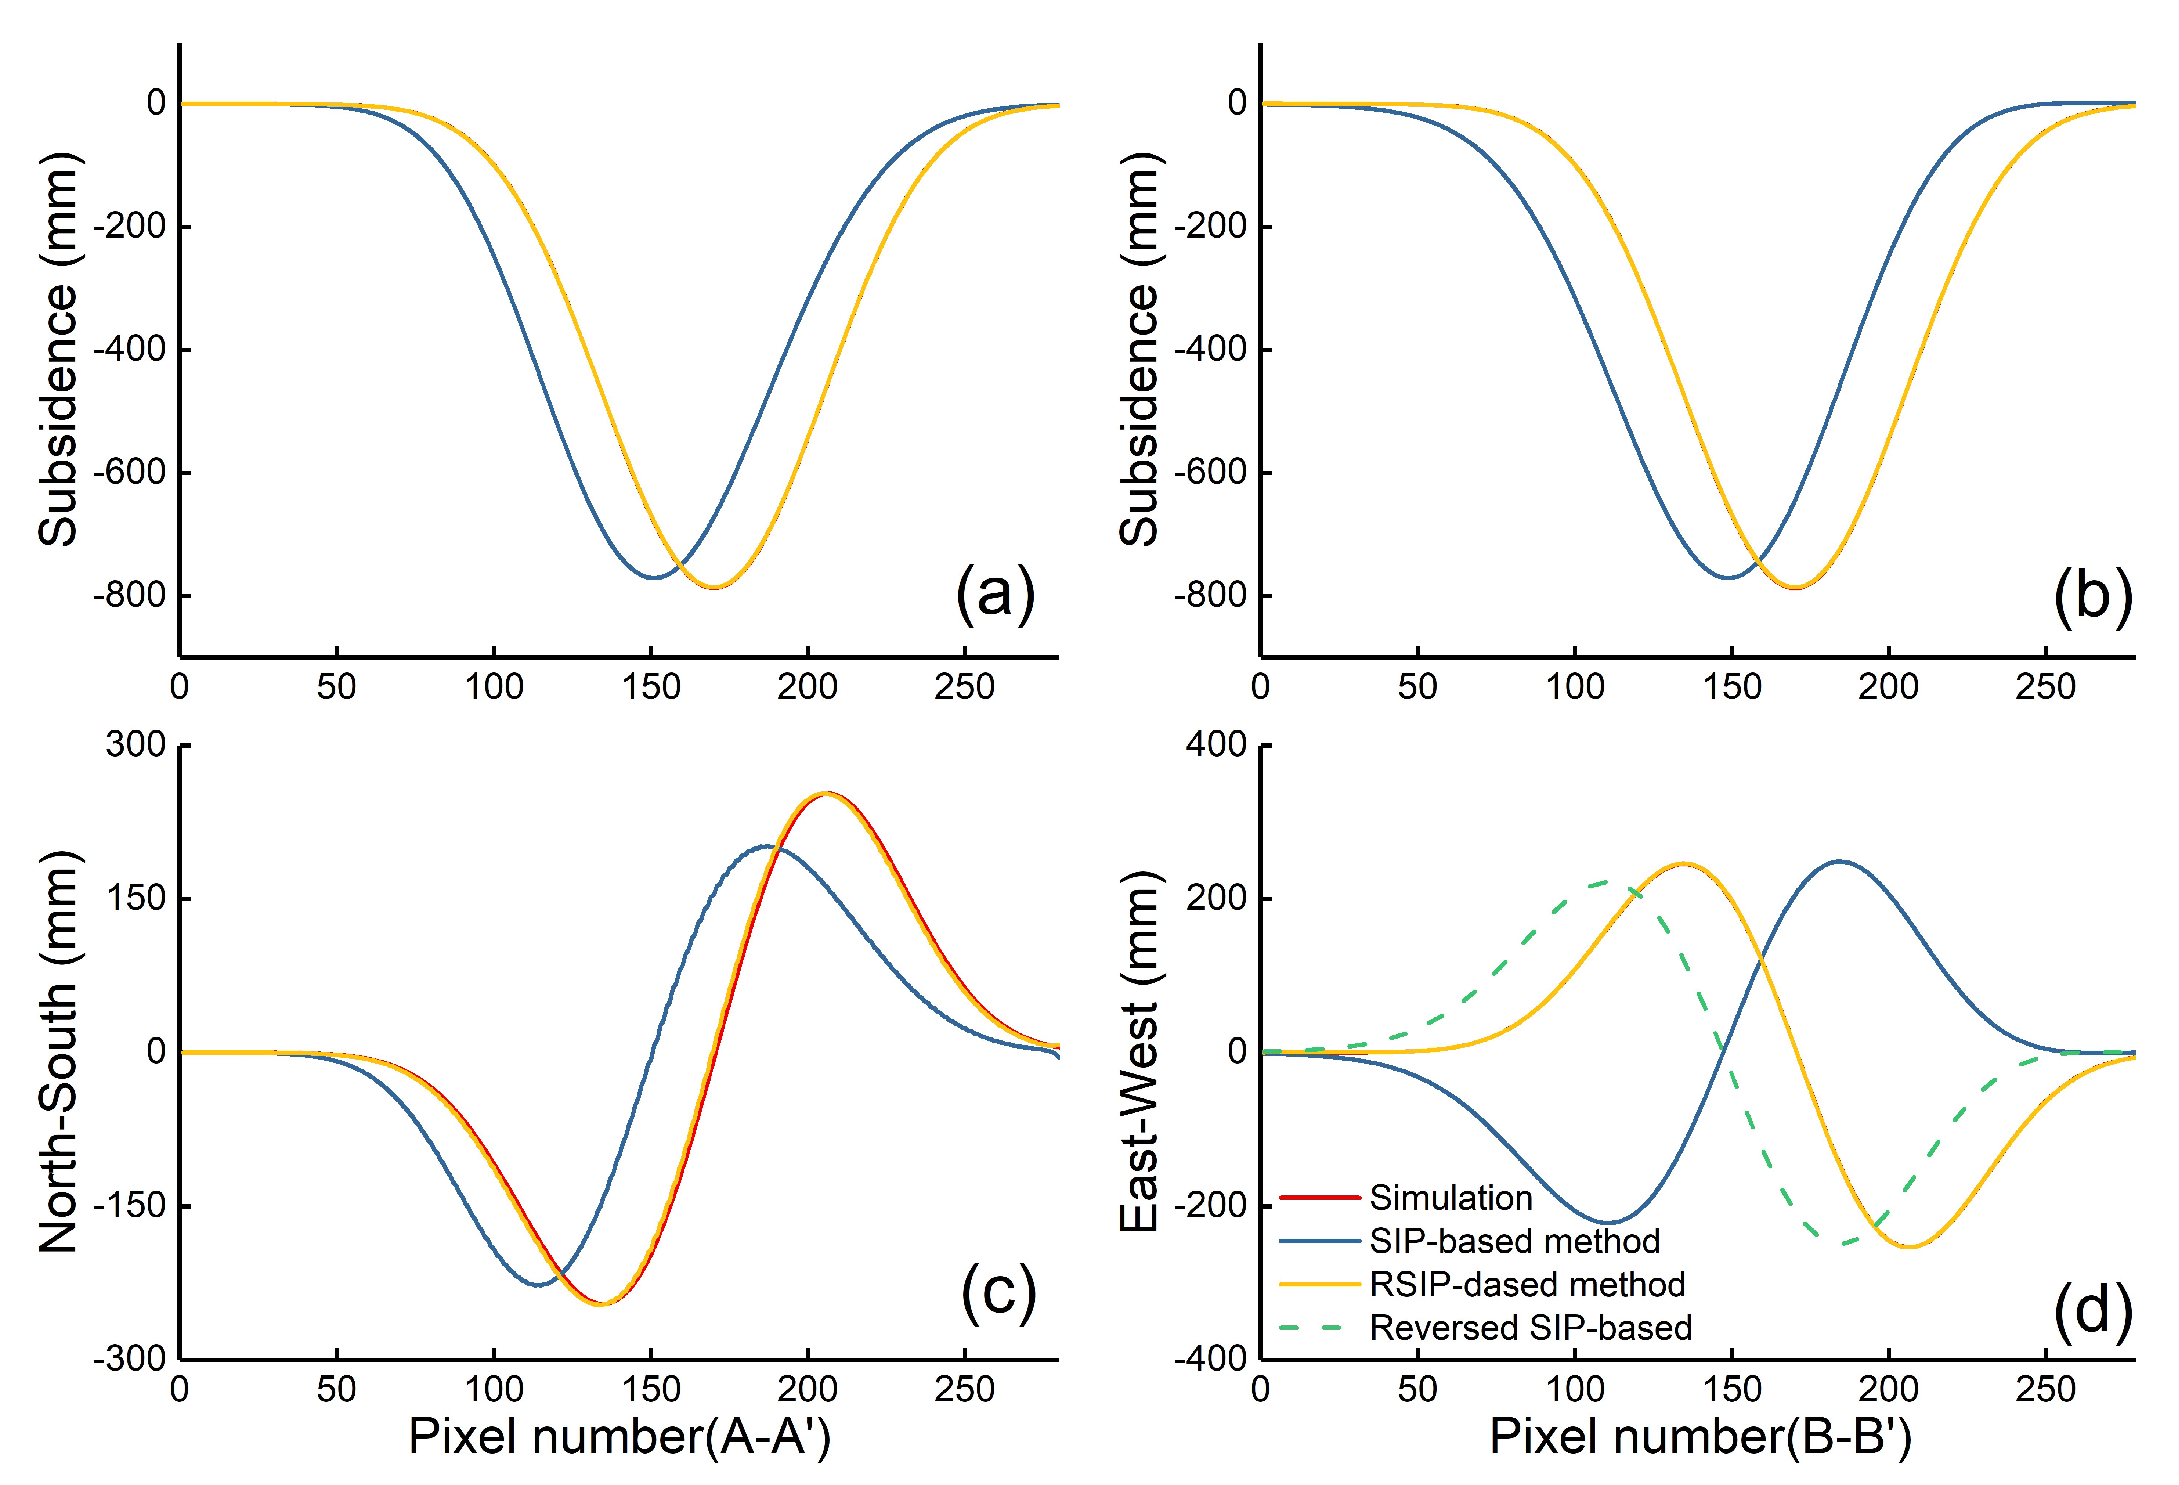
The 3D displacements are extracted from the simulated LOS deformation by RSIP and SIP-based method, respectively. The result is shown in Figure 4. It can be seen from Figure 4d–f that the SIP-based method was built without considering the directionality of the horizontal movement, resulting in a significant “offset” in the estimated 3D displacements compared with the simulated deformation (Figure 4a–c). Combined with the analysis of the profiles deformation (i.e., A-A’ and B-B’ in Figure 4a), we can see that the subsidence basin has an “offset” in both the north and east directions (Figure 5a,b), because the strike azimuth of the working face is inconsistent with the north direction. The horizontal movement also shows a significant “offset” (Figure 4e,f and Figure 5c,d), due to it being obtained through subsidence, and the direction of east–west horizontal movement is opposite to the actual (Figure 4e), owing to the tilt of the estimated subsidence being different from the tilt of the simulated subsidence at the same position, resulting in a deviation of the horizontal movement magnitude at the same position (Figure 5c,d).
From Figure 4g–i and Figure 5, we can see that the scope, position, and direction of the 3D displacements calculated by RSIP-based method is consistent with the simulation deformation, because the directionality of horizontal movement is considered, which greatly improved the performance of SIP-based method, and the 3D displacements estimated by RSIP-based method do not have any deviation due to the inclination of the coal seam. In the case of ascending SAR data, 3D deformation can be successfully obtained through the RSIP-based method combined with the proposed solution strategy, which avoids the influence of the coefficient on the stability of the model and expands the applicability of the method.
In order to intuitively show the difference between the 3D displacements estimated by the SIP and the RSIP-based method, the difference between the estimated 3D displacements of the two methods and the simulated deformation is shown in Figure 6. Before doing the subtraction, we make the direction of east–west horizontal movement acquired by the SIP-based method be consistent with the actual by manually multiplying by −1. From Figure 6, we can see that the 3D displacements obtained by the SIP-based method is significantly different from the simulated deformation (Figure 6a–c), and the difference in subsidence (Figure 6a) is same to the pattern of east–west horizontal movement, reflecting the influence of the directionality of horizontal movement on the estimated subsidence, while the 3D displacements estimated by the RSIP-based method is consistent with the simulated deformation (Figure 6d–f). The accuracy of the two methods is evaluated quantitatively by the root mean square error (RMSE). The RMSEs of the 3D displacements extracted by the SIP-based method are 99.58 mm, 66.26 mm and 50.26 mm for the subsidence, east–west and north–south components, respectively. The RMSEs of the 3D displacements extracted by the RSIP-based method are 0.45 mm, 0.50 mm, and 2.98 mm for the subsidence, east–west, and north–south components, respectively. Compared with the SIP-based method, the accuracy of the RSIP-based method is improved by 99.55%, 99.25%, and 94.07% for the subsidence, east–west, and north–south components, respectively.

3.1.2. Simulation Experiment with Noise

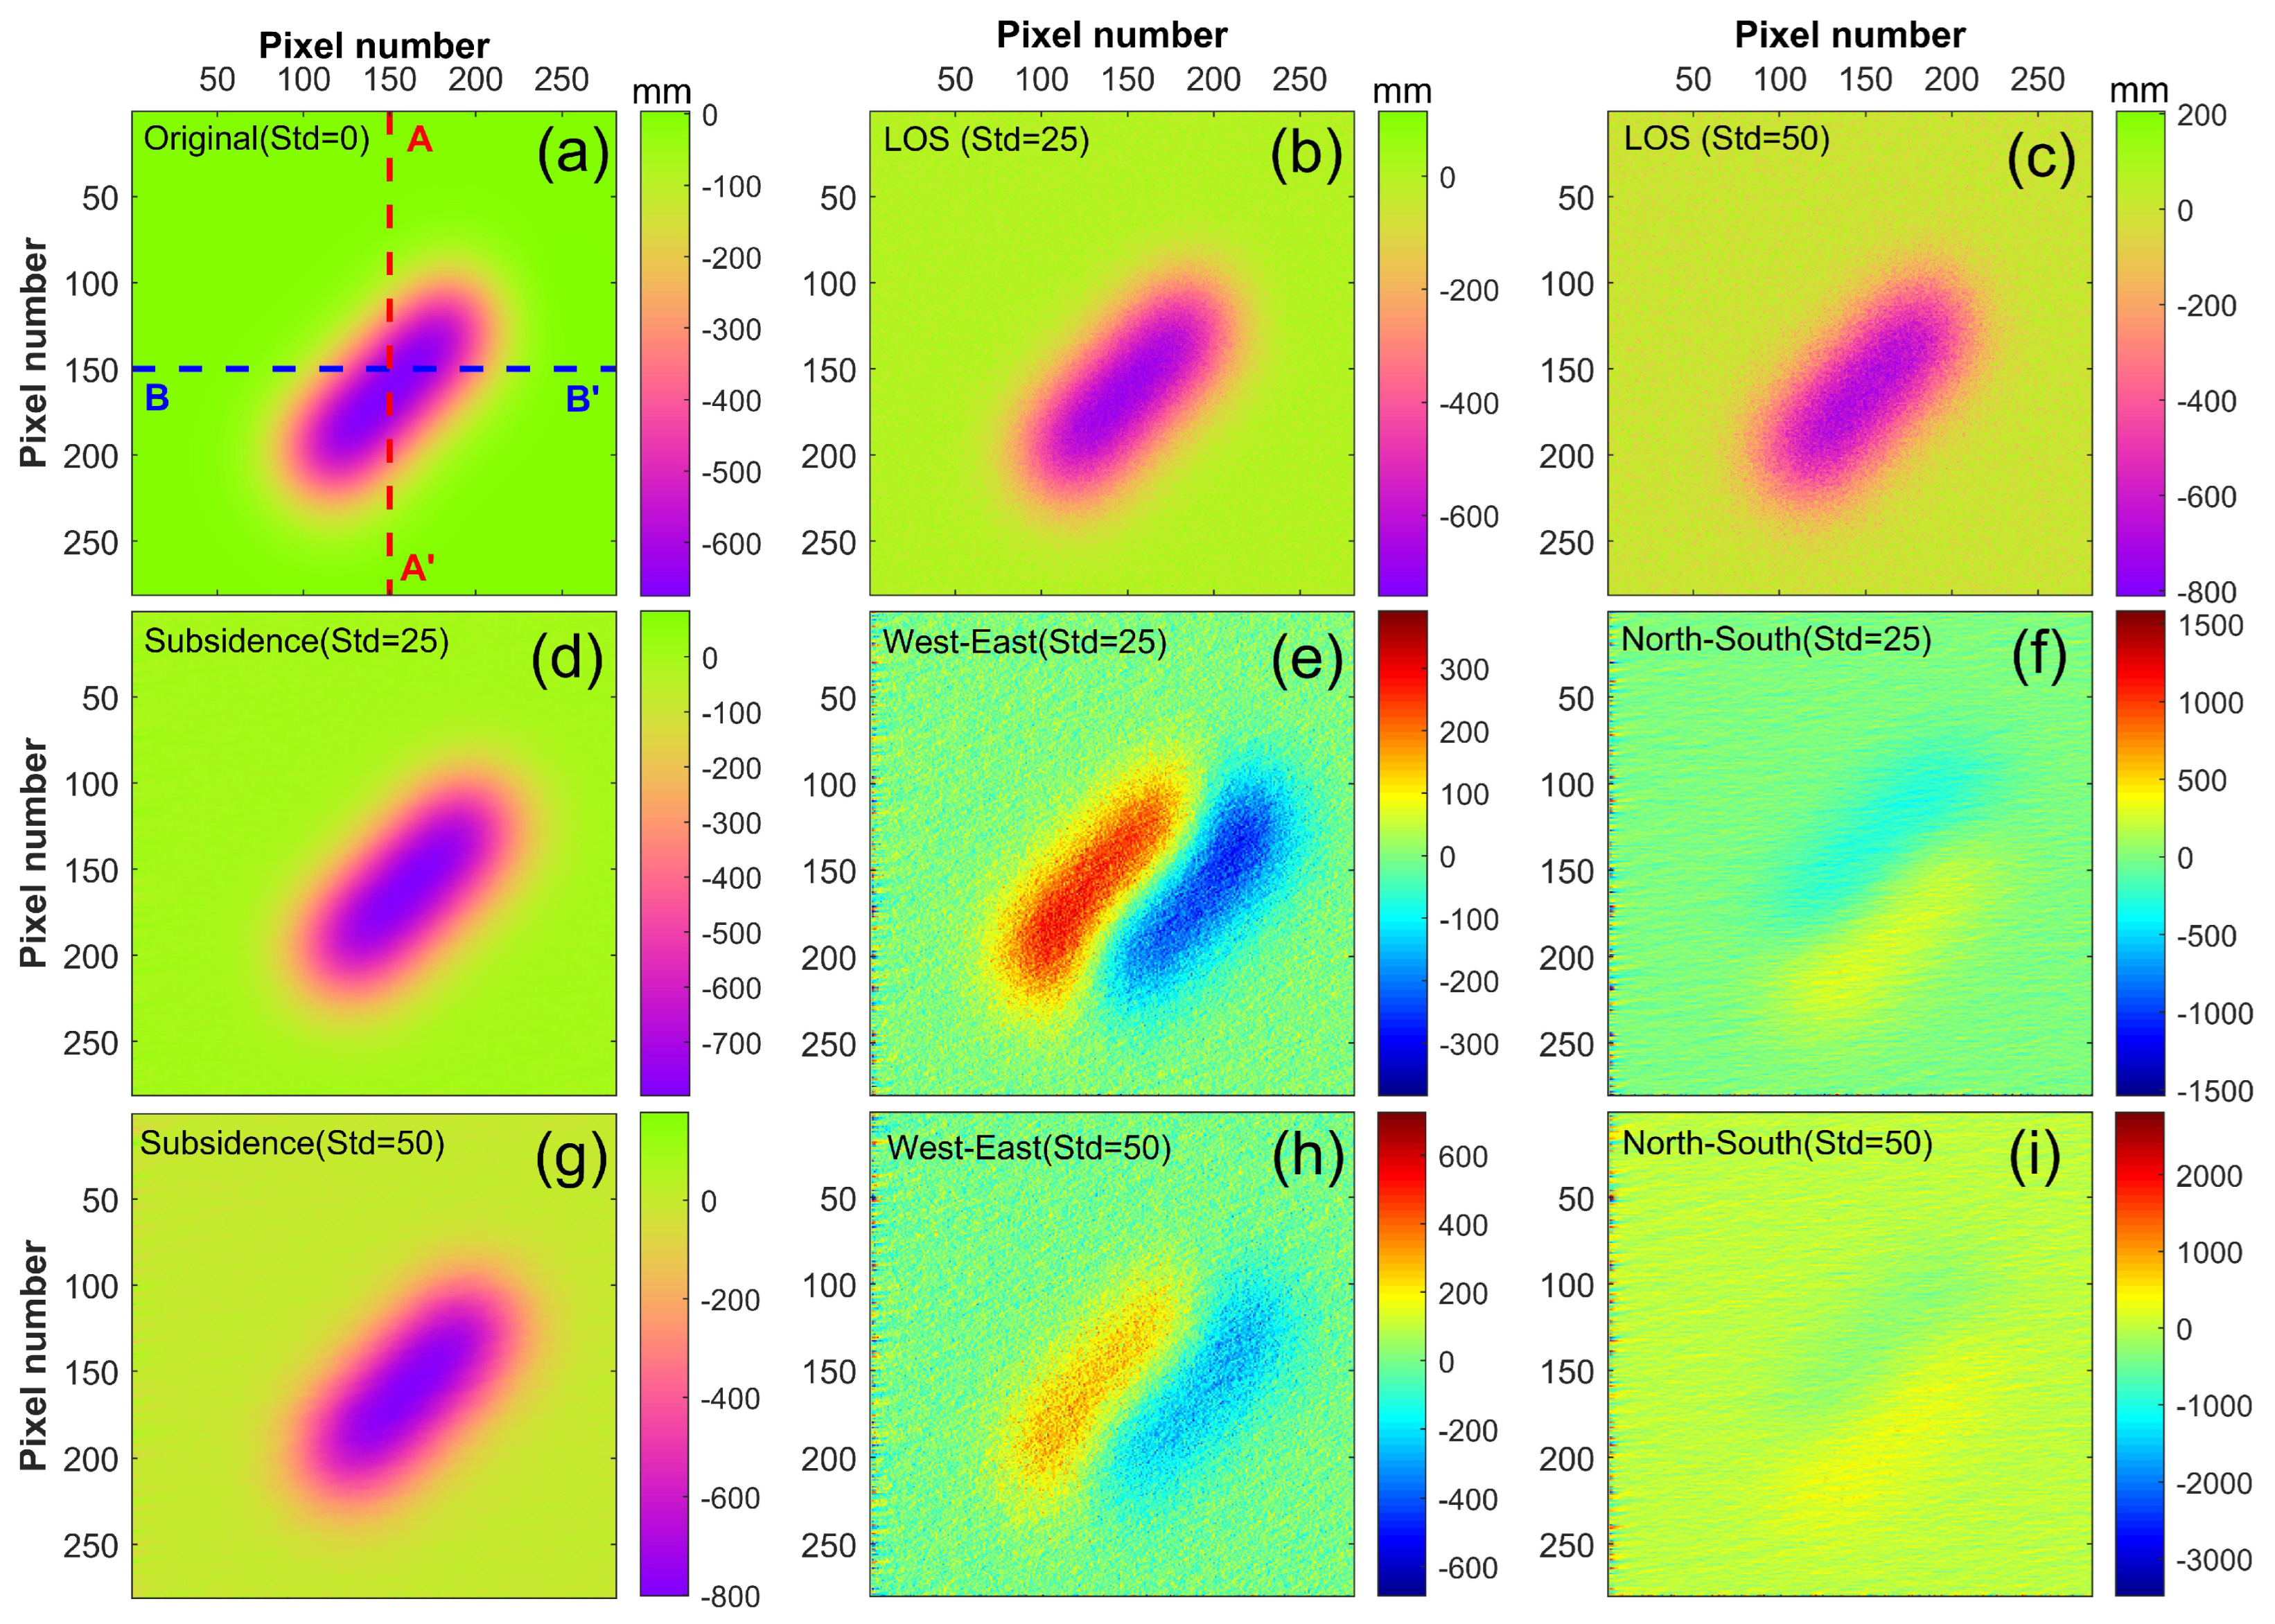
In order to evaluate the influence of noise on the RSIP-based method, we obtained 50 sets of simulated LOS deformation maps by adding Gaussian random noise with a mean value of 0 and a standard deviation (Std) of 1 to 50 to the original LOS deformation map; Figure 7a–c are the LOS deformation maps with noise standard deviation of 0, 25, and 50, respectively. The 3D displacements are estimated from 50 sets of simulated LOS deformation maps by the RSIP-based method; the estimated 3D displacements with noise standard deviations of 25 and 50 are displayed in Figure 7.
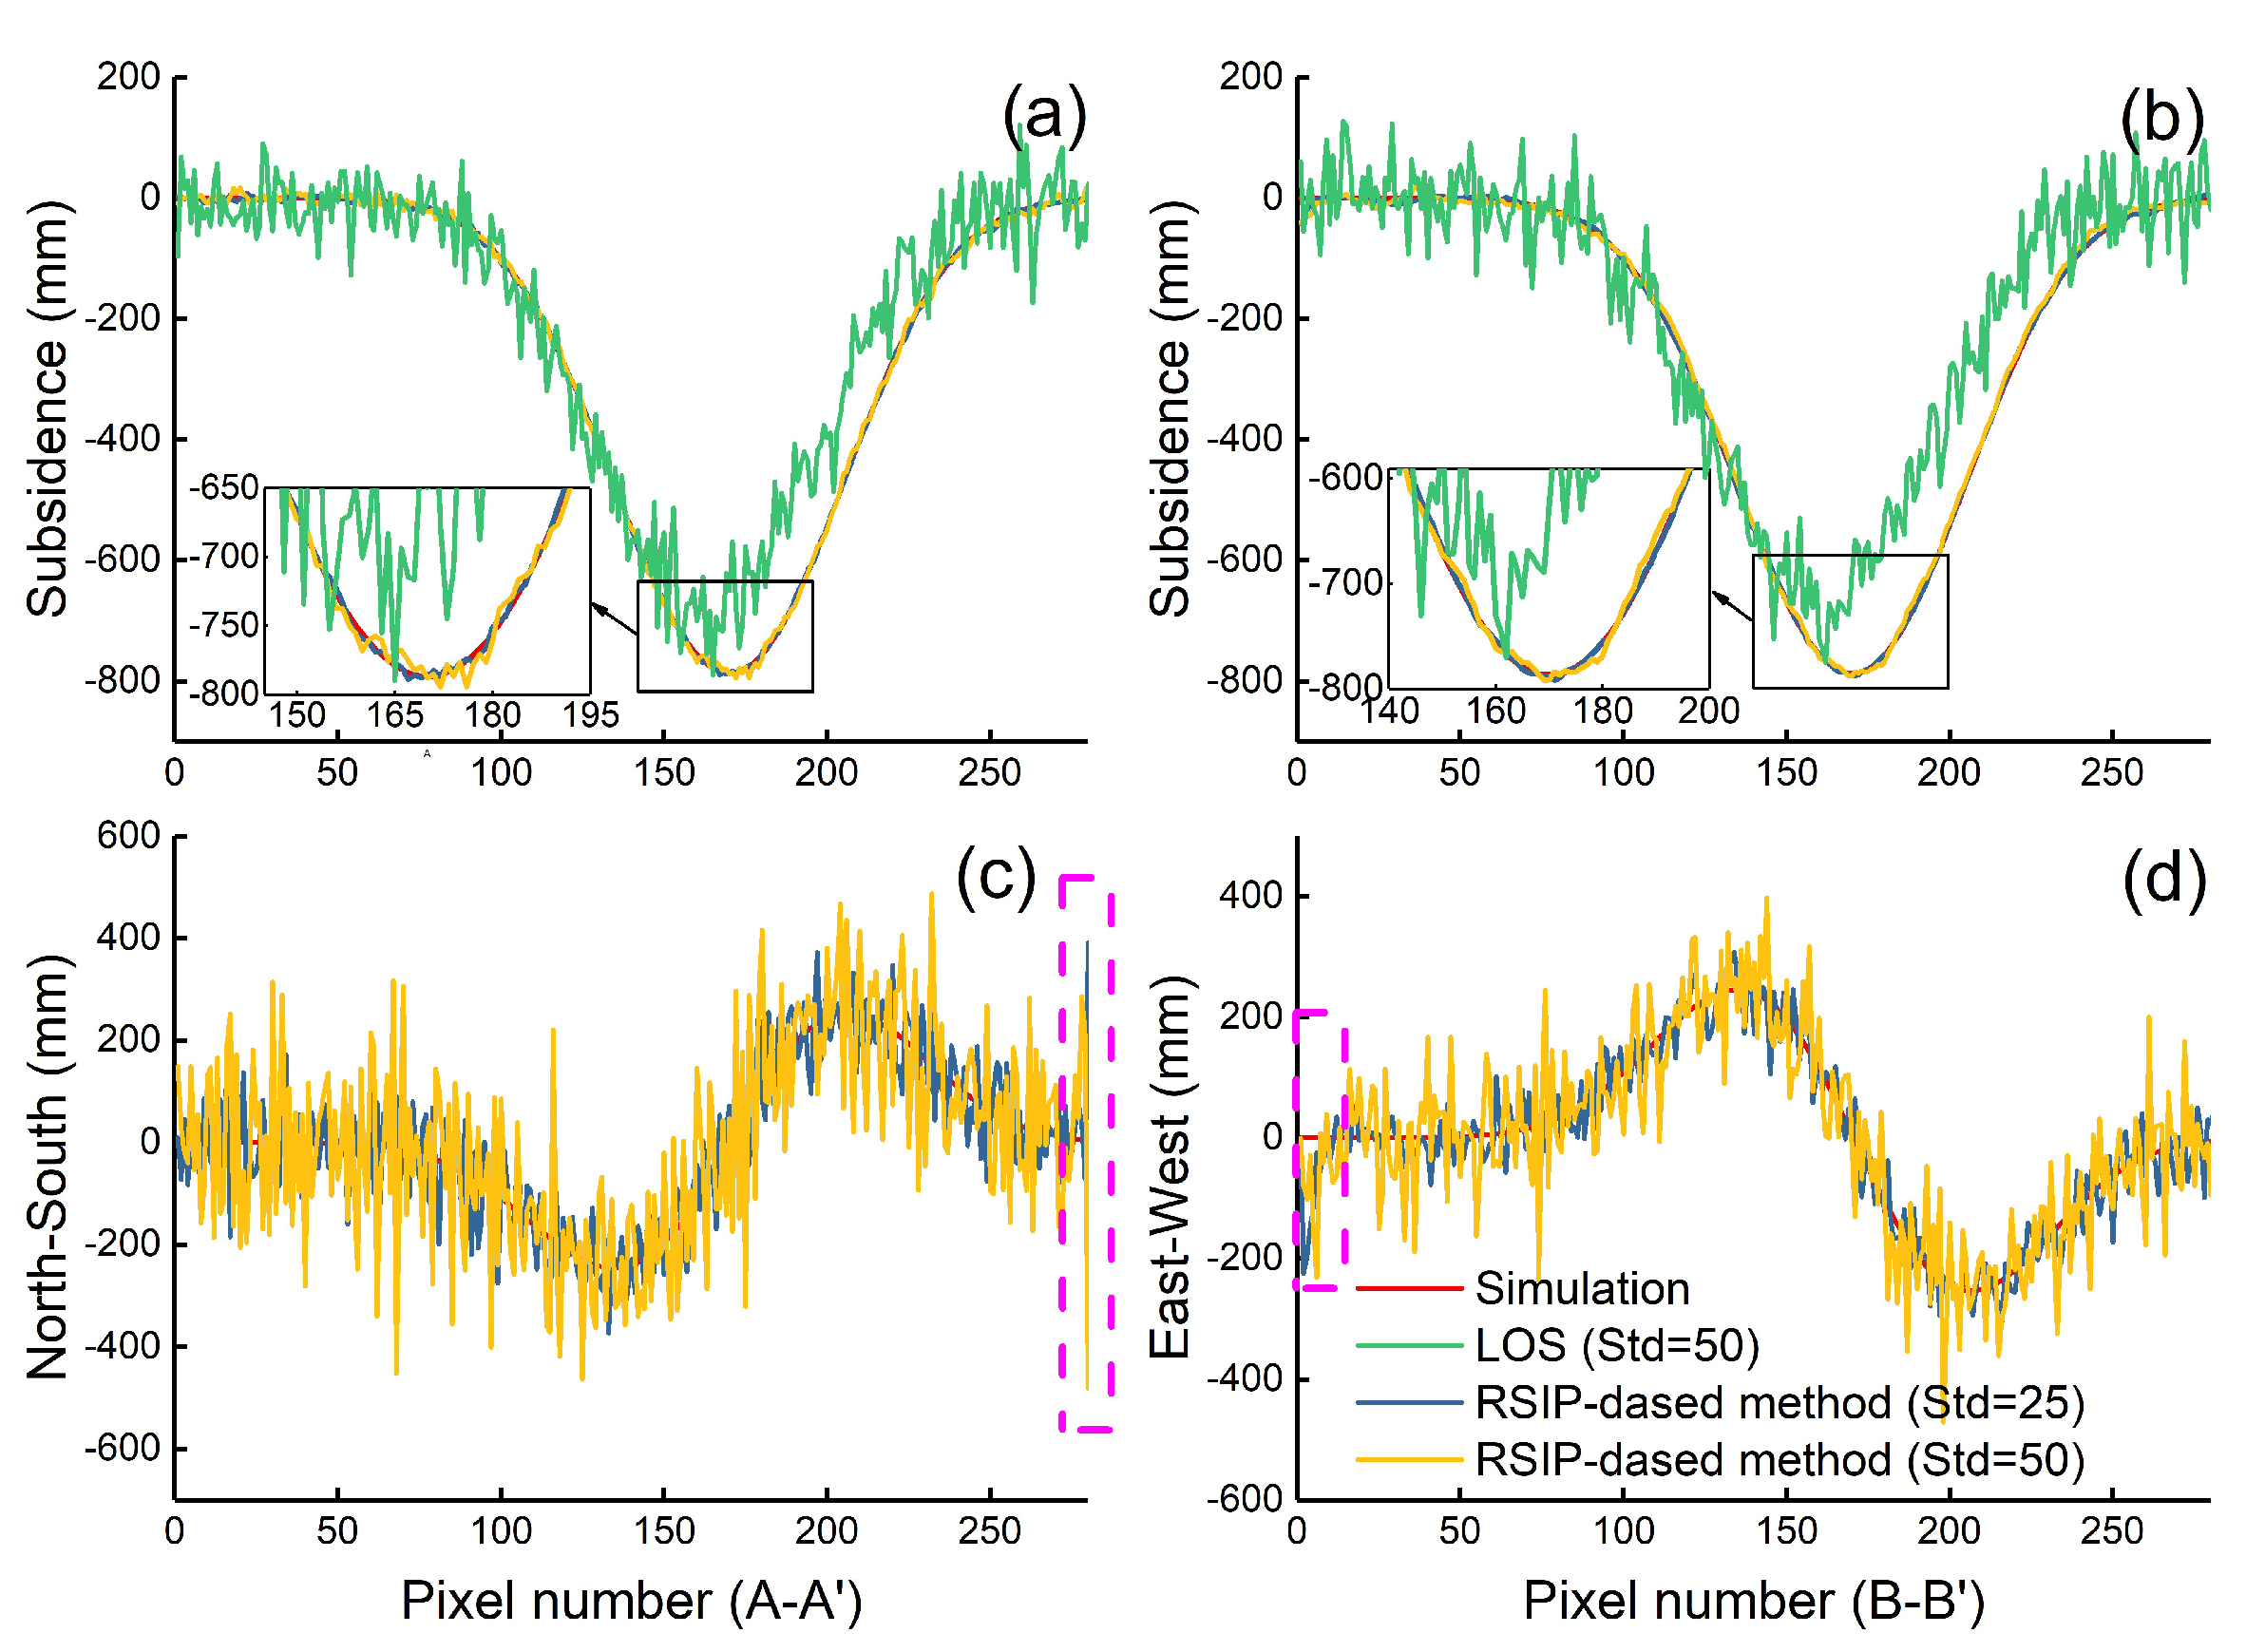
It can be seen from Figure 7d,g that when the noise standard deviation is 25 and 50, the subsidence obtained by the RSIP-based method can still get better results compared with the simulated subsidence (Figure 4a). And, combined with the subsidence profiles (i.e., A-A’ and B-B’ in Figure 7a), we can see that although the subsidence obtained by the RSIP-based method fluctuates slightly around the simulated subsidence, the overall agreement is better with the simulated subsidence (Figure 8a,b). However, the horizontal movement obtained by the RSIP-based method becomes worse and worse as the noise standard deviation increases (Figure 7e,f,h,i). Especially for the north–south horizontal movement, when the noise standard deviation increases to 50, it is difficult to distinguish the characteristics of the north–south horizontal movement (Figure 7f,i and Figure 8c). From Figure 7e,f,h,i and Figure 8 (purple rectangular boxes in Figure 8c,d), we can see that there are outliers at the borders on the west and south sides of the horizontal movement, especially at the boundary of north–south horizontal movement, where the magnitude of abnormal value caused by noise can reach 3000 mm (Figure 7i). This is because, for the ascending SAR data, the 3D displacements are estimated by the RSIP-based method combined with Strategy IV, and assume that the horizontal movement is 0 in the first column (west boundary) and the last row (south boundary) of the LOS deformation map. However, when there is noise, because |C2/C1| + |C3/C1| < 1, the closer to the starting point of the solution, the smaller the indexes of |C2/C1| and |C3/C1| will be, which will cause the estimated subsidence to be more affected by the noise. And, this noise will be amplified by at least br/ Δ E or br/ Δ N times, when using the estimated subsidence to solve the horizontal movement.
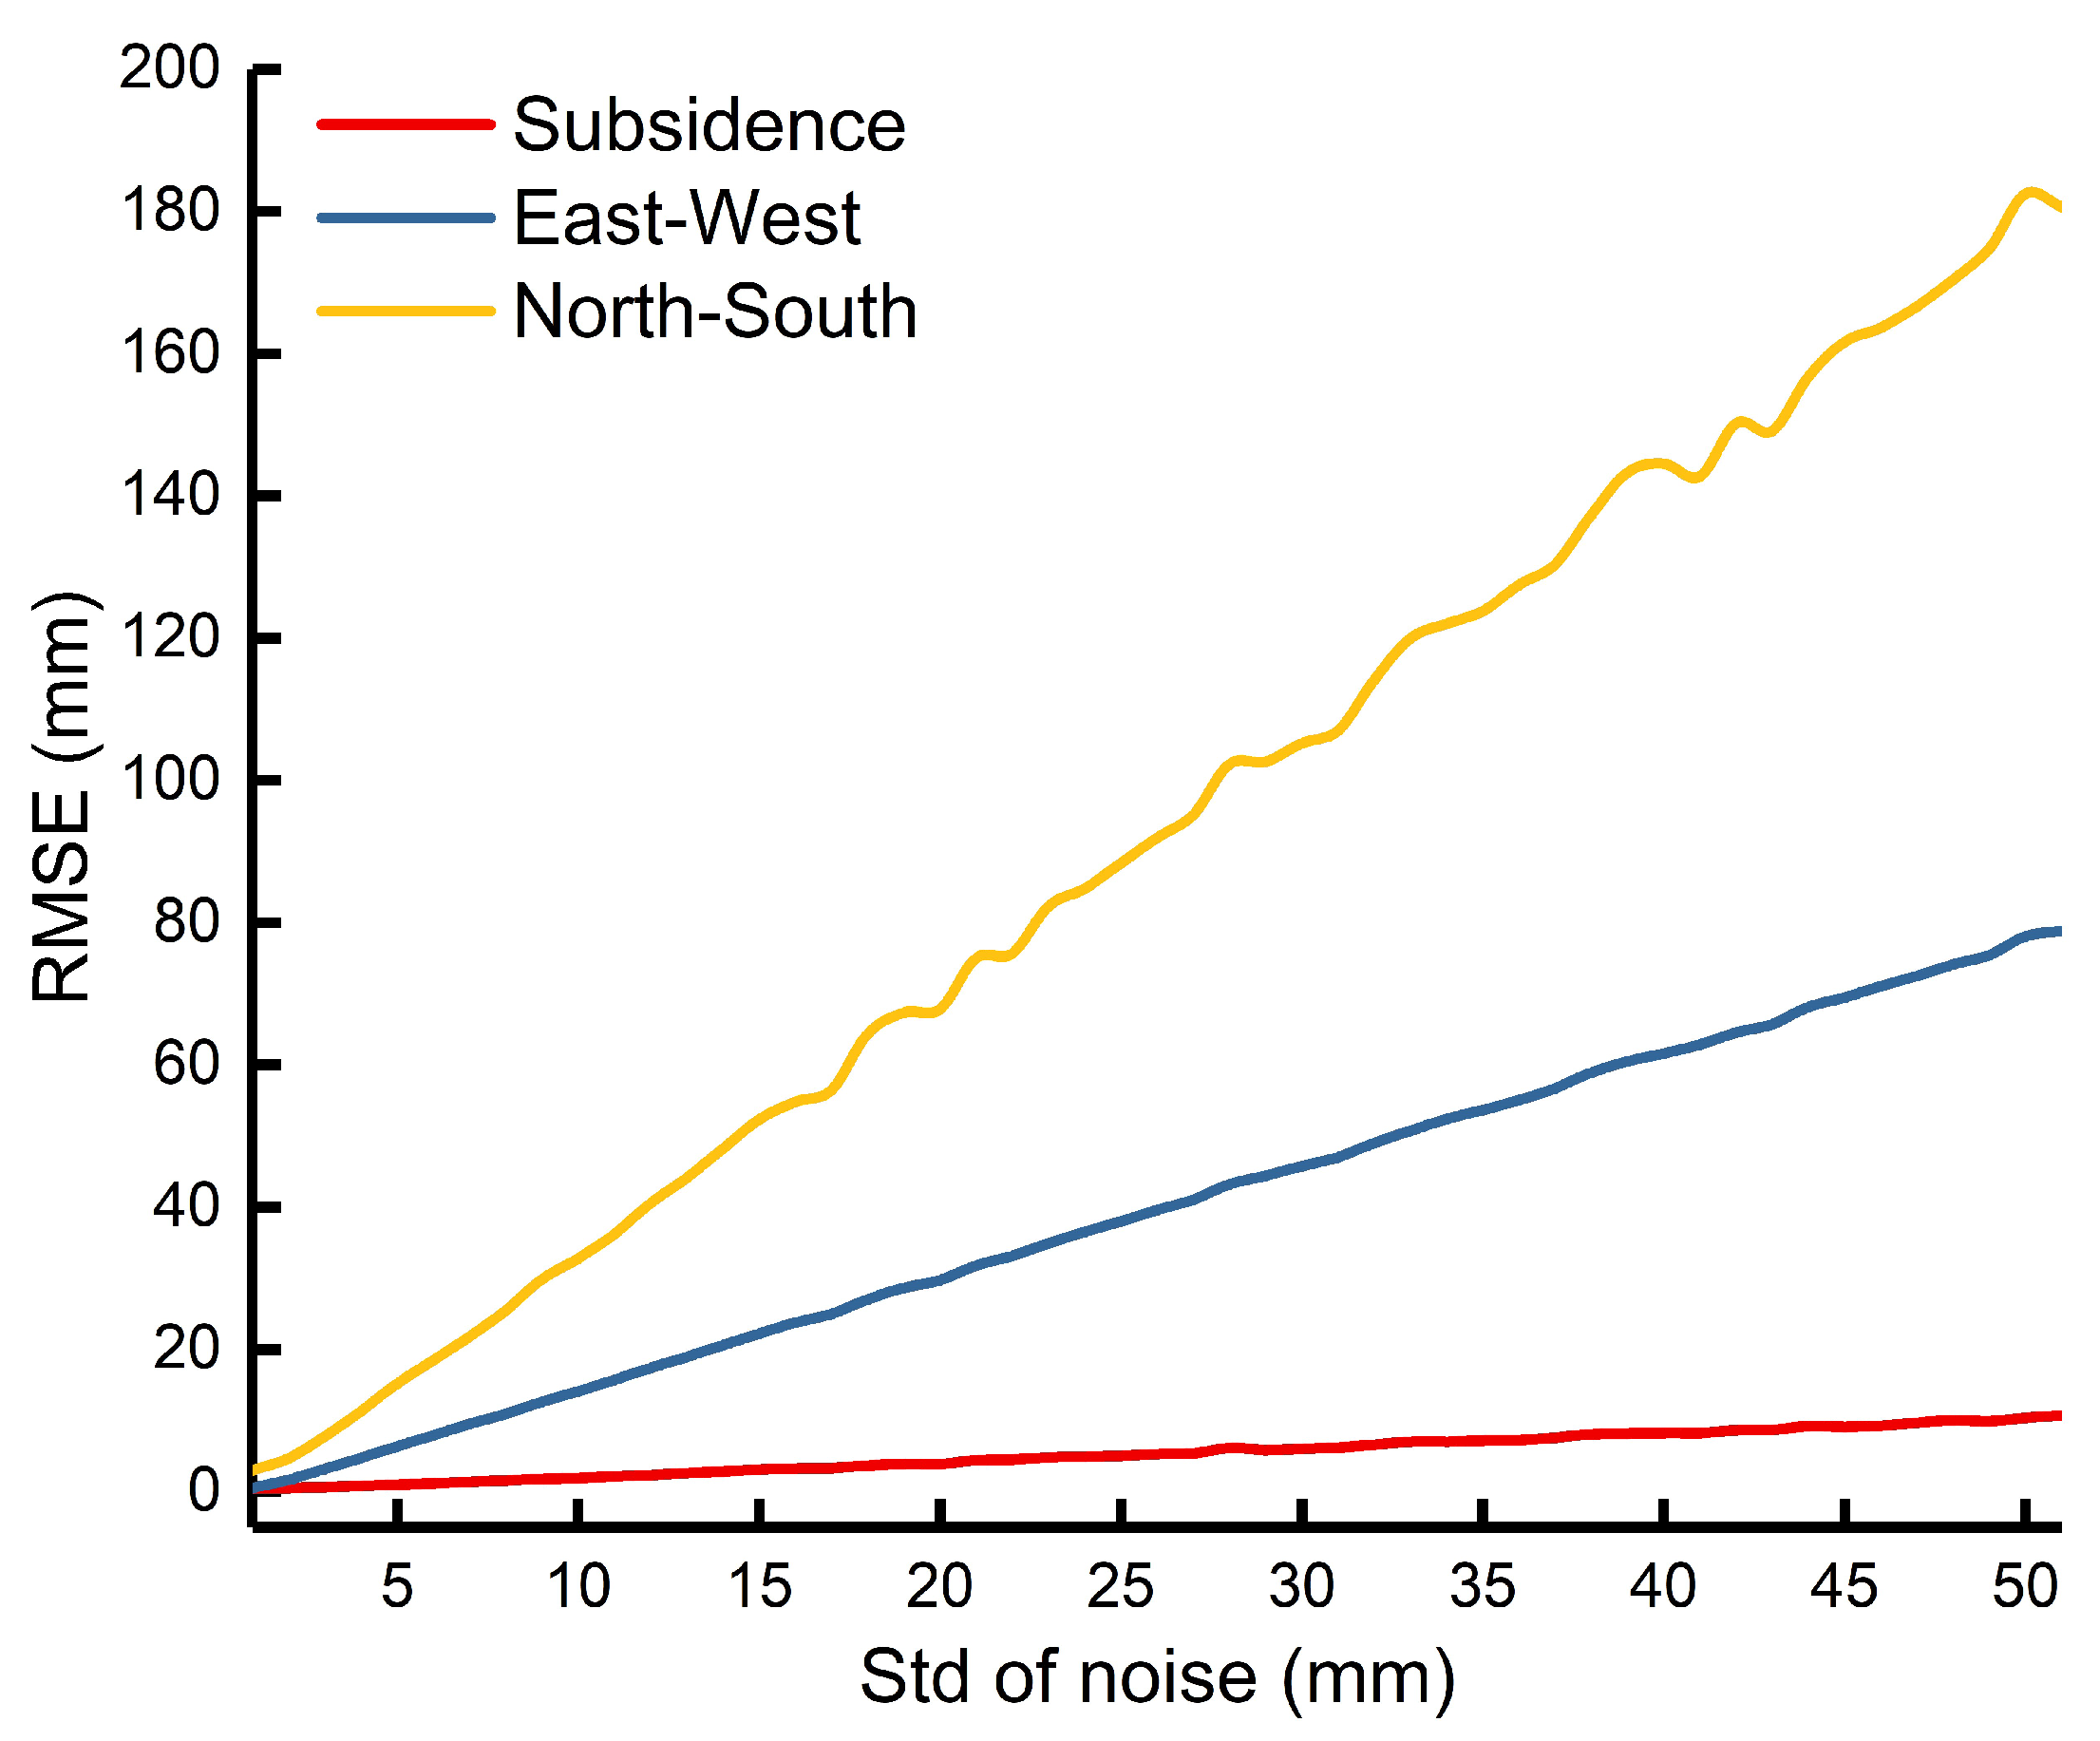
In order to analyze the effect of noise on the estimated 3D displacements, we statistically analyzed the RMSEs of the 3D displacements obtained from 51 sets of simulation LOS deformation maps through RSIP-based method; the results are shown in Figure 9. From Figure 9, we can see that the accuracy of the 3D displacements linearly decreases with the increase in noise, but the velocity of decrease is different. The accuracy of subsidence decreases slowly with the increase in noise, and a reliable result can be obtained even at a higher noise level (e.g., Std = 50 mm, RMSE = 10.67 mm), while the accuracy of the north–south horizontal movement decreases drastically with the increase in noise (e.g., Std = 50 mm, RMSE = 180.6 mm). The basic reason for the difference in the accuracy of the 3D displacements is the near-polar orbit configuration of the SAR satellite platform, so that the coefficient a1 > a2 > a3 in (2) always holds. Therefore, LOS deformation has the highest sensitivity to subsidence and the lowest sensitivity to north–south horizontal movement; that is, the signal-to-noise ratio of subsidence is the highest, and the signal-to-noise ratio of north–south horizontal movement is the lowest. Meanwhile, under the same noise level, when the accuracy of estimated subsidence is high, it does not mean that the obtained horizontal movement accuracy is also high, as shown in Figure 9.

3.2. Real Experiment

3.2.1. Study Area and Datasets

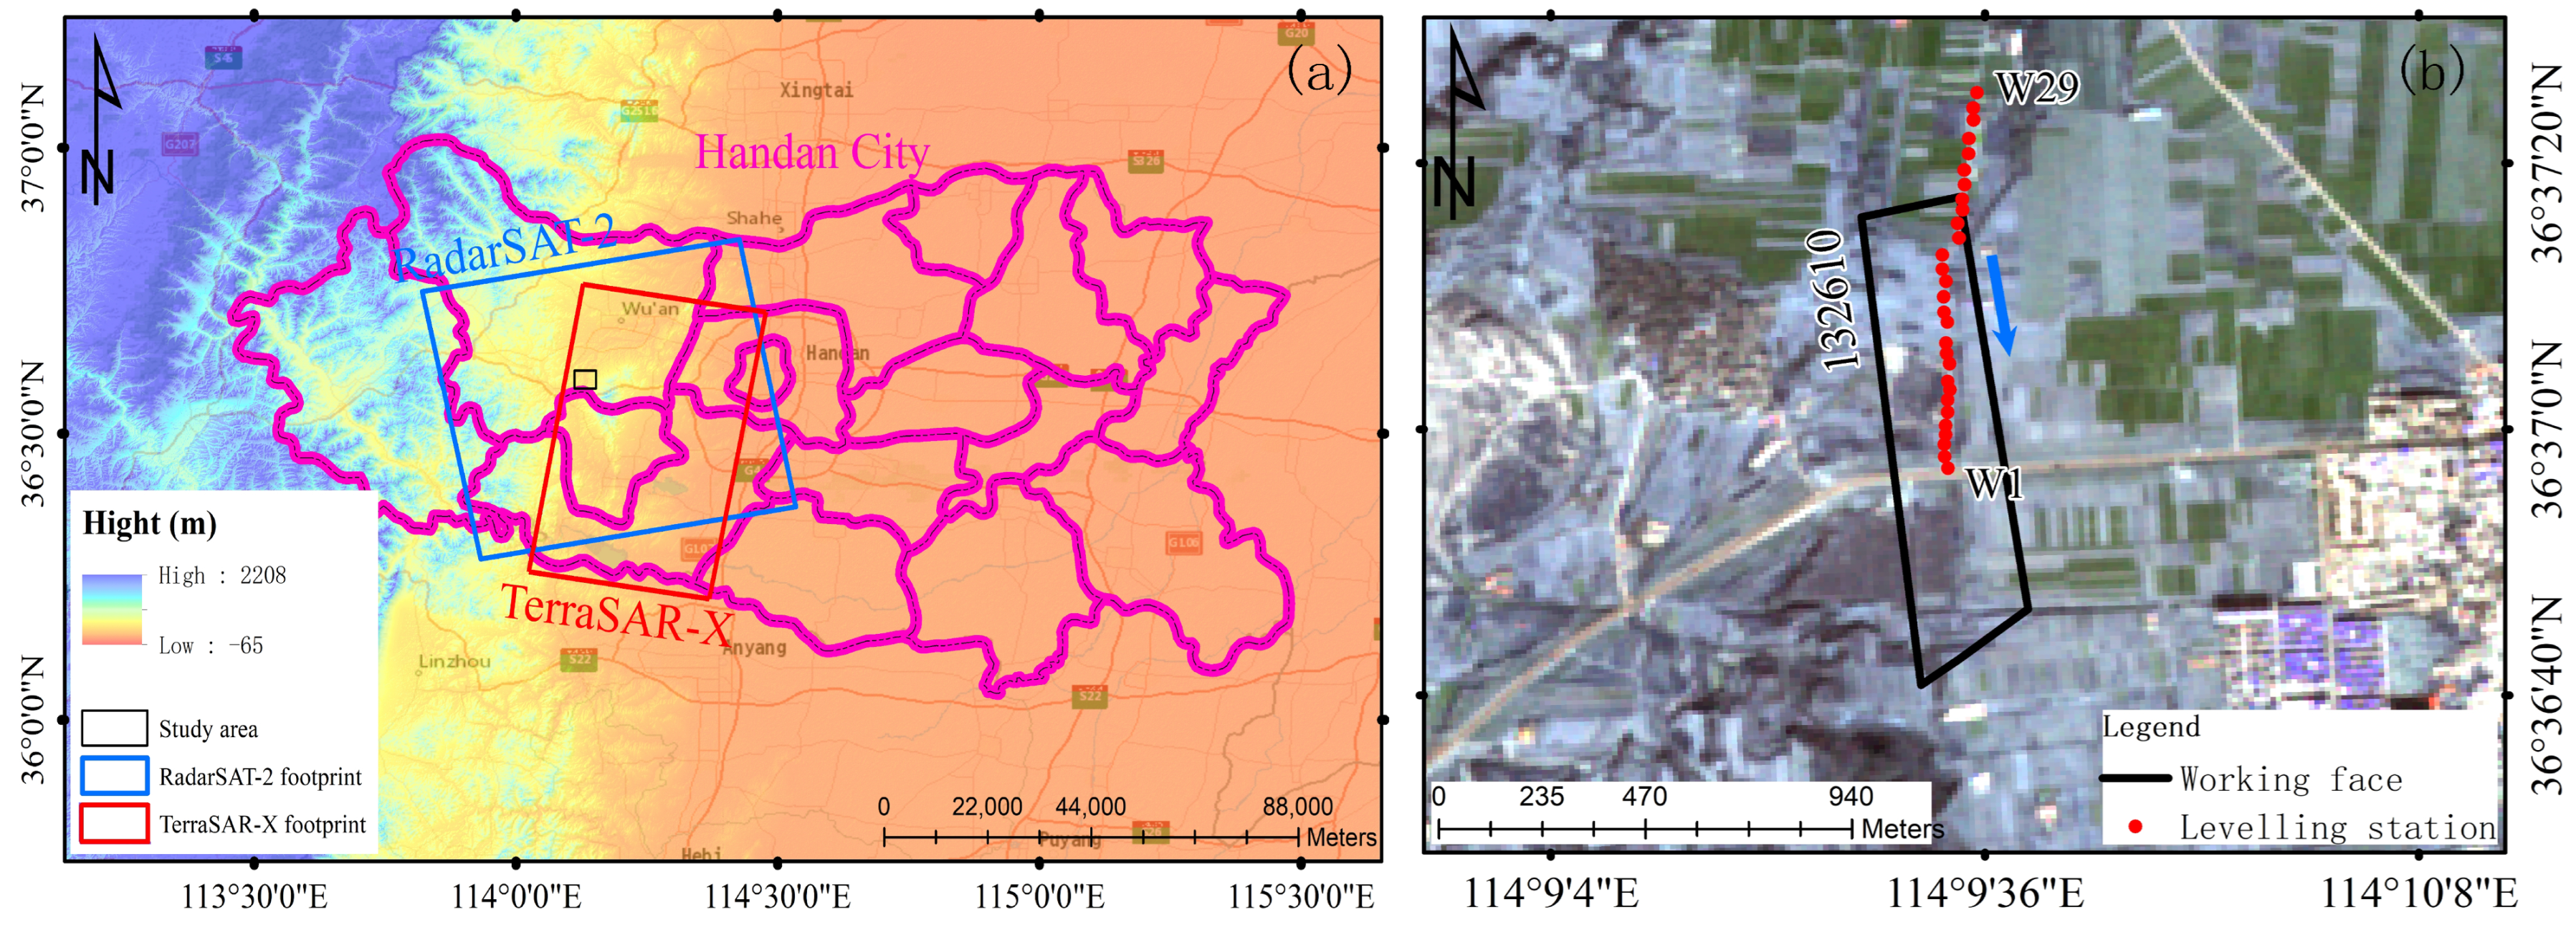
The 132,610 working face of the Fengfeng mining area in the Hebei province, China, was chosen to test the RSIP-based method (outlined by the black rectangle in Figure 10a). The length and width of the 132,610 working face are 1025 m and 198 m, respectively, the mining thickness is 4.5 m, the dip angle is 31 (tilt to the east), the average mining depth H is 794 m; the geographical overview is shown in Figure 10. The 3D displacements of the 132,610 working face are estimated from the three ascending RadarSAT-2 images acquired from 24 December 2015 to 5 March 2016, and the six descending TerraSAR-X images acquired from 19 December 2015 to 12 February 2016 by the RSIP-based method combined with the proposed solution strategy, respectively, in order to illustrate that the proposed solution strategy is valid for the ascending and descending SAR data. The footprint of these SAR images is marked by the solid blue and red rectangle in Figure 10a. The basic parameters of these SAR images are shown in Table 1.

3.2.2. Data Processing

The RadarSAT-2 and TerraSAR-X images are processed through the GAMMA software v1.2 package based on the standard two-pass DInSAR approach [32]. To suppress the decorrelation noise, we combine interferometric pairs according to the minimum temporal baseline principle (for information om interferometric pairs, see Appendix D, Table A1). The 1 arc-second Shuttle Radar Topography Mission (SRTM) DEMs are employed to remove the topographic phases. After adopting adaptive spatial filtering to suppress noise, the minimum cost flow algorithm is applied to unwrap the differential interferograms [33]. A biquadratic polynomial model is applied to remove the influence of orbit error. Finally, the DInSAR results are accumulated to obtain the LOS deformation of the entire monitoring period.
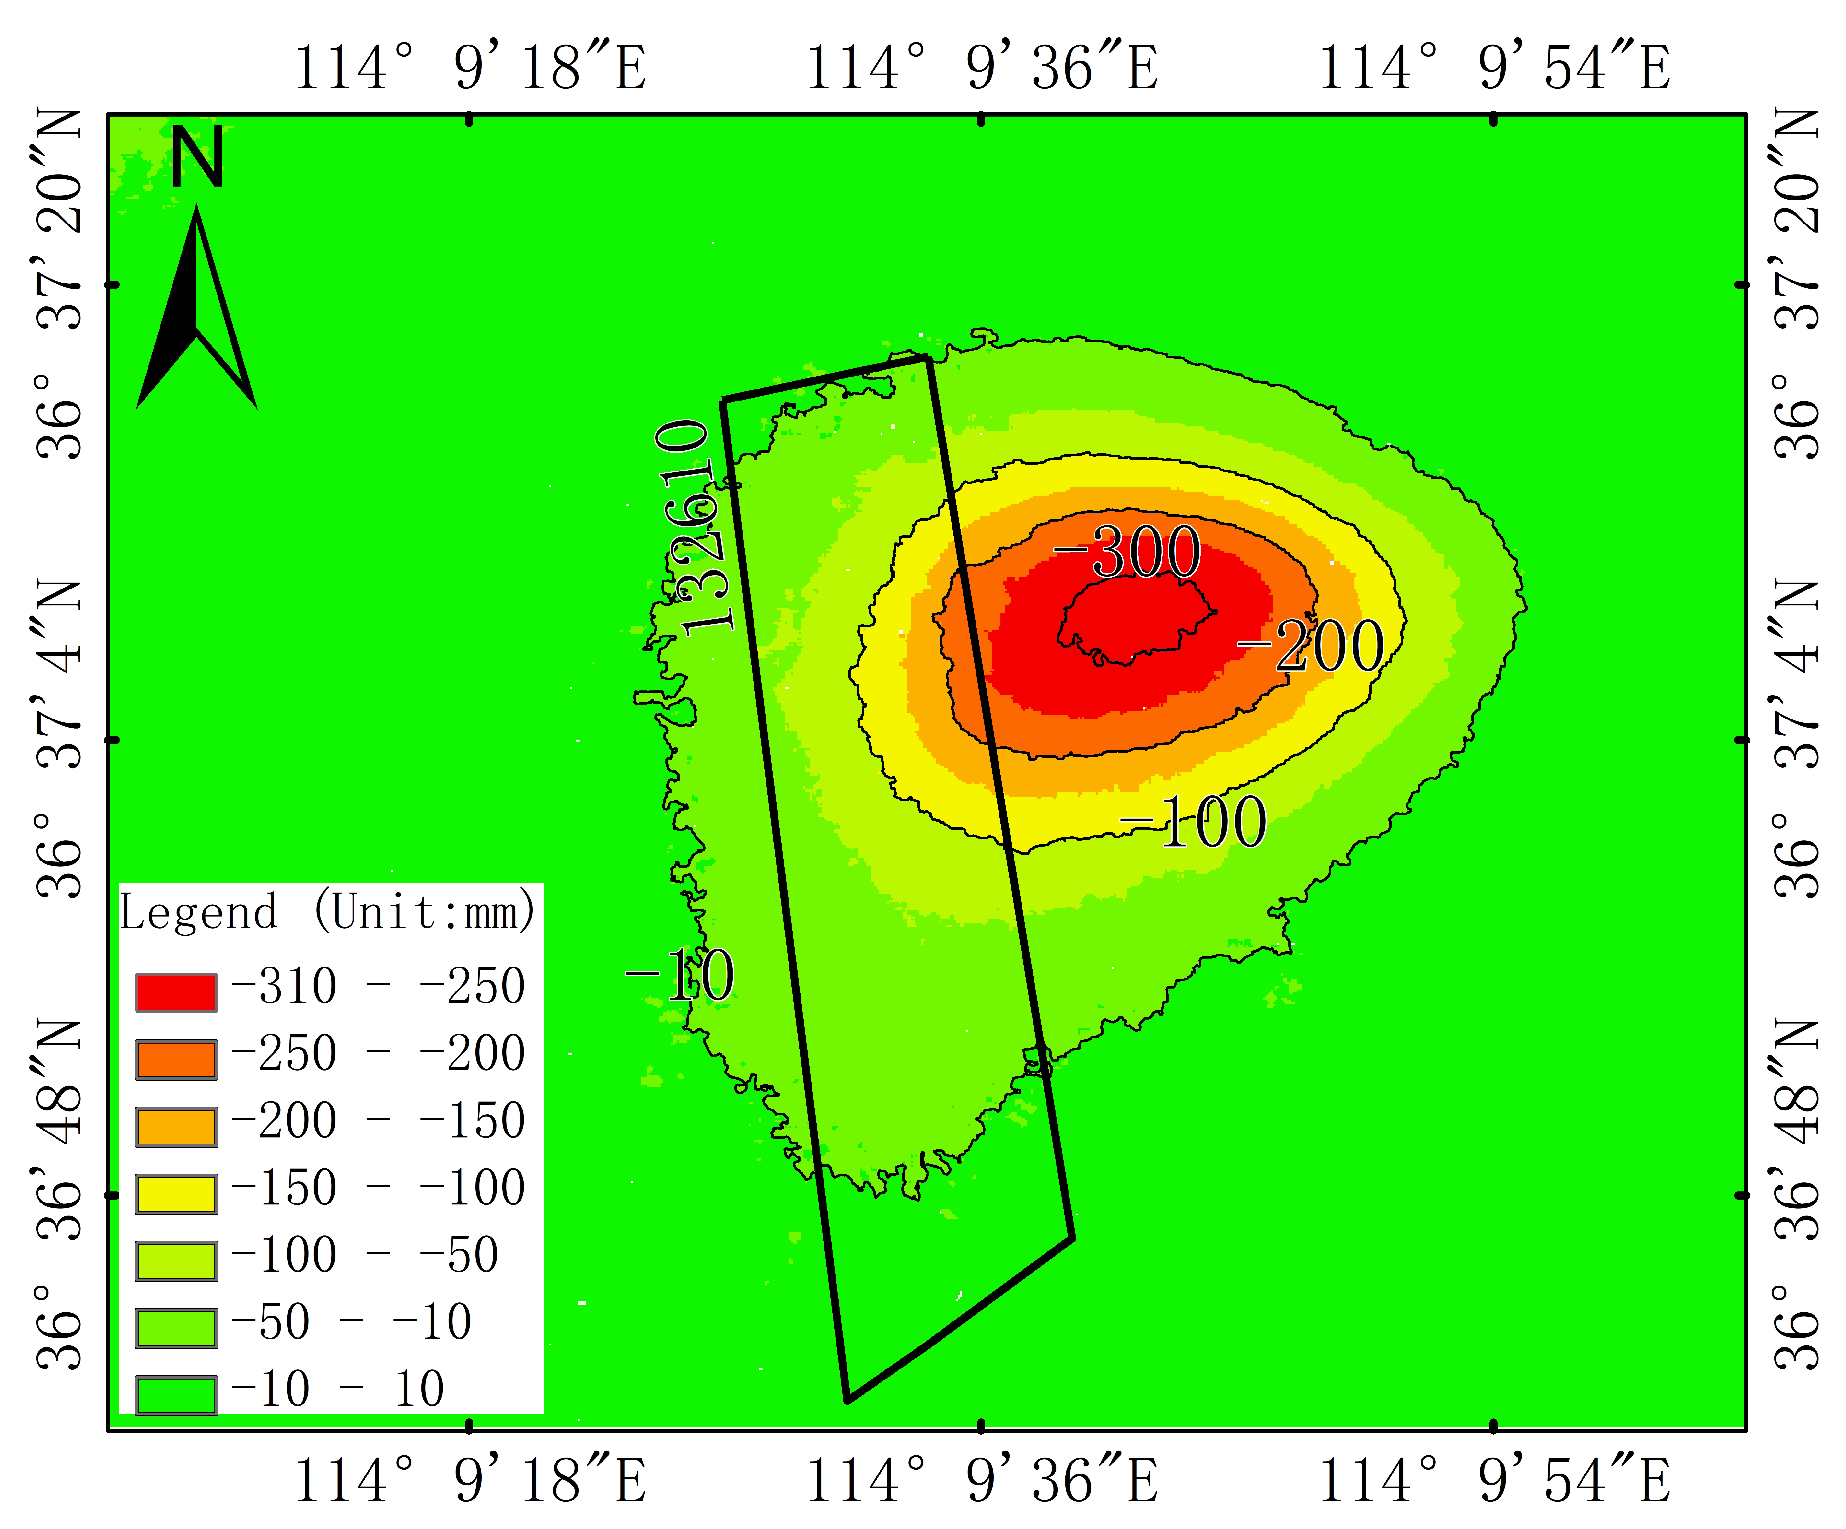
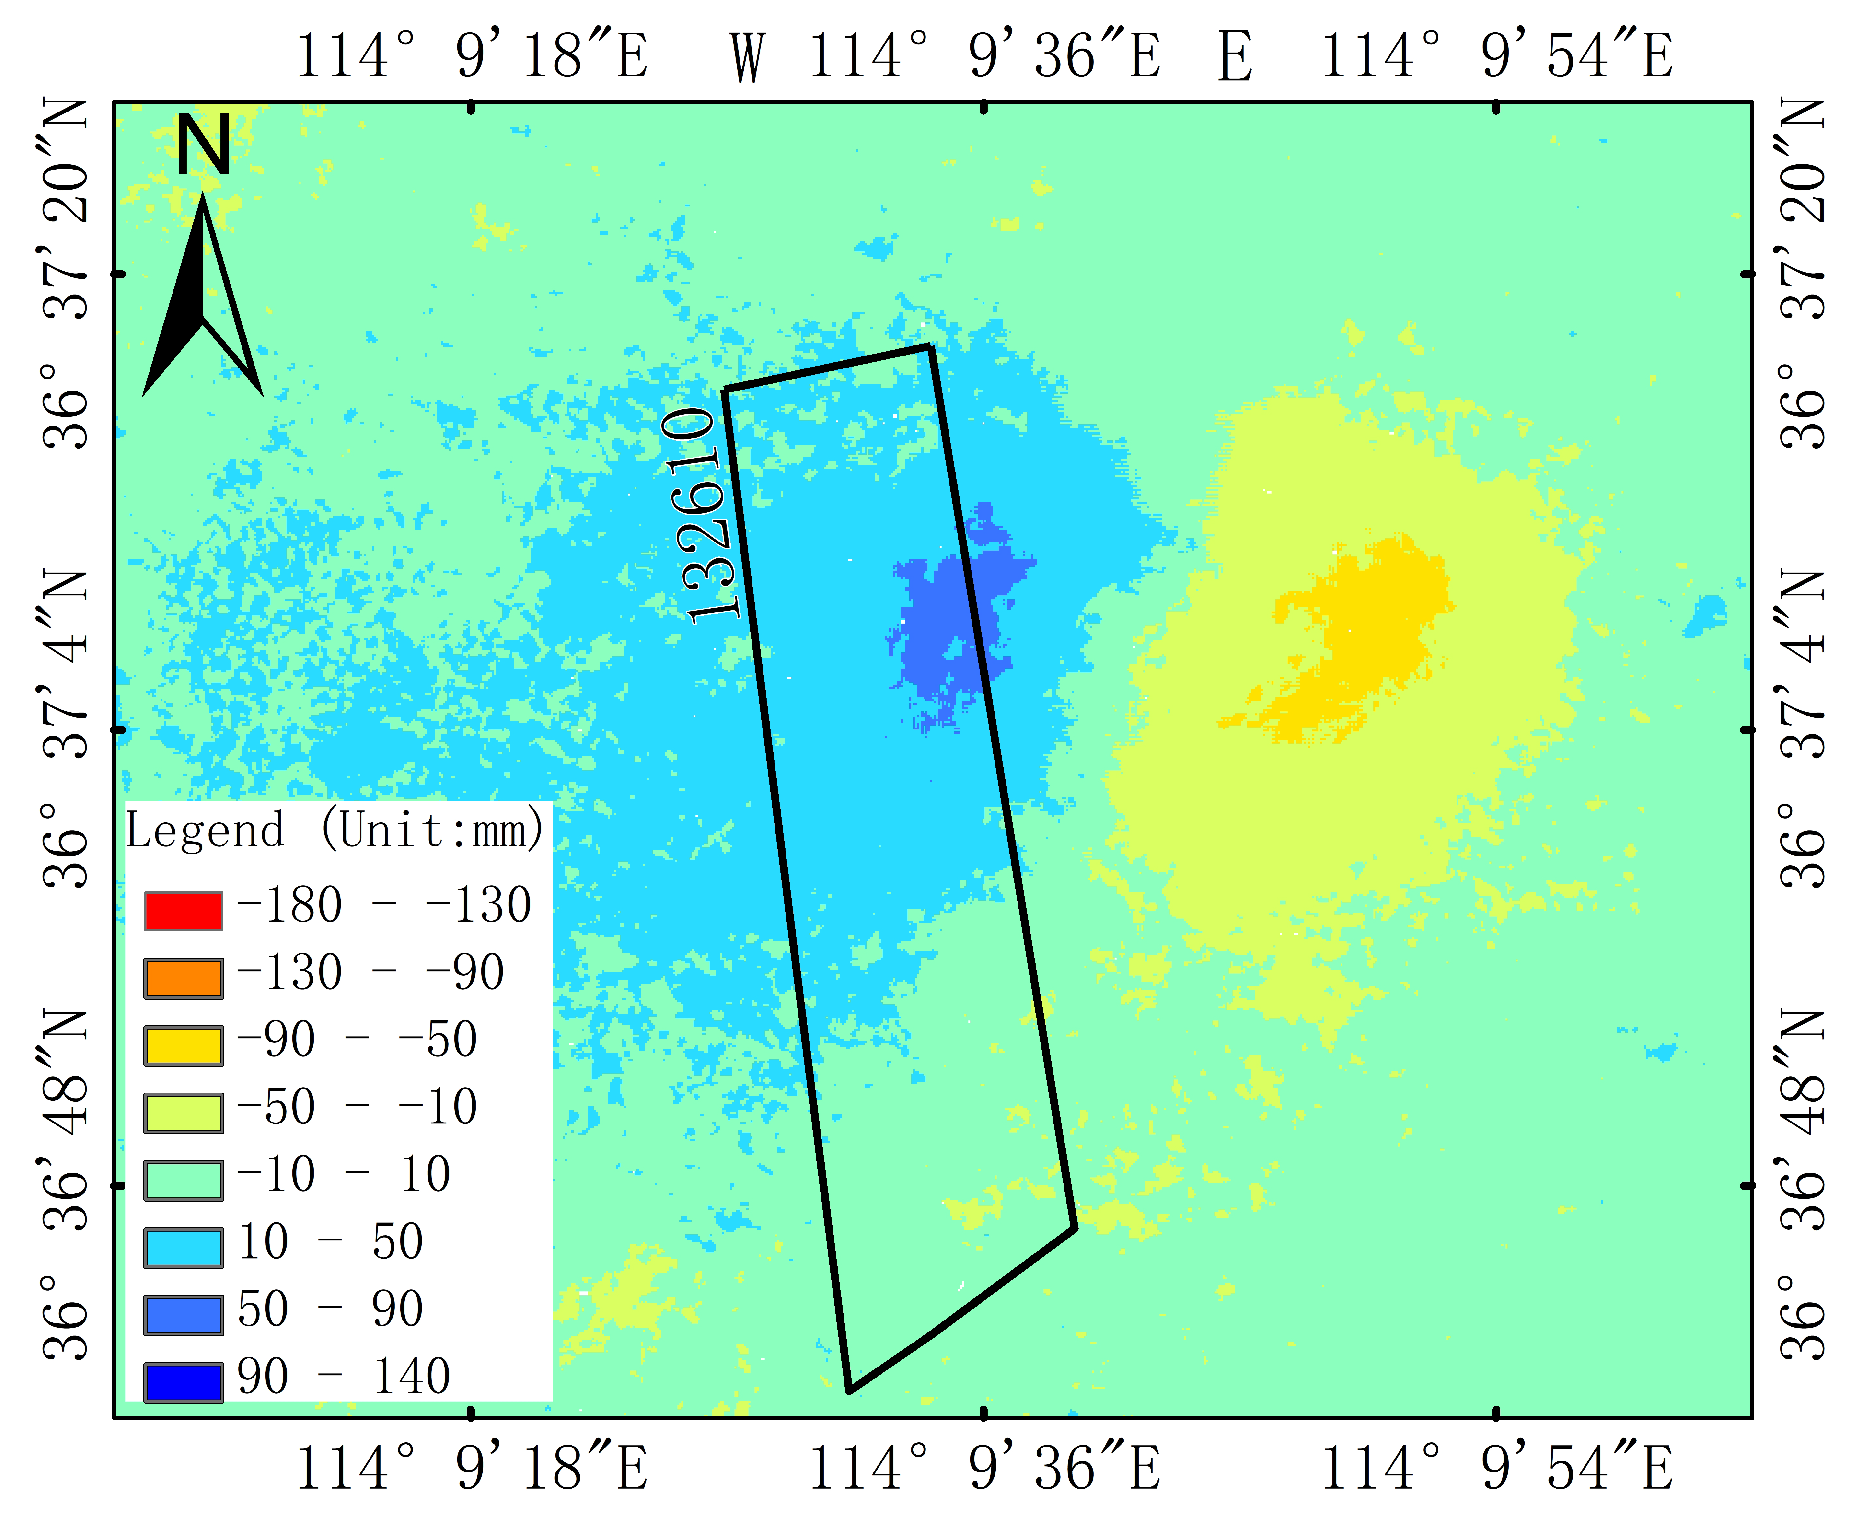
To obtain the 3D displacement fields based on the backward iterative method, it is necessary to ensure the continuity of LOS deformation. Therefore, the inverse distance weighting (IDW) method is used to interpolate the loss of LOS deformation caused by decoherence. In addition, interpolation is not a necessary step, and if the continuity of LOS deformation in the study area is good, interpolation can be abandoned. The pixel size of the LOS deformation map of two results after interpolation is 2.14 m. The geocoded cumulative LOS deformation maps of the RadarSAT-2 and TerraSAR-X data are shown in Figure 11. The magnitude and scope of LOS deformation obtained by TerraSAR-X data are smaller, because the monitoring period of TerraSAR-X data are about half a month shorter than that of the RadarSAT-2 data.

3.2.3. Estimating 3D Displacement Fields

Before using the RSIP-based method to obtain the 3D displacement fields, the parameters heading angle α , incidence angle θ , pixel resolution R, horizontal displacement coefficient b, mining depth H and main influence angle tangent tan β need to be determined. Due to the small scope of subsidence basin, the difference in incident angle is not considered. The α and θ of the two types of images are shown in Table 1. R is the pixel size of the LOS deformation map after IDW interpolation (east–west and north–south directions are 2.14 m). The b and tan β of the 132,610 working face are 0.2 and 2, respectively, according to the report of geological mining conditions of 132,610 working face [34]. H is 794 m. Since the SIP-based method is invalid for the descending SAR data, in order to compare with the RSIP-based method, we only used the SIP-based method to obtain the 3D displacement fields of the 132,610 working face from the ascending RadarSAT-2 images; the results are shown in Figure 12.
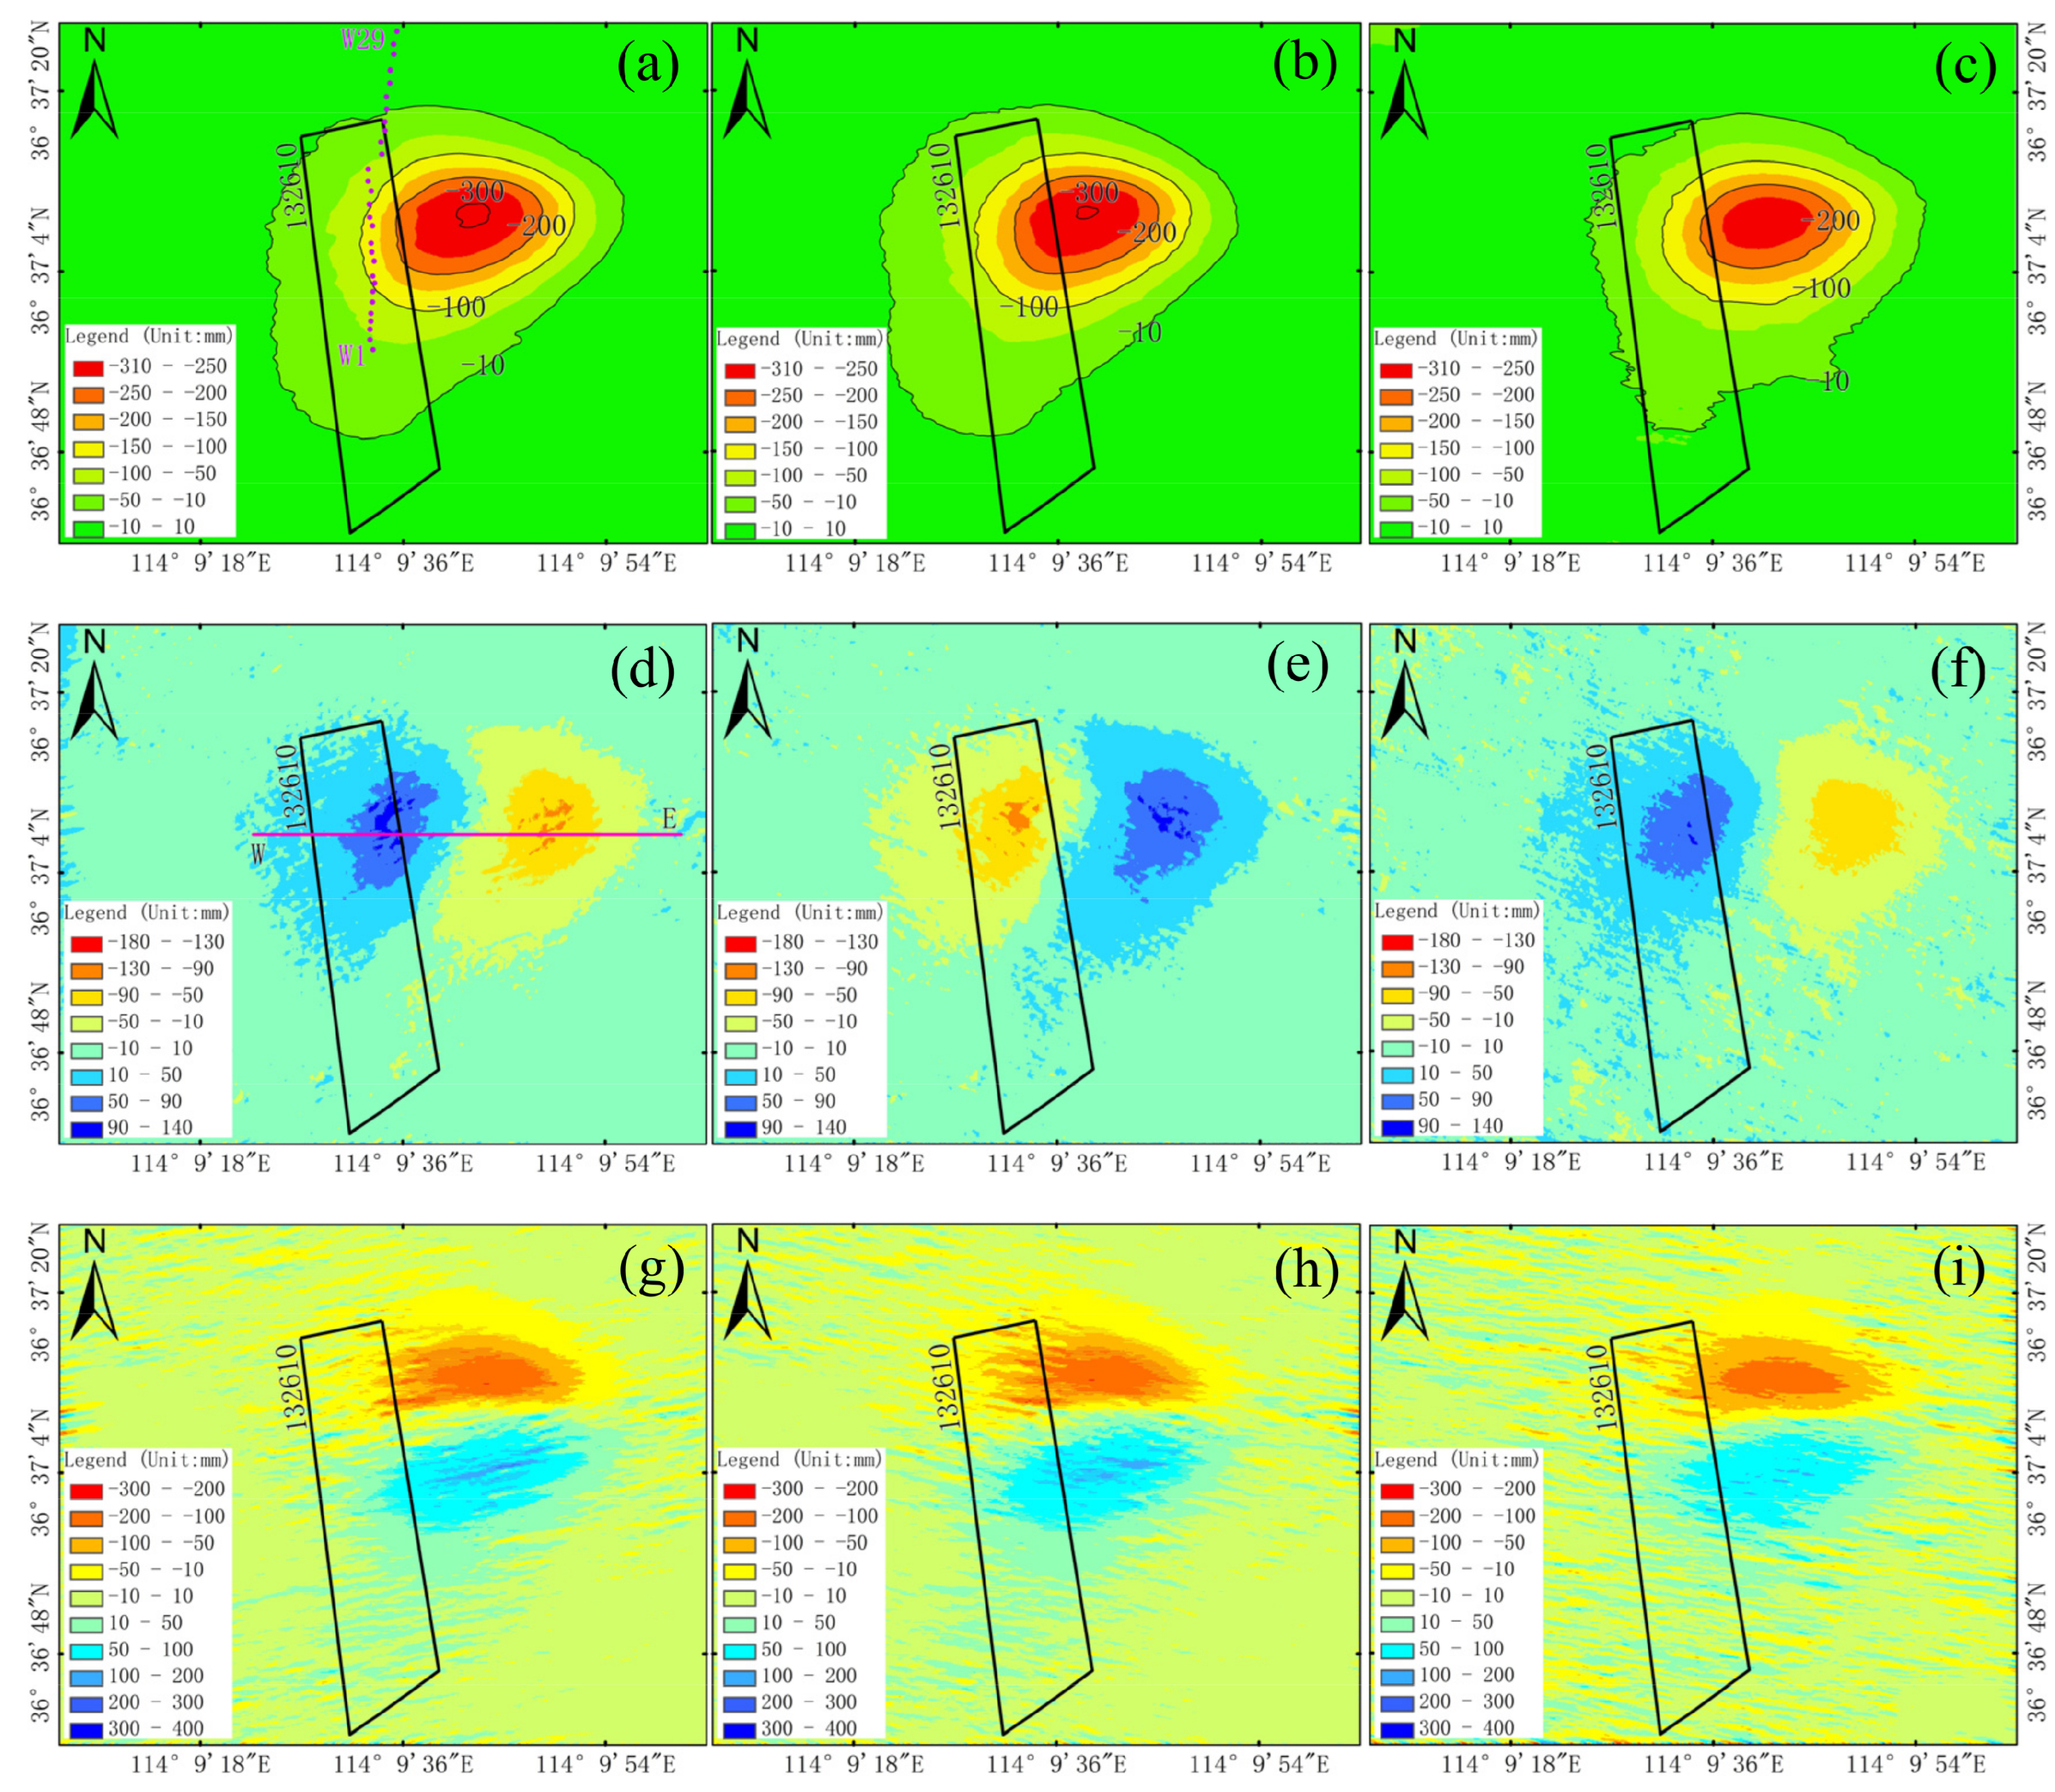
From Figure 12a,c,d,f,g,i, we can see that the 3D displacement fields can be better estimated from the ascending RadarSAT-2 and descending TerraSAR-X images by RSIP-based method combined with the proposed solution strategy. The estimated 3D displacement fields based on the two kinds of images are very similar; however, because the monitoring period of the TerraSAR-X data are about half a month shorter than that of the RadarSAT-2 data, the magnitude and scope of the 3D displacement fields based on TerraSAR-X data are smaller than that based on RadarSAT-2 data. The 3D displacements obtained from the ascending RadarSAT-2 images by the SIP-based method (Figure 12b,e,h) is obviously “offset” to the west compared to the results obtained by the RSIP-based method (Figure 12a,d,g). And, the direction of east–west horizontal movement obtained by the SIP-based method is opposite to that of the ISIP-based method (Figure 12d,e). It can be seen from Figure 12d,f,g,i that the horizontal movement obtained from the TerraSAR-X data is noisier than that of RadarSAT-2 data, because the wavelength of the TerraSAR-X data is shorter than that of the RadarSAT-2 data.

3.2.4. Accuracy Evaluation

To verify the accuracy of the RSIP-based method, the subsidence estimated from the RadarSAT-2 data were compared with leveling data of 29 observation points. The location of the observation points is shown in Figure 12a. The field surveys are conducted on 19 December 2015 to 3 March 2016, and there is a time difference of 3 days compared with the acquisition time of the RadarSAT-2 images. The subsidence obtained from the TerraSAR-X data has not been evaluated, because the acquisition time of the TerraSAR-X data are about half a month shorter than that of leveling data. Since there is no field measurement of horizontal movement in the study area, we cannot quantitatively evaluate the accuracy of horizontal movement. However, to verify the effectiveness of the horizontal movement obtained by the RSIP-based method, we used the multidimensional small baseline subset (MSBAS) methodology proposed by Samsonov [35] to obtain the subsidence and east–west horizontal movement from 19 December 2015 to 5 March 2016. MSBAS methodology has been well applied in two-dimensional deformation monitoring in mining areas [6,36]. In order to obtain 3D deformation based on the multi-track SAR data and MSBAS methodology, the unwrapping phase of different SAR sources needs to be uniformly geocoded into same coordinate system (such as WGS84), then the results of different SAR data sources are sampled onto the same grid using bilinear interpolation method. The information of interferometric pairs used in MSBAS methodology and the results of subsidence and east–west horizontal movement obtained by MSBAS methodology are shown in Appendix D. The comparison results are shown in Figure 13.
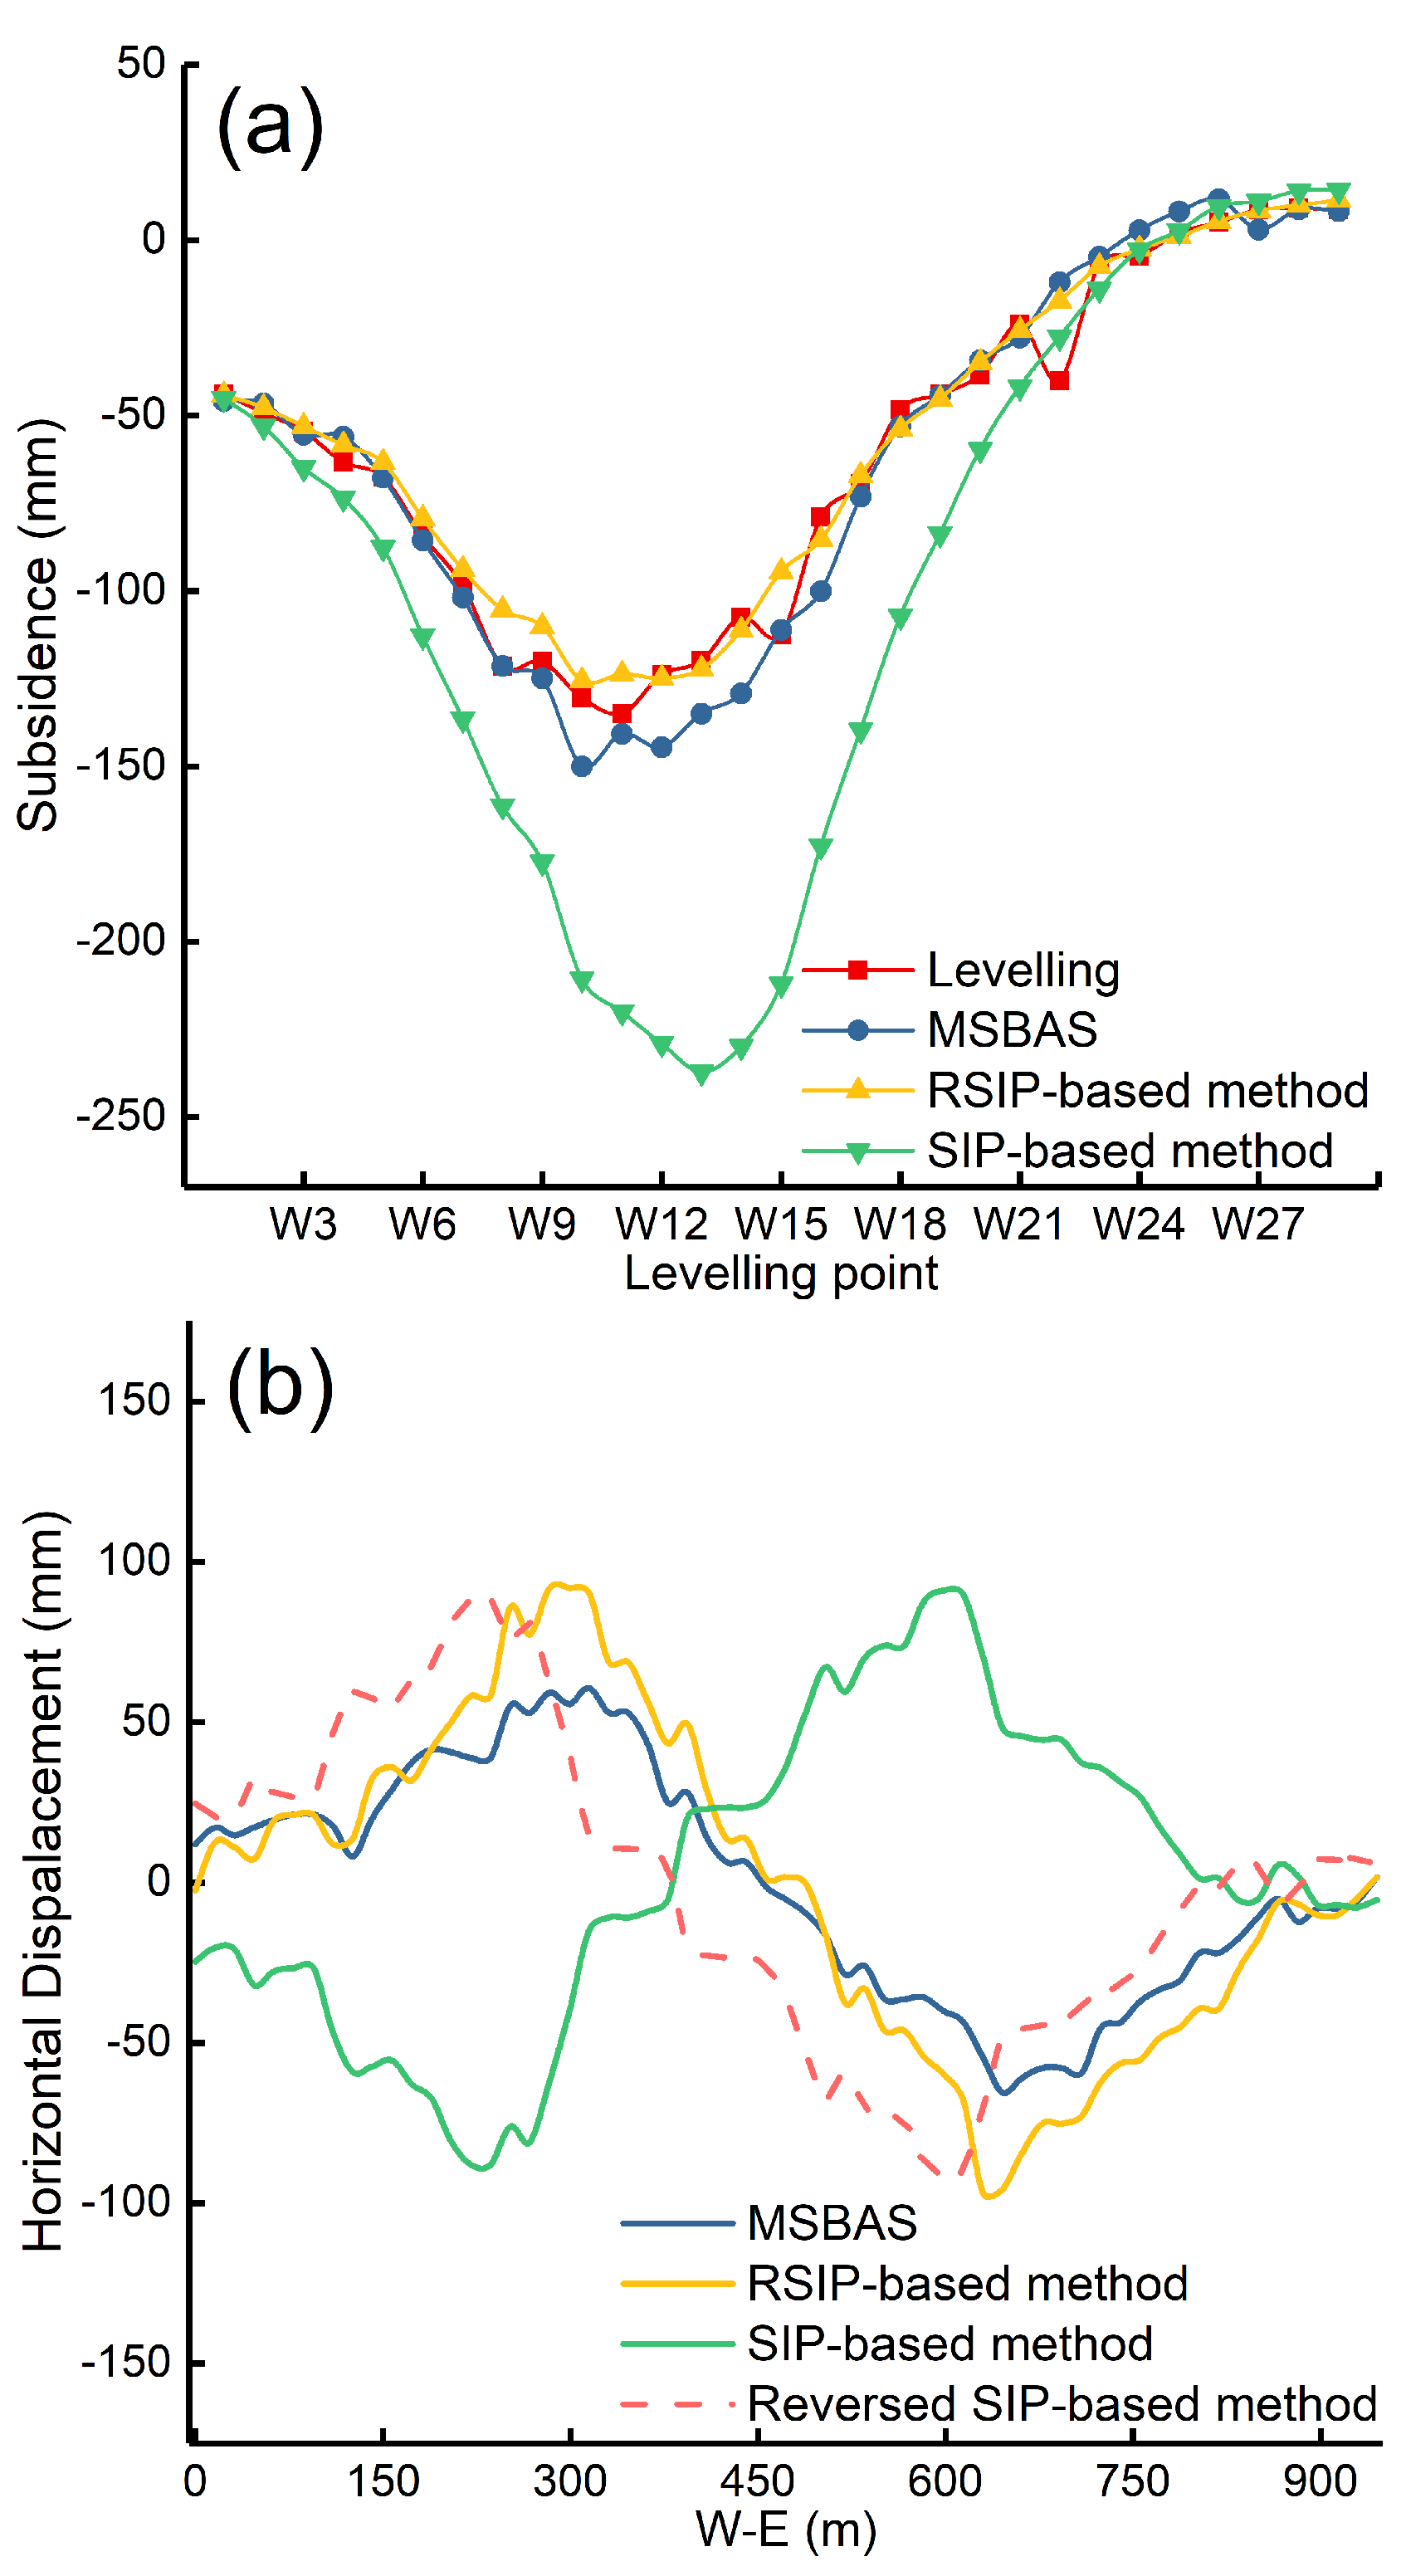
From Figure 13a, it can be seen that the subsidence is obtained by the SIP-based method without considering the directionality of the horizontal movement, resulting in a large difference from the leveling data. The RMSE of the subsidence obtained by the SIP-based method is 56.0 mm. The subsidence obtained by the RSIP-based method and the MSBAS methodology is consistent with the leveling data. The RMSE of the subsidence obtained by the RSIP-based method is 7.3 mm, and the RMSE of the subsidence obtained by the MSBAS methodology is 10.3 mm. The accuracy of the subsidence obtained by the RSIP-based method and the MSBAS methodology is similar and higher. Compared with the SIP-based method, the accuracy of the subsidence obtained by the RSIP-based method is increased by 86.96%.
The high accuracy of the subsidence obtained by the RSIP-based method does not mean that the high accuracy of horizontal movement (Figure 9). Therefore, with the help of the horizontal movement obtained by the MSBAS methodology, we evaluate the effectiveness of the horizontal movement obtained by the RSIP-based method; the profile’s position is shown in Figure 12d. From Figure 13b, we can see that the east–west horizontal movement obtained by the SIP-based method is obviously shifted to the west, and the magnitude and trend of the east–west horizontal movement obtained by the SIP-based method and MSBAS methodology are different. Although the east–west horizontal movement obtained by the RSIP-based method is slightly larger than that of the MSBAS methodology, the east–west horizontal movement obtained by the RSIP-based method and the MSBAS methodology is in good agreement. The comparison with the east–west horizontal movement obtained by the MSBAS methodology illustrates the effectiveness of the horizontal movement obtained by the RSIP-based method.

4. Discussion

4.1. Applicable Condition of the Proposed Strategy

From Section 2, we know that the coefficients C1, C2, C3 play a decisive role in the stability of the RSIP/SIP-based method. When |C2/C1| + |C3/C1| > 1, the estimated solution of the RSIP/SIP-based method will diverge. The values of coefficients C1, C2, C3 are related to the heading angle α , the incident angle θ , the resolution R, the horizontal displacement coefficient b, the mining depth H, and the tangent of the main influence angle tan β (see (4), (9)). Therefore, we will discuss the applicable conditions of the proposed four strategies when six parameters change according to the principle of |C2/C1| + |C3/C1| < 1.
The value ranges of the six parameters are shown in Table 2. The heading angle of the space-based SAR data are mostly 340–360 or 180–200 because of the near-polar orbit configuration of the space-borne SAR satellites, but considering the ground-borne and air-borne SAR data, the α value range is set to 1–360 . The θ value range is set to 1–90 . The R value range is set to 1–20 m (reference TerraSAR-X Spotlight mode: 1 m, and Sentinel-1A/B Interferometric Wide (IW) swath mode: 20 m). The value ranges of b and tan β are 0.1–0.4 and 1.2–2.6 according to general geological mining conditions in China [1]. The value range of H is 100–1200 m, because the mining depth can reach 1000 m in eastern China [37]. The control variable method is used to analyze the relationship between six parameters and coefficients C1, C2, and C3; the fixed value of each parameter is shown in Table 2.

4.1.1. Relationship between α and |C2/C1| + |C3/C1|

Figure 14 shows the relationship between α and |C2/C1| + |C3/C1| corresponding to the four solution strategies. It can be seen from Figure 14a that in the case of individual heading angles, |C2/C1| + |C3/C1| is abnormally large, with the maximum being 2265.68, which results in the change in |C2/C1| + |C3/C1| with a heading angle that is not obvious in Figure 14a. The value of |C2/C1| + |C3/C1| corresponding to most heading angles is concentrated below 10. In order to clearly show the relationship between the α and |C2/C1| + |C3/C1|, the heading angles that make the four strategies meet |C2/C1| + |C3/C1| < 1 are redrawn in Figure 14b.
From Figure 14b, we can see that the heading angle that makes the four strategies satisfy |C2/C1| + |C3/C1| < 1 corresponds to a quarter circle. That is, when other parameters are determined (as shown in Table 2), each solution strategy is only valid for the heading angle within a certain range. And, the effective heading angles of the four strategies have a small intersection; for example, heading angles (91 , 92 ) make strategies I and II satisfy |C2/C1| + |C3/C1| < 1 at the same time. However, the corresponding |C2/C1| + |C3/C1| of strategy I is significantly larger than strategy II in this range, because the smaller the |C2/C1| + |C3/C1|, the better the effect of suppressing error propagation and improving the stability of the PSIP/SIP-based method. Therefore, the optimal heading angle for strategy I is 0–90 . Other strategies are similar to strategy I.
The effective heading angles corresponding to the four strategies just complement each other, and the sum is equal to 360 . Therefore, the RSIP-based method combined with four solution strategies can employ SAR images with any heading angle to retrieve the 3D displacements of the mining area.

4.1.2. Relationship between θ , R, b, H, tan β and |C2/C1| + |C3/C1|

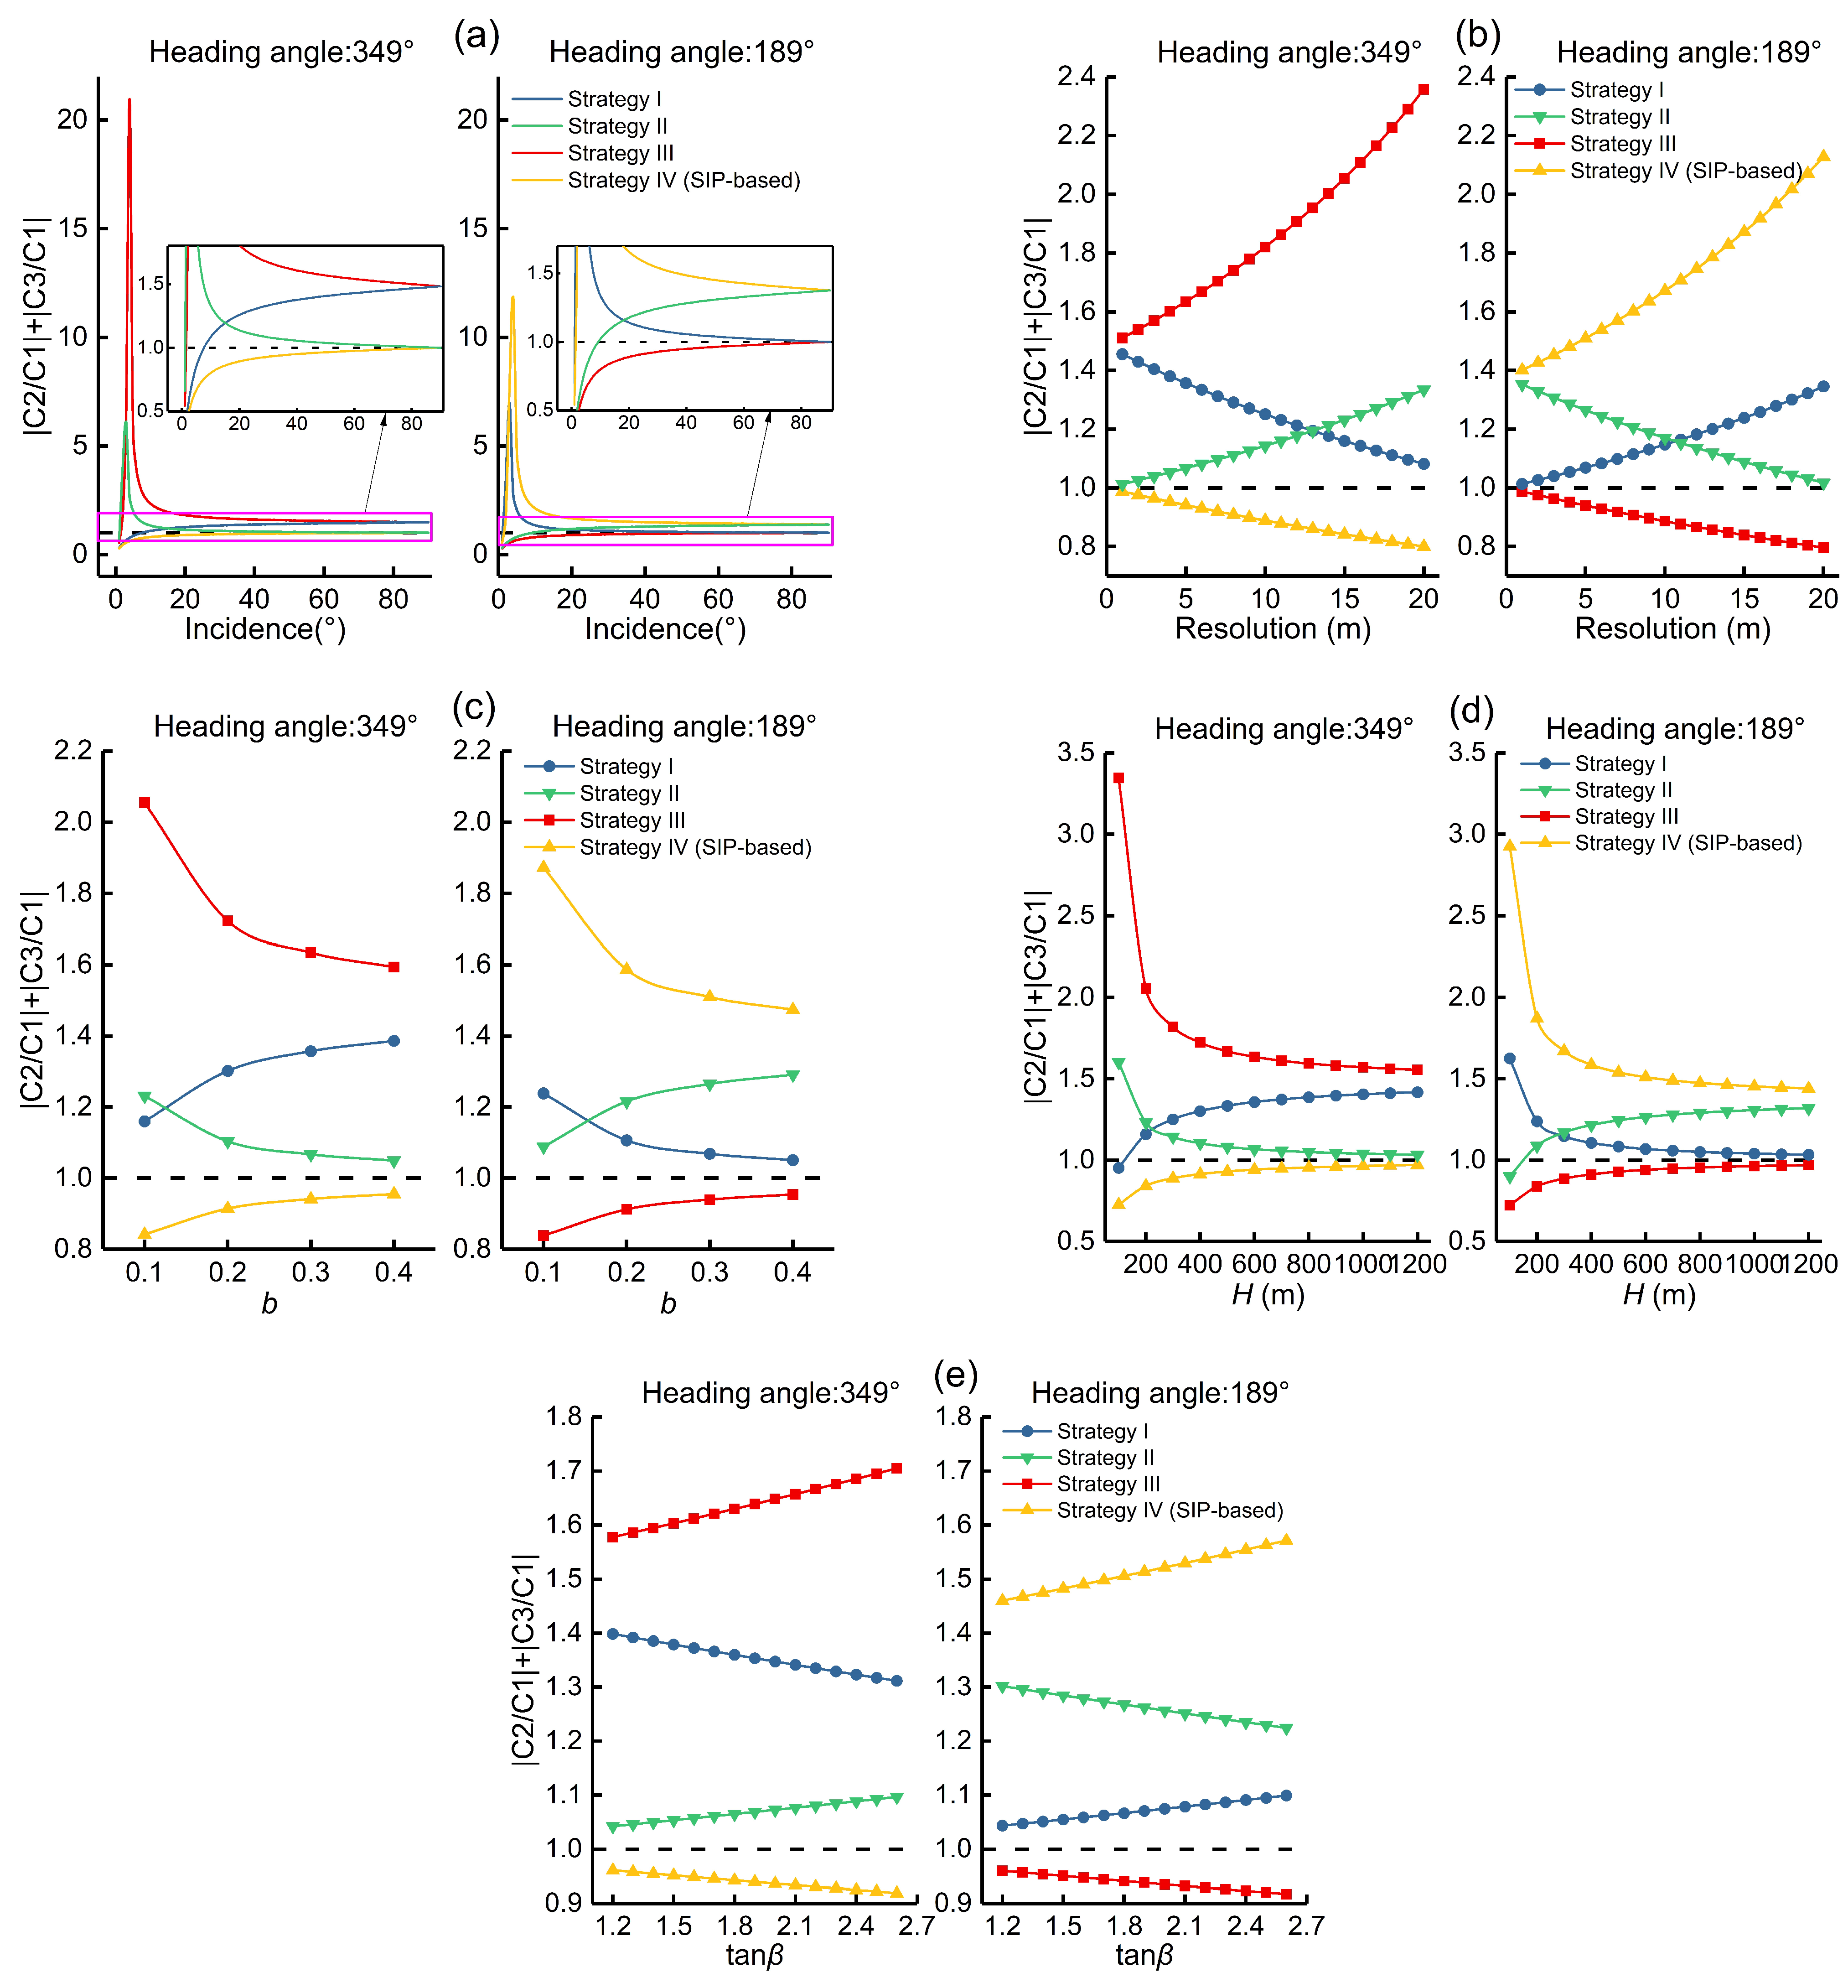
We mainly discuss the relationship between θ , R, b, H, tan β and |C2/C1| + |C3/C1| in the ascending and descending conditions, because the space-borne SAR images only have ascending and descending modes; the results are shown in Figure 15.
From Figure 15, we can see that the change trends of |C2/C1| + |C3/C1| corresponding to strategy I and strategy IV with θ , R, b, H, and tan β being the same; the situation of strategy II and strategy III is similar to strategy I and strategy IV. In addition, the change trends of |C2/C1| + |C3/C1| with θ , R, b, H, and tan β are the same for strategy I and IV at the 349 heading angle (ascending) and strategy II and III at the 189 heading angle (descending).
From Figure 15a, when the heading angle is 349 (ascending), the four solution strategies are all applicable when θ is smaller than 3 ; however, this situation is impossible in practice due to the side-look imaging mode of the space-borne SAR image. For strategies II and III, when θ is 3 and 4 , |C2/C1| + |C3/C1| has a maximum value, and then decreases with the increase in θ , but is always greater than 1 (Figure 15a, ascending). Moreover, strategy I satisfies |C2/C1| + |C3/C1| < 1 when θ is less than 7 , but |C2/C1| + |C3/C1| of strategy IV is significantly smaller than strategy I when θ is less than 7 , so the stability of the solution by strategy IV will be better. Strategy IV satisfies |C2/C1| + |C3/C1| < 1 at any θ . It can be seen from Figure 14b that for the ascending SAR data, only strategy IV meets |C2/C1| + |C3/C1| < 1; therefore, within the normal value range of θ (such as 20–60 ), the change in θ does not change the applicable conditions of the four strategies; that is, for the ascending SAR data, only strategy IV is still effective.
It can be seen from Figure 15b that under the ascending condition, |C2/C1| + |C3/C1| of strategy I, decreases with the decrease in R. When R is lower than 20 m, strategy I will meet |C2/C1| + |C3/C1| < 1, but R is too low will limit the application of the method in practice, because the range of the subsidence basin is small, usually 1 km 2 [6,28]. From Figure 15d, we can see that when the heading angle is 349 , strategy I satisfies |C2/C1| + |C3/C1| < 1 when H is less than 100 m, but |C2/C1| + |C3/C1| of strategy IV is significantly smaller than strategy I when H is less than 100 m, so the stability of the solution by strategy IV will be better. The value ranges of b and tan β are selected according to the general geological mining conditions in China [1]. Therefore, it is impossible to change the applicable conditions of the four strategies by changing the values of b and tan β in specific scenarios (Figure 15c,e). For the ascending SAR data, no matter how R, b, H, and tan β change, the applicable conditions of the four strategies are not changed. Only strategy IV satisfies |C2/C1| + |C3/C1| < 1 (Figure 15b–e).
From Figure 15a–e, it can be seen that under the descending condition, similar to the ascending condition, the changes in θ , R, b, H, and tan β have no effect on the application conditions of the four strategies; that is, for the descending SAR data, only strategy III satisfies |C2/C1| + |C3/C1| < 1, and it is consistent with the conclusion obtained from the relationship between α and |C2/C1| + |C3/C1| (Figure 14b).
Therefore, when α is determined, no matter how θ , R, b, H, and tan β change, the application condition of each strategy will not be changed. That is, the application conditions of the four strategies is only related to α , the solution strategy can be determined when the SAR image is determined.
From Section 2, we know that the model coefficients of SIP-based method and Strategy IV are the same. However, Strategy IV is only effective for heading angles between 270 and 360 (ascending SAR data) (Figure 14b). Therefore, when using the SIP-based method to retrieve 3D displacements from descending SAR image, it will cause |C2/C1| + |C3/C1| > 1, which results in the solution divergence (Figure 2).

5. Conclusions

In this paper, a new strategy was proposed to retrieve 3D displacements of mining areas with a single geometry SAR dataset. According to the directionality of horizontal displacement, the proportional relationship between the horizontal movement and the gradient of subsidence induced by underground mining was re-model. The proposed strategy can employ an arbitrary single geometry SAR dataset to reconstruct 3D mining displacements.
To evaluate the reliability of the proposed method, simulated and real datasets were carried out to test the proposed method. The simulation data monitoring results indicate that the RMSEs of the 3D displacements estimated by the proposed method were 0.45 mm, 0.50 mm, and 2.98 mm for the subsidence, east–west, and north–south components, respectively. The real data experiments were conducted based on three ascending RadarSAT-2 images and six descending TerraSAR-X images, respectively, over the 132,610 working face of the Fengfeng mining area in China. The results showed that the 3D displacements estimated from the ascending RadarSAT-2 and descending TerraSAR-X images by the proposed method were similar. The comparison between the in situ leveling measurements and the estimated 3D displacements demonstrated that the accuracy of the estimated subsidence was 7.3 mm. Finally, the comparison between the 3D displacements derived by the proposed method and the MSBAS methodology suggests that the proposed method is capable of extracting highly accurate 3D displacements of mining areas from a single geometry SAR dataset.

Author Contributions

R.Z., Z.A.V., J.L., C.C. and M.Z. developed the methodologies and designed the experiments; R.Z. performed the experiments; R.Z. and Z.A.V. analyzed and validated the results; R.Z. and J.L. wrote the paper; C.C. and M.Z. improved it. All authors have read and agreed to the published version of the manuscript.

Funding

This work was partly supported by the National Natural Science Foundation of China (No. 51774270), China Scholarship Council (Grant 202210100034).

Data Availability Statement

Data are unavailable due to privacy restrictions.

Acknowledgments

The authors would like to thank German Aerospace Center (DLR), European Space Agency (ESA) and Canadian Space Agency (CSA) for providing the TerraSAR-X, Sentinel-1A, and RadarSAT-2 images of the study area.

Conflicts of Interest

The authors declare no conflict of interest.

Appendix A

This appendix intends to show the theoretical derivation process of (10). In the derivation process, in order to facilitate the combining like terms, we ignore the difference between W(i + 1, j) and W(i, j + 1) in the RSIP-based method and the SIP-based method. The difference of subsidence estimated by the RSIP-based method (W R S I P (i, j)) and the SIP-based method (W S I P (i, j)) is:
Δ W = W R S I P ( i , j ) W S I P ( i , j )
By substituting (3), (4), and (9) into (A1), we can obtain:
Δ W = D L O S ( i , j ) C 2 R S I P W ( i , j + 1 ) C 3 R S I P W ( i + 1 , j ) C 1 R S I P D L O S ( i , j ) C 2 · W ( i , j + 1 ) C 3 · W ( i + 1 , j ) C 1
Combining (4) and (9), we can see that C2 = −C2 R S I P , C3 = C3 R S I P , C1 R S I P = a1 −C2 R S I P C3 R S I P , C1 = a1 + C2 R S I P C3 R S I P ; with further derivation, (A2) can be rewritten as:
Δ W = 2 · C 2 R S I P · D L O S ( i , j ) a 1 · W ( i , j + 1 ) a 1 C 3 R S I P 2 C 2 R S I P 2 + 2 · C 2 R S I P · C 3 R S I P ( W ( i , j + 1 ) W ( i + 1 , j ) ) a 1 C 3 R S I P 2 C 2 R S I P 2
By adding and subtracting 2·C2 R S I P ·C3 R S I P ·W(i, j) to the numerator of the second term on the right side of (A3) and combine with (8), we can obtain:
Δ W = 2 C 2 R S I P D L O S ( i , j ) a 1 W ( i , j + 1 ) a 3 U N ( i , j ) a 1 C 3 R S I P 2 C 2 R S I P 2 2 · C 3 R S I P · a 2 · U E R S I P ( i , j ) a 1 C 3 R S I P 2 C 2 R S I P 2
Combine the east–west horizontal movement U E R S I P (i, j) in (8). Express W(i, j + 1) as U E R S I P (i, j) and W(i, j) forms, and by substituting it into (A4):
Δ W = 2 · C 2 RSIP · D LOS ( i , j ) a 3 · U N ( i , j ) a 1 · W ( i , j ) a 1 C 3 RSIP 2 C 2 RSIP 2 + 2 · a 1 · a 2 · U E RSIP ( i , j ) 2 · C 3 RSIP · a 2 · U E RSIP ( i , j ) a 1 C 3 RSIP 2 C 2 RSIP 2
Combined with (2), the numerator of the first term on the right side of (A5) can be further expressed as east–west horizontal movement U E R S I P (i, j):
Δ W = 2 · C 2 R S I P · a 2 · U E R S I P ( i , j ) + 2 · a 1 · a 2 · U E R S I P ( i , j ) a 1 C 3 R S I P 2 C 2 R S I P 2 2 · C 3 R S I P · a 2 · U E R S I P ( i , j ) a 1 C 3 R S I P 2 C 2 R S I P 2
Combining like items in (A6) and the reduction of the fraction, we can obtain (A7), that is (10):
Δ W = 2 · a 2 · U E R S I P ( i , j ) a 1 C 3 R S I P + C 2 R S I P

Appendix B

This appendix shows the derivation process of the higher-order term coefficients (18), according to mathematical induction. Take the LOS deformation map of size m × n as an example. Assuming that the horizontal movement of last row and the last column are zeros, and adopting the back-substitution method, the results can be expressed as:
W ( m 1 , n 1 ) = D L O S ( m 1 , n 1 ) C 2 · W ( m 1 , n ) C 3 · W ( m , n 1 ) C 1 W ( m 2 , n 1 ) = D L O S ( m 2 , n 1 ) C 2 · W ( m 2 , n ) C 3 · W ( m 1 , n 1 ) C 1 W ( m 1 , n 2 ) = D L O S ( m 1 , n 2 ) C 2 · W ( m 1 , n 1 ) C 3 · W ( m , n 2 ) C 1 W ( m 2 , n 2 ) = D L O S ( m 2 , n 2 ) C 2 · W ( m 2 , n 1 ) C 3 · W ( m 1 , n 2 ) C 1 · · · · · · ·
By substituting the previous formula into the next formula one by one, and summarizing the general terms through mathematical induction, we can obtain:
W ( i , j ) = D LOS ( i , j ) C 1 C 2 C 1 2 D LOS ( i , j + 1 ) C 3 C 1 2 D LOS ( i + 1 , j ) + 2 · C 2 · C 3 C 1 3 · D LOS ( i + 1 , j + 1 ) + ( 1 ) m i + n j 2 · ( ( m 1 i ) · ( n 1 j ) + 1 ) · C 2 n 1 j · C 3 m 1 i C 1 m + n i j 1 · D LOS ( m 1 , n 1 ) + C 2 n j C 1 n j W ( i , n ) + + ( 1 ) m i + n j 1 ( m i ) ( n j ) · C 3 m 1 i C 2 n j C 1 m + n i j 1 · W ( m 1 , n ) C 3 m i C 1 m i W ( m , j ) + + ( 1 ) m i + n j 1 ( m i ) ( n j ) · C 3 m i C 2 n 1 j C 1 m + n i j 1 · W ( m , n 1 )
where the coefficients of high-order terms D L O S (m− 1, n− 1), W(m− 1, n) and W(m, n− 1) are as shown in (18).

Appendix C

This appendix provides the models and corresponding coefficients constructed for strategies II and IV.
The model of Strategy II is:
U E 2 ( i , j ) = b · r · [ W ( i , j ) W ( i , j + 1 ) ] / Δ E U N 2 ( i , j ) = b · r · [ W ( i , j ) W ( i 1 , j ) ] / Δ N ( i = 2 , 3 , , m ; j = 1 , 2 , , n 1 )
Substituting (A10) into (2), we can obtain:
D LOS ( i , j ) = C 1 RSIP 2 · W ( i , j ) + C 2 RSIP 2 · W ( i , j + 1 ) + C 3 RSIP 2 · W ( i 1 , j )
where the coefficients are:
C 1 RSIP 2 = a 1 b · r · a 2 / Δ E + b · r · a 3 / Δ N C 2 RSIP 2 = b · r · a 2 / Δ E C 3 RSIP 2 = b · r · a 3 / Δ N
The model of Strategy IV is:
U E 4 ( i , j ) = b · r · [ W ( i , j 1 ) W ( i , j ) ] / Δ E U N 4 ( i , j ) = b · r · [ W ( i + 1 , j ) W ( i , j ) ] / Δ N ( i = 1 , 2 , , m 1 ; j = 2 , 3 , , n )
Substituting (A13) into (2), we can obtain:
D L O S ( i , j ) = C 1 R S I P 4 · W ( i , j ) + C 2 R S I P 4 · W ( i , j 1 ) + C 3 R S I P 4 · W ( i + 1 , j )
where the coefficients are:
C 1 RSIP 4 = a 1 + b · r · a 2 / Δ E b · r · a 3 / Δ N C 2 RSIP 4 = b · r · a 2 / Δ E C 3 RSIP 4 = b · r · a 3 / Δ N

Appendix D

This appendix provides the information of interferometric pairs used in DInSAR and MSBAS methodology, and the results of the subsidence and horizontal movement obtained by MSBAS methodology.
Table A1. Information on the interferometric pairs of DInSAR.
SatelliteIncidence/ Heading/ Interferometric PairB  1T 2
TerraSAR-X41.07189.7020151219–201512309.9611
20151230–20160110−228.4211
20160110–2016012193.3911
20160121–20160201−49.4511
20160201–20160212−124.2811
RadarSAT-235.51349.1420151224–20160117−43.3124
20160117–20160305−37.7848
1 Perpendicular baseline/m; 2 Temporal baseline days.
Table A2. Information on the interferometric pairs of MSBAS.
SatelliteIncidence/ Heading/ Interferometric PairB  1T 2
TerraSAR-X41.07189.7020151219–201512309.9611
20151219–20160110−218.4822
20151219–20160121−125.1033
20151219–20160201−174.5344
20151230–20160110−228.4211
20151230–20160121−135.0422
20151230–20160201−184.4933
20160110–2016012193.3911
20160110–2016020143.9322
20160121–20160201−49.4511
20160201–20160212−124.2811
RadarSAT-235.51349.1420151224–20160117−43.3124
20151224–20160305−81.0972
20160117–20160305−37.7848
Sentinel-1A39.18346.8820151214–2015122686.1712
20151214–2016010786.1724
20151226–2016010723.5312
20160107–20160307−78.0960
1 Perpendicular baseline/m; 2 Temporal baseline days.
Figure A1. Subsidence acquired by MSBAS from 19 December 2015 to 5 March 2016.
Remotesensing 15 05244 g0a1
Figure A2. East–west horizontal movement acquired by MSBAS from 19 December 2015 to 5 March 2016.
Remotesensing 15 05244 g0a2

References

  1. He, G. Mining Subsidence; China University of Mining and Technology Press: Xuzhou, China, 1991. [Google Scholar]
  2. Milczarek, W. Application of a small baseline subset time series method with atmospheric correction in monitoring results of mining activity on ground surface and in detecting induced seismic events. Remote Sens. 2019, 11, 1008. [Google Scholar] [CrossRef]
  3. Syed, T.H.; Riyas, M.J.; Kuenzer, C. Remote sensing of coal fires in India: A review. Earth-Sci. Rev. 2018, 187, 338–355. [Google Scholar] [CrossRef]
  4. Guo, Q.; Guo, G.; Lv, X.; Zhang, W.; Lin, Y.; Qin, S. Strata movement and surface subsidence prediction model of dense solid backfilling mining. Environ. Earth Sci. 2016, 75, 1426. [Google Scholar] [CrossRef]
  5. Chen, B.; Li, Z.; Yu, C.; Fairbairn, D.; Kang, J.; Hu, J.; Liang, L. Three-dimensional time-varying large surface displacements in coal exploiting areas revealed through integration of SAR pixel offset measurements and mining subsidence model. Remote Sens. Environ. 2020, 240, 111663. [Google Scholar] [CrossRef]
  6. Zheng, M.; Deng, K.; Fan, H.; Du, S.; Zou, H. Monitoring and analysis of mining 3D time-series deformation based on multi-track SAR data. Int. J. Remote Sens. 2019, 40, 1409–1425. [Google Scholar] [CrossRef]
  7. Fan, H.; Lu, L.; Yao, Y. Method combining probability integration model and a small baseline subset for time series monitoring of mining subsidence. Remote Sens. 2018, 10, 1444. [Google Scholar] [CrossRef]
  8. Cuenca, M.C.; Hooper, A.J.; Hanssen, R.F. Surface deformation induced by water influx in the abandoned coal mines in Limburg, The Netherlands observed by satellite radar interferometry. J. Appl. Geophys. 2013, 88, 1–11. [Google Scholar] [CrossRef]
  9. Gama, F.F.; Paradella, W.R.; Mura, J.C.; de Oliveira, C.G. Advanced DINSAR analysis on dam stability monitoring: A case study in the Germano mining complex (Mariana, Brazil) with SBAS and PSI techniques. Remote Sens. Appl. Soc. Environ. 2019, 16, 100267. [Google Scholar] [CrossRef]
  10. Diao, X.; Wu, K.; Zhou, D.; Li, L. Integrating the probability integral method for subsidence prediction and differential synthetic aperture radar interferometry for monitoring mining subsidence in Fengfeng, China. J. Appl. Remote Sens. 2016, 10, 016028. [Google Scholar] [CrossRef]
  11. Yang, Z.F.; Li, Z.W.; Zhu, J.J.; Hu, J.; Wang, Y.J.; Chen, G.L. InSAR-based model parameter estimation of probability integral method and its application for predicting mining-induced horizontal and vertical displacements. IEEE Trans. Geosci. Remote Sens. 2016, 54, 4818–4832. [Google Scholar] [CrossRef]
  12. Ilieva, M.; Polanin, P.; Borkowski, A.; Gruchlik, P.; Smolak, K.; Kowalski, A.; Rohm, W. Mining deformation life cycle in the light of InSAR and deformation models. Remote Sens. 2019, 11, 745. [Google Scholar] [CrossRef]
  13. Yang, Z.; Li, Z.; Zhu, J.; Preusse, A.; Hu, J.; Feng, G.; Wang, Y.; Papst, M. An InSAR-based temporal probability integral method and its application for predicting mining-induced dynamic deformations and assessing progressive damage to surface buildings. IEEE J. Sel. Top. Appl. Earth Obs. Remote Sens. 2018, 11, 472–484. [Google Scholar] [CrossRef]
  14. Diao, X.; Bai, Z.; Wu, K.; Zhou, D.; Li, Z. Assessment of mining-induced damage to structures using InSAR time series analysis: A case study of Jiulong Mine, China. Environ. Earth Sci. 2018, 77, 166. [Google Scholar] [CrossRef]
  15. Milczarek, W. Investigation of post inducted seismic deformation of the 2016 Mw4. 2 Tarnowek Poland mining tremor based on DInSAR and SBAS methods. Acta Geodyn. Geomater. 2019, 16, 183–193. [Google Scholar]
  16. Rudziński, Ł.; Mirek, K.; Mirek, J. Rapid ground deformation corresponding to a mining-induced seismic event followed by a massive collapse. Nat. Hazards 2019, 96, 461–471. [Google Scholar] [CrossRef]
  17. Yan, S.; Shi, K.; Li, Y.; Liu, J.; Zhao, H. Integration of satellite remote sensing data in underground coal fire detection: A case study of the Fukang region, Xinjiang, China. Front. Earth Sci. 2020, 14, 1–12. [Google Scholar] [CrossRef]
  18. Fan, H.; Deng, K.; Ju, C.; Zhu, C.; Xue, J. Land subsidence monitoring by D-InSAR technique. Min. Sci. Technol. 2011, 21, 869–872. [Google Scholar] [CrossRef]
  19. Yang, Z.; Li, Z.; Zhu, J.; Feng, G.; Wang, Q.; Hu, J.; Wang, C. Deriving time-series three-dimensional displacements of mining areas from a single-geometry InSAR dataset. J. Geod. 2018, 92, 529–544. [Google Scholar] [CrossRef]
  20. Ng, A.H.M.; Ge, L.; Zhang, K.; Chang, H.C.; Li, X.; Rizos, C.; Omura, M. Deformation mapping in three dimensions for underground mining using InSAR–Southern highland coalfield in New South Wales, Australia. Int. J. Remote Sens. 2011, 32, 7227–7256. [Google Scholar] [CrossRef]
  21. Zhu, C.; Zhang, J.; Deng, K.; Zhang, Y.H.; Fan, H.D.; Li, P.X. Three-dimensional displacement field of buildings detection from multi-source SAR imagery. J. China Univ. Min. Technol. 2014, 43, 701–706. [Google Scholar]
  22. Huang, J.; Bai, Y.; Lei, S.; Deng, K. Time-series SBAS pixel offset tracking method for monitoring three-dimensional deformation in a mining area. IEEE Access 2020, 8, 118787–118798. [Google Scholar] [CrossRef]
  23. Zheng, M.; Deng, K.; Fan, H.; Huang, J. Monitoring and analysis of mining 3D deformation by multi-platform SAR images with the probability integral method. Front. Earth Sci. 2019, 13, 169–179. [Google Scholar] [CrossRef]
  24. Yang, Z.; Li, Z.; Zhu, J.; Preusse, A.; Hu, J.; Feng, G.; Papst, M. Time-series 3-D mining-induced large displacement modeling and robust estimation from a single-geometry SAR amplitude data set. IEEE Trans. Geosci. Remote Sens. 2018, 56, 3600–3610. [Google Scholar] [CrossRef]
  25. Zhu, C.; Wang, Z.; Li, P.; Motagh, M.; Zhang, L.; Jiang, Z.; Long, S. Retrieval and Prediction of Three-Dimensional Displacements by Combining the DInSAR and Probability Integral Method in a Mining Area. IEEE J. Sel. Top. Appl. Earth Obs. Remote Sens. 2020, 13, 1206–1217. [Google Scholar] [CrossRef]
  26. Tang, F.Q.; Dong, L.K.; Wang, Z.L.; Huang, J.C. A 3-D inversion model for InSAR detected displacements based on ground subsidence symmetry induced by horizontal coal mining. J. China Coal Soc. 2019, 1, 210–220. [Google Scholar]
  27. Yang, Z.; Li, Z.; Zhu, J.; Wang, Y.; Wu, L. Use of SAR/InSAR in Mining Deformation Monitoring, Parameter Inversion, and Forward Predictions: A Review. IEEE Geosci. Remote Sens. Mag. 2020, 8, 71–90. [Google Scholar] [CrossRef]
  28. Li, Z.W.; Yang, Z.F.; Zhu, J.J.; Hu, J.; Wang, Y.J.; Li, P.X.; Chen, G.L. Retrieving three-dimensional displacement fields of mining areas from a single InSAR pair. J. Geod. 2015, 89, 17–32. [Google Scholar] [CrossRef]
  29. Fan, H.; Wen, B.; Liu, J.; Liu, J.; Yin, J. An improved method of three-dimensional displacement field generation in mining areas with a single InSAR pair. Eur. J. Remote Sens. 2019, 52, 493–503. [Google Scholar] [CrossRef]
  30. Li, P.; T, Z. Mining influenced ground deformation state analysis and principal deformation calculation. J. Min. Saf. Eng. 2017, 34, 96–102. [Google Scholar]
  31. Wu, K.; Zhou, M. Mining Subsidence Prediction System; China University of Mining and Technology Press: Xuzhou, China, 1991. [Google Scholar]
  32. Werner, C.; Wegmüller, U.; Strozzi, T.; Wiesmann, A. Gamma SAR and Interferometric Processing Software. In Proceedings of the Ers-Envisat Symposium, Gothenburg, Sweden, 16–20 October 2000; Volume 1620. [Google Scholar]
  33. Chen, C.W.; Zebker, H.A. Network approaches to two-dimensional phase unwrapping: Intractability and two new algorithms. JOSA A 2000, 17, 401–414. [Google Scholar] [CrossRef]
  34. Hydrological Geological Team of Hebei Province Coal Geology Bureau. Report of Geology at Wannian Mine of Hebei Fengfeng Group Co., Ltd.; Hydrological Geological Team of Hebei Province Coal Geology Bureau: Handan, China, 2008. [Google Scholar]
  35. Samsonov, S.; d’Oreye, N. Multidimensional time-series analysis of ground deformation from multiple InSAR data sets applied to Virunga Volcanic Province. Geophys. J. Int. 2012, 191, 1095–1108. [Google Scholar]
  36. Samsonov, S.; d’Oreye, N.; Smets, B. Ground deformation associated with post-mining activity at the French–German border revealed by novel InSAR time series method. Int. J. Appl. Earth Obs. Geoinf. 2013, 23, 142–154. [Google Scholar] [CrossRef]
  37. Li, P. Study on Regularity and Prediction Method of Surface Subsidence Due to Deep Mining; China University of Mining and Technology: Xuzhou, China, 2012. [Google Scholar]
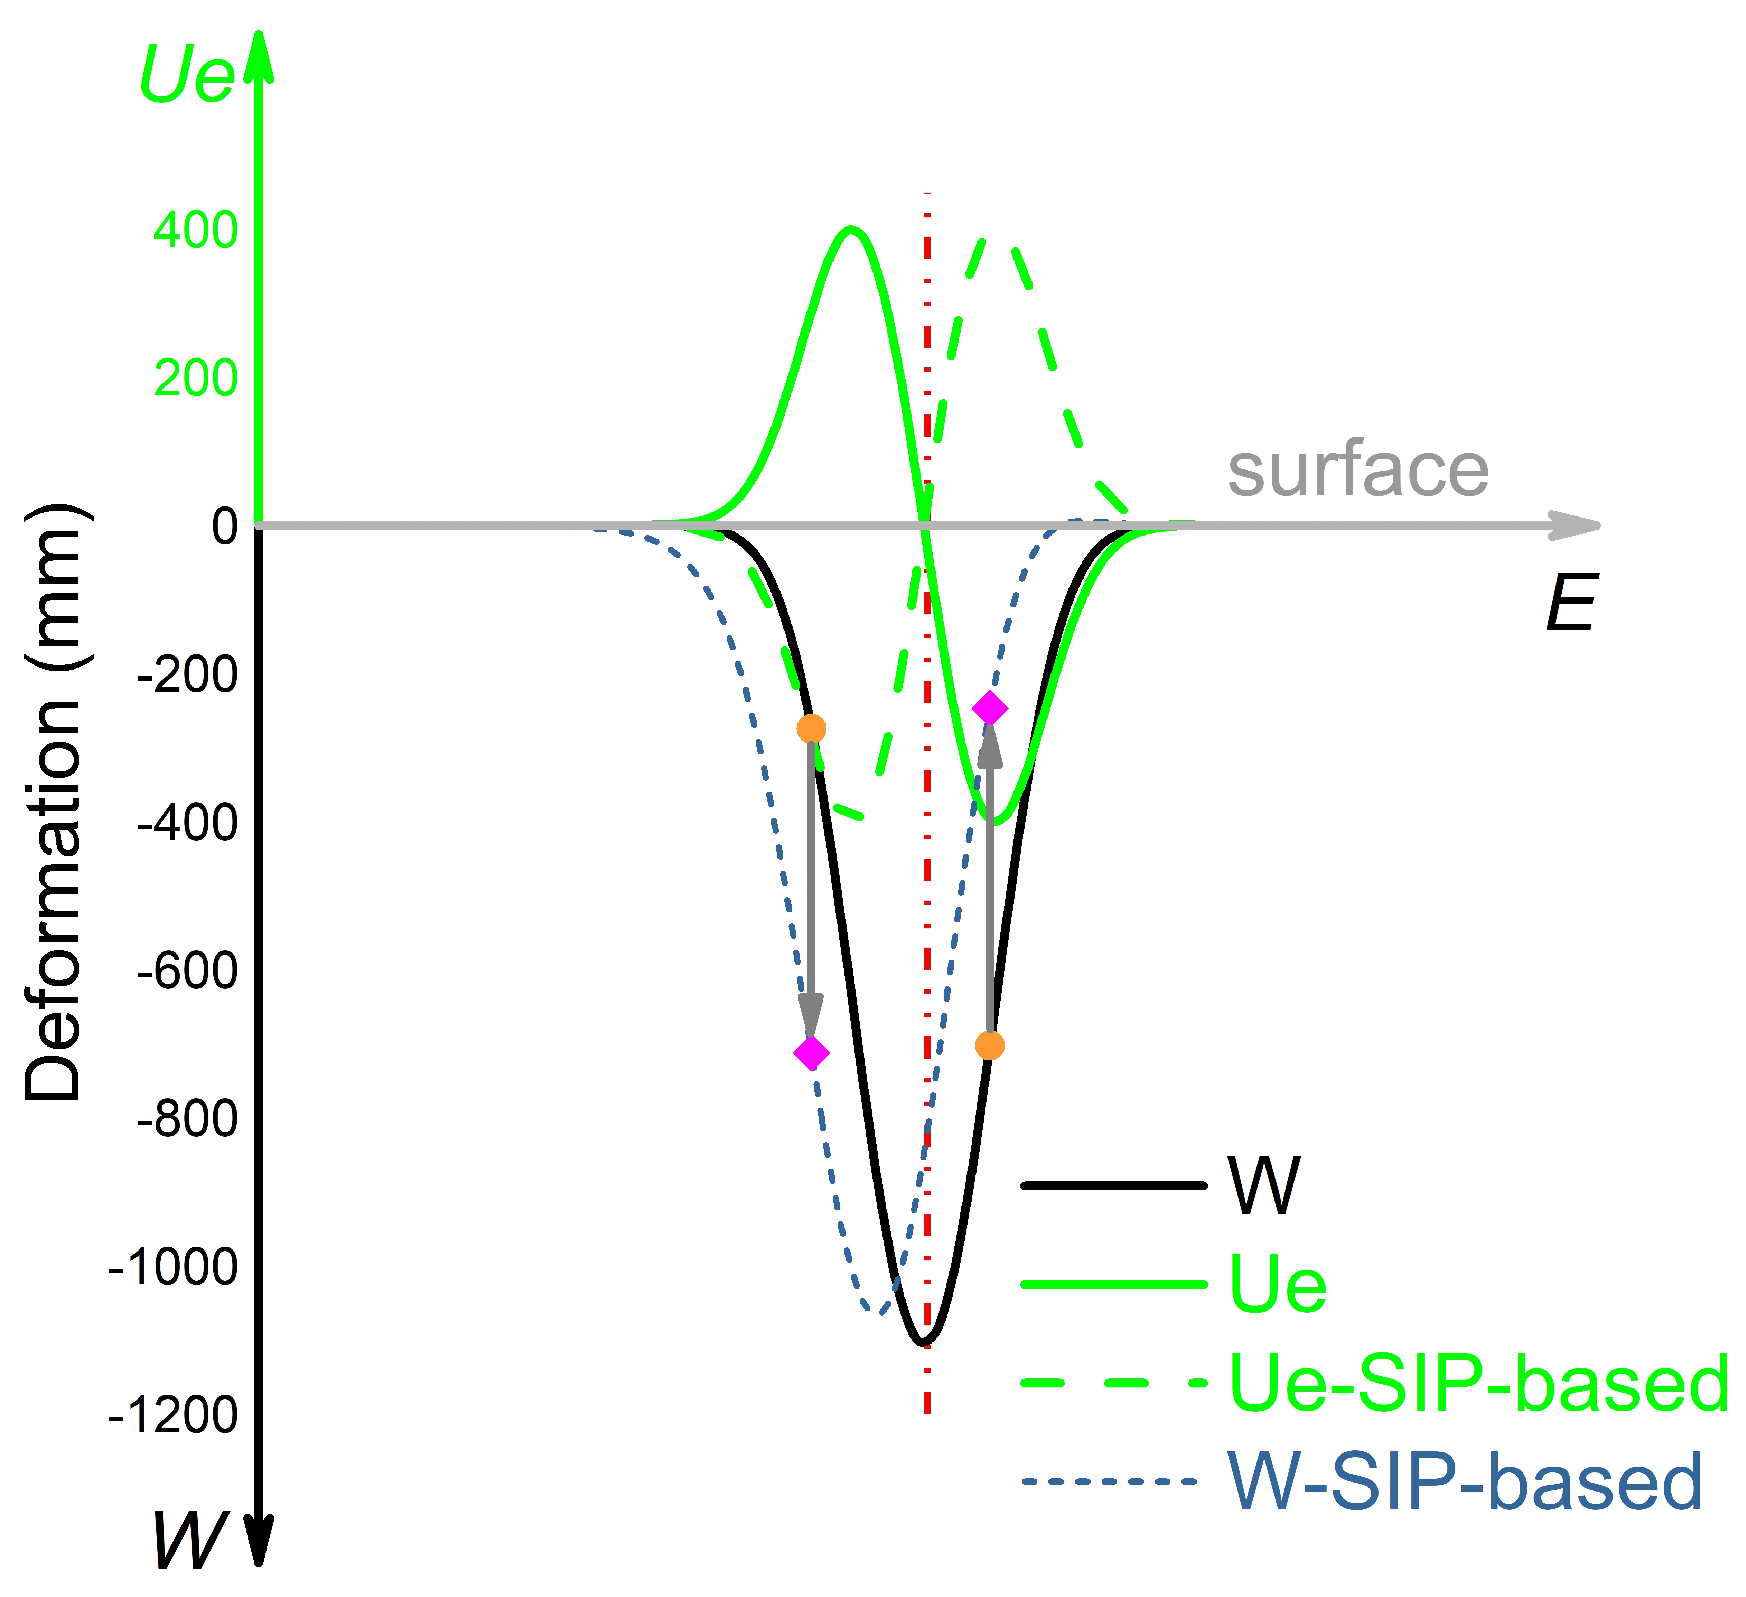
Figure 1. Directional relationship between subsidence and horizontal displacement.
Remotesensing 15 05244 g001
Figure 2. Stability analysis of the method. (a) is process of back-substitution method, the red and green rectangles represent the pending and the known pixels, respectively; (b) is the simulate subsidence; (c,d) are subsidence solved by SIP-based method under the simulated ascending and descending LOS deformation conditions, respectively; (e,f) are subsidence solved by RSIP-based method under the simulated ascending and descending LOS deformation conditions, respectively. The blue arrow represents the solution direction.
Remotesensing 15 05244 g002
Figure 3. Schematic diagram of the solution strategy.
Remotesensing 15 05244 g003
Figure 4. 3D displacements simulated by MSPS and estimated by SIP-based and RSIP-based method. (ac) denote the simulated 3D deformation in subsidence, west–east, and north–south directions, respectively; (df) represent the 3D deformation obtained by SIP-based methods in subsidence, west–east, and north–south directions, respectively; (gi) represent the 3D deformation obtained by RSIP-based methods in subsidence, west–east, and north–south directions, respectively.
Remotesensing 15 05244 g004
Figure 5. Comparisons between the simulated and the estimated displacements along A-A’ and B-B’ profiles. (a) is the subsidence of the A-A’ profile; (b) is the subsidence of the B-B’ profile; (c) is the north–south horizontal movement of the A-A’ profile; (d) is the east–west horizontal movement of the B-B’ profile.
Remotesensing 15 05244 g005
Figure 6. Difference between the estimated 3D displacements and the simulated deformation. (ac) denote the difference between SIP-based method and the simulated deformation in subsidence, west–east, and north–south directions, respectively; (df) represent the difference between RSIP-based method and the simulated deformation in subsidence, west–east, and north–south directions, respectively.
Remotesensing 15 05244 g006
Figure 7. The influence of noise on the RSIP-based method. LOS deformation in (a) original, (b) noise Std = 25, and (c) noise Std = 50; 3D deformation with noise Std of 25 and 50 in (d), (g) subsidence, (e,h) east–west, and (f,i) north–south directions, respectively.
Remotesensing 15 05244 g007
Figure 8. Comparisons between the simulated and the estimated displacements with noise Std of 25 and 50 along A-A’ and B-B’ profiles. (a) is the subsidence of the A-A’ profile; (b) is the subsidence of the B-B’ profile; (c) is the north–south horizontal movement of the A-A’ profile; (d) is the east–west horizontal movement of the B-B’ profile.
Remotesensing 15 05244 g008
Figure 9. The relationship between noise level and accuracy of 3D displacements.
Remotesensing 15 05244 g009
Figure 10. Study area overview. (a) geographic location of the study area; the solid blue and red rectangles denote the footprints of the RadarSAT-2 and TerraSAR-X data, respectively. (b) enlarged view of the 132,610 working face; the blue arrow indicates the mining direction of the working face.
Remotesensing 15 05244 g010
Figure 11. LOS deformation map. (a) LOS deformation map of RadarSAT-2 images acquired from 24 December 2015 to 5 March 2016. (b) LOS deformation map of TerraSAR-X images acquired from 19 December 2015 to 12 February 2016.
Remotesensing 15 05244 g011
Figure 12. 3D displacement fields. (a,b,d,e,g,h) denote 3D displacements of the RSIP-based method and the SIP-based method based on the RadarSAT-2 in subsidence, west–east, and north–south directions, respectively; (c,f,i) represent 3D displacements of the RSIP-based method based on the TerraSAR-X in subsidence, west–east, and north–south directions, respectively.
Remotesensing 15 05244 g012
Figure 13. Verification of the RSIP-based method. (a) subsidence at 29 observation points, (b) east–west horizontal movement along the profile W–E.
Remotesensing 15 05244 g013
Figure 14. Relationship between α and |C2/C1| + |C3/C1|. (a) represents all cases of |C2/C1| + |C3/C1|; (b) represents |C2/C1| + |C3/C1| less than 1.
Remotesensing 15 05244 g014
Figure 15. Relationships between θ , R, b, H, tan β , and |C2/C1| + |C3/C1|. (ae) represent the relationship between incident angle, resolution, horizontal movement coefficient, mining depth, and the tangent of the main influencing angle with |C2/C1| + |C3/C1|, respectively.
Remotesensing 15 05244 g015
Table 1. Image parameters.
Satellite MissionRepeat CycleWavelength/BandResolution (Azimuth × Range)IncidenceHeading
TerraSAR-X11 days3.11 cm/X-band1.89 m × 1.36 m41.07 189.70
RADARSAT-224 days5.55 cm/C-band2.90 m × 2.70 m35.51 349.14
Table 2. Value range of the parameters.
α / θ / R/mbH/mtan β
Range1–3601–901–200.1–0.4100–12001.2–2.6
Fixed value189/3493550.36001.85
Disclaimer/Publisher’s Note: The statements, opinions and data contained in all publications are solely those of the individual author(s) and contributor(s) and not of MDPI and/or the editor(s). MDPI and/or the editor(s) disclaim responsibility for any injury to people or property resulting from any ideas, methods, instructions or products referred to in the content.