Article

Retrieval of an On-Orbit Bidirectional Reflectivity Reference in the Mid-Infrared Bands of FY-3D/MERSI-2 Channels 20

1
College of Geoscience and Surveying Engineering, China University of Mining & Technology, Beijing 100083, China
2
Changchun Institute of Optics, Fine Mechanics and Physics, Chinese Academy of Sciences, Changchun 130033, China
3
National Satellite Meteorological Center, China Meteorological Administration, Beijing 100081, China
4
Land Satellite Remote Sensing Application Center, Ministry of Natural Resources, Beijing 100048, China
*
Author to whom correspondence should be addressed.
These authors contributed equally to this work.
Remote Sens. 2023, 15(21), 5117; https://doi.org/10.3390/rs15215117
Submission received: 24 August 2023 / Revised: 18 October 2023 / Accepted: 23 October 2023 / Published: 26 October 2023

Abstract

:
The acquisition of high-accuracy reflectance in mid-infrared channels is of great significance for the on-orbit cross-calibration of other bands using the mid-infrared band. However, due to the phenomenon that some sensors have a wide range of wavelengths covered by adjacent channels in the mid-infrared band, the traditional method of estimating the mid-infrared reflectivity assumes that the sea surface reflectivity in different mid-infrared bands is equal, which will lead to a large error during calculation. To solve this problem, this study proposes a nonlinear split-window algorithm involving ocean sun glint data to retrieve reflectivity of FY-3D/MERSI-2 channels 20. The results show that the variation range of sea surface reflectivity of channel 20 in the glint area is 10~25%, the mean value of the reflectivity difference obtained by the nonlinear split-window algorithm is 0.27%, and the RMSE is 0.0066. Among the main influencing factors, the atmospheric conditions have the greatest impact, and the effects of the uncertainties in the water vapor content and aerosol optical thickness on the calculation results are 1.16% and 0.34%, respectively. The initial value limits of the mid-infrared sea surface reflectivity also contribute approximately 0.84%, and their contribution to the uncertainty represents one of the main components. This work shows that the nonlinear split-window algorithm can calculate the infrared sea surface reflectivity with high accuracy and can be used as a reference for in-orbit cross-calibration between different bands.

1. Introduction

The mid-infrared spectral region is between the visible near-infrared and thermal infrared spectral regions, and objects show unique transition characteristics in this spectral region. The mid-infrared region in the wavelength range of 3.5 to 4.1 μm features a high transmittance [1], and the gases that have an impact on the optical properties are water vapor, carbon dioxide, and methane [2]. In the spectral range of 3.60~3.85 μm, the influence of aerosol particles on the optical properties of the atmospheric window is much lower than that on those of the shortwave infrared atmospheric window [3,4,5]; especially under clean atmospheric conditions, the attenuation of total radiation mainly comes from water vapor and the contribution of aerosol particles to the total radiation attenuation is generally less than 5%, indicating good atmospheric penetration characteristics [6,7]. As a result, the mid-infrared band exhibits unique properties over the full wavelength range, unlike the VNIR and LWIR bands [8,9,10], allowing this channel to be suitable as a reference for calibration and verification.
The characteristics of the mid-infrared band make it highly accurate to calculate the reflectivity. Therefore, the mid-infrared band can be employed as the reference band to perform on-orbit calibration of the visible or near-infrared band under the condition of a clean ocean as an ideal scene. Over the clean ocean, the signal received by the satellite sensor in the solar reflectance spectral region mainly comes from the scattering of dry and clean atmospheric molecules [11,12], and the energy of the reflected solar energy from the sea surface and the downward atmospheric radiation reaching the pupil is only approximately 1% of the total energy at the pupil in the visible to mid-infrared bands [13,14]. Therefore, special observation conditions need to be selected. At the surface of the ocean, the tilted “facets“ of sunlight reflecting at angles close to that of the mirror in the satellite sensor are called sun glint [15,16,17]. In the sun glint zone, the solar energy reflected from the sea surface in the visible to mid-infrared bands and received by the satellite is more than 70% of the total energy at the pupil [18]. In addition, when using the ocean to calculate the mid-infrared reflectance, the signal received by the sensor is affected by water vapor, water-leaving radiance, and aerosols [19,20]. The sea surface glint area greatly increases the reflectivity in the channel in the glint area due to specular reflection, and the reflectivity of the central area of the glint can reach more than 30% in the 3.6 μm band, making the bidirectional reflectivity of the sea surface high enough to greatly reduce the impacts of atmospheric molecules and aerosol scattering on the channel transmission rate [21]. A high-reflectivity target in an image can effectively improve the signal-to-noise ratio and reduce the error of reflectance calculation, so it is uniquely advantageous to choose the mid-infrared band in a glint area. Using the reflectivity of the sea surface glint area in the mid-infrared band as a benchmark is the basis for the subsequent establishment of a reflectivity relationship model from visible light to near-infrared and mid-infrared, and then cross-calibration is possible between visible and near-infrared bands. The purpose of this study is to calculate the reflectivity of the mid-infrared band in the sea surface glint area, and use it as a benchmark for cross-calibration between bands in subsequent studies. Simultaneously, the reflectivity of the sun glint area is an important element in calculating sea surface albedo [22]. This study also provides a reference for obtaining high-precision sea surface albedo products.
In the current research, the way to calculate the reflectivity of the sun glint in the sea surface area is mainly based on the radiative transfer models of ocean–atmosphere coupling systems, such as Coupled Ocean and Atmosphere Radiative Transfer [23], MOMO [24], and PCOART [25]. The focus in the visible to near-infrared window is to separate the sun glint reflectance from the water-leaving reflectance and whitecap. Therefore, it is necessary to focus on the water-leaving radiation energy closely related to seawater components such as chlorophyll concentration and seawater salinity, and the whitecap reflection related to sea surface conditions. Compared with the mid-infrared band, the visible to near-infrared band requires the consideration of more variables related to atmospheric and seawater components, which brings more possibilities of errors in the calculation process. The water-leaving radiation in the mid-infrared band is so weak that it can be ignored; however, it is also challenging to separate the emission, the reflectivity, and the temperature of the surface, which severely limits the use of the mid-infrared band [26,27]. Various studies have proposed several methods to calculate the reflectance in this spectral range. They can be loosely classified into two groups: the first group is based on the temperature-independent spectral index (TISI) [28], and the second is based on the approximate mid-infrared emissivity, using brightness temperature estimates based on thermal infrared (TIR) data. Most of the methods in the first group necessitate daytime and nighttime images, but these methods can be limited by a variety of factors, including the requirement for accurate geolocation and cloud-free conditions [29]. In addition, the assumption of TISI invariance between day and night images is difficult to stipulate when the surface properties change. The second type of approach may introduce substantial inaccuracies when the surface emissivity is far from uniform or when the surface is not Lambertian within the mid-infrared window. Tang and Li introduced the nonlinear split-window formulation for the TIR band to the mid-infrared band, simulated the parameters of the nonlinear split-window model using the two adjacent mid-infrared channels 22 (3.97 μm) and 23 (4.06 μm) of MODIS to find the brightness temperature at the surface in the absence of contributions from the direct solar beam, and then found the surface reflectivity of the MODIS 22 channel [30,31]. This method does not require the TIR channel data or emissivity and reflectance data but simply assumes that the infrared reflectance of the two MODIS channels is equivalent and that the surface brightness temperatures are equal in the absence of solar radiation [32]. The uncertainty in the model is 1.1% to 3.4%. However, the assumption of equal reflectance in the MODIS mid-infrared channels does not apply to sensors with central wavelengths far apart in the mid-infrared channels. To solve this problem, Xin Jing et al. introduced a linear equation to establish the mid-infrared channel reflectivity relationship, and applied it to VIIRS sensors with good results [33].
The objectives of this study are (1) to construct a model for calculating the bidirectional reflectivity of the channel 20 in the mid-infrared band and to analyze the accuracy; and (2) to clarify the main error sources of the reflectivity calculated by the model and the magnitude of their contributions. The reflectivity of the mid-infrared band in this study provides a reliable, stable, and high-precision benchmark for establishing a calibration model based on the sea surface glint area.

2. Materials and Methods

2.1. Materials and Study Region

FY-3D/MERSI-2 data are remote sensing data generated by the medium-resolution spectral imager MERSI-2 aboard the FY-3 meteorological satellite and were acquired from the National Satellite Meteorological Centre (NSMC). Mid-infrared channel 20 (central wavelength: 3.8 μm) and auxiliary channel 21 (central wavelength: 4.05 μm) are used in this study to calculate the sea surface reflectivity (Table 1). The data should be calibrated according to slope and intercept coefficients before use, and the DN should be converted to radiance in the appropriate units.
The aerosol data are from the MOD08_D3 global daily data product of the NOAA Earth Observing System (EOS). The dataset is stored in HDF files with a spatial resolution of 1° and a temporal resolution of 1 day (Table 2). The aerosol data are converted to visibility and used as a filtering index for FY-3D remote sensing data and as input parameters in the calculation of sea surface reflectivity. The wind speed, water vapor, and temperature data are from the European Centre for Medium-Range Weather Forecasts (ECMWF) reanalysis database, which provides hourly atmospheric, oceanic, and surface data on a global scale, updated on a daily basis. The wind speed, water vapor, and temperature data have a spatial resolution of 0.25° and a temporal resolution of 1 h and are stored in HDF files. Wind speed data are divided into horizontal wind speed h and vertical wind speed v , which need to be converted to actual wind speed using h 2 + v 2 .
The study area was chosen to be the sun glint over the deep ocean in the southern Indian Ocean (Figure 1) for the following reasons. First, the southern Indian Ocean is a deep pelagic sea, and the average depth of the ocean is approximately 3839.9 m, which can effectively reduce the influence of the coastline and marine biochemical substances. Second, the southern Indian Ocean has a tropical oceanic climate, and the average wind speed is lowest in summer during the year, resulting in a higher stability of the atmospheric state at the sea surface. Third, the atmosphere above the southern Indian Ocean is pure, with thin aerosol optical thickness, facilitating the formation of a highly reflective glint area on the sea surface.
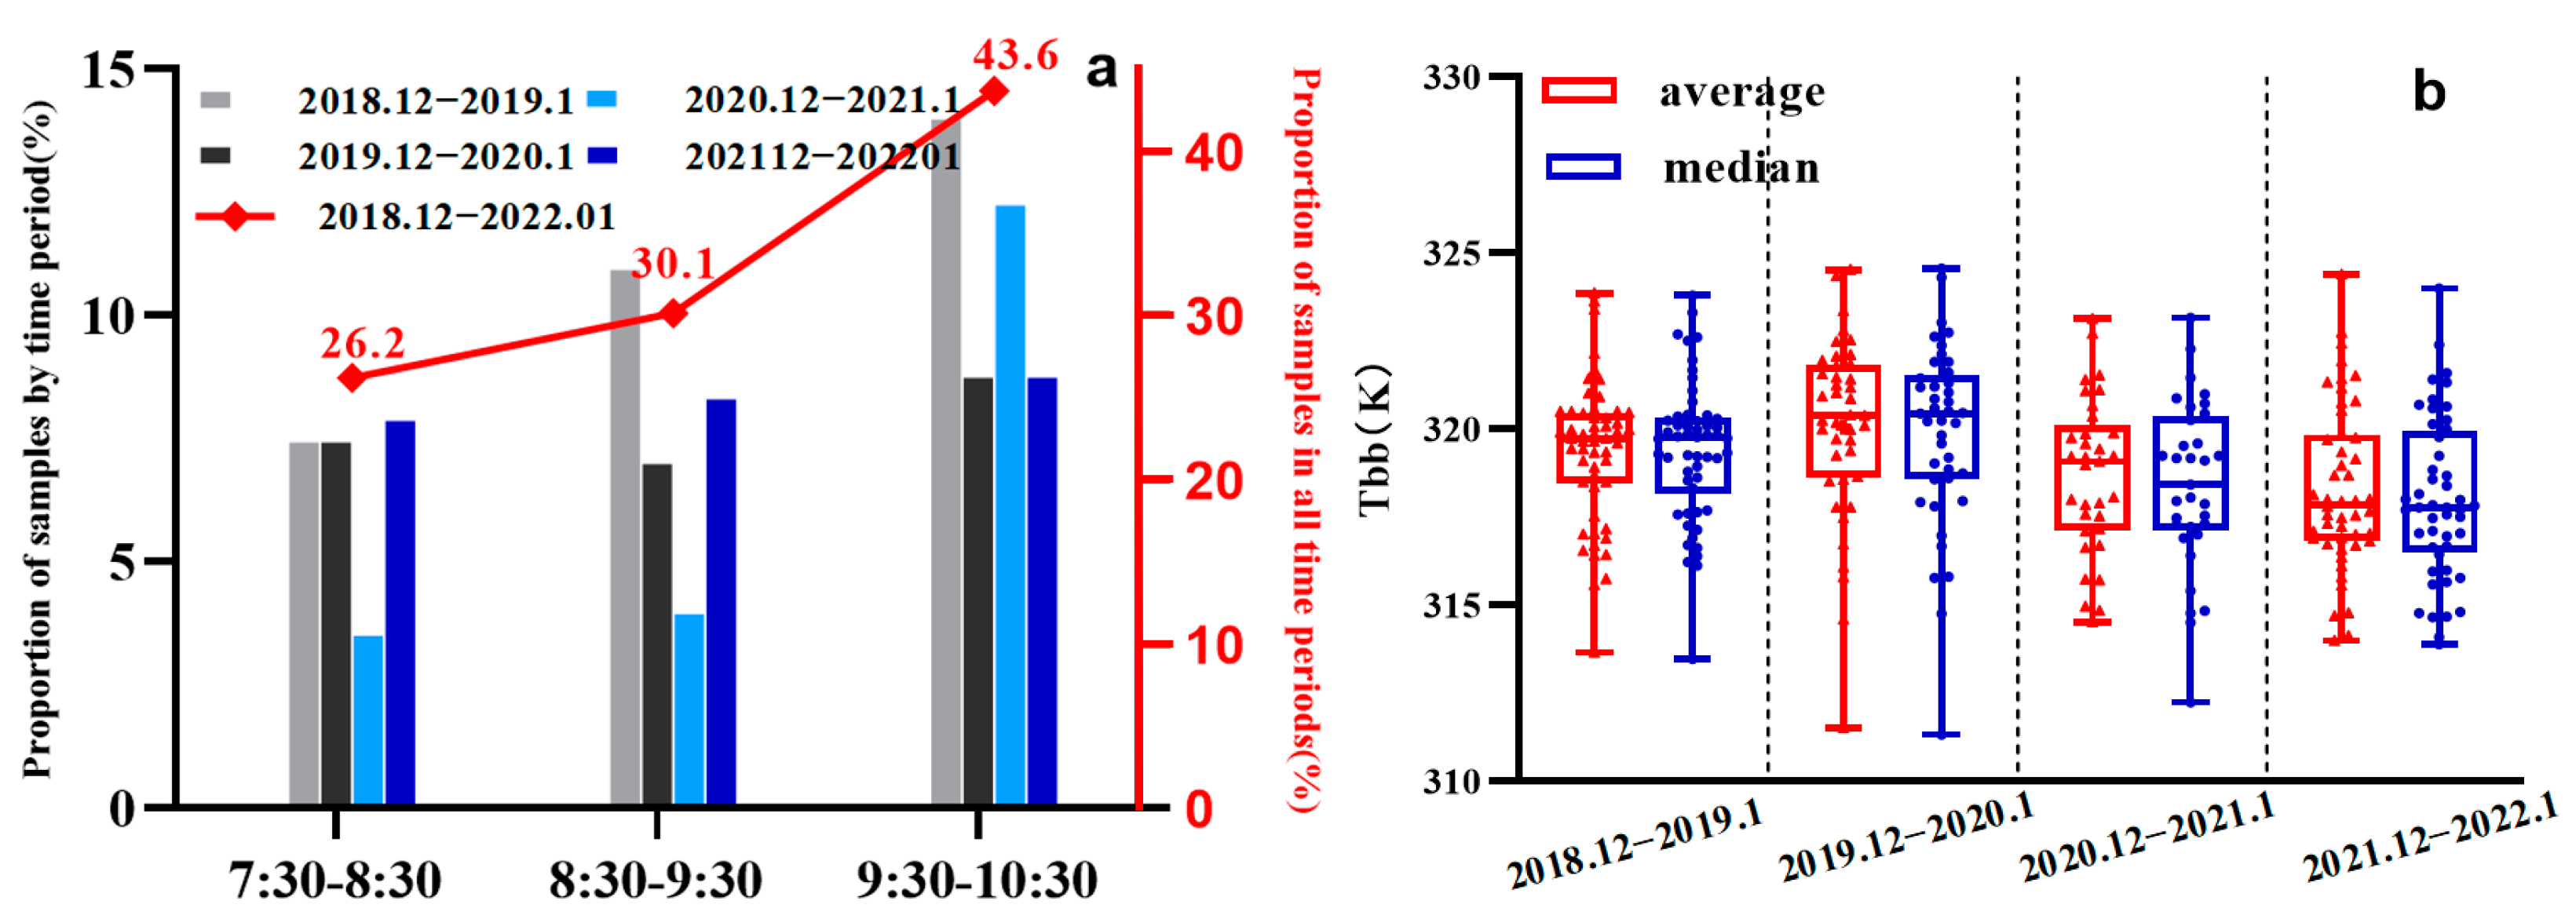
The selection of the sample area is mainly based on the following conditions: (1) the month corresponding to the summer of the southern Indian Ocean was chosen to ensure the frequency of glint and reduce the influence brought by changes in the sensor radiation response [34]; (2) the sample area was chosen to be free of clouds; (3) the transit time of the sample data was set to be approximately 1–2 p.m. local time, which ensures a high frequency of glint. This selection procedure ensures that most of the satellite signal contribution comes from the sea surface and reduces the influence brought by the atmospheric radiation. Thus, the influence of uncertainty is reduced. Based on the above conditions, this study selected 176 images of the southern Indian Ocean summer season in the latitude and longitude range of 41~99°E and −38~0°S, starting from January 2018 and ending in January 2022 from 3488 original images as the study sample. These include 56 samples from December 2018 to January 2019, 36 samples from December 2019 to January 2020, 40 samples from December 2020 to January 2021, and 42 samples from December 2021 to January 2022. The satellite transit times of the study samples are approximately 9–10 a.m. UTC, which corresponds to 1–2 p.m. local time in the South Indian Ocean. In total, 30.1% and 43.6% of the total samples are from 8:30–9:30 a.m. and 9:30–10:30 a.m. UTC, respectively (Figure 2), ensuring the high frequency of sun glint in the samples. The brightness temperatures at the top of the atmosphere of the channels are all approximately 320 K, and the median and mean values of the brightness temperatures are almost equal, indicating that the sample data from the four time periods are relatively concentrated, with low dispersion and no anomalous samples.
To ensure that the sea surface state of the FY-3D/MERSI-2 data is stable, the atmosphere is clean, and the study area is far from land, the pixels need to be selected based on wind speed, aerosol concentration, and ocean depth. The LandSea Mask data layer identifier 7 in FY-3D/MERSI-2 represents ocean depths greater than 500 and is used as a mask for pixel screening. To ensure a clean sea surface atmosphere, aerosol data are used to screen pixels with a visibility distance of 10 km as the threshold given that the visibility distance in the mid-infrared band tends to be stable at 10 km on the transmittance. The wind speed at the sea surface affects the geometric properties of the sea surface and the atmospheric state, which in turn affects the calculation of the sea surface reflectivity. Considering the uncertainties in the ECMWF wind field and the default wind speed (4.1 m/s) of MODTRAN4′s mid-latitude summer atmospheric model, a wind speed of 5 m/s is used as the threshold to screen the pixels to identify calm and windless points.
To ensure that the glint area is in the high-reflectivity reflection area, a glint angle of 5° is used as the threshold to screen the pixel points. The glint angle of sun glint is determined by Equation (1), where ω is the glint angle, i.e., the equation describing sun glint over the sea is related to the direction of incidence and reflection of light. θ s and θ i represent the solar zenith angle and sensor zenith angle, respectively; and Δ ϕ is the relative azimuth angle, defined by the difference between the sensor azimuth angle ϕ i and solar azimuth angle ϕ s , i.e., Δ ϕ = ϕ i ϕ s [17].
cos 2 ω = cos θ s cos θ i sin θ s sin θ i cos ( Δ ϕ )
To prevent the high-reflectivity area from exceeding the dynamic detection range of the channel, the DN is converted to the blackbody brightness temperature according to the channel brightness temperature correction coefficient, and the pixels that exceed the dynamic range of the brightness temperature are excluded.
During radiation transmission, clouds can severely weaken the radiant energy reaching the sensor, so data from cloudy glint regions need to be removed. In this study, physical reflectance and the coefficient of variation are used for cloud detection. The coefficient of variation can be used to characterize the homogeneity of the data. Cloud coverage will reduce the smoothness of the data in the relatively homogeneous and stable glint area, so we use a 3 × 3 sliding window to calculate the coefficient of variation of the pixel points. After repeated experiments, we determine that areas with a coefficient of variation less than 0.008 represent cloud-free areas, and we use 40% as the threshold to screen areas with high reflectance in the visible band. Finally, the real color composite image is used to judge the cloud removal effect by visual interpretation, and the clean cloud-free sample data are retained.

2.2. Methods

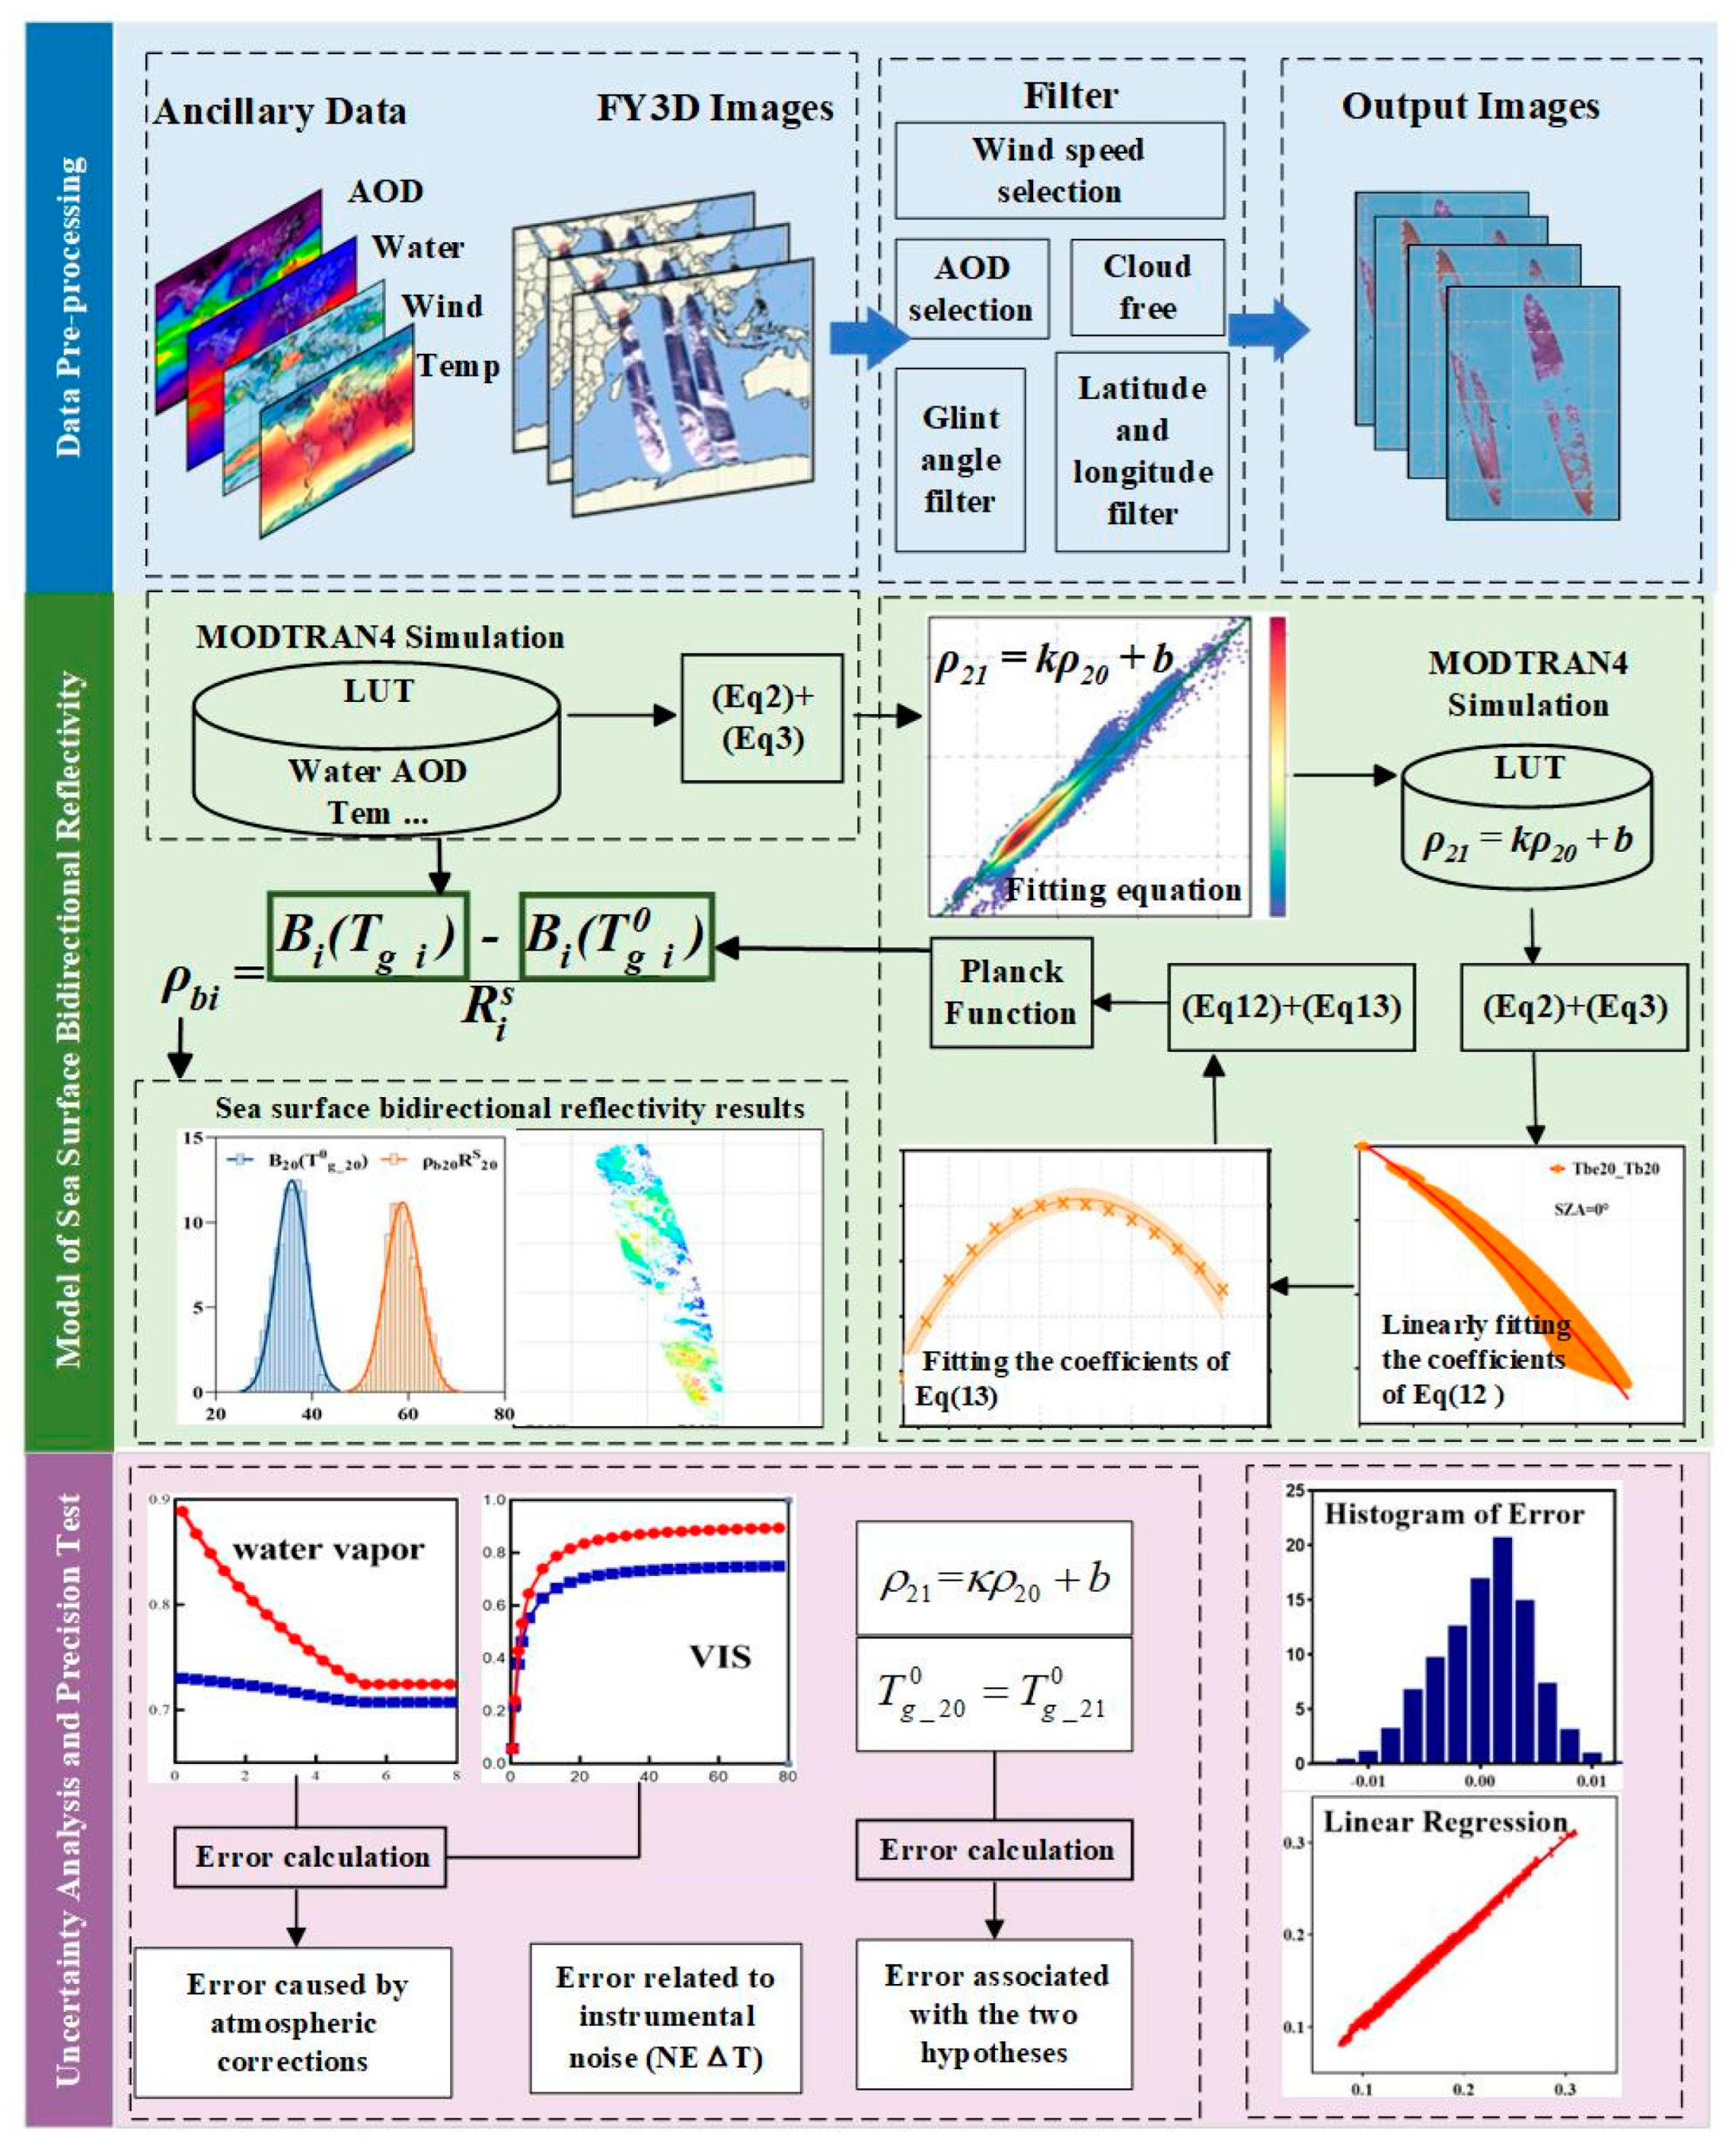
In this study, the calculation of sea surface reflectivity in the mid-infrared band is divided into three parts, as shown in Figure 3. The first part is data preprocessing; mainly with the help of meteorological information, the raw FY-3D/MERSI-2 data pixel points are filtered to retain the glint center pixels in the deep ocean region of the southern Indian Ocean under a clean and cloud-free atmosphere. The second part involves computing the bidirectional reflectivity of the sea surface, which is achieved using a fundamental equation, namely Equation (7). Section 2.2.1 outlines how Equation (7) is derived from the radiation transfer equation, while Section 2.2.2 provides a detailed explanation of how the crucial parameter B i ( T g _ i 0 ) in Equation (7) is calculated. The third part is the model stability analysis and accuracy verification. The stability analysis part includes the meteorological data errors, the two underlying assumptions of the model and the influence of systematic errors on the sea surface reflectance results, and finally the accuracy verification.

2.2.1. Radiative Transfer Modeling in the MIR

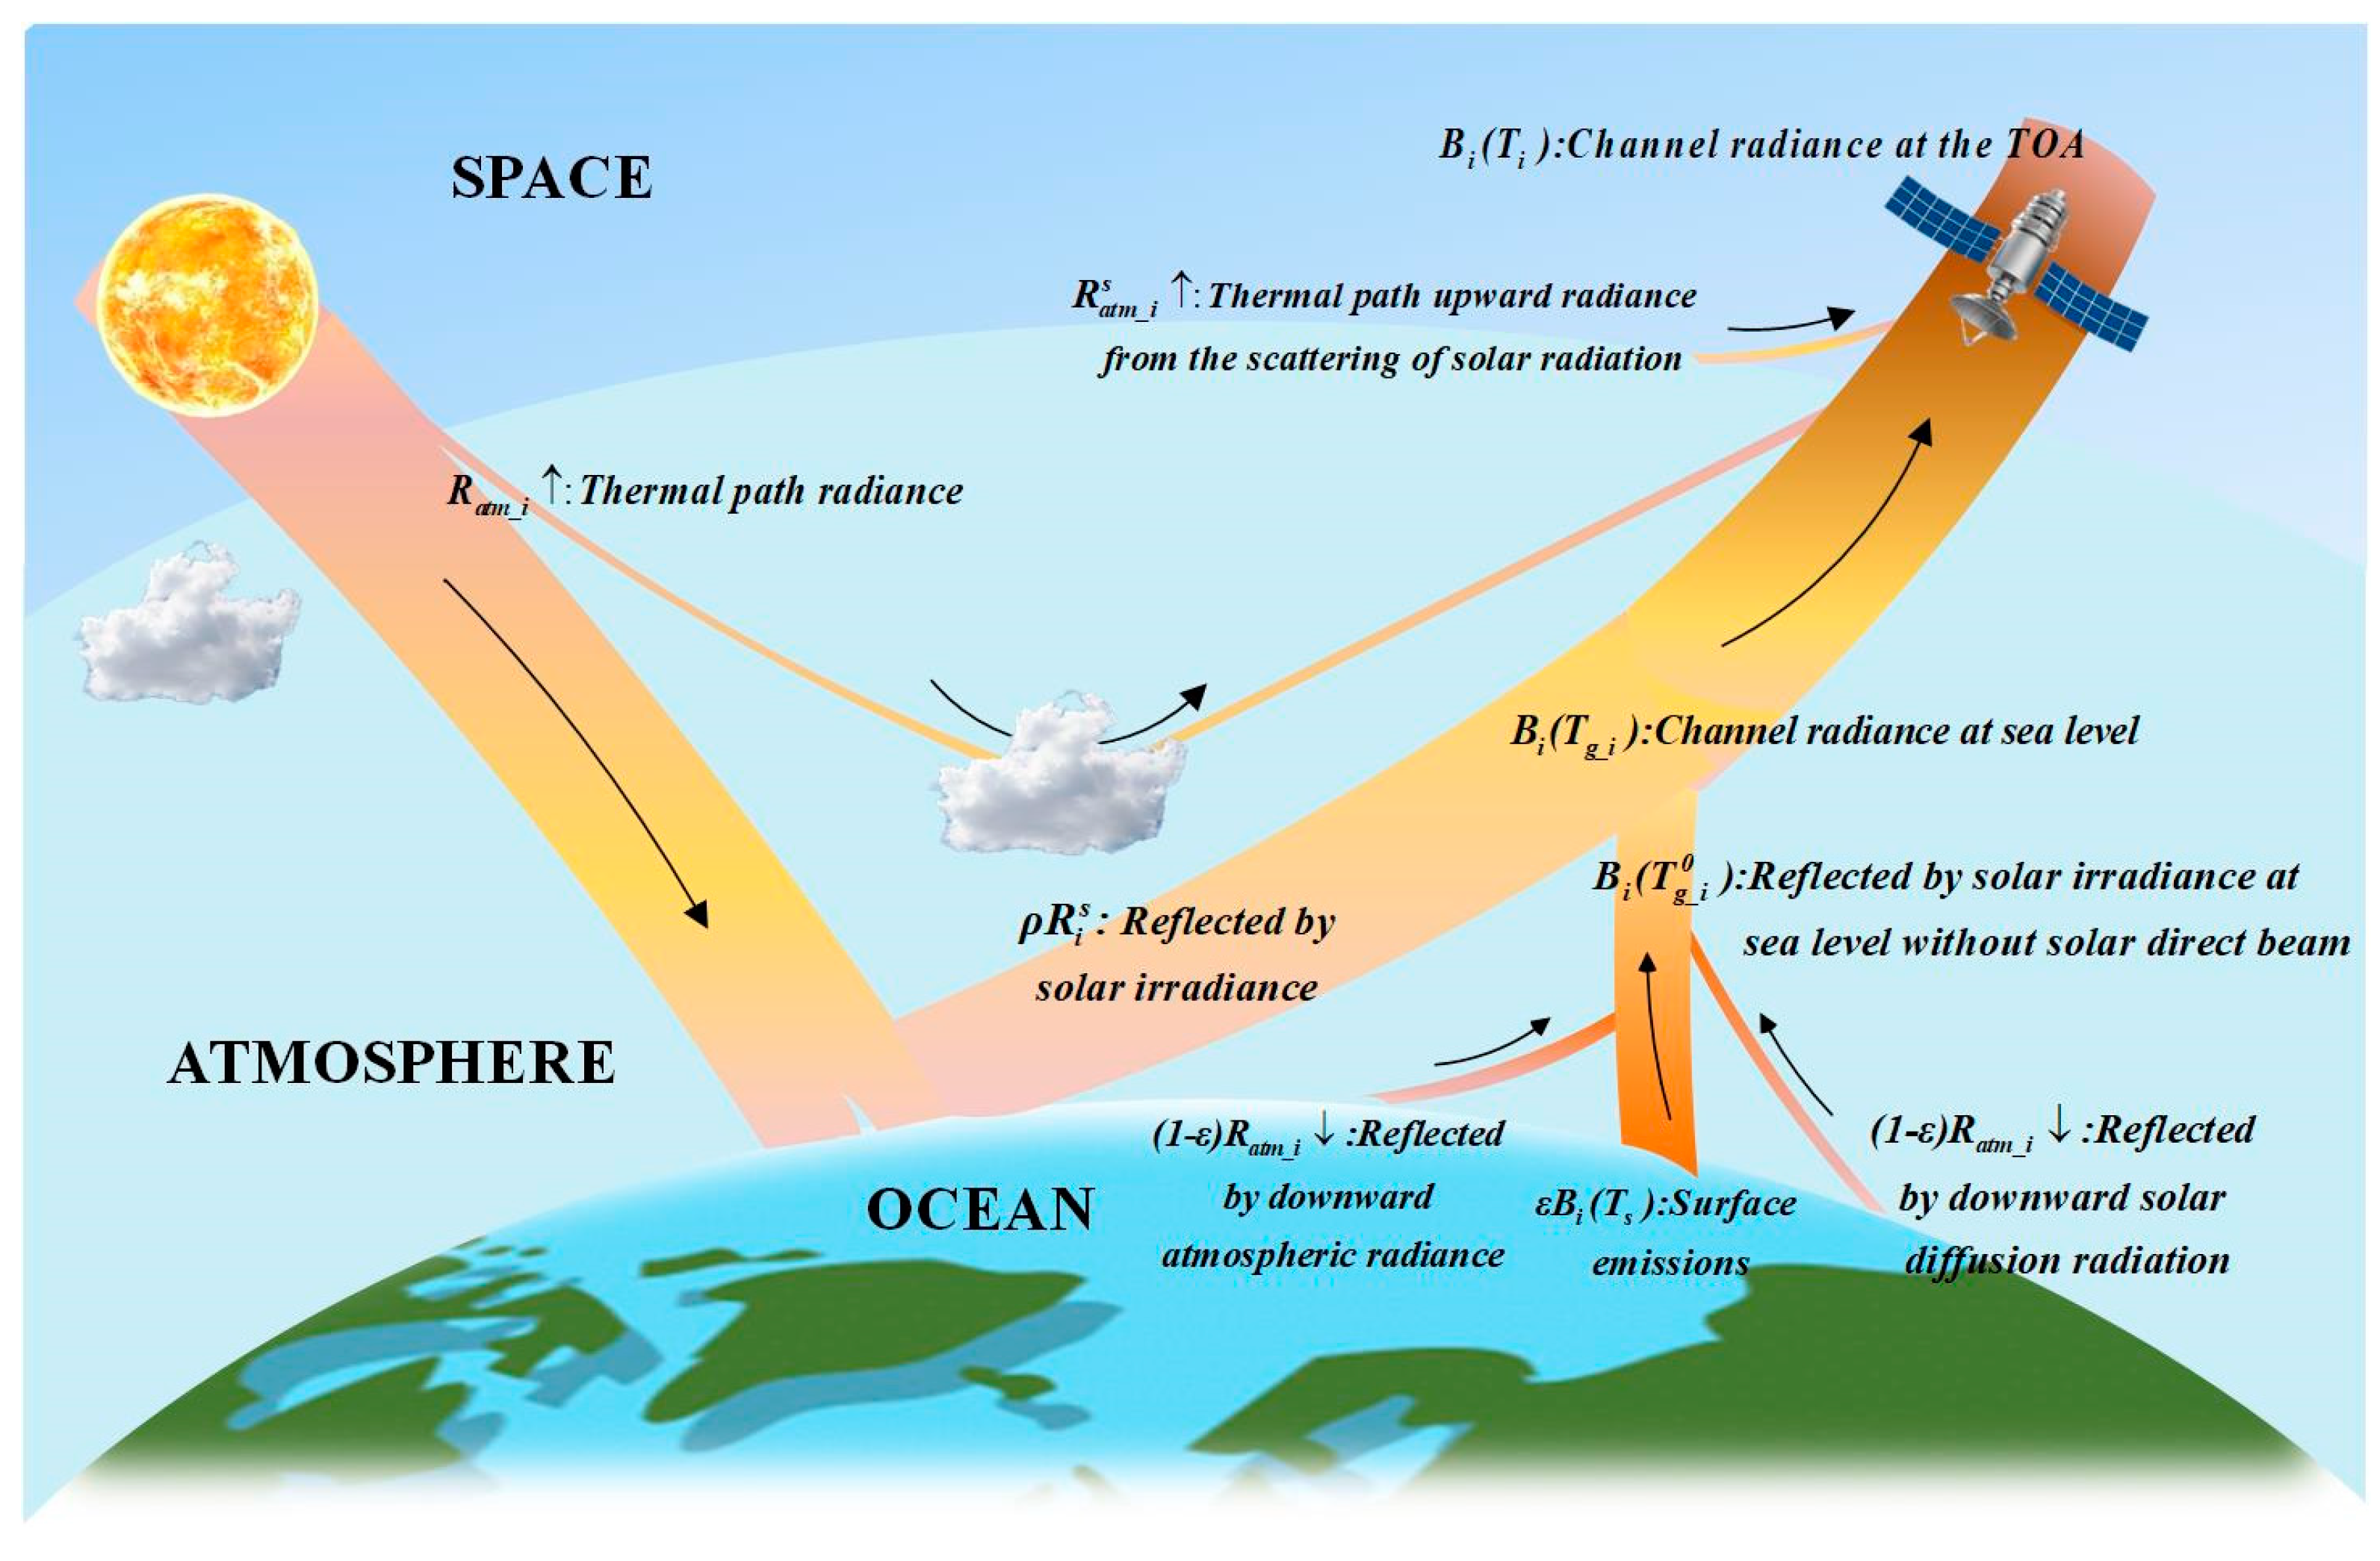
Based on radiative transfer theory, reflected energy and emitted energy are not negligible for the mid-infrared band for a cloud-free atmosphere in thermodynamic equilibrium (Figure 4). If the daytime channel radiation B i ( T i ) measured at the top of the atmosphere is expressed in the form of the Planck function in the mid-infrared channel i (3–5 μm), the radiance received by the satellite sensor can be approximated as follows [22]:
B i ( T i ) = B i ( T g _ i )   τ i ( θ ν , φ ν ) + R a t m _ i + R a t m _ i s
where T i and T g _ i denote the brightness temperature observed in channel i at the top of the atmosphere and at the sea surface, respectively. τ i ( θ ν , φ ν ) is the total atmospheric transmittance along the target-to-sensor path in channel i , R a t m _ i is the thermal radiation path in channel i , R a t m _ i s is the upward thermal radiation path from solar scattering radiation, and B i ( T g _ i ) is the radiation in channel i , which can be written as follows [35]:
B i ( T g _ i ) = ε i B i ( T s ) + ( 1 ε i ) ( R a t m _ i + R a t m _ i s ) + ρ b i R i s
where ε i is the emissivity of channel i , T i is the surface temperature, R a t m _ i is the downward atmospheric radiance defined as 1 ε i multiplied by the total atmospheric downward irradiance, R a t m _ i s is the hemispheric downward solar scattered radiation divided by π , ρ b i is the surface bidirectional reflectance in channel i (often referred to as the bidirectional reflectance distribution function (BRDF)) [36], and R i s is the solar irradiance of channel i at the sea surface, given by Equation (4):
R i s = E i cos ( θ s ) τ i ( θ s , φ s )
where E i is the solar irradiance at the top of the atmosphere in channel i ; θ s and φ s are the solar zenith angle and azimuth angle, respectively; and τ i ( θ s , φ s ) is the total atmospheric transmittance along the path from the sun to the sea surface in channel i . T g _ i 0 is defined as the brightness temperature over the ocean observed in channel i when there is no contribution from the direct solar beam:
B i ( T g _ i 0 ) = ε i B i ( T s ) + ( 1 ε i ) ( R a t m _ i + R a t m _ i s )
Then, Equation (5) becomes
B i ( T g _ i ) = B i ( T g _ i 0 ) + ρ b i R i s
Therefore, the surface bidirectional reflectivity ρ b i at the sea surface is obtained from the following equation:
ρ b i = B i ( T g _ i ) B i ( T g _ i 0 ) R i s
Assuming we have obtained the channel ground radiance or channel ground brightness temperature, with or without the involvement of the solar direct beam, and the solar irradiance at sea level in channel i , then according to Equation (7) we can retrieve ρ b i directly. Therefore, determining either the sea radiance or ground brightness temperature in channel i , without the contribution of the solar direct beam, is essential for obtaining the sea surface reflectance.

2.2.2. Retrieval of the Ground Brightness Radiation B ( T g _ i 0 )

When the center wavelength difference between two mid-infrared bands is minimal, and the bandwidth is narrow, such as the 22 and 23 channels of MODIS, it is often safe to assume that the surface reflectivity of both channels is equal. However, the hypothesis that the reflectivity of the two mid-infrared channels is approximately equal cannot be valid of FY-3D for two reasons. (1) The center wavelengths of channels 20 and 21 are far apart and the bandwidths differ. (2) The difference in solar illumination in these two wavelengths is very large, which leads to a large difference in the calculation results of the sea surface reflectivity of the two mid-infrared channels [37].
Therefore, we assume that (1) if the contribution of the direct solar beam is not considered, the surface brightness temperatures in channels 20 and 21 are equal (i.e., T g _ 20 0 = T g _ 21 0 = T g 0 ); and (2) the sea surface bidirectional reflectivity values in channels 20 and 21 have a linear relationship as in Equation (8)
ρ b 21 = k ρ b 20 + b
where k and b are the slope and intercept, respectively. To find the reflectivity relationship coefficients applicable to FY-3D mid-infrared 20 and 21 channels for the sun glint over the southern Indian Ocean in summer, we choose the forward mid-infrared radiative transfer model, i.e., Equation (2), and use MODTRAN4-MODerate resolution atmospheric TRANsmission (MODTRAN, PcModWin 4.0 v3r1 Vision 1.2), which is one of the most widely used software packages to simulate the atmospheric transmittance in both directions as well as the upward and downward atmospheric radiation in both channels [38]. The ECMWF temperature product is used to compute the sea surface emission and obtain the sea surface temperature using Planck’s equation. The sea surface emissivity for the mid-infrared channel is obtained using the emissivity library data provided by UCSB, Santa Barbara, California, USA. The initial values of sea surface bidirectional reflectivity for the two mid-infrared channels can be obtained by using Equation (3), and the relationship between the two channels can be established by a linear fit. The coefficients k and b can be obtained by performing a linear fit.
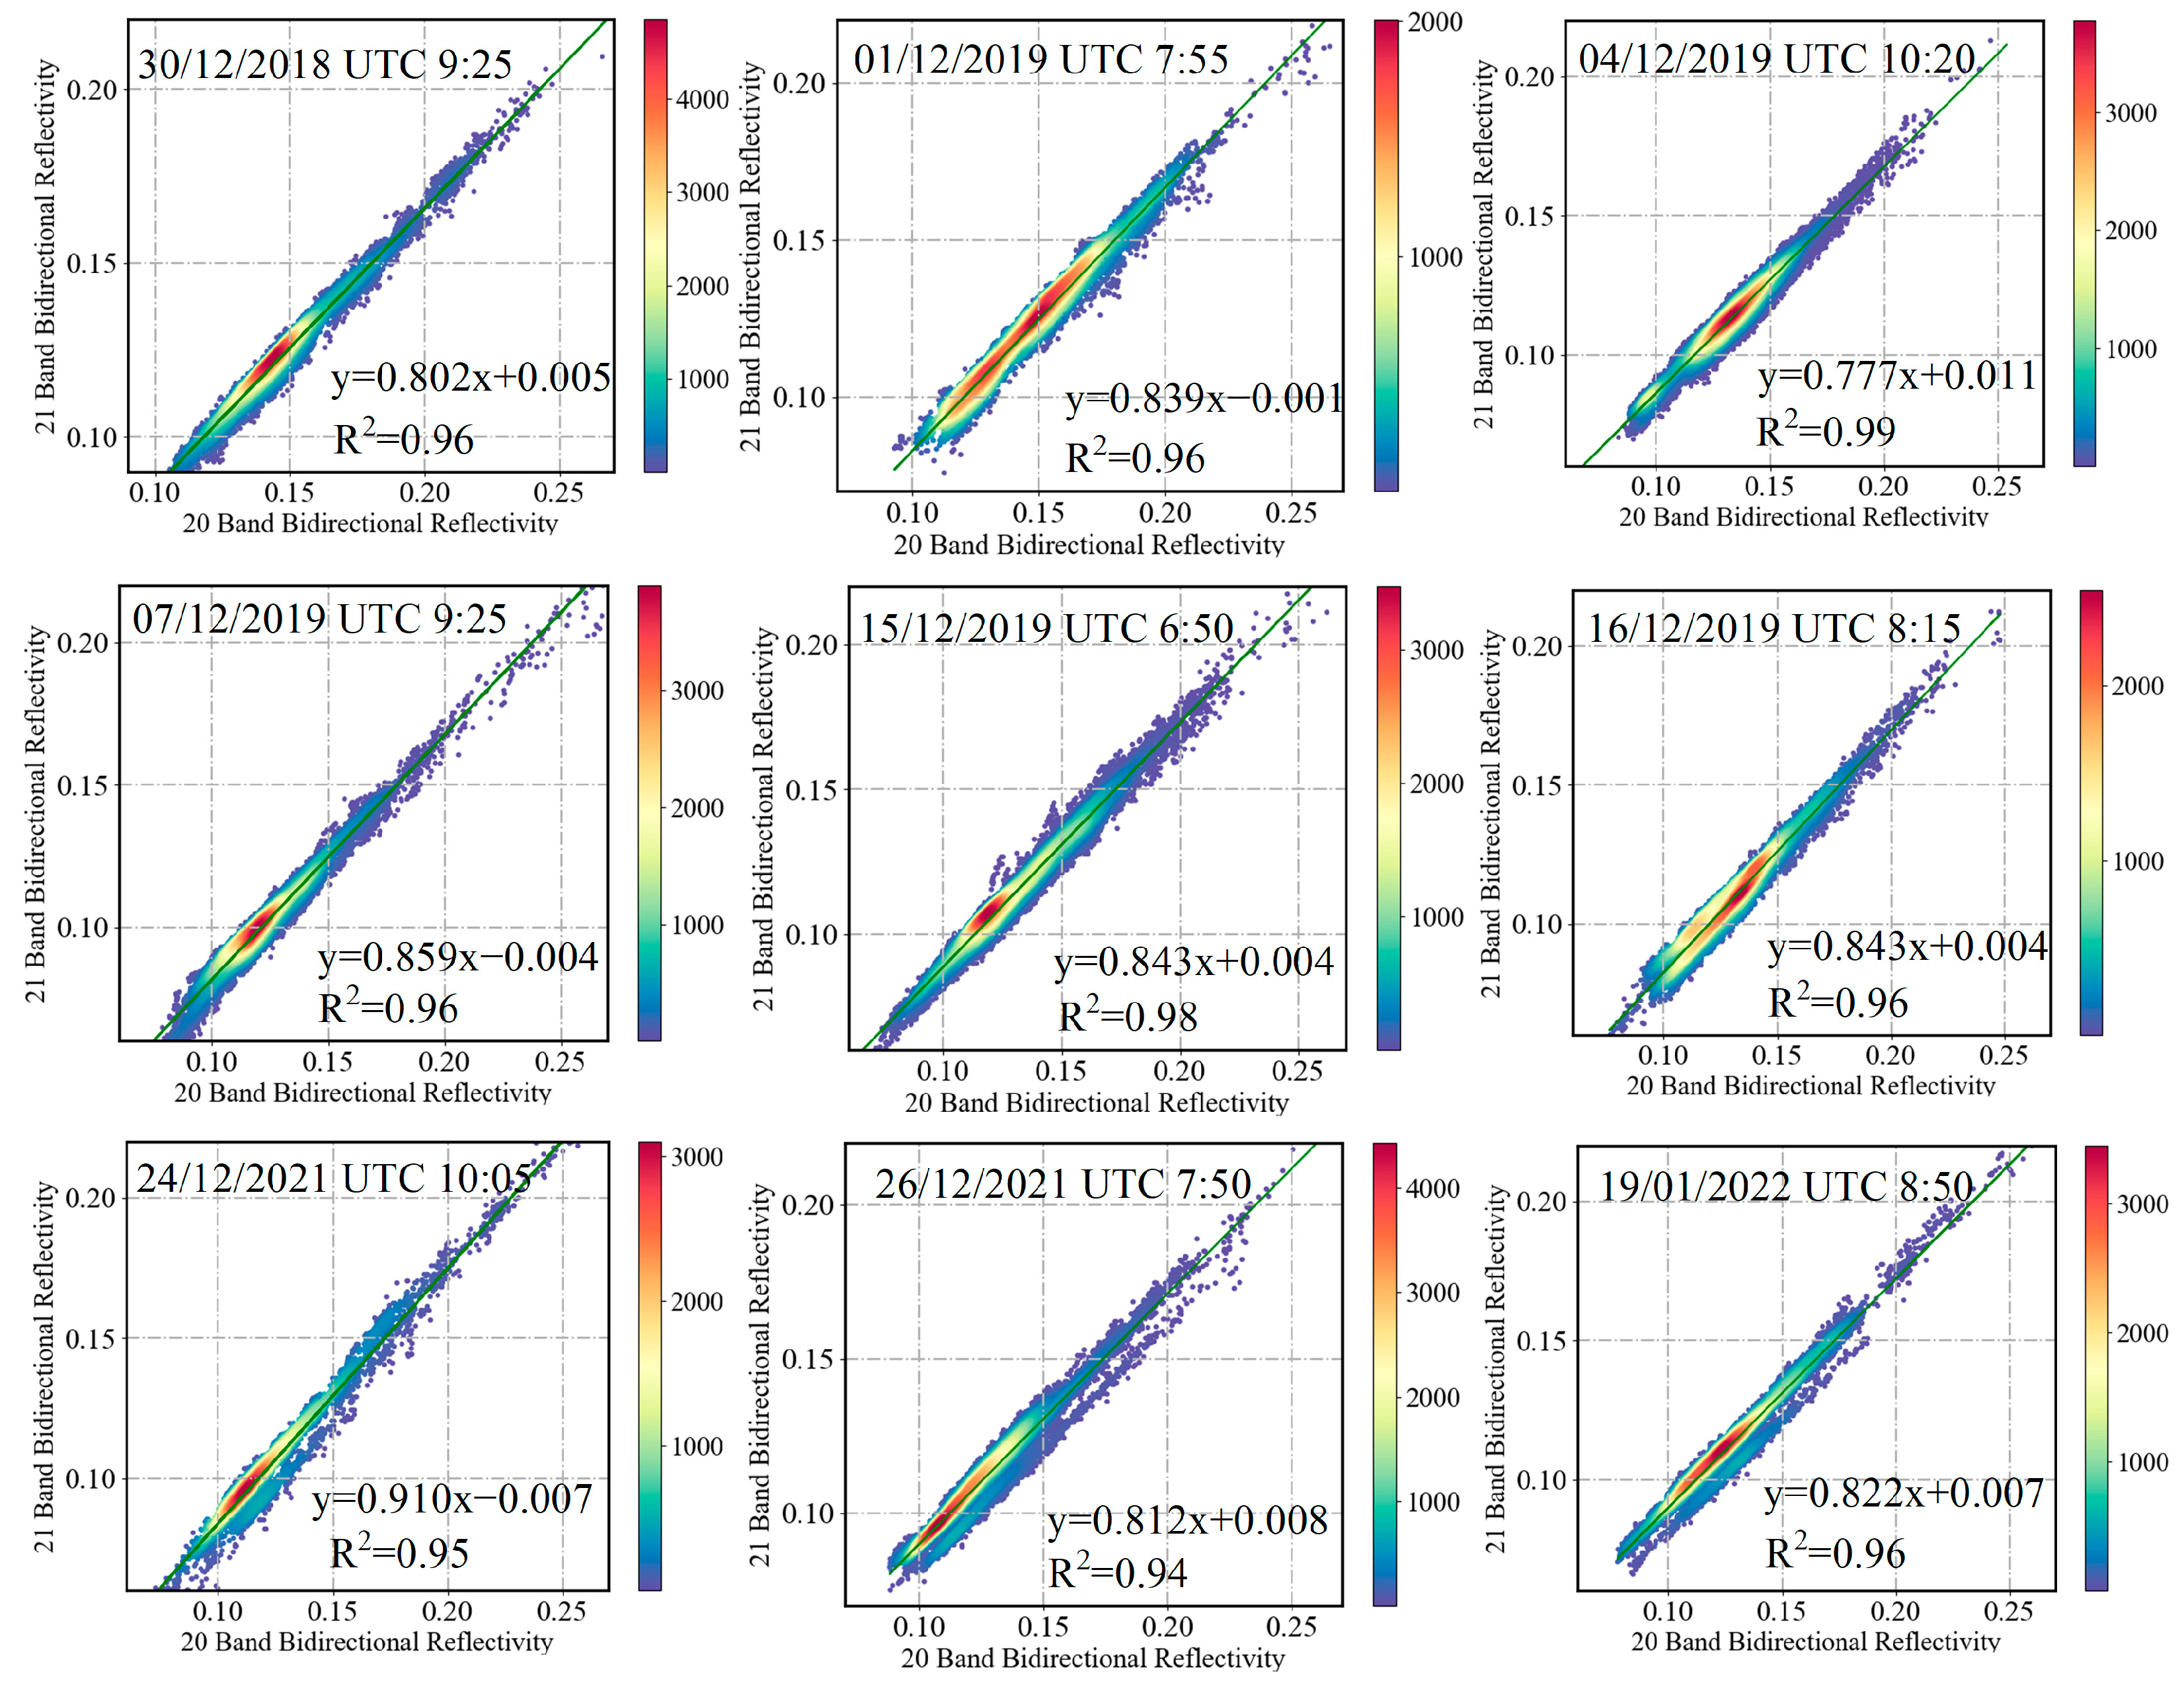
The coefficients k and b , calculated from samples collected between December 2018 and January 2022, are illustrated in Figure 5. The correlation coefficients indicate that channels 20 and 21 are strongly correlated with each other as assumed, and the correlation coefficients can reach 0.9 or more. This study calculates the linear regression parameters of a total of 176 sample areas to obtain k = 0.877 ± 0.062 and b = 0.006 ± 0.0026 .
Equation (8) is then rewritten in the form of Equations (9) and (10) as follows [39]:
B 20 ( T g _ 20 ) = B 20 ( T g 0 ) + ρ b 20 R 20 s
B 21 ( T g _ 21 ) = B 21 ( T g 0 ) + ( k ρ b 20 + b ) R 21 s
Obtaining the first-order Taylor expansion of the radiant energy with respect to T g 0 and eliminating ρ b yields the following:
( T g 0 T g _ 20 ) = A 1 A ( T g _ 20 T g _ 21 ) + B 1 A
A and B are defined by the following equations:
A = R 20 s R 21 s B 21 / T B 20 / T 1 k   a n d   B = b R 20 s k B 20 / T
From Equation (10), it can be considered that if the coefficients are constants, the sea surface temperature T g 0 is a linear combination of T g _ 20 and T g _ 21 . To demonstrate this, the study evaluates the effects of different meteorological conditions observed using the radiative transfer model MODTRAN4. Given that the study area is the southern Indian Ocean in summer, five atmospheric profiles in MODTRAN4 (tropical atmosphere, mid-latitude summer atmosphere, mid-latitude winter atmosphere, subarctic zone summer atmosphere, and 1976 U.S. standard atmosphere) are used to simulate the regression parameters. As noted in Section 5.1, water vapor and aerosols have a large influence, so three aerosol models (no aerosol or clouds, navy maritime, and maritime) are selected. Additionally, the water vapor content varies between 0 and 6.5 g/cm2 in steps of 0.4 g/cm2, the ozone and carbon dioxide contents are set to default values, and the horizontal visibility is determined by the aerosol model. The downward atmospheric irradiance of channels 20 and 21 for the FY-3D mid-infrared band are simulated and, with the atmospheric transmittance of the solar-to-surface direction channel, 255 sets of atmospheric parameters are simulated. On this basis, the reasonable sea surface temperature variation range for mid-latitude summer is set to 294.2~305.2 K. The emissivity variation range of the two channels is set to 0.96~1, and the sea surface reflectivity variation range of channel 21 is 0~0.4. The sea surface reflectivity corresponding to channel 21 is determined by Equation (8) and combined with the initial values of the sea surface reflectivity values of channels 20 and 21 determined in a previous study. The relationship between T g _ 20 T g _ 21 and T g 0 T g _ 20 is calculated for a solar zenith angle of 0°.
The relationship should be linear, as predicted in theory by Equation (10). However, considering the higher-order Taylor expansion and the fact that the relationship between the Planck function and temperature is nonlinear, the relationship between the three is more in line with the quadratic function, i.e., the split-window technique [34], and is given by Equation (12):
( T g 0 T g _ 20 ) = a 1 + a 2 ( T g _ 20 T g _ 21 ) + a 3 ( T g _ 20 T g _ 21 ) 2
where T g 0 T g _ 20 is the term on the left side of the equation and a 1 , a 2 , and a 3 are the coefficients that depend on the solar zenith angle ( S Z A ). The polynomial function in Equation (13) is employed to demonstrate the connection between a i and S Z A :
a i = b i + b 2 i cos ( S Z A ) + b 3 i cos 2 ( S Z A )
where b i , b 2 i , and b 3 i are constants. The coefficients of the quadratic equation corresponding to the regression relationship between T g _ 20 T g _ 21 and T g 0 T g _ 20 at different solar zenith angles are calculated, and then the relationship between the coefficients and the cosine value of the solar zenith angle is fitted. Figure 6 shows that the fit between the solar zenith angle and the regression parameters is extremely strong, and the correlation coefficients are greater than 0.95.
From this, we can obtain each parameter in Equation (12), and according to the different solar zenith angles corresponding to each pixel, we can directly determine the brightness temperature of channel 20 without contributions from the direct solar beam and then determine the energy of channel 20 according to the Planck function; we can separate the energy of the sea surface reflected solar radiation and the energy with no contributions from the direct solar beam and finally determine the bidirectional reflectivity of the channel 20.

3. Sea Surface Bidirectional Reflectivity Results

Based on the proposed method in Section 2.2, the process of calculating the bidirectional reflectivity of the channel 20 in the sea surface glint area is conducted in four stages. Stage 1, 2, and 3 correspond to the content in the three dotted boxes in the second part of Figure 3.
-
Stage 1: MODTRAN4 is used to simulate the corresponding R a t m _ 20 and R a t m _ 21 , R a t m _ 20 s and R a t m _ 21 s , τ 20 ( θ ν , φ ν ) , τ 21 ( θ ν , φ ν ) , and τ 20 ( θ s , φ s ) for each pixel under the real observation geometry and atmospheric conditions. Then B 20 ( T g _ 20 ) and B 21 ( T g _ 21 ) can be obtained using Equation (2).
-
Stage 2: B 20 ( T g _ 20 ) and B 21 ( T g _ 21 ) obtained in Stage 1 can be used to determine T g _ 20 and T g _ 21 in terms of the Planck function. The sea surface brightness temperatures without contributions from the direct solar beam T g _ 20 0 are calculated from the solar zenith angle corresponding to each pixel in the sample according to the Equation (12) of which the parameters are shown in Figure 6. Then B 20 ( T g _ 20 0 ) can be obtained from the Planck function.
-
Stage 3: Determine R 20 s based on E 20 , θ s , and the simulated τ 20 ( θ s , φ s ) which was precomputed in Stage 1.
-
Stage 4: Once B 20 ( T g _ 20 ) , B 20 ( T g _ 20 0 ) , and R 20 s have been calculated in Stage 1, 2, and 3, respectively, the ρ 20 can be determined referring to Equation (7).
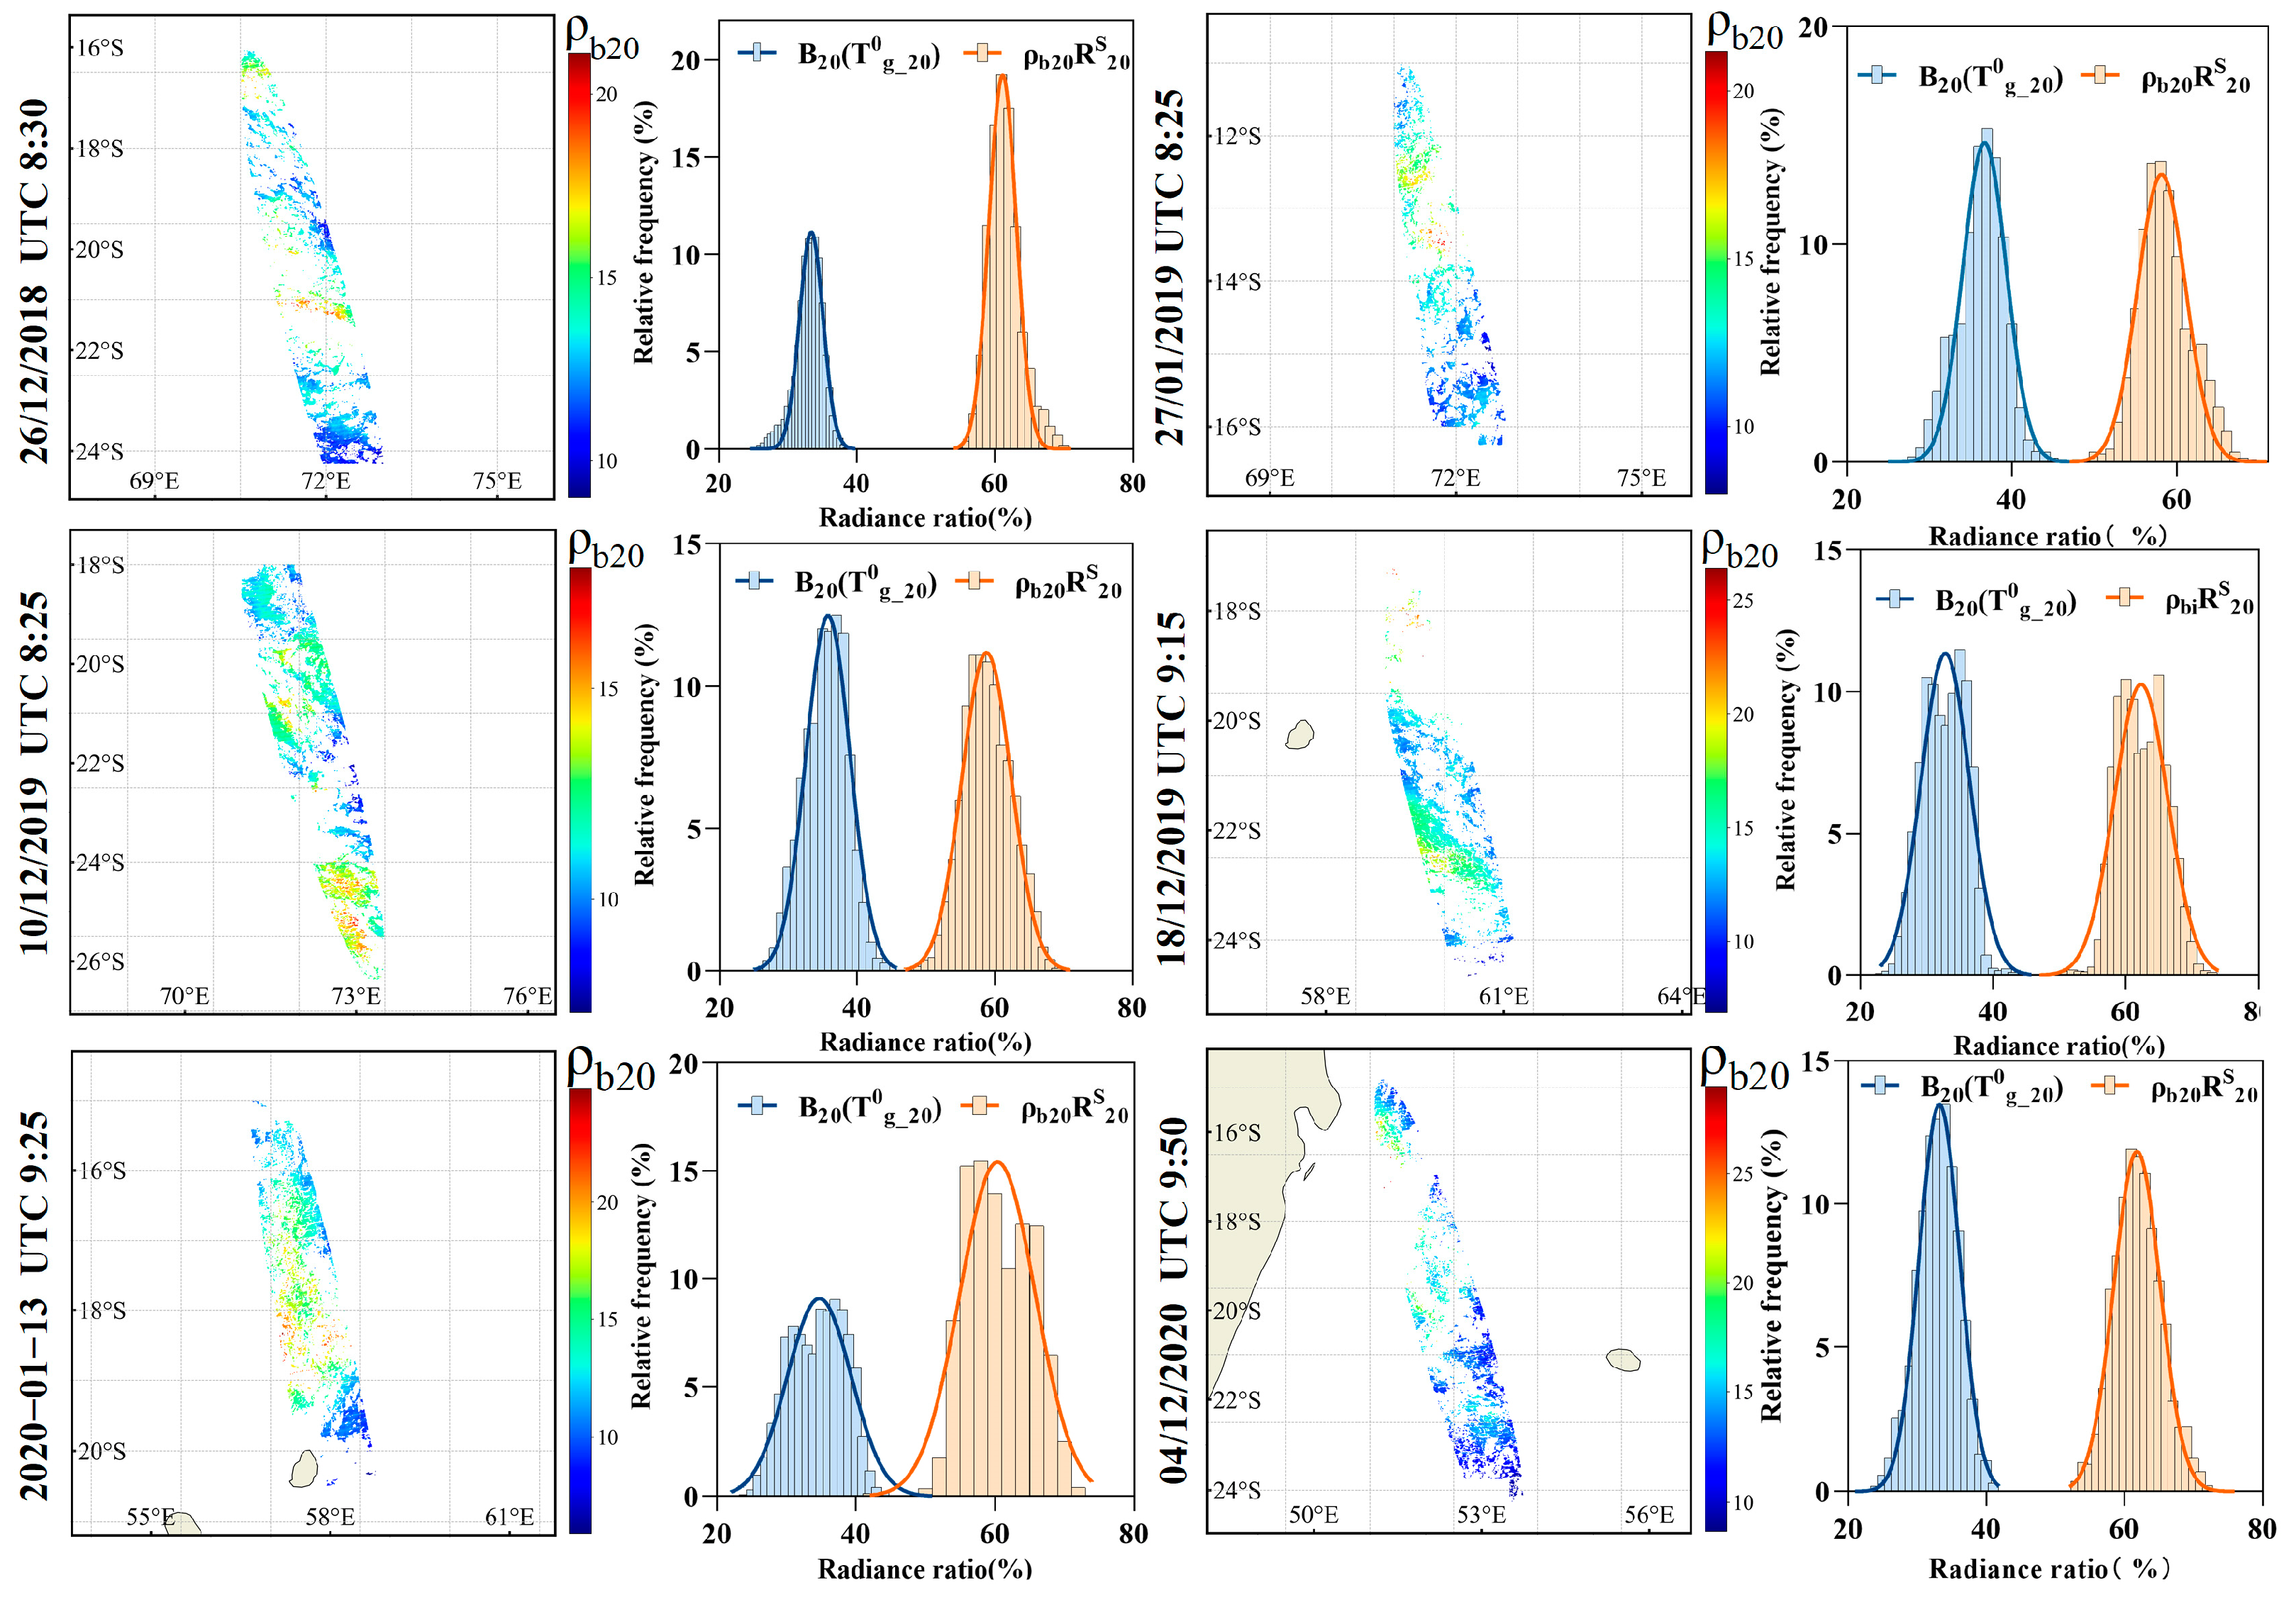
The calculated results of the bidirectional reflectance of the sea surface for six samples from December 2018 to January 2022 (Figure 7), the distribution of the energy excluding any input from direct solar radiation, and the percentage of the reflected energy from the sea surface relative to the energy received by the sensor are shown in the figure. The variation range of the sea surface reflectivity of channel 20 in the sample area is 10~25%, the sea surface energy excluding any input from direct solar radiation accounts for approximately 30% of the sensor incident energy, the contributions from the direct solar beam account for approximately 70% of the sensor incident radiance, and the energy of upward atmospheric thermal radiation accounts for less than 3%. These observations are consistent with the reflectivity characteristics of sun glint.

4. Precision Test

Since the reflectivity of the infrared channel in the FY-3D/MERSI-2 data is the reference for the calibration validation of the VNIR-based reflectance deviation in the sea surface glint, the evaluation of the accuracy of the results is a necessary step in the calibration validation model. It is challenging to directly compare the calculated reflectance of the channel 20 in the sun glint over the sea with the measured data because the FY3D mid-infrared data have a resolution of 1 km, making it very difficult to directly obtain the mid-infrared reflectance of the sea surface using instruments. Additionally, there are no relevant data products that have been found so far. Therefore, this study uses emissivity data and sea surface temperature data products to verify the accuracy method.
According to Equations (2) and (3), if the sea surface temperature and the channel 20 sea surface emissivity have been obtained, the brightness temperature of the channel 20 sea surface excluding any input from direct solar radiation can be calculated directly, and then the sea surface reflectivity can be calculated. Therefore, this section first uses the emissivity library data of UCSB and the sea surface temperature data to calculate the sea surface radiant energy of channel 20 without contributions from the direct solar beam, and then uses Equation (3) to calculate the sea surface reflectivity. The difference Δ ρ b 20 between the sea surface reflectivity using the emissivity library and the sea surface temperature product and the sea surface reflectivity obtained using the model is employed to evaluate the accuracy of the results.
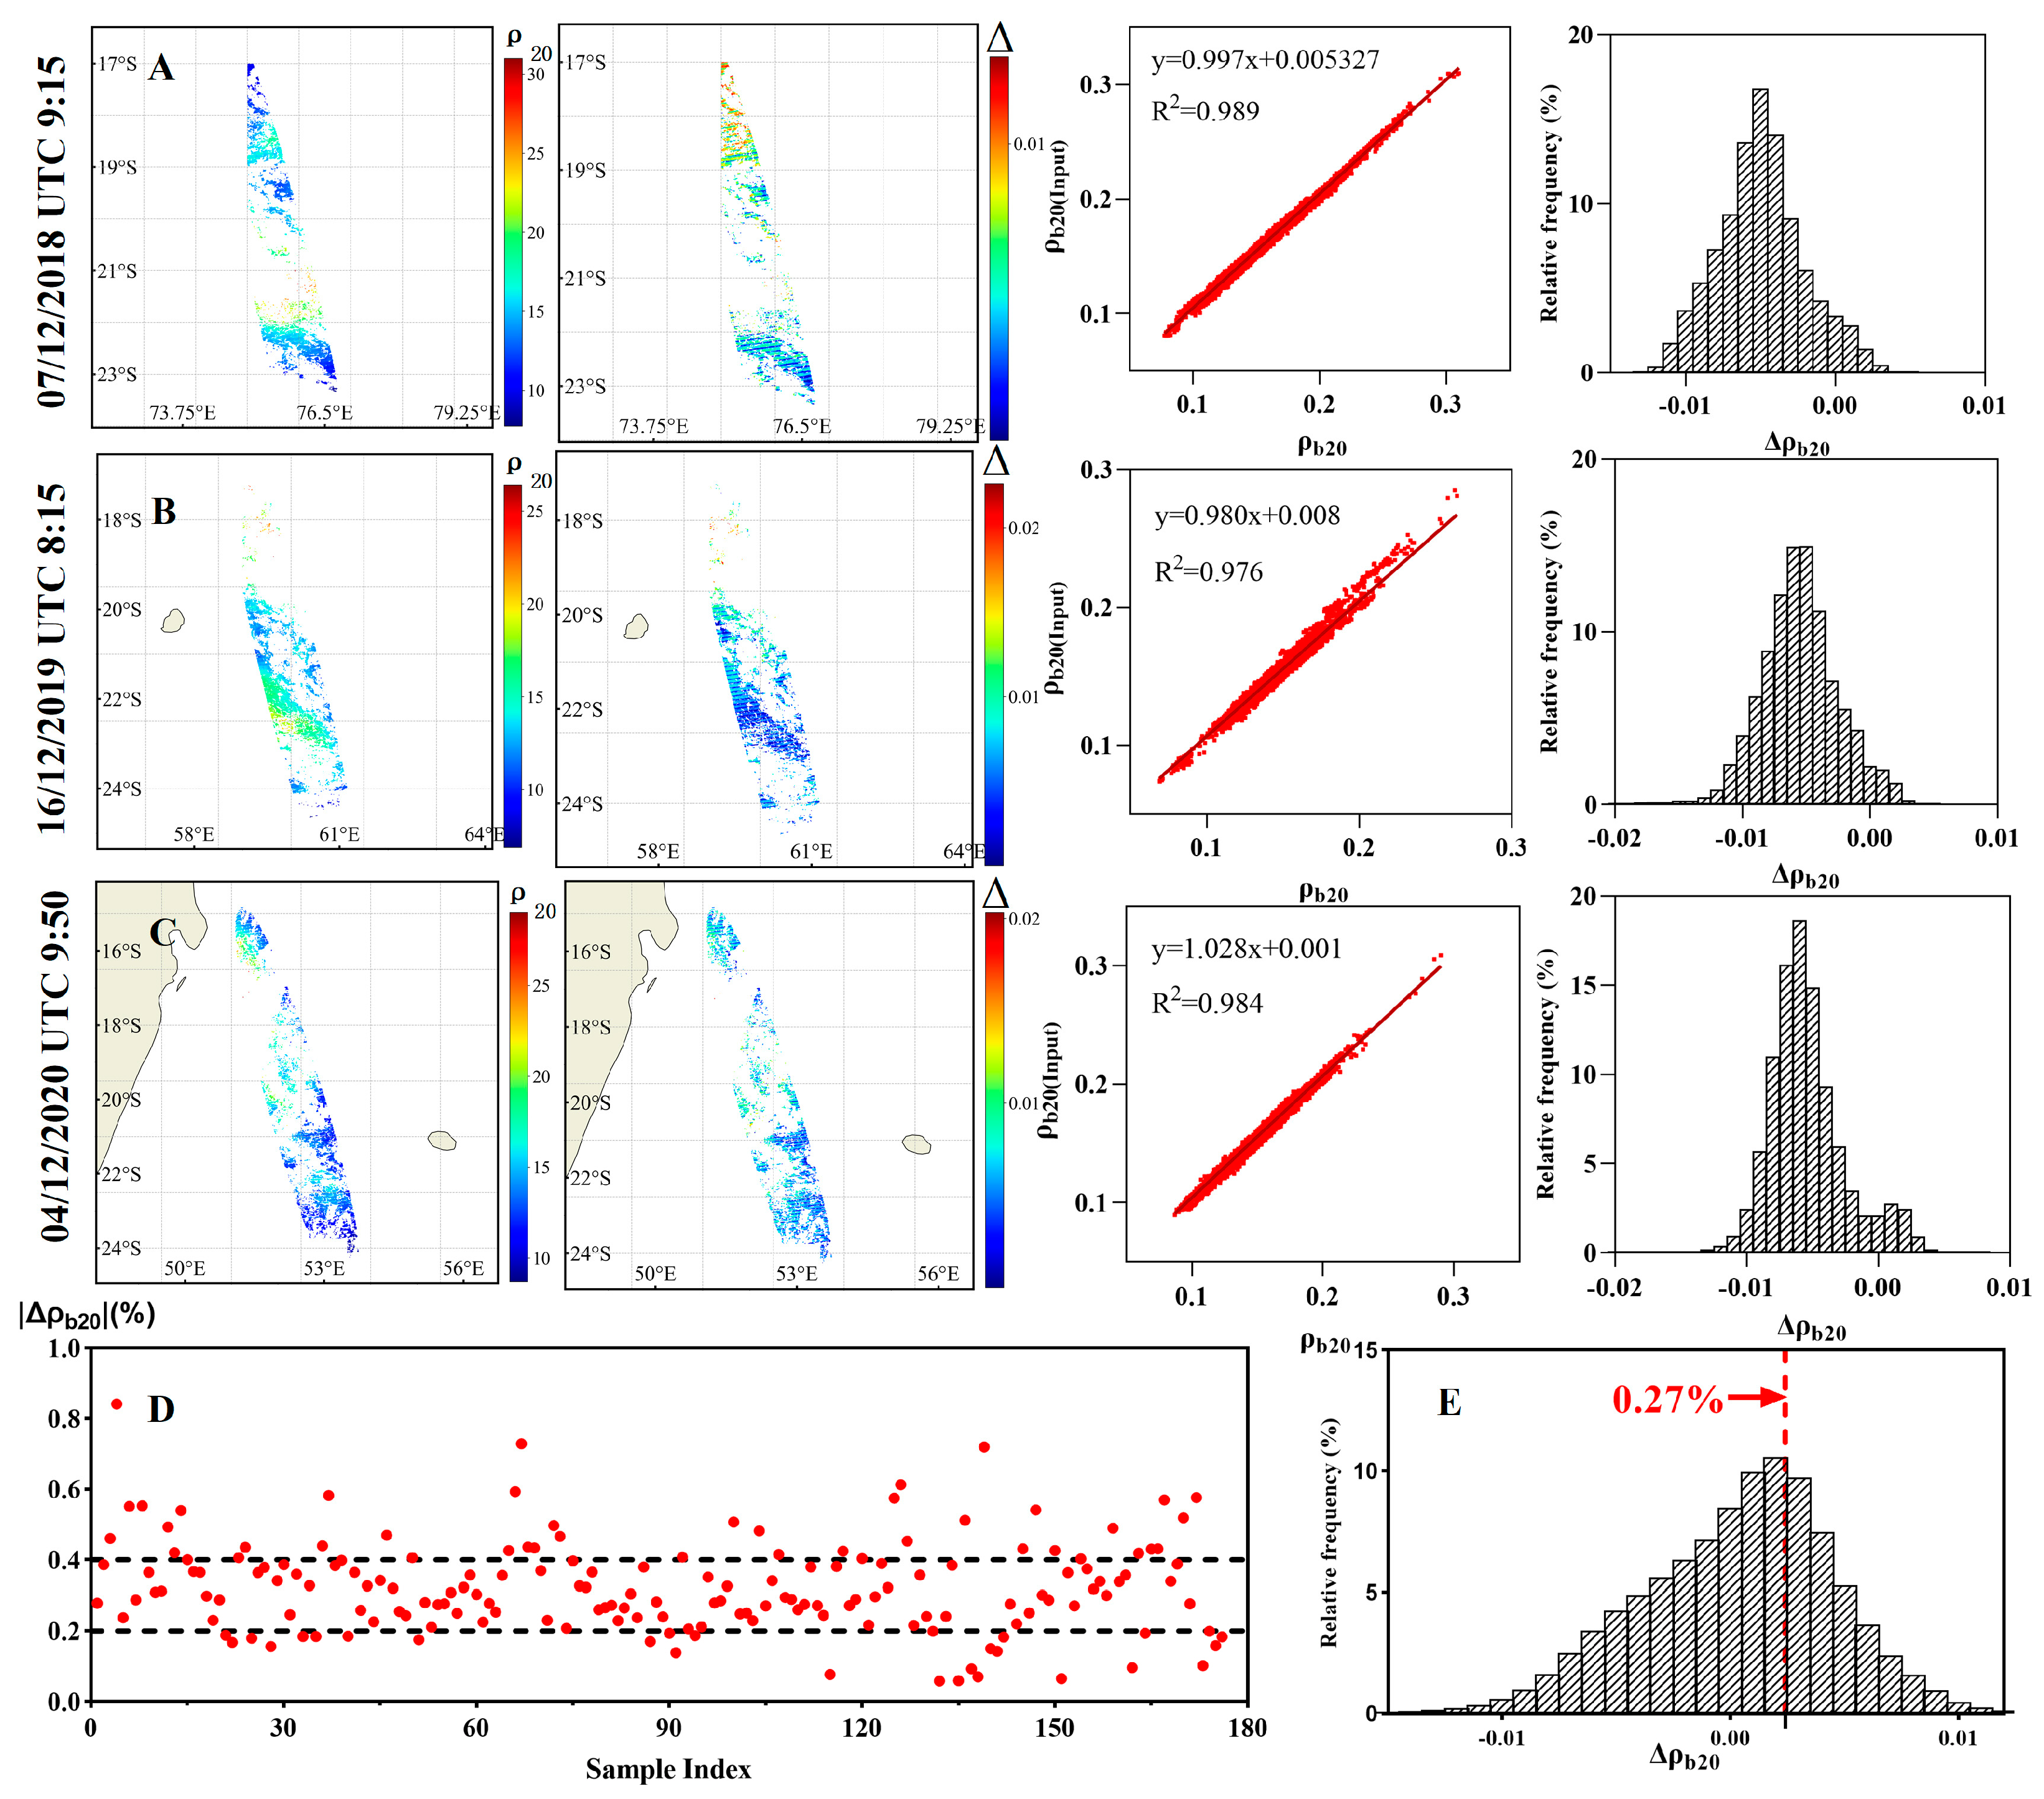
The differences in the channel 20 reflectivity in each sample area were determined. The first column in the A, B, and C of Figure 8 shows the calculated results of the sea surface reflectivity, and the second, third, and fourth columns correspond to the spatial distribution of the differences, the fitting relationship between them, and the statistical distribution of the differences, respectively (Figure 8D). Rows A, B, and C depict the precision of the calculation findings for samples with varying sea surface reflectance ranges. It can be seen that the majority of the sea surface reflectance of sample C is blue, indicating that compared to the sea surface reflectance of A and B, the difference is not substantial. The difference does not appear to be inconsistent with the reflectivity calculation findings. Viewed from each column, there is no obvious regularity in the difference from the spatial distribution. The R2 above 0.95 indicates that the initial values of reflectivity and the sea surface reflectivity obtained by using the nonlinear split-window model fit well and statistically conform to a Gaussian distribution. The absolute value of the difference of 176 samples is concentrated in 0.2–0.4% (Figure 8D), and the mean value of the difference is 0.27%, with an RMSE of 0.0066 (Figure 8E), so the results can be considered reasonable.

5. Error Analysis

5.1. Analysis of Factors on Transmittance of Mid-Infrared

This study examines the factors that impact the sensor’s transmittance within the wavelength range of 3.4–4.2 μm in order to identify the influential factors for the uncertainty analysis.
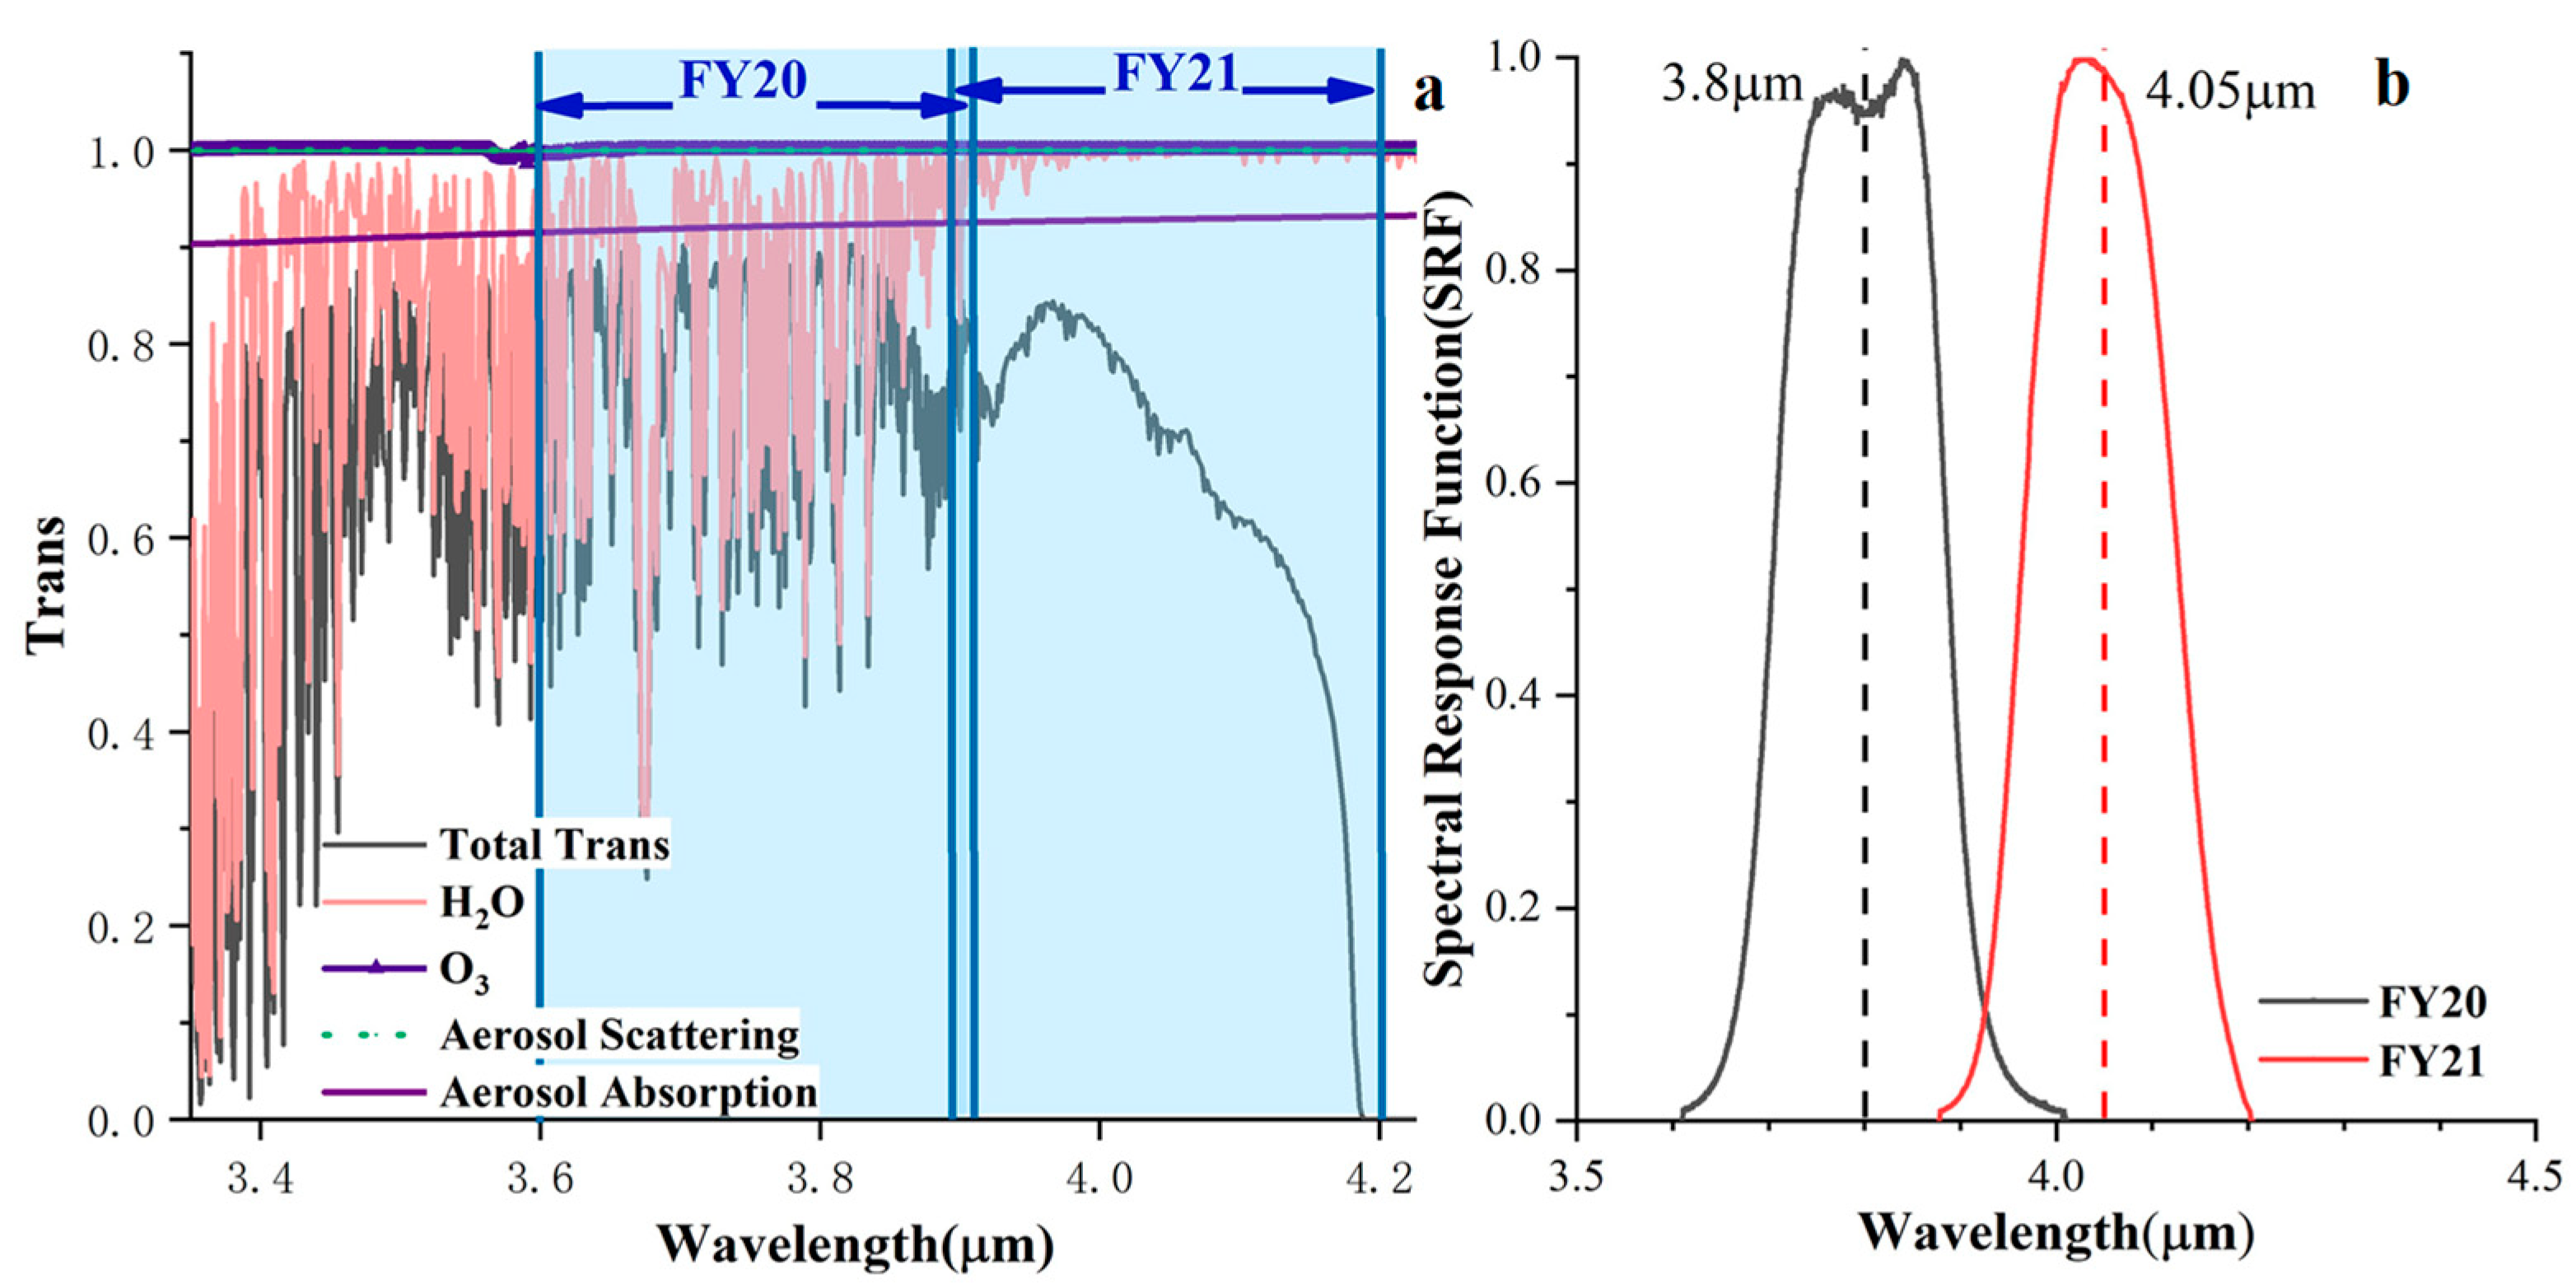
First, MODTRAN4 was used to quantify the variation in the transmittance of the two mid-infrared channels. The figure shows that the effect of ozone exerts a weak influence on the transmittance over the whole 3.4~4.2 μm range (Figure 9). The effect of water vapor has a significant impact, and numerous absorption intervals exist in the 3.4~4.2 μm band range. The effect of water vapor on channel 20 cannot be ignored when setting the simulated atmospheric parameters and analyzing the uncertainty factors, whereas channel 21 is less affected by water vapor. The absorption effect of aerosols decreases with increasing wavelength, which is also a non-negligible meteorological parameter. The effect of aerosol scattering on channels 20 and 21 is basically negligible compared to the absorption effect.
To thoroughly analyze the effect of different meteorological and observational conditions on the reflectivity calculation, the variation in transmittance ( ς ) is studied under different conditions. Figure 10 shows that channel 21 is not sensitive to water vapor, while channel 20 exhibits a sharp decrease and then a flattening process as the water vapor increases from 0 to 5 g/cm2, and the magnitude of the change reaches approximately 20%. Therefore, channel 20 exhibits high sensitivity to fluctuations in water vapor, which cannot be replaced by default values when setting meteorological parameters and needs to be calculated separately in the uncertainty analysis. In terms of horizontal visibility (VIS), t transmittance rises from 5% to 80% in the 0–25 km range before flattening off, which shows that horizontal visibility is also an important factor affecting the transmittance. However, because pixels with a high aerosol optical thickness were excluded during the data filtering, the pixels in the sample area are under cleaner atmospheric conditions with higher horizontal visibility, so the effect of horizontal visibility on the reflectance calculation is mild compared to that of water vapor. The sensor view zenith angle (VZA) has a consistent effect on both channels, with a significant effect at zenith angles greater than 20. Since the reflectivity is calculated using the actual VZA for a pixel, it is not taken into account in the uncertainty analysis.

5.2. Error in Sea Surface Reflectance of Infrared Channels in Model Calculations

This study considered three potential sources of error: the error connected to the two hypotheses assumed in the development of the suggested method; the error connected to instrument noise; and the error brought on by the atmospheric correction, including uncertain optical thicknesses, and water vapor, as stated in Section 5.1 of the study.
In this study, 5% of the average water vapor content of all sample areas, i.e., 0.8 g/cm2, is applied as the range of variation in water vapor content, and the difference in reflectivity is determined for each sample with a 0.8 g/cm2 variation in the water vapor content of each pixel (Figure 11). The range of the difference in reflectivity affected by the change in water vapor is in the range of 0.5% to 1.5%, and the statistical result of the effect of the change in water vapor content on reflectivity is 1.16%, corresponding to a root mean square error (RMSE) of 0.0036.
The absorption and scattering of aerosols have a non-negligible effect on the radiant energy received by the sensor. In the MODTRAN4 simulation, there is a conversion relationship between the aerosol optical thickness and the horizontal visibility, and this study directly uses the change in horizontal visibility to reflect the change in the aerosol optical thickness and the associated impact on the reflectivity calculation. The aerosol data used in the study are from the MOD08_D3 global daily data product. The research shows that the relative error between MODIS and AErosol Robotic NETwork (AERONET) aerosol optical depth products at 550 nm based on 47 sample points in the Indian Ocean region is 7% [40]. All of the sample areas chosen for the study were in deep sea locations with clear skies, meaning that the inversion of aerosol optical depth was not significantly influenced by cloud cover. Therefore, the researchers were able to use the 7% directly as the error rate for aerosol data. Thus, 7% of the average value of the horizontal visibility in the sample area, i.e., 5 km, is used as the change in the horizontal visibility, and the variation in reflectivity is calculated for each sample based on the horizontal visibility of each pixel and a 5 km change in this visibility. The range of variability is between 0.2% and 1%, and the statistical result of the effect of horizontal visibility variation on reflectance is 0.34%.
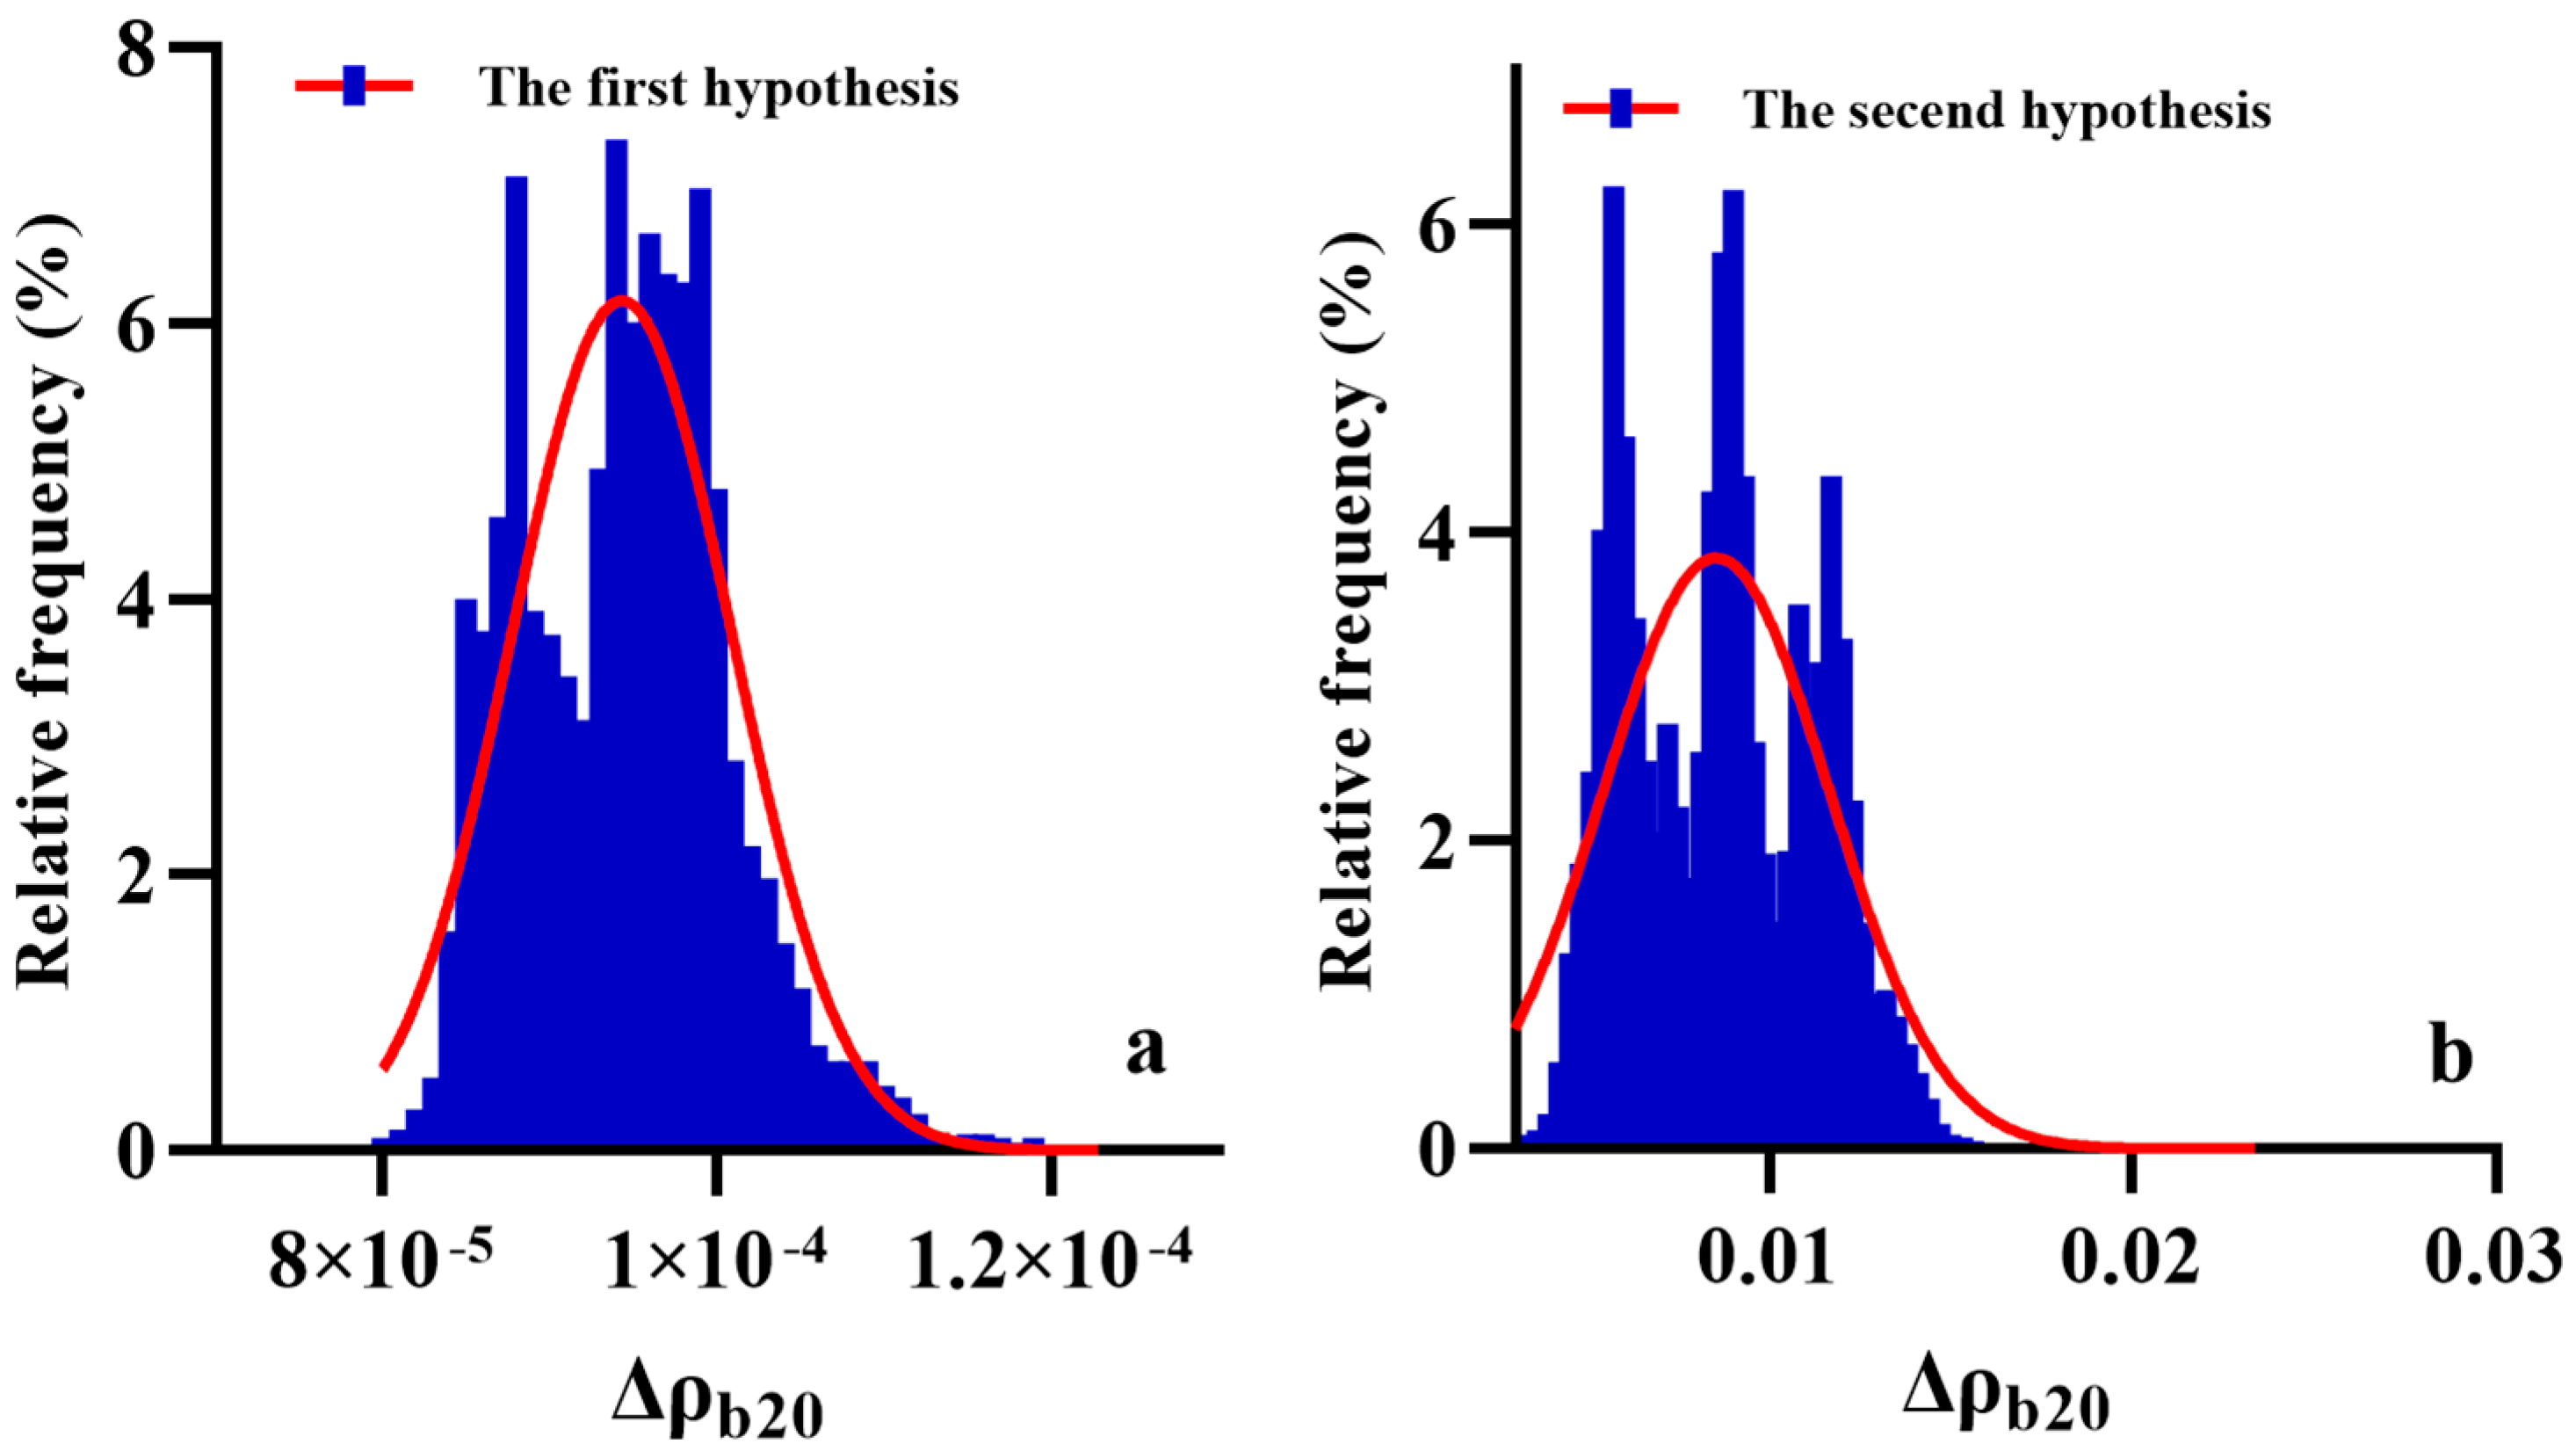
To quantitatively evaluate the effect of the first hypothesis on the results of the reflectivity, the sea surface reflectivity data for channels 20 and 21 from UCSB and the sea surface temperature products from ECMWF were used to calculate the brightness temperatures of the sea surface without contributions from the direct solar beam for channels 20 and 21 in combination with the atmospheric radiation parameters simulated by MODTRAN4 for each sample area. Based on the direct calculation of the sea surface, the difference between the model calculation and the exact value was calculated. The calculated results show that the mean value of the reflectivity differences is 0.01% (Figure 12a), so the assumption of equal brightness temperatures in the absence of contributions from the direct solar beam in both channels is considered to cause an uncertainty of 0.01% in the reflectivity calculation results, corresponding to an RMSE of 0.0004.
The uncertainty In the reflectivity calculations caused by the second hypothesis, that the mid-infrared channel reflectivity is linear, was evaluated. The qualifying relationship calculated for each sample is introduced into the model to calculate the sea surface reflectivity of the channel for that sample area under this linear relationship and is then compared with the exact reflectance to obtain the effect of this qualifying condition on the reflectivity calculation. The change in reflectance calculation due to a change in the two-channel reflectance limits for all 176 sample areas is calculated, and the results show that the effect of a change in the two-channel reflectivity limits on the calculation is 0.83% (Figure 12b).
To evaluate the effect of the sensor’s noise in the two channels on the reflectance calculation, the NEΔT (K) of both channels 20 and 21 of FY-3D is 0.25 K, which is the brightness temperature at the top of the atmosphere for both channels, with rounding. In the evaluation process, noise is added to the top-of-atmosphere brightness temperature of the two channels separately. Then, the sea surface reflectance is calculated using the mid-infrared sea surface temperature inversion method in this study. Due to the small fluctuation range of the reflectivity error caused by noise, the contribution of the reflectivity uncertainty caused by noise in the two channels is considered to be 0.03%.
Table 3 shows the statistical results of the model calculation of the uncertainty synthesis of the sea surface reflectivity. From the table, it can be seen that the first hypothesis and the instrument noise for the two mid-infrared channels have small and almost negligible contributions to the total uncertainty. The contributions of water vapor content and aerosol optical thickness are 1.16% and 0.34%, respectively, which are consistent with the results of the uncertainty analysis of the mid-infrared channel transmittance to the atmospheric parameters analyzed. In addition, for the mid-infrared sea surface reflectivity, the contribution of the second hypothesis to the uncertainty is also large, 0.83%. It is feasible and within acceptable uncertainty to calculate the mid-infrared sea surface reflectivity of the FY-3D/MERSI-2 data using the improved nonlinear split-window algorithm in this paper.

6. Discussion

In the part of precision testing in this research, the difference between the sea surface reflectivity calculated from the sea surface temperature and emissivity data combined with Equations (2) and (3) and the reflectivity calculated from the model are used. In addition, another method for accuracy verification is to compare the brightness temperatures of the sea surface without contributions from the direct solar beam. This method is to make a difference between the sea surface brightness temperature back-calculated based on the actual temperature and emissivity data and the sea surface brightness temperature calculated by Equation (7) based on the actual temperature data and emissivity. The two approaches are nearly identical [30,41].
The FY-3D compared with the VIIRS and MODIS sensors in the infrared band reflectivity calculation accuracy is similar, and the main source of error is water vapor [33]. However, the effects of water vapor and aerosols on the MODIS sensor are approximately 0.2%, which are significantly smaller than those of the FY-3D and VIIRS sensors. This may be because the latter uses sun glint as the study area for reflectivity calculation, and its sea surface reflectivity is significantly higher than that without sun glint. In contrast to the VIIRS sensor, the contribution of the qualifying relationship between the two mid-infrared channels to the total uncertainty still accounts for one of the main constituents, which indicates that even though the study has used an improved method, the nonlinear split-window algorithm, to calculate the reflectance of the mid-infrared channels at the surface, this relationship is still one of the areas that needs further improvement in future work.
To remove the influence of sun glint, the Sentinel-2 MSI imagery data use the GRS (Glint Removal for Sentinel-2) processor, which was proposed by Harmel et al. as a linked atmospheric sun glint correction technique [42]. The comparison of sea surface reflectivity before and after GRS shows that the reflectivity of the sun glint area is much higher than that of the non-sun-glint area, and the reflectivity of the central area of the sun glint area is three times that of the edge area, which is consistent with the results of this study’s calculations. Latitude has a large influence on the reflectivity of the sun glint area, emphasizing the importance of screening the dataset by latitude and longitude in this study [43]. The effect of the solar zenith angle on reflectivity calculation results cannot be ignored. This study uses an accurate sun zenith angle, which substantially eliminates the influence of observation geometry on the calculation findings.

7. Conclusions

The results show that the variation range of the sea surface reflectivity of channel 20 in the sample area is 10~25%. The mean value of the reflectivity difference obtained from the model simulation is 0.27%, and the RMSE is 0.0066. The study considered three potential sources of error, namely, atmospheric conditions, hypothesis of model, and instrumental noise. The effects of atmospheric conditions are the greatest, and the errors are 1.16% and 0.34% for water vapor and aerosol optical thickness, respectively. Additionally, errors that come from the second hypothesis are 0.83%. The reflectivity calculation model based on the nonlinear split-window algorithm for the sea surface glint region is applicable to the FY-3D mid-infrared channel and can be used as a reference for calibration based on sun glint. The mid-infrared spectral band is less commonly independently used for reflectivity calculation because it is affected by both surface thermal radiation and solar reflective radiation.

Author Contributions

Conceptualization, W.C. and B.P.; methodology, B.P.; software, H.W.; validation, X.H. and H.T.; formal analysis, W.C. and B.P; investigation, G.L.; resources, X.H.; data curation, F.Z.; writing—original draft preparation, B.P.; writing—review and editing, B.P.; visualization, H.W.; supervision, H.T.; project administration, W.C.; funding acquisition, X.H. All authors have read and agreed to the published version of the manuscript.

Funding

This work was supported by the National Key R&D Program of China under Grant 2022YFB3903005 and Grant 2022YFB3903201, (Corresponding author: Wei Chen).

Data Availability Statement

Not applicable.

Conflicts of Interest

The authors declare no conflict of interest.

References

  1. Yang, G.; Liu, Q.; Liu, Q.; Huang, W.; Wang, J. Simulation of high-resolution mid-infrared (3–5 μm) images using an atmosphere radiative transfer analytic model. Int. J. Remote Sens. 2009, 30, 6003–6022. [Google Scholar] [CrossRef]
  2. Granlund, L.; Keski-Saari, S.; Kumpula, T.; Oksanen, E.; Keinänen, M. Imaging lichen water content with visible to mid-wave infrared (400–5500 nm) spectroscopy. Remote Sens. Environ. 2018, 216, 301–310. [Google Scholar] [CrossRef]
  3. Capelle, V.; Hartmann, J.M. Use of hyperspectral sounders to retrieve daytime sea-surface temperature from mid-infrared radiances: Application to IASI. Remote Sens. Environ. 2022, 280, 113171. [Google Scholar] [CrossRef]
  4. Ottaviani, M.; Stamnes, K.; Koskulics, J.; Eide, H.; Long, S.R.; Su, W.; Wiscombe, W. Light reflection from water waves: Suitable setup for a polarimetric investigation under controlled laboratory conditions. J. Atmos. Ocean. Technol. 2008, 25, 715–728. [Google Scholar] [CrossRef]
  5. Kim, D.; Cho, J.; Hong, S.; Lee, H.; Won, M.; Byun, S.; Park, K.; Lee, Y.-W. First retrieval of fire radiative power from COMS data using the mid-infrared radiance method. Remote Sens. Lett. 2017, 8, 116–125. [Google Scholar] [CrossRef]
  6. Jiang, G.-M.; Li, Z.-L.; Nerry, F. Land surface emissivity retrieval from combined mid-infrared and thermal infrared data of MSG-SEVIRI. Remote Sens. Environ. 2006, 105, 326–340. [Google Scholar] [CrossRef]
  7. Kaufman, Y.J.; Remer, L.A. Detection of forests using mid-IR reflectance: An application for aerosol studies. IEEE Trans. Geosci. Remote Sens. 1994, 32, 672–683. [Google Scholar] [CrossRef]
  8. Barnes, B.B.; Hu, C.; Bailey, S.W.; Pahlevan, N.; Franz, B.A. Cross-calibration of MODIS and VIIRS long near infrared bands for ocean color science and applications. Remote Sens. Environ. 2021, 260, 112439. [Google Scholar] [CrossRef]
  9. Wang, J.; Tang, B.H.; Li, Z.L.; Tang, R.L.; Wu, H. Retrieval of Land Surface Temperature from MODIS Mid-Infrared Data. In Proceedings of the 2015 IEEE International Geoscience and Remote Sensing Symposium (IGARSS), Milan, Italy, 26–31 July 2015; pp. 4404–4407. [Google Scholar]
  10. Liu, Y.; Zhang, W.; Zhang, B. Top-of-Atmosphere Image Simulation in the 4.3 μm Mid-infrared Absorption Bands. IEEE Trans. Geosci. Remote Sens. 2016, 54, 452–456. [Google Scholar] [CrossRef]
  11. Zheng, H. A Theoretical Study of a Vector Radiative Transfer Equation for Atmosphere and Ocean Medium. IEEE Geosci. Remote Sens. Lett. 2016, 13, 1430–1432. [Google Scholar] [CrossRef]
  12. El-Nimri, S.F.; Jones, W.L.; Uhlhorn, E.; Ruf, C.; Johnson, J.; Black, P. An Improved C-Band Ocean Surface Emissivity Model at Hurricane-Force Wind Speeds Over a Wide Range of Earth Incidence Angles. IEEE Geosci. Remote Sens. Lett. 2010, 7, 641–645. [Google Scholar] [CrossRef]
  13. Hagolle, O.; Nicolas, J.M.; Fougnie, B.; Cabot, F.; Henry, P. Absolute calibration of VEGETATION derived from an interband method based on the Sun glint over ocean. IEEE Trans. Geosci. Remote Sens. 2004, 42, 1472–1481. [Google Scholar] [CrossRef]
  14. Fan, C.; Fu, G.; Di Noia, A.; Smit, M.; Rietjens, J.H.H.; Ferrare, R.A.; Burton, S.; Li, Z.; Hasekamp, O.P. Use of A Neural Network-Based Ocean Body Radiative Transfer Model for Aerosol Retrievals from Multi-Angle Polarimetric Measurements. Remote Sens. 2019, 11, 2877. [Google Scholar] [CrossRef]
  15. Khazâal, A.; Tenerelli, J.; Cabot, F. Impact of Sun glint on the SMOS Retrieved Brightness Temperature Maps for Almost Four Years of Data. Remote Sens. Environ. 2016, 180, 234–245. [Google Scholar] [CrossRef]
  16. Xue, Q.; Guan, L. Identification of Sun Glint Contamination in GMI Measurements Over the Global Ocean. IEEE Trans. Geosci. Remote Sens. 2019, 57, 6473–6483. [Google Scholar] [CrossRef]
  17. Zhang, H.; Wang, M. Evaluation of sun glint models using MODIS measurements. J. Quant. Spectrosc. Radiat. Transf. 2010, 111, 492–506. [Google Scholar] [CrossRef]
  18. Philpot, W. Estimating Atmospheric Transmission and Surface Reflectance from a Glint-Contaminated Spectral Image. IEEE Trans. Geosci. Remote Sens. 2007, 45, 448–457. [Google Scholar] [CrossRef]
  19. Ahn, J.-H.; Park, Y.-J.; Kim, W.; Lee, B. Simple aerosol correction technique based on the spectral relationships of the aerosol multiple-scattering reflectances for atmospheric correction over the oceans. Opt. Express 2016, 24, 29659–29669. [Google Scholar] [CrossRef]
  20. Bailey, S.W.; Franz, B.A.; Werdell, P.J. Estimation of near-infrared water-leaving reflectance for satellite ocean color data processing. Opt. Express 2010, 18, 7521–7527. [Google Scholar] [CrossRef]
  21. Luderer, G.; Coakley, J.A.; Tahnk, W.R. Using sun glint to check the relative calibration of reflected spectral radiances. J. Atmos. Ocean. Technol. 2005, 22, 1480–1493. [Google Scholar] [CrossRef]
  22. Li, Z.; Petitcolin, F.; Zhang, R. A physically based algorithm for land surface emissivity retrieval from combined mid-infrared and thermal infrared data. Sci. China Ser. E Technol. Sci. 2000, 43, 23–33. [Google Scholar] [CrossRef]
  23. Jin, Z.; Charlock, T.P.; Rutledge, K.; Stamnes, K.; Wang, Y. Analytical solution of radiative transfer in the coupled atmosphere-ocean system with a rough surface. Appl. Opt. 2006, 45, 7443–7455. [Google Scholar] [CrossRef]
  24. Fell, F.; Fischer, J. Numerical simulation of the light field in the atmosphere–ocean system using the matrix-operator method. J. Quant. Spectrosc. Radiat. Transf. 2001, 69, 351–388. [Google Scholar] [CrossRef]
  25. He, X.; Bai, Y.; Zhu, Q.; Gong, F. A vector radiative transfer model of coupled ocean–atmosphere system using matrix-operator method for rough sea-surface. J. Quant. Spectrosc. Radiat. Transf. 2010, 111, 1426–1448. [Google Scholar] [CrossRef]
  26. Petitcolin, F.; Nerry, F.; Stoll, M.P. Mapping directional emissivity at 3.7 μm using a simple model of bi-directional reflectivity. Int. J. Remote Sens. 2002, 23, 3443–3472. [Google Scholar] [CrossRef]
  27. Sun, D.; Yu, Y.; Yang, H.; Fang, L.; Liu, Q.; Shi, J. A case study for intercomparison of land surface temperature retrieved from GOES and MODIS. Int. J. Digit. Earth 2015, 8, 476–494. [Google Scholar] [CrossRef]
  28. Li, Z.-L.; Becker, F. Feasibility of land surface temperature and emissivity determination from AVHRR data. Remote Sens. Environ. 1993, 43, 67–85. [Google Scholar] [CrossRef]
  29. Goita, K.; Royer, A. Surface temperature and emissivity separability over land surface from combined TIR and SWIR AVHRR data. IEEE Trans. Geosci. Remote Sens. 1997, 35, 718–733. [Google Scholar] [CrossRef]
  30. Tang, B.; Li, Z.L. Retrieval of land surface bidirectional reflectivity in the mid-infrared from MODIS channels 22 and 23. Int. J. Remote Sens. 2008, 29, 4907–4925. [Google Scholar] [CrossRef]
  31. Trigg, S.; Flasse, S. An evaluation of different bi-spectral spaces for discriminating burned shrub-savannah. Int. J. Remote Sens. 2001, 22, 2641–2647. [Google Scholar] [CrossRef]
  32. Ouzounov, D.; Freund, F. Mid-infrared emission prior to strong earthquakes analyzed by remote sensing data. Adv. Space Res. 2004, 33, 268–273. [Google Scholar] [CrossRef]
  33. Jing, X.; Hu, X.-Q.; Zhao, S.; He, L.-Q.; Hu, X.; Yan, L. The Sun Glint Area Reflectance Calculation of VIIRS Middle Infrared Channel in South Indian Ocean Based on Improved Nonlinear Split Window Model. Spectrosc. Spectr. Anal. 2017, 37, 394–402. [Google Scholar] [CrossRef]
  34. Høyer, J.L.; Le Borgne, P.; Eastwood, S. A bias correction method for Arctic satellite sea surface temperature observations. Remote Sens. Environ. 2014, 146, 201–213. [Google Scholar] [CrossRef]
  35. Tang, B.T.; Jia, Y.-Y.; Zhang, X.; Li, Z.-L. Vegetation monitoring with surface bi-directional reflectivities in MODIS near-IR and mid-IR channels. In Proceedings of the 2007 IEEE International Geoscience and Remote Sensing Symposium, Barcelona, Spain, 23–28 July 2007; pp. 3333–3336. [Google Scholar]
  36. Morel, A.; Antoine, D.; Gentili, B. Bidirectional reflectance of oceanic waters: Accounting for Raman emission and varying particle scattering phase function. Appl. Opt. 2002, 41, 6289–6306. [Google Scholar] [CrossRef]
  37. Eltbaakh, Y.A.; Ruslan, M.H.; Alghoul, M.A.; Othman, M.Y.; Sopian, K. Measurements of spectral-band solar irradiance in Bangi, Malaysia. Sol. Energy 2013, 89, 62–80. [Google Scholar] [CrossRef]
  38. Huang, F.; Zhou, J.; Tao, J.; Tan, X.; Liang, S.; Cheng, J. PMODTRAN: A parallel implementation based on MODTRAN for massive remote sensing data processing. Int. J. Digit. Earth 2016, 9, 819–834. [Google Scholar] [CrossRef]
  39. Sobrino, J.A.; Caselles, V.; Coll, C. Theoretical split-window algorithms for determining the actual surface temperature. Il Nuovo Cimento C 1993, 16, 219–236. [Google Scholar] [CrossRef]
  40. Remer, L.A.; Kaufman, Y.J.; Tanré, D.; Mattoo, S.; Chu, D.A.; Martins, J.V.; Li, R.R.; Ichoku, C.; Levy, R.C.; Kleidman, R.G.; et al. The MODIS Aerosol Algorithm, Products, and Validation. J. Atmos. Sci. 2005, 62, 947–973. [Google Scholar] [CrossRef]
  41. Mushkin, A.; Balick, L.K.; Gillespie, A.R. Extending surface temperature and emissivity retrieval to the mid-infrared (3–5 μm) using the Multispectral Thermal Imager (MTI). Remote Sens. Environ. 2005, 98, 141–151. [Google Scholar] [CrossRef]
  42. Harmel, T.; Chami, M.; Tormos, T.; Reynaud, N.; Danis, P.-A. Sunglint correction of the Multi-Spectral Instrument (MSI)-SENTINEL-2 imagery over inland and sea waters from SWIR bands. Remote Sens. Environ. 2018, 204, 308–321. [Google Scholar] [CrossRef]
  43. Tavares, M.H.; Lins, R.C.; Harmel, T.; Fragoso, C.R., Jr.; Martínez, J.-M.; Motta-Marques, D. Atmospheric and sunglint correction for retrieving chlorophyll-a in a productive tropical estuarine-lagoon system using Sentinel-2 MSI imagery. ISPRS J. Photogramm. Remote Sens. 2021, 174, 215–236. [Google Scholar] [CrossRef]
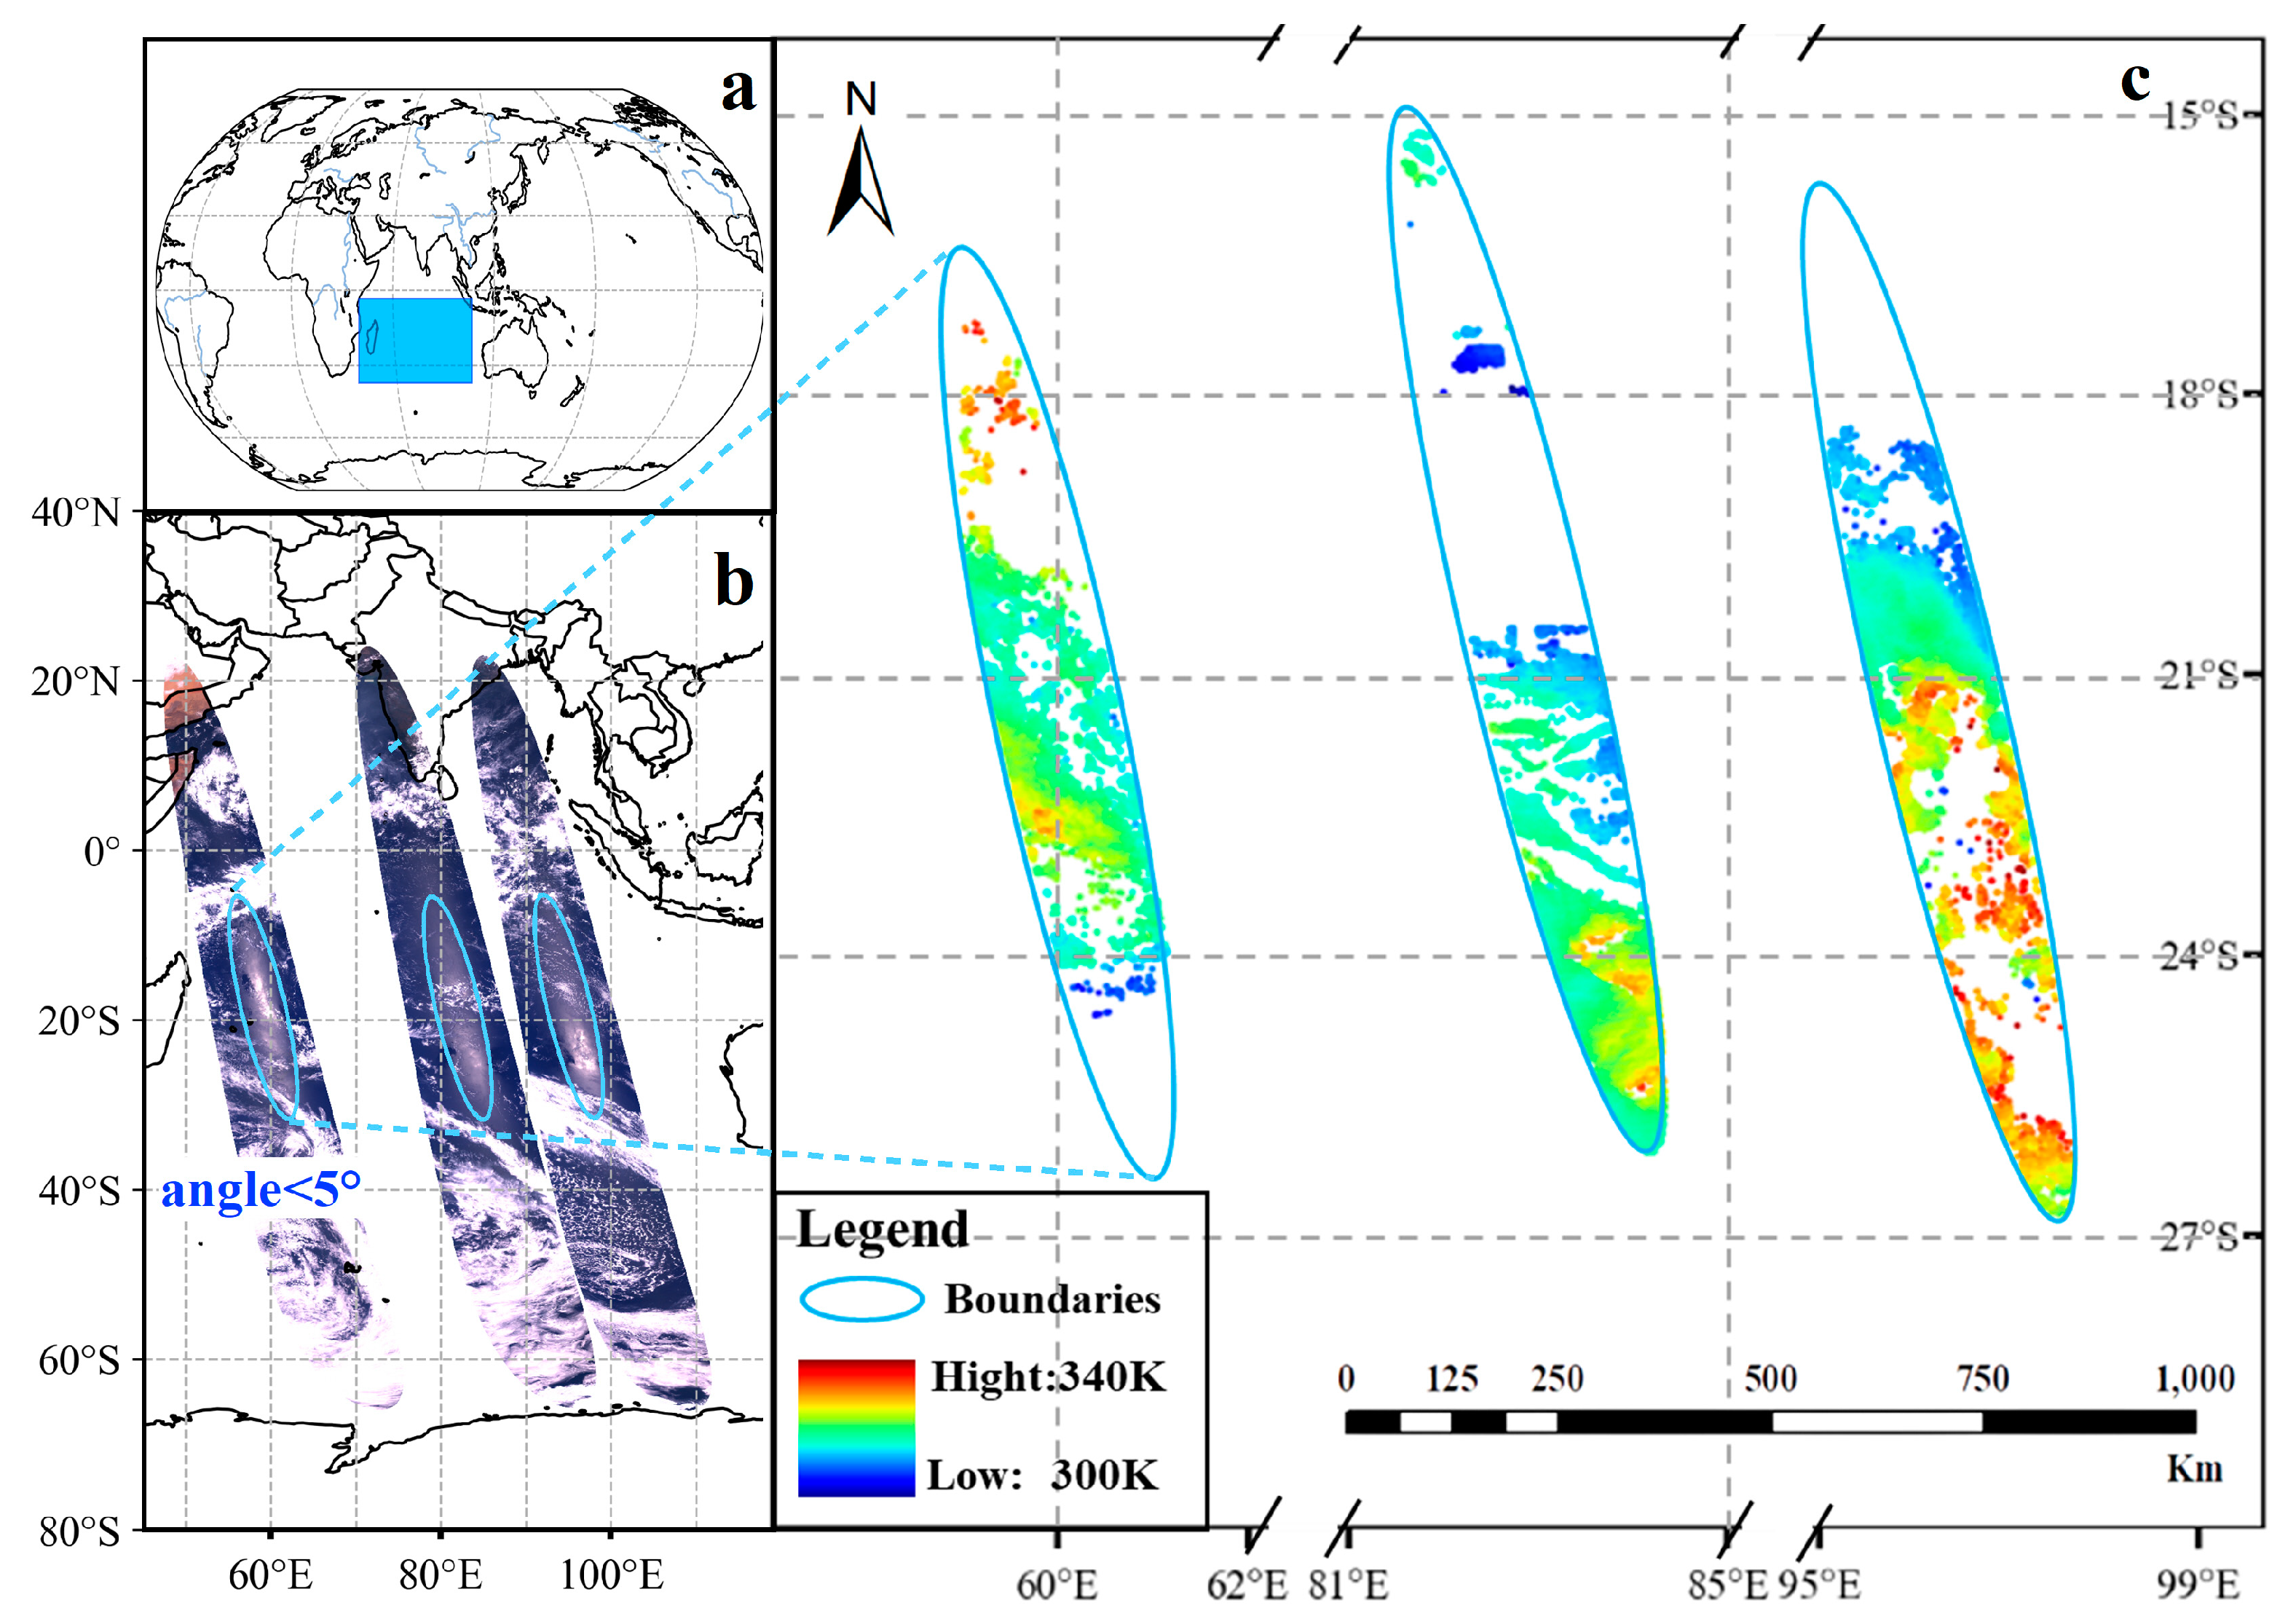
Figure 1. (a) Location of study area; (b) true color composite image of sun glint over the deep ocean; (c) map of brightness temperatures at the top of the atmosphere of the channel 20.
Remotesensing 15 05117 g001
Figure 2. (a) Transit time of the samples; (b) blackbody brightness temperature of the samples.
Remotesensing 15 05117 g002
Figure 3. Technical framework of the study.
Remotesensing 15 05117 g003
Figure 4. Radiance received by the satellite sensor.
Remotesensing 15 05117 g004
Figure 5. The sea surface bidirectional reflectivity fitting relationship of mid-infrared channels 20 and 21.
Remotesensing 15 05117 g005
Figure 6. (a) Polynomial fitting Equation (14) coefficient a1. (b) Polynomial fitting Equation (14) coefficient a2. (c) Polynomial fitting Equation(14) coefficient a3.
Remotesensing 15 05117 g006
Figure 7. Bidirectional reflectivity of the channel 20 in the sun glint over the sea.
Remotesensing 15 05117 g007
Figure 8. (A) Difference between the reflectance calculated using the emissivity library and the sea surface temperature product and the reflectance calculated using the model in December 2018. (B) Difference between the reflectance calculated using the emissivity library and the sea surface temperature product and the reflectance calculated using the model in December 2019. (C) Difference between the reflectance calculated using the emissivity library and the sea surface temperature product and the reflectance calculated using the model in December 2020. (D) The absolute value of the difference of 176 samples (E) the mean value of the difference.
Remotesensing 15 05117 g008
Figure 9. (a) Mid-infrared channel transmittance; (b) spectral response function of FY-3D/MERSI-2 channels 20 and 21.
Remotesensing 15 05117 g009
Figure 10. Effect of water vapor, VIS, and VZA on transmittance.
Remotesensing 15 05117 g010
Figure 11. Effect of water vapor and horizontal visibility changes on reflectance calculation results.
Remotesensing 15 05117 g011
Figure 12. (a) Effect of the first hypothesis on the calculation of reflectivity; (b) effect of the second hypothesis on the calculation of reflectivity.
Remotesensing 15 05117 g012
Table 1. Mid-infrared channel band characteristics.
Property20 Band21 Band
Center wavelength3.8 μm4.05 μm
Effective band width180 nm155 nm
Spatial resolution1000 m1000 m
Noise equivalent temperature difference0.25 K0.25 K
Dynamic Range200–350 K200–380 K
Table 2. Details on the data.
DataData SourcesSpatial ResolutionDescription
FY-3D MERSI-II
MOD08_D3
Sea surface temperature
NSMC250, 1000 m
NASA EOSLevel-3 MODIS gridded atmosphere product
ECMWF0.25°The temperature of sea water near the surface
10 m v-component of wind
10 m u-component of wind
ECMWF0.25°Northward component of the 10 m wind
ECMWF0.25°Eastward component of the 10 m wind
Total column water vapor
FY-3D MERSI-II
MOD08_D3
Sea surface temperature
ECMWF0.25°Total amount of water vapor in a column
NSMCLevel-3 MODIS gridded atmosphere product
NASA EOS0.25°The temperature of sea water near the surface
ECMWF0.25°Northward component of the 10 m wind
10 m v-component of windECMWF0.25°Eastward component of the 10 m wind
ECMWF0.25°Total amount of water vapor in a column
Table 3. Error in sea surface reflectivity in model calculations.
Factors of UncertaintyError (%)
Water vapor1.16
Aerosol optical thickness0.34
The first hypothesis0.01
The second hypothesis0.83
Instrumental noise (NEDT)0.03
Disclaimer/Publisher’s Note: The statements, opinions and data contained in all publications are solely those of the individual author(s) and contributor(s) and not of MDPI and/or the editor(s). MDPI and/or the editor(s) disclaim responsibility for any injury to people or property resulting from any ideas, methods, instructions or products referred to in the content.