Communication

Horizontal Magnetic Anomaly Accompanying the Co-Seismic Earthquake Light of the M7.3 Fukushima Earthquake of 16 March 2022: Phenomenon and Mechanism

1
School of Geosciences and Info-Physics, Central South University, Changsha 410083, China
2
Laboratory of Geo-Hazards Perception, Cognition and Predication, Central South University, Changsha 410083, China
*
Author to whom correspondence should be addressed.
Remote Sens. 2023, 15(20), 5052; https://doi.org/10.3390/rs15205052
Submission received: 9 September 2023 / Revised: 15 October 2023 / Accepted: 16 October 2023 / Published: 21 October 2023

Abstract

:
A horizontal magnetic disturbance accompanying the co-seismic earthquake light (EQL) of the M7.3 Fukushima earthquake of 16 March 2022 was detected by a fluxgate magnetometer installed at the KAK station, which is 270 km south of the EQL and 210 km west of the epicenter. The instantaneous change of the declination component of the geomagnetic field reached about 1.7″, much exceeding the threshold of three-fold error (0.72″). Considering the direction information of the geomagnetic data, the horizontal magnetic disturbance vector was further analyzed, which manifested the normal of the horizontal magnetic disturbance vector passing through the position of the EQL. Combined with the experimental results of pressure-simulated rock current (PSRC), the mechanism of the EQL and the geomagnetic anomaly was proposed to interpret the spatiotemporal correlation between the EQL and the horizontal magnetic disturbance vector, which should be a manifest of the induced magnetic horizontal vector (IMHV), attributed to the upward seismic PSRC. Different from previous precursor studies on geomagnetic disturbance on the power spectrum, vertical component, or polarization, this paper focuses on the direction information of the horizontal magnetic disturbance vector, which could be further applied to locate potential seismogenic zones based on the IMHVs observed by multiple geomagnetic stations.

1. Introduction

Among many precursors related to geology, geophysics, and the geochemistry field, the geomagnetic field is one of the most sensitive factors in seismic activity [1,2,3,4,5,6]. Various abnormal phenomena, such as earthquake light (EQL), compass deflection, and abnormal animal behavior, are potentially related to geomagnetic disturbances or anomalies. Previous works basically analyzed the scalar values of multiple components separately to extract electromagnetic radiation anomalies in different frequency ranges [7,8]. Alternatively, the ratio of vertical components (i.e., Z component) and horizontal components (i.e., H component) as a polarization value was applied to detect the weak electromagnetism emissions from the lithosphere [9,10]. Hayakawa et al. [11] found that the polarization value (Z/H) in the very low frequency band (0.01–0.05 Hz) gradually increased two months before the M8.0 Guam earthquake in 1993 and recovered after the earthquake. The geomagnetic anomalies obtained by current methods were basically caused by alternating electromagnetic fields, which makes it difficult to adequately interpret the above abnormal phenomena. As a three-dimensional vector field, the geomagnetic field contains direction information and amplitude information. However, few studies have combined the directional information of magnetic disturbance vectors (declination and horizontal components) to analyze the relationship between seismic activity and magnetic anomalies [12,13,14]. This study uses EQL as the research target to clarify the relationship between the magnetic disturbance vector and seismic activity.
Earthquake lights (EQLs) are luminous phenomena appearing on the surface or in the lower atmosphere associated with seismic activity that are mostly observed before and/or during the shock of an earthquake [15]. EQLs mainly manifest as short flashes of light shooting high up into the air that last from seconds to a few minutes, which were divided into pre-earthquake EQLs and co-seismic EQLs and have been observed in multiple earthquakes [16,17]. EQLs were not only observed by humans but also recorded by densely distributed cameras, which provide a temporal and spatial reference for many studies. According to a compilation of 65 earthquakes in various geological settings, Theriault et al. [18] proposed that EQLs mostly occur within 150 km from the epicenter and near geological structures, such as rifts and faults. Based on the temporal–spatial relationship between EQLs and seismicity, the formation of EQLs was obviously associated with the final accumulation and rapid release of stress before the shock.
Some possible causal mechanisms were proposed for explaining the generation of EQLs accompanying earthquakes. The burning gas coming from fissures opening during an earthquake [19] and the sonoluminescence associated with seismic waves [20] are candidates for explaining the particular luminescence phenomenon. However, the generation of EQLs was mainly explained as electrical discharges due to charge separation [21], which were explained by some physical effects. Liptovsky et al. [22] proposed that radon and aerosol gas escaped from the mechanical rupture of the crustal rock mass into the atmosphere and ionosphere, leading to ionizing radiation and polarizing electric fields. A hydro-mechanical model was also proposed to explain the EQL of the Matsushiro earthquake, which illustrated that the surface charge is carried upward through the pores of the crust by a mixture of water and carbonic anhydride [23]. The rock battery model was also proposed to explain the generation of EQLs, where the passage of S waves will activate the peroxy bonds of igneous rocks, resulting in the release and accumulation of positive holes (P-holes) on the surface [24].
The physical mechanisms mentioned above were basically speculated and summarized based on the light and electrical signals observed in rock experiments and/or on surface electromagnetic field changes measured before, during, and after a shock. On the experimental side, Brady and Rowell [25] analyzed the typical luminescence observed in the process of rock loading and fracturing, combining its spectral characteristics to illustrate the external electron excitation of the ambient atmosphere as the mechanism of the light emission. The generation of electric currents in rocks under stress has long been recognized by means of experimentation [26]. The pressure-stimulated or piezo-stimulated current (PSC) was first introduced in the 1980s by Varotsos et al., which focused on the polarization or depolarization current produced by the piezoelectric effect [27]. Hadjiocontis and Mavromatou [28] reported that the electric signals in rocks under uniaxial compression were attributed to the stress-induced polarization of the sample. Subsequent research revealed that the rock current generated by a compressed sample, known as pressure-stimulated rock current (PSRC), is not exclusively attributed to the piezoelectric effect. In the loading experiment of igneous rock samples containing minimal amounts of piezoelectric minerals, PSRCs of the same magnitude and opposite signs were observed, which was explained by the accumulation of positive charge in the unloaded part of the rock [29,30]. Mao et al. [31] experimentally discovered a stable and remarkable step-like increment as well as drastic oscillations with maximum amplitudes of several hundreds of nA before the abrupt failure of diorite samples and proved the transfer of PSRC from the stressed end to the non-stressed end of a rock specimen. From the surface electromagnetic field related to an earthquake, Takeuchi [32] found that the plate electrodes deployed in the underground roadway detected electrical signals when the seismic waves arrived, which was explained by using the positive charge accumulation on the unstressed floor surface. Using an 8-m-high detector of electric fields, Kamogawa et al. [33] observed enhanced corona currents, which lasted for several minutes during an earthquake.
Although the research mentioned above has shown some relationship between EQL and rock current, the possible magnetic anomaly corresponding to EQL might have been ignored and not reported. If EQL is indeed a luminous phenomenon caused by a seismic PSRC, the induced magnetic field should also be detectable synchronously based on the current magnetic effect. By analyzing the characteristics of the induced magnetic anomaly, the potential correlation between seismic PSRCs and EQLs could be proved, if real. The magnetic declination (D component), defined as the angle between geographic north and the horizontal geomagnetic vector, is sensitive to the induced magnetic field superimposed on the original horizontal magnetic field. The magnetic disturbance vector deflects the original horizontal magnetic vector, resulting in a declination variation. Therefore, the D component was applied in the study to detect the induced magnetic anomaly.
Considering the reliability of the EQL video and the availability of geomagnetic observation data, we used the luminous phenomenon that occurred in the M7.3 Fukushima earthquake in Japan on 16 March 2022 as a case study and retrieved the three-dimensional magnetic anomaly that occurred synchronously with the EQLs. The declination component of the horizontal magnetic field in the moment of the EQLs was found to exceed the threshold of 0.72″. The temporal–spatial relationship between EQLs and the induced magnetic horizontal vector (IMHV) was analyzed, and the possibility of the existence of PSRC during the Fukushima earthquake was verified. Furthermore, the underlying geophysical mechanism of PSRC was interpreted with the rock battery model and PSRC variations detected in rock experiments.

2. Fukushima Earthquake and Co-Seismic EQLs

The subduction of the Pacific Plate under the Okhotsk Plate along a convergent boundary located off the east coast of Japan has produced intense seismic activity in the related region. As shown in Figure 1a, a strong earthquake occurred off the coast of Fukushima at 14:36:30 on 16 March 2022 (UTC), accompanied by a 20–30 cm tsunami. According to the United States Geological Survey (USGS), the epicenter was located at 37.713°N and 141.579°E, with a magnitude of 7.3 and a focal depth of 41.0 km.
Cameras installed in the urban area of Sendai City and Sendai Airport captured the co-seismic EQL accompanying the shaking of the entire city (Figure 1d,e). A blue–white flash burst out from the surface into the air, lasting about one second, which is consistent with other EQLs described before [17,18]. We investigated the videos taken in downtown Sendai and at the airport and used Google Earth to match the scenes in the videos to determine the field of view of the two cameras (https://www.youtube.com/watch?v=nq-_PqJhkHk, accessed on 20 January 2023). The overlap zone of the two fields of view was considered the most possible position where the EQL appeared, which is an important constraint for a subsequent analysis (Figure 1b). The position where the EQL appeared is located in the northwest of Sendai City, in the range of a plain rich in igneous rocks (Figure 1b). Then, video editing software that can be viewed at a frame rate of 30 Hz was used to confirm the specific moment of the EQL. Two flashes were recorded on the airport camera and downtown camera from 14:37:10.93 to 14:37:11.07 and from 14:37:12.86 to 14:37:14.16 (UTC), respectively. More specifically, from the available video footage, the town cameras captured two instances of flashes, while the airport camera only captured the first flash, and then the recording of the airport camera was interrupted. The locations of both flashes were relatively close to each other. In Figure 1, we display the first flash recorded by the airport camera and the second flash recorded by the town camera. In addition, we also collected maintenance reports on electrical facilities after the shock to rule out the possibility of the flashes being caused by explosions in transformers or power supply facilities. The reports on the locations of the malfunctioning power stations showed that some of the power stations along Sendai’s eastern coast did malfunction, but they were far away from where the EQLs appeared in the inland region (https://www.tohoku-epco.co.jp/news/normal/1225499_2558.html, accessed on 20 January 2023).

3. Magnetic Anomaly Retrieval

The geomagnetic data, with the observation precision being 0.01 nT, of three geomagnetic stations, named Kakioka (KAK), Memambetsu (MMB), and Kanoya (KNY), deployed in different latitude regions, were downloaded from the International Real-Time Magnetic Observatory Network (Intermagnet, https://intermagnet.github.io/, accessed on 20 January 2023) for magnetic anomaly retrieval. The KAK geomagnetic station was the closest one to the epicenter, at a distance of about 210 km, while the distances of the other two away from the epicenter were 690 km and 1200 km, respectively. The MMB and KNY stations can be used as reference stations to determine whether the geomagnetic anomalies were caused by external ionospheric current activities or not. Additionally, considering the short lifespan of EQLs, the time resolution of the geomagnetic data used in this study was one second.
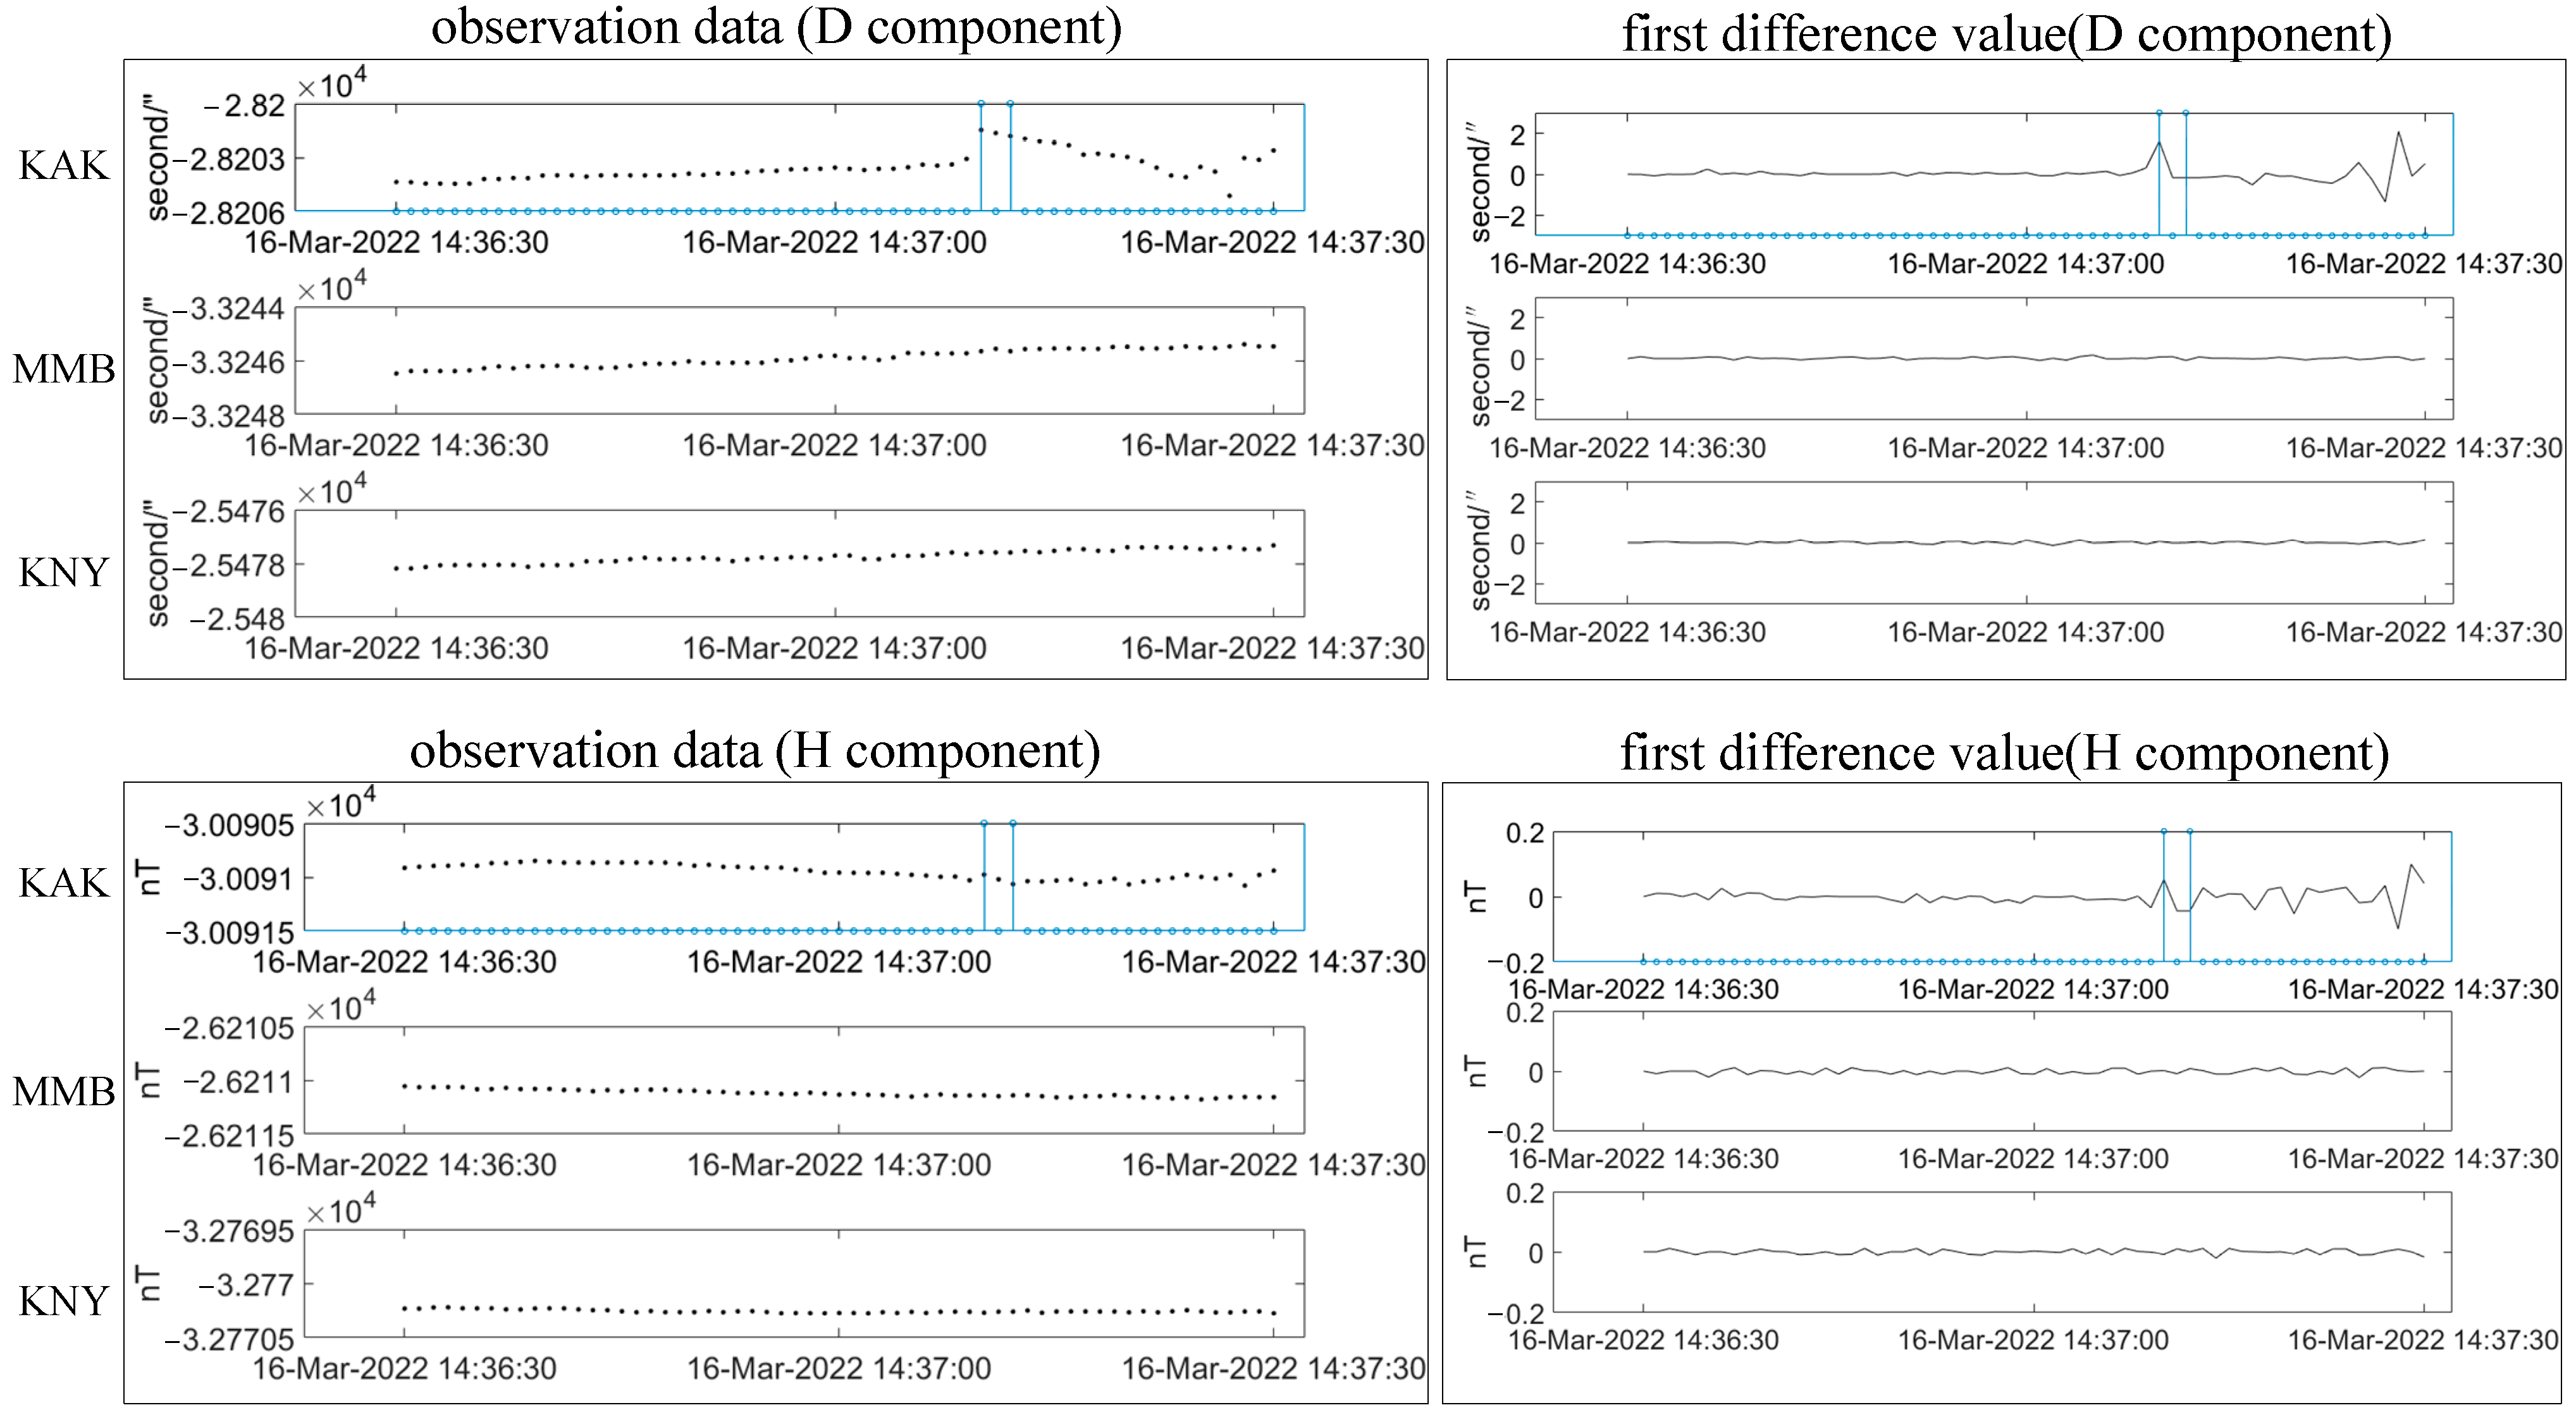
This study utilized the magnetic declination component (D component) and horizontal component (H component) derived from the original observations to retrieve a horizontal magnetic anomaly. The D and H components can be calculated using the north–south component (X component) and east–west component (Y component), respectively (i.e., D = atan   ( Y / X ) , H = ( X ^ 2 + Y ^ 2 ) ). According to the rock battery model, the activated positive holes would migrate upward along the direction of the stress gradient to the ground surface. The great seismic current, which might lead to the ionization of air near the ground surface, may generate an IMHV superimposed on the original horizontal vector. However, the H component, as the horizontal intensity of the magnetic field vector, is dominated by the main magnetic field of the earth, which makes it difficult to highlight the weak magnetic disturbance. However, the D component is more sensitive to the IMHV, which was selected for the magnetic anomaly retrieval of EQLs in this study. After locating the moment of component D’s occurring anomaly, the disturbances of the X and Y components were checked and utilized to synthesize the IMHV. As shown in Figure 2, the H component of the KAK station fluctuated when the EQL appeared. Additionally, the D component of the KAK station was raised synchronously at the moment of the EQL (blue line in Figure 2) and then fell to the same level as before. We used the geomagnetic observation data from one minute before and after the EQL to construct the first-order difference sequence and its corresponding residual sequence. The first-order difference value of component D (reaching about 1.7″) at the moment of the EQL obviously broke through the threshold of the three-fold error (about 0.72″). The error threshold is the triple median error calculated based on the sequence of first-order difference values from 14:00:00 to 14:59:59 (UTC). However, the D and H components of the MMB and KNY stations remained stable, which can explain, to a certain extent, the correlation between the magnetic anomaly at the KAK station and the Fukushima earthquake activity. The data analysis results clearly indicated a significant synchronicity between the EQL and geomagnetic anomalies. In addition to the temporal correlation, we also observed that the normal vector of the horizontal magnetic vector coincided precisely with the location of the earthquake light occurrences, which will be thoroughly analyzed and discussed in our upcoming conversation.
The luminous phenomenon was also captured in a similar position during a former M7.1 Fukushima earthquake on 7 April 2011. To rule out the contingency of magnetic anomalies induced by the EQL in 2011, we also compared and analyzed the D components of the above geomagnetic stations. As shown in Figure A2, the D component of the KAK station also fluctuates during the earthquake, while the other two reference stations are basically stable. It was difficult to further analyze the magnetic disturbance vector corresponding to the EQL in 2011 due to the lack of accurate time information for the EQL. However, the repeated observational evidence proves the temporal relationship between the EQL and magnetic anomalies, which is not accidental.

4. Discussion

4.1. Are Magnetic Disturbances and EQLs Caused by PSRC?

As mentioned above, the relationship between light emission and rock current has been preliminary verified through rock experiments and field measurements [25], and the temporal–spatial consistency of electric currents and EQLs was regarded as an important premise. The temporal–spatial relationship between magnetic disturbances and EQLs can be used to verify the internal connection between EQLs, geomagnetic anomalies, and PSRCs [34,35,36]. In terms of temporal consistency, a magnetic disturbance was detected the moment the EQL occurred. The physical essence of the geomagnetic field is a vector field, which contains information on magnitude and direction (Figure 1). The direction information of the magnetic disturbance was easily ignored. In terms of spatial consistency, the direction of the disturbance vector was applied to search for the potential relationship between the seismic PSRC and magnetic disturbance. The first-order differences of the X (−0.02 nT) and Y (0.24 nT) components at the moment of the EQL were extracted to synthesize the IMHV (Figure A1). The first difference value of the Y component with a positive value and the first difference value of the X component with a negative value indicated that the magnetic disturbance vector, appearing at the moment of the EQL, pointed to the southeast direction of the KAK station (the red arrow in Figure 1a). It was noted that the normal line of the disturbance vector obviously passed through the zone of the EQL. As reference to the Biot–Savart law [37], we can reasonably speculate that an upward PSRC appeared on the northwest side of Sendai City, resulting in the induced magnetic field as well as the disturbance of the horizontal vector. Takeuchi et al. [32] found positive electrification on the floor of an underground mine gallery at the arrival of the seismic waves, which is a good proof of the upward PSRC. Meanwhile, the appearance of the IMHV also confirms that the appearance of the EQL was caused by seismic PSRC, to a certain extent.
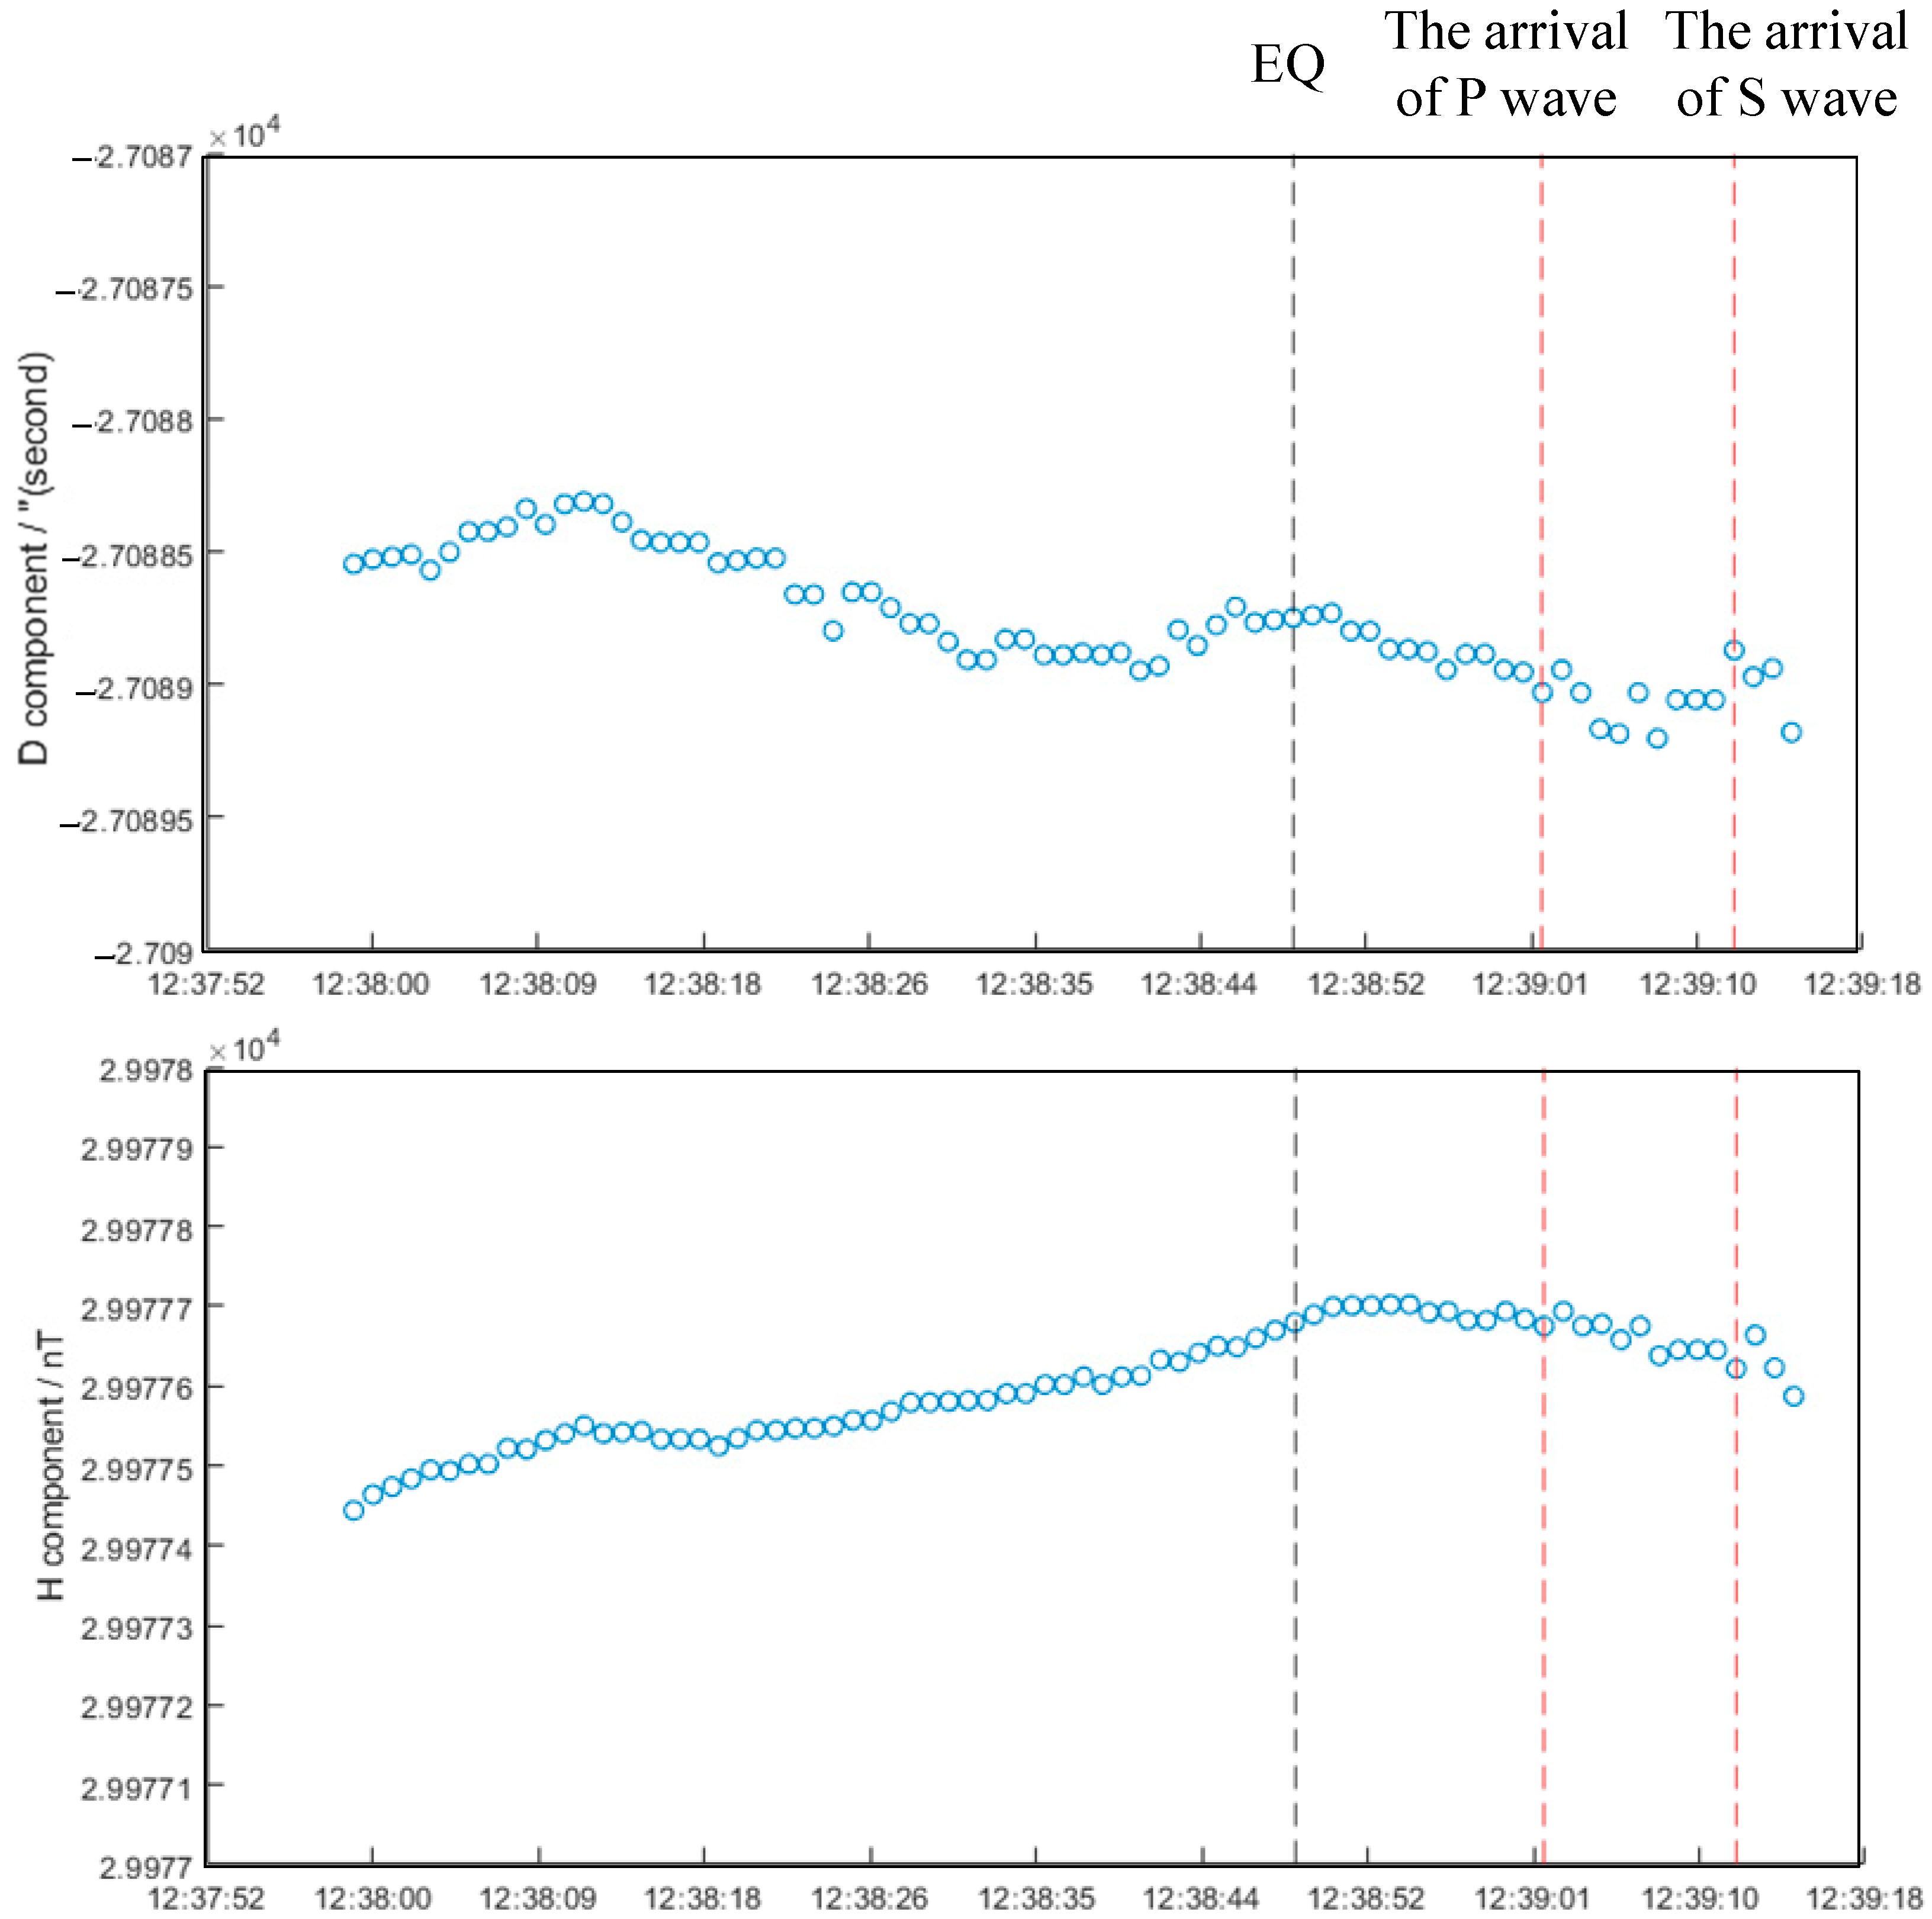
Taking into consideration that geomagnetic anomalies are detected by monitoring stations after the arrival of P waves and before the arrival of S waves, we discussed the possibility of magnetic disturbances caused by the shaking of the magnetometer. We conducted a case migration analysis using the M6.3 Fukushima earthquake that occurred on 28 December 2016, with its epicenter located at 36°43.2′N and 140°34.4′E. This earthquake was closer to the target station (i.e., the KAK station), allowing us to assess whether the seismic waves would trigger geomagnetic anomalies. The results indicated that no similar anomalous phenomena of declination and horizontal components were observed after the arrival of the seismic waves (Figure A3). Additionally, Skordas et al. [38] found that the shaking of the magnetometer could lead to continuous oscillations in the geomagnetic anomaly, primarily influenced by high-frequency components. By combining these two points, to some extent, we can exclude the possibility that the magnetic anomalies observed in this study were caused by the shaking of the magnetometer.

4.2. Typical Characteristics of PSRC for Explaining IMHV

Considering the synchronous occurrence and spatial connection of the EQL and IMHV, the existence of the upward PSRC should be one of the potential mechanisms most likely to interpret the particular phenomenon. The evolution of PSRCs has been observed in the process of loading rock samples for fracturing but has exhibited different characteristics in previous experiments. The type of PSRC that can be applied to explain the instantaneous and upward seismic PSRC characteristics mentioned above needs to be further analyzed.
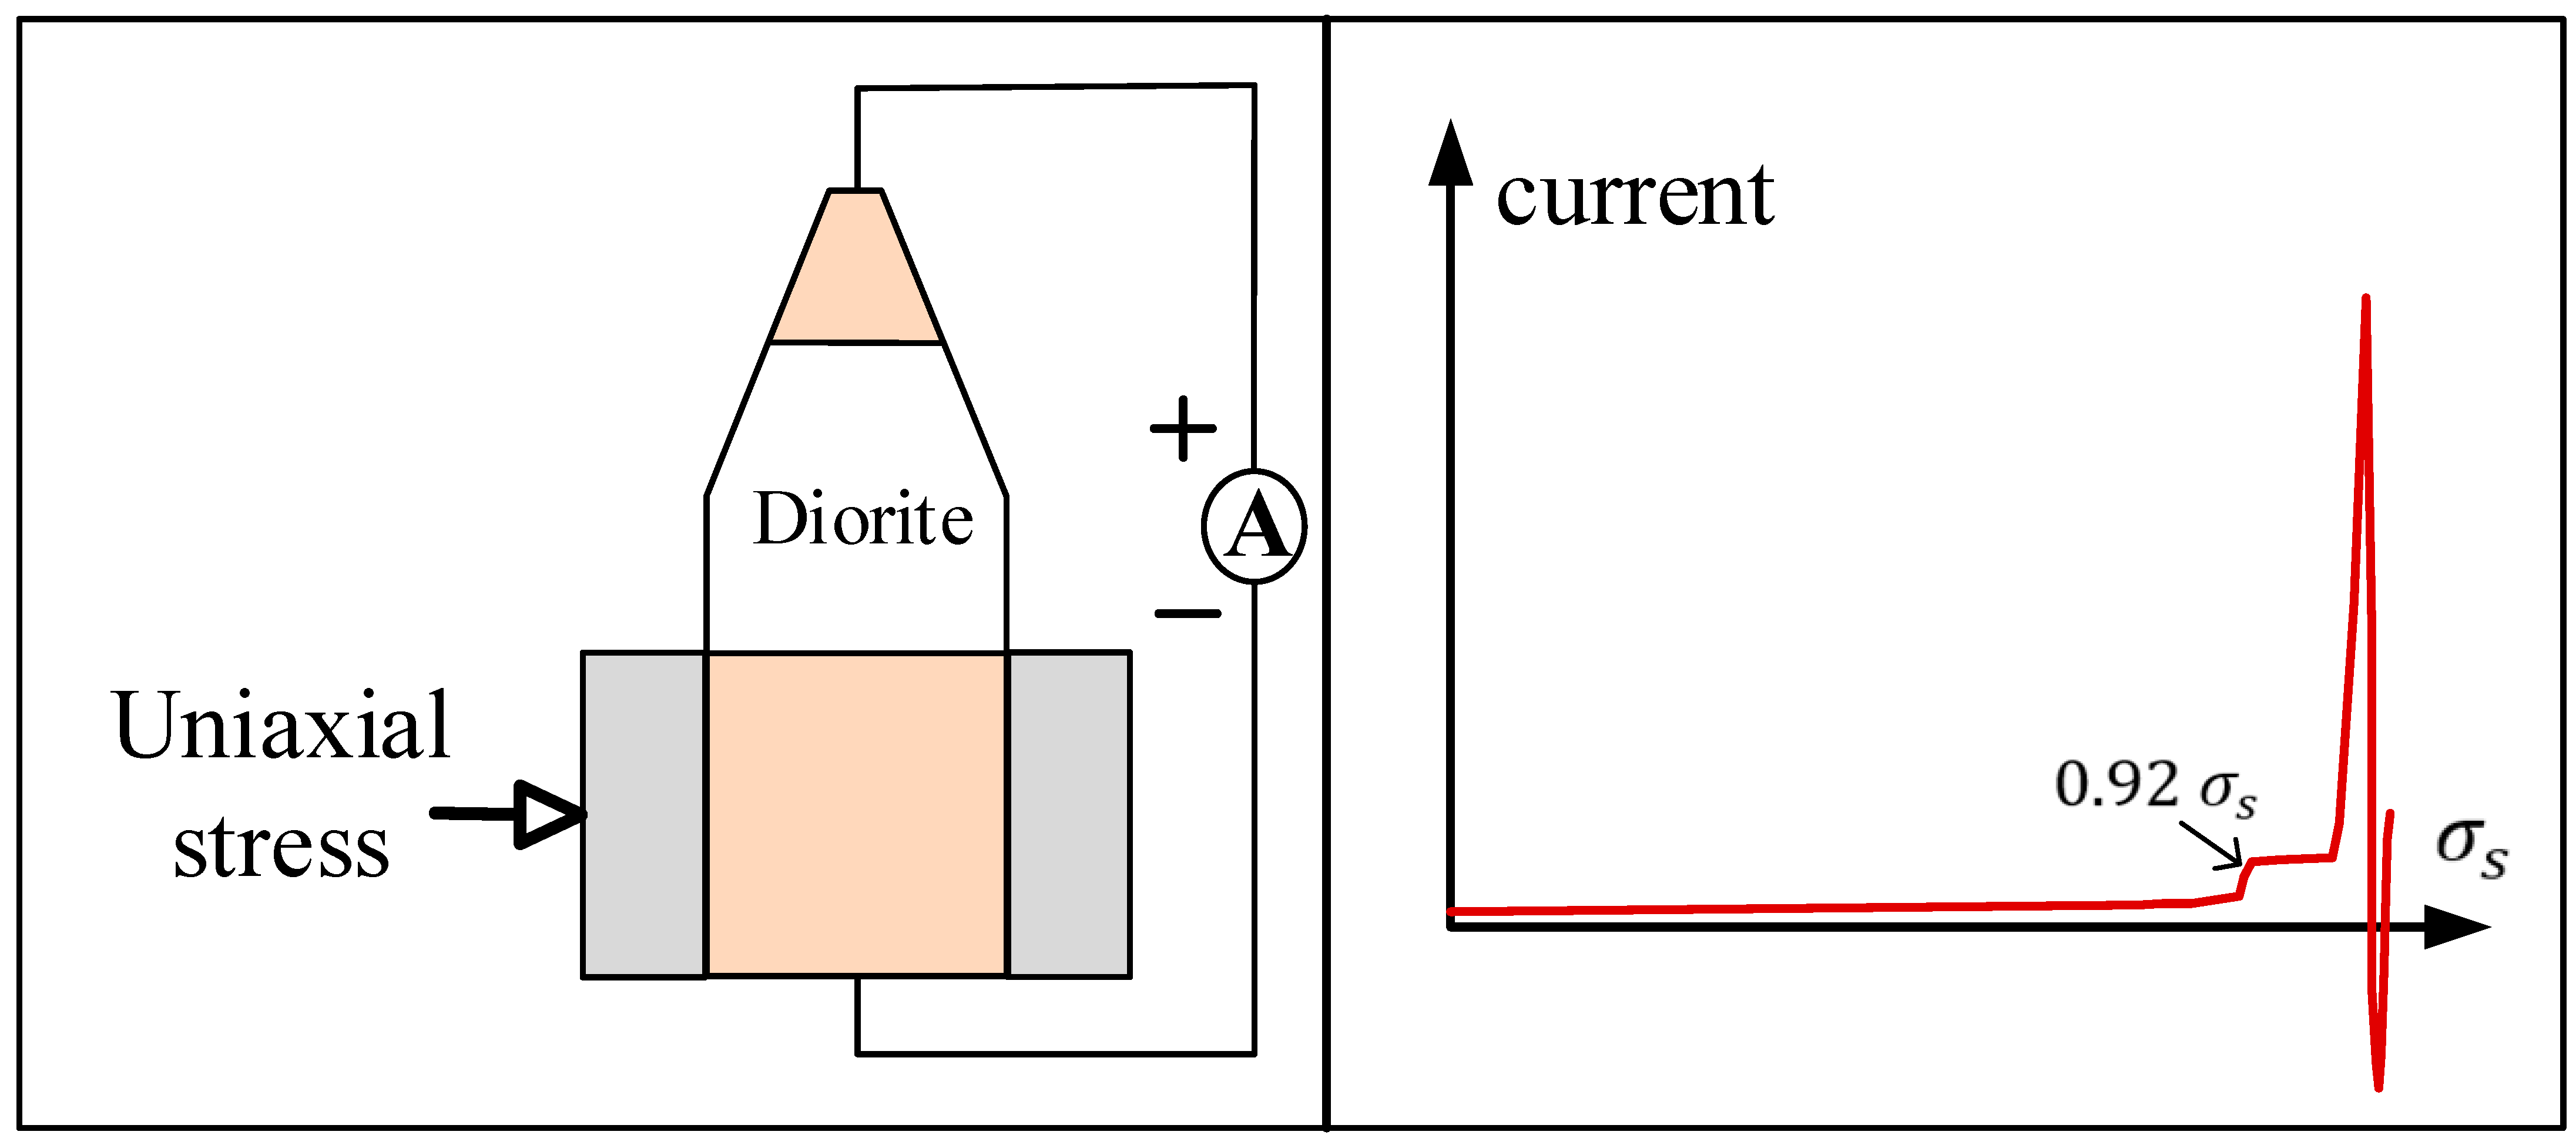
With positive and negative electrodes pasted on opposite sides of rock specimens, observable variations in the measured PSRCs appeared beyond the linear elasticity limit of the rocks (~ 0.6 σ s ) and reached the maximum before failure [39]. The moving charged dislocation (MCD) model was proposed as a potential mechanism, which suggested that the electrically neutral charged edge dislocations in the crystal structure move and separate to generate electrical signals when the rock enters the phase of plastic deformation. Based on the current detection of loaded granite slabs in laboratories, the positive holes (P-holes) activation-and-aggregation theory was proposed, which indicated that the peroxy bonds embodied in the rock were activated by additional stress and then released P-holes, which are able to propagate along the stress gradient to the unstressed part of the rock [30]. When stress was applied to one end of a diorite specimen with a conical head (Figure A4), the PSRC exhibited a step-like rise with a huge positive (+114 nA) at a high stress level ( ~ 0.92 σ s ), and negative fluctuations (−60 nA) shortly manifested before specimen failure [31]. The outflow of P-holes and the field emission of electrons associated with crack charge separation were used to explain the PSRC variations of diorite rocks loaded for fracturing in the experiment. Massive peroxy bonds embodied inside the mineral grains of igneous and metamorphic rocks may be fully activated, and a large number of P-holes could be released in the moment of rock failure, resulting in a sharp increase in the PSRC. Considering the instantaneous characteristics of EQLs and the upward current signal manifested by the IMHV at the KAK station, the experimentally detected huge positive fluctuating signal before rock failure (Figure A4) is able to interpret the potential mechanism of the EQL during the M7.3 Fukushima earthquake.

4.3. Where Do Positive Holes Generating the Seismic PSRC Come from?

The peroxy bonds producing P-holes under high pressure are basically found in igneous and metamorphic rocks [29]. Whether there are necessary conditions to trigger massive P-holes and produce EQLs needs to be further verified. However, it is not convincing to judge the necessary conditions of P-holes by relying only on the lithological data within the overlapping range of the two cameras’ fields of view. We needed to determine the accurate location of the source of P-holes based on the existing constraints and the geophysical mechanism.
The triggering mechanism of co-seismic EQLs is divided into two categories: one is the light close to the hypocenter (“earthquake-induced stress”), and the other is the light at a significant distance from the hypocenter during the passage of seismic waves (“wave-induced stress”) [18]. Usually, the positive carriers triggered by seismogenic stress originate from the rock mass in the hypocenter. However, combined with the time difference (about 40 s) between the EQL flash and the shock of the earthquake, the distance (about 100 km) between downtown Sendai and the epicenter, and the transmission speed (about 300 m/s) of the P-holes [29], the origination of the P-holes from the deep hypocenter during the shock of the earthquake should be excluded. However, the electrical carriers may outflow from the heavy-stressed deeper layer to the less-stressed or free-surface layer and accumulate here early before the shock. In this study, the shallow layer was between 0 and 5 km deep, the intermediate layer was 5–30 km deep, and the deep layer was >30 km deep. Both rocks on the ground surface and deeper underground are able to be influenced by the stress during the plate movement, which are possible sources of P-holes. The equivalent stress distribution in the corresponding two-dimensional section with plate extrusion was numerically simulated (Figure A5). As shown in Figure 3c, the simulation uncovered a low-stress zone where the flash occurred. Therefore, activated P-holes were easily transferred from deep crustal rocks to the ground surface along the direction of the local stress gradient upward. The intermediate layer, about 10–20 km below the position of the EQL, as a high-stress zone, contained granite and sandstone with massive peroxy defects, which constitute exactly the necessary conditions for the generation and transmission of P-holes (Figure 3c,e). Nevertheless, the hypocenter (i.e., deep layer) would not be the source of positive charges in consideration of the lack of transport channels for P-holes with an upward stress gradient at great depth.
In addition to the P-holes activated under tectonic stress during the plate movement, positive charges embodied inside the crustal rocks were also induced by P/S waves. The correlation between the EQLs and the relative extremes of the seismic ground acceleration was proved through studies of the 2007 Peru earthquake, the 2016 Ecuador earthquake, and the 2017 Mexico earthquake, which indicated that the passage of S waves is another necessary condition for triggering EQLs [17,40]. Amplification of seismic waves (P/S waves) due to the reflection and refraction of the waves in underground strata could cause the fracturing of weak or loose rocks with compression and shear deformation. As the surface layer was finally fractured with the passing through of S waves, the sudden release of the accumulated positive charges resulted in curtain-like flashes. The release of positive charges is not only related to surface cracks caused by seismic waves but also may be related to tip discharges governed by mountain topography [17]. Considering that the areas where the EQL appeared in Fukushima are mainly plains (Figure 3a), the arrival of S waves was taken as the triggering factor of the EQL in this study but not the tip discharges.
The moment of the flash was regarded as the time when the S wave reached the corresponding position; that is, as soon as the S wave arrived, surface cracks were produced to release positive charges. The P-holes activated by “wave-induced stress” may originate from ground-surface rocks affected by S waves or from rocks in the shallow layer affected by P waves. Equations were established to determine the specific positions of the EQL and the source of the positive charges induced by the P/S waves. The seismic stations around Sendai (Figure 1a) were used to calculate the average propagation velocity of the P (6.1 km/s) and S waves (3.7 km/s) to solve the equations below.
L 1 + L 2 = V S × t l i g h t
t P = L 1 + L 2 V P
L 2 V p h L 2 V P t l i g h t t P
where
  • V S = the velocity of S-wave propagation, km/s;
  •   V P = the velocity of P-wave propagation, km/s;
  • V p h = the transmission velocity of P-holes, km/s;
  • L 1 = the distance between the source of P-holes and the hypocenter, km;
  • L 2 = the distance between the source of P-holes and the position of EQL, km;
  • t l i g h t = the time difference between EQL and the earthquake, second.
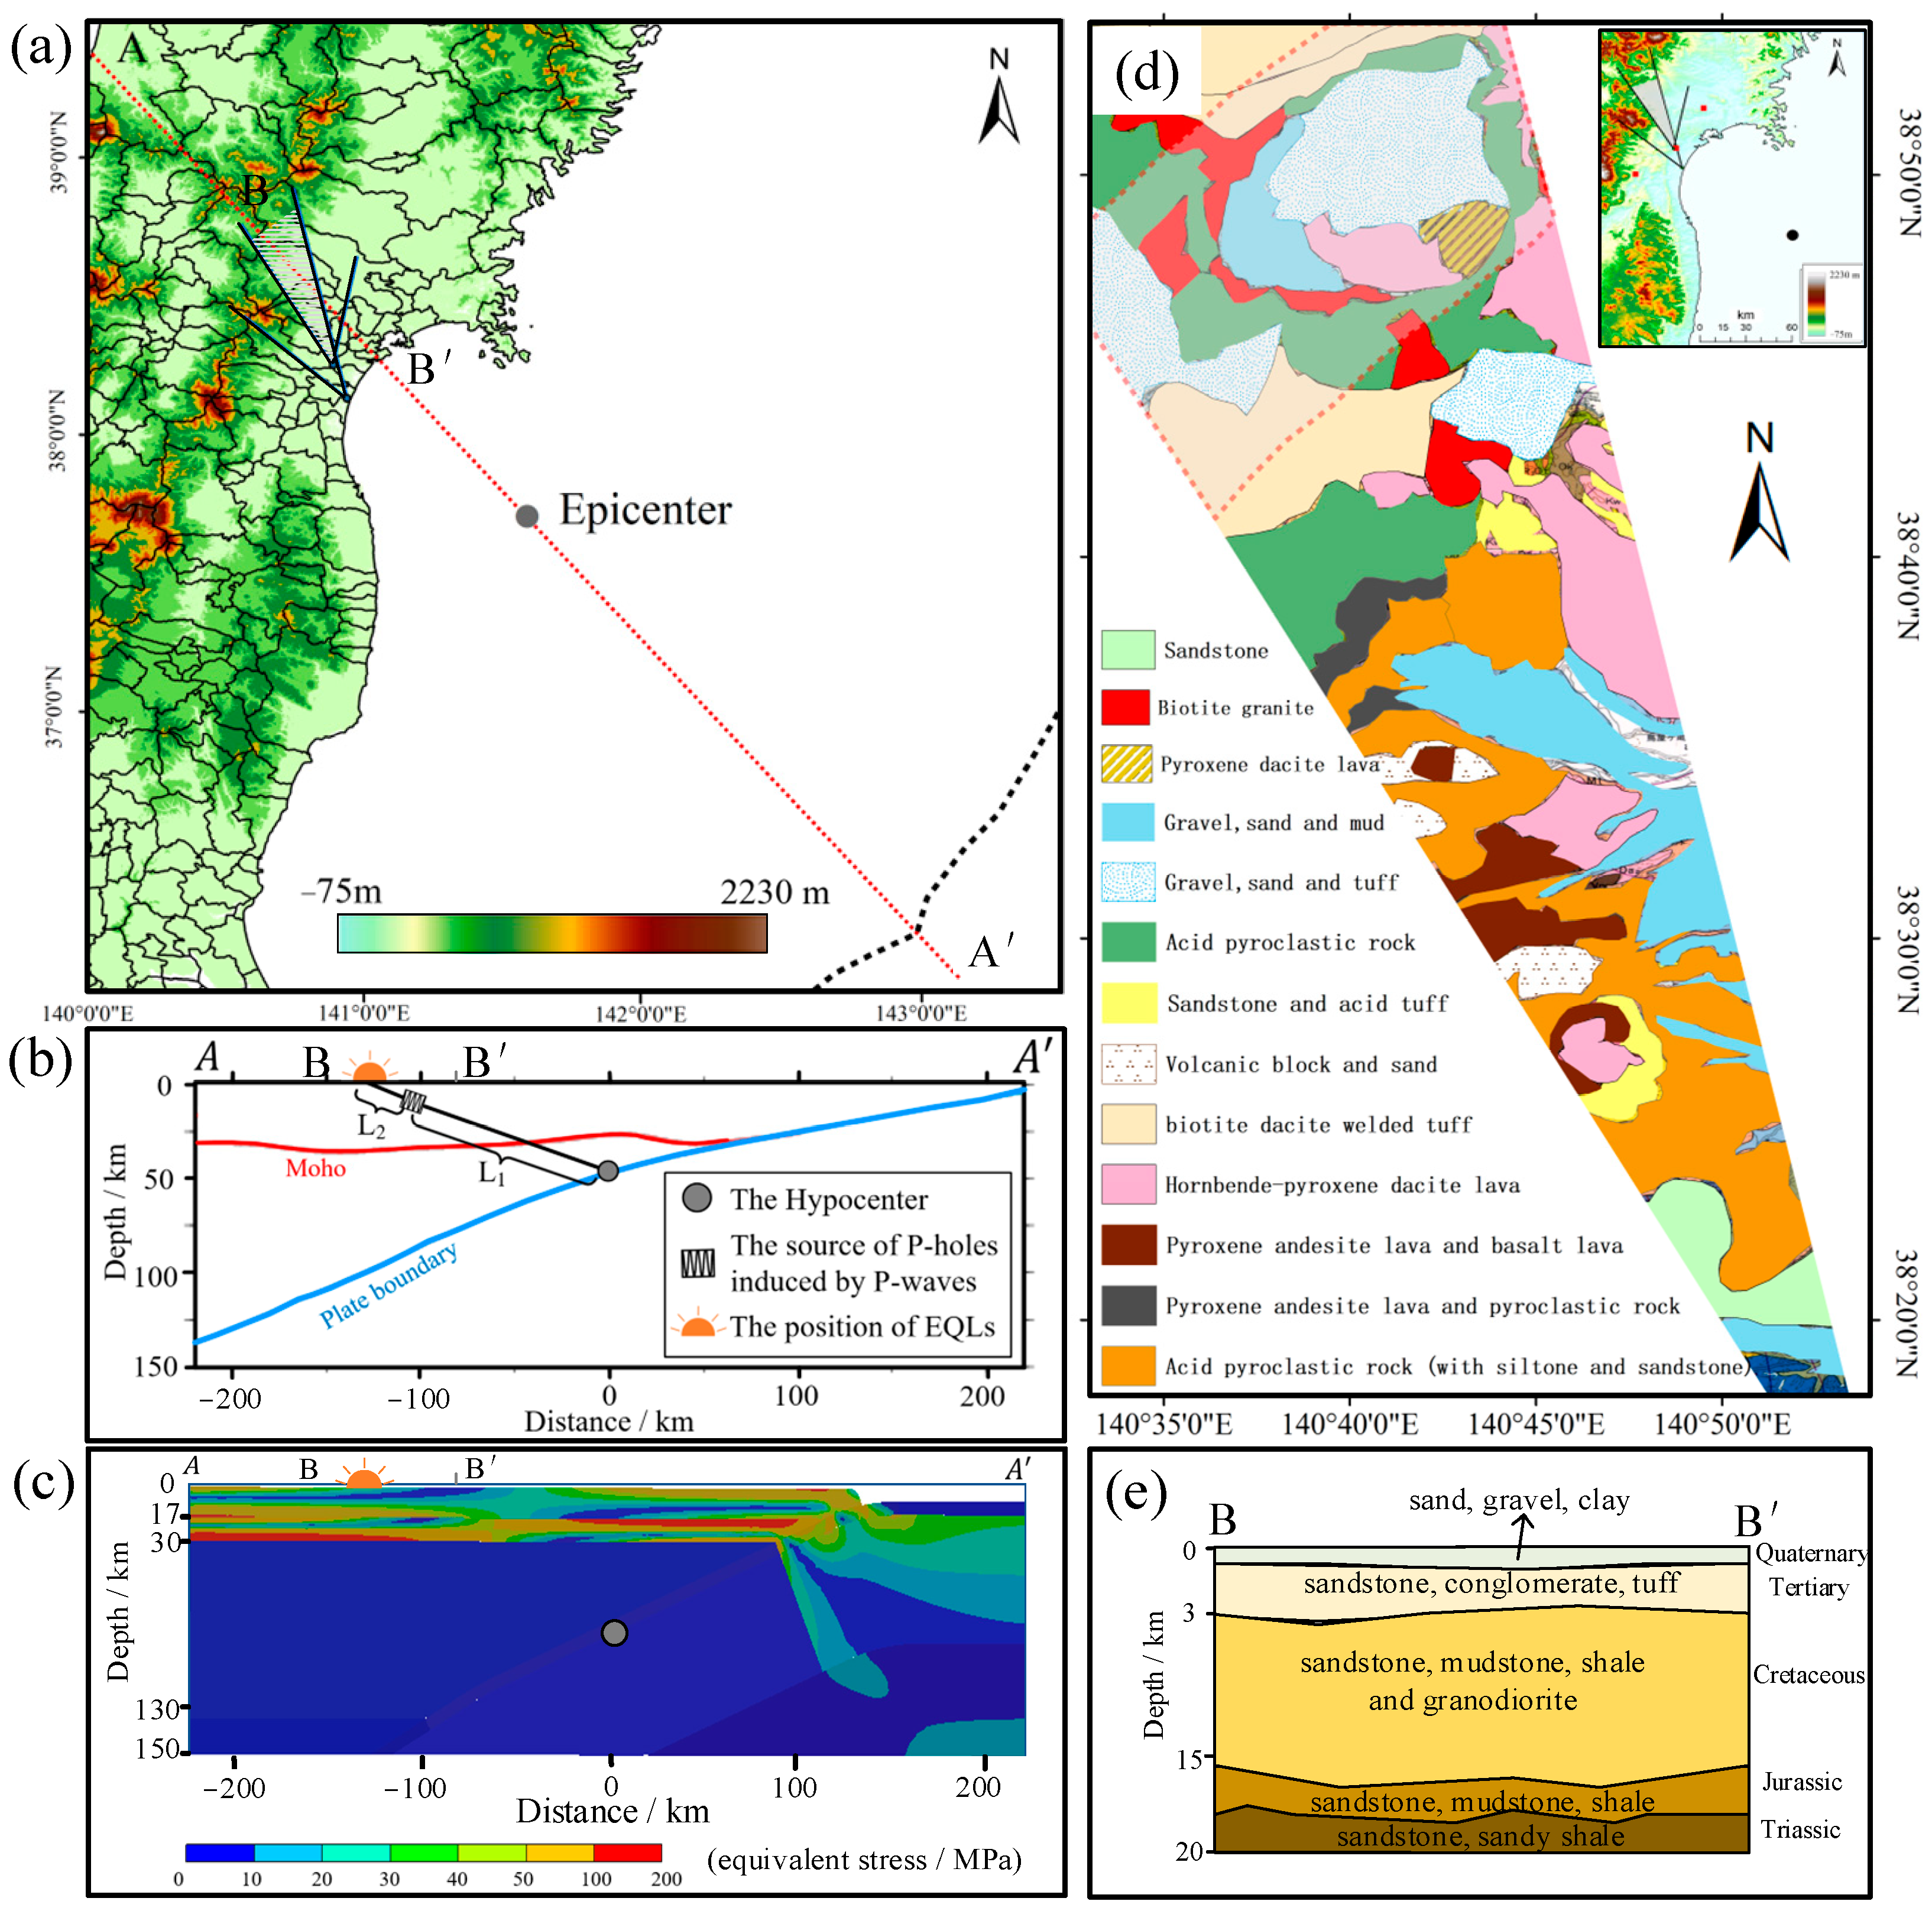
As shown in Figure 3b, the distance between the location of the EQL and the hypocenter was calculated to be about 148 km ( L 1 + L 2 ), and the maximum distance between the source of the P-holes existing in the shallow crust and the location of the EQL was about 5 km ( L 2 ). Using the average velocity of P/S calculated by the seismic stations would easily lead to errors. We set the error of the P/S wave as 0.5 km/s to evaluate its impact on L 2 , which is about ±1.5 km. The geological map showed the existence of biotite and acid-pyroclastic rocks containing massive peroxy bonds within the delineated range (Figure 3d). Additionally, cretaceous strata containing diorite and sandstone with peroxy bonds were found in the stratigraphic data in Miyagi Prefecture, Japan, located 3–15 km underground (Figure 3e). The results proved, to a certain extent, that the P-holes were produced from the sandstone, biotite, and feldspar in the shallow crust and ground surface induced by the P/S wave. Hence, the “wave-induced” stress and the stress caused by plate extrusion should have triggered the activation and release of P-holes together. The ground surface, shallow layer, and intermediate layer were all possible sources of positive charge carriers.
Figure 3. Surface and underground geological data and 2D section stress simulation in northern Japan. (a) Digital elevation map of northern Japan. The epicenter is located at the center (gray circle) of the section line ( A A , red dotted line). (b) Vertical cross-section of underground structures, including tectonic lines [41,42]. The positive carriers triggered by wave-induced stress originate from the rock mass at a distance from the EQL. (c) Equivalent stress simulation result of the 2D model with plate extrusion. The gray circle refers to the hypocenter of the earthquake. (d) Geological map of overlapping portions of the two fields of view (https://gbank.gsj.jp/geonavi, accessed on 15 March 2023). The gray area with a red dotted line indicates the approximate area where the EQL occurred. (e) Two-dimensional stratigraphic section of Miyagi Prefecture, including lithology information (https://trekgeo.net/q/b/31myge.htm, accessed on 15 March 2023).
Remotesensing 15 05052 g003

4.4. Estimation of Seismic PSRC Amplitude Based on the Biot–Savart Law

As mentioned above, the upward PSRC was most likely the underlying mechanism of the EQL and IMHV. For the direction of the IMHV, the spatial relationship of the vectors and related electric current should follow the right-hand spiral rule together; for the magnitude of the IMHV, the magnetic disturbances should follow the quantitative relationship described by the Biot–Savart law in the following (Figure A6):
B = μ 0 I 4 π a c o s θ 1 c o s θ 2
c o s θ 1 = 0
c o s θ 2 = h h 2 + a 2 2
where
  • B = the amplitude of magnetic disturbances;
  • μ 0 = the vacuum permeability;
  • I = the current intensity;
  • a = the Euclidian distance from the observation point to the line of the seismic PSRC;
  • θ 1 = the angle between the observation point and the two endpoints of the seismic PSRC;
  • θ 2 = the angle between the observation point and the two endpoints of the seismic PSRC;
  • H = the length of the seismic PSRC.
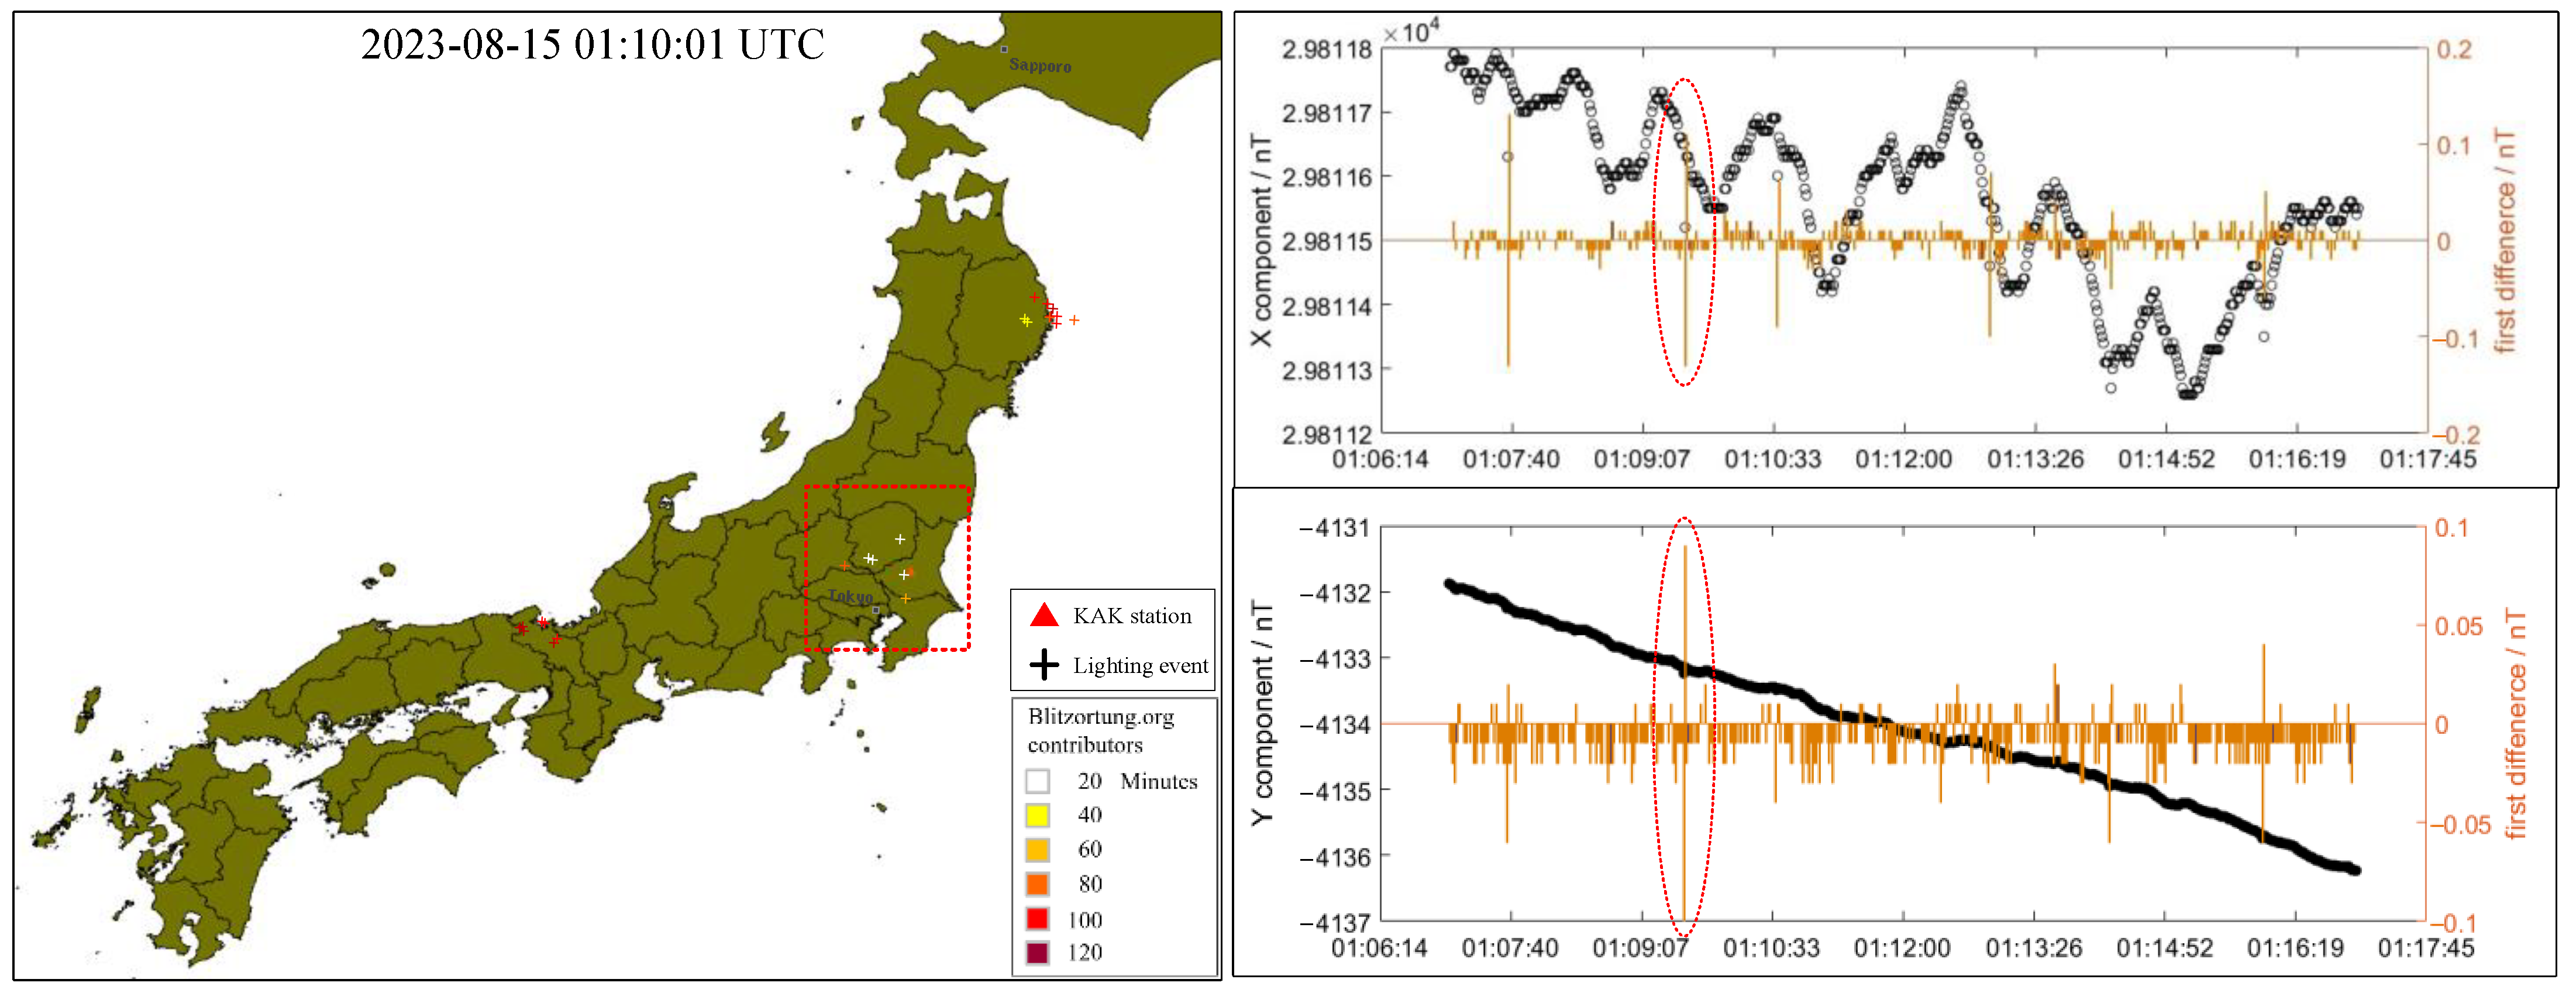
Due to the lack of clear correspondence between the height of the seismic flash and the length of the seismic PSRC, the possible range of the length of the PSRC was determined. The thickness of the shallow strata (i.e., quaternary), where P-holes accumulate, should be the lower limit of the PSRC length (about 0.5 km). The height of the seismic flash can be obtained from the height of the building captured by the downtown camera, the distance from the downtown camera to the building, and the distance from the downtown camera to the flash position. From the height of the seismic flash (about 4.5 km) plus the thickness of the shallow strata, the upper limit of the PSRC can be obtained at 5 km. Based on the Biot–Savart law and the known conditions (i.e., B = 0.24 nT, a = 270 km, H = 0.5–5 km), the amplitude of the PSRC was about 35–350 kA, which was significantly negatively correlated with the current length, as shown in Figure A6. Additionally, we conducted a comprehensive study on the correlation between thunderstorm events and geomagnetic anomalies at the KAK station to enhance the reliability of the theoretical calculations. Due to the lack of specific references focusing on thunderstorm events at the KAK geomagnetic station, we utilized lightning observation data that recorded the spatiotemporal information of lightning events (https://www.blitzortung.org/en/historical_maps.php, accessed on 10 October 2023) to identify their magnetic anomaly characteristics. We then compared these characteristics with the currents generated by seismic flashes. Taking into consideration a thunderstorm event that occurred near the KAK station (<10 km) on 15 August 2023, the amplitude of the horizontal component of the magnetic anomaly detected at 01:07:40 was measured to be 0.1 nT (Figure A7). Previous research [43] indicated that peak lightning currents are approximately 10 kA. In contrast, our theoretical calculations estimated current intensities ranging from 35 kA to 350 kA at a distance of 270 km from the epicenter, resulting in a magnetic disturbance of 0.24 nT. Based on a scaling study (e.g., B scales as I/r), the theoretical values obtained are reasonably reliable, to a certain extent.
The current (35–350 kA) operating for 1 s will lead to a significant charge transfer of 35–350 kCb. The significant charge transfer leading to the rock current may come from the Earth’s surface and underground rock formations. Rodebush and Fiock [44] indicated that the surface charge density of the Earth is approximately 0.1 nCb/m², which translates to a total electron content of 51.5 kCb. Moreover, experimental results on rock samples with dimensions of 5 cm × 5 cm × 7 cm showed a pre-failure current release of 115 nA. Considering the scale effect, for an underground rock mass with dimensions of 0.175 km × 10 km × 10 km, even with a loss rate of 90%, it is still possible for it to release approximately 1.15 MA of current at the moment of rupturing.

5. Conclusions

The principal results of this paper are as follows:
(1).
The geomagnetic anomaly of the declination component that exceeds the 0.72″ threshold was discovered synchronously manifesting with the EQL, and the clear intersection between the normal of the horizontal vector of magnetic disturbance and the location where the EQL appears was found. Based on the direct current magnetic effect and rock experiments, we speculated that an upward PSRC occurred at the location of the EQL, which should be attributed to the outburst of a flash and a horizontal magnetic field disturbance.
(2).
The underlying mechanism and source of P-holes that caused the co-seismic EQL of the M7.3 Fukushima earthquake on 16 March 2022 were preliminary analyzed. The passage of the P/S waves and the stress generated by plate compression resulted in the activation and release of P-holes along the stress gradient to shallow, weak-loose strata. The arrival of the S wave triggered the rupturing of the ground surface, leading to abrupt releases of accumulated PSRC, which generated strong EQL and IMHV.
(3).
Different from previous analyses of magnetic anomalies, this study combined the direction and magnitude information of magnetic anomalies to retrieve magnetic anomalies from the horizontal vector and analyze the spatiotemporal relationship between magnetic anomalies and EQLs. The methodology proposed in this study could be further applied to locate potential seismogenic zones based on IMHVs observed by multiple geomagnetic instruments installed at different stations.

Author Contributions

Conceptualization, B.X.; methodology, B.X.; software, B.X. and Z.W.; validation, L.S. and Y.X.; formal analysis, Y.X.; investigation, B.X.; resources, L.W.; data curation, W.M.; writing—original draft preparation, B.X.; writing—review and editing, L.W.; visualization, B.X.; supervision, L.W.; project administration, W.M.; funding acquisition, L.W. All authors have read and agreed to the published version of the manuscript.

Funding

This study was supported by the Key Program of National Nature Science Foundation of China (41930108), National Nature Science Foundation of China (42101394).

Data Availability Statement

Data collected in our study and used to analyze the results are available here (https://doi.org/10.5281/zenodo.8042001).

Acknowledgments

We are grateful to INTERMAGNET, the Japan Meteorological Agency, USGS, the geological map display system of the Geological Survey of Japan, and the Active Fault Database of Japan for providing the datasets used in this study.

Conflicts of Interest

The authors declare no conflict of interest.

Appendix A

Figure A1. Original observation data and first-order difference of the X and Y components of the three geomagnetic stations from 14:36:30 to 14:37:30 (UTC). The first-order differences of the X (−0.02 nT) and Y (0.24 nT) components at the moment of the EQL were extracted to synthesize the IMHV. The blue line represents the moments when the earthquake lights occur.
Remotesensing 15 05052 g0a1
Figure A2. Original observation data of component D of the three geomagnetic stations during the M7.1 Fukushima earthquake on 7 April 2011. The red line is the moment of the shock at 14:32:43 (UTC), while the exact EQL moment was unknown due to the lack of digital records.
Remotesensing 15 05052 g0a2
Figure A3. Original observation data of the D and H components of the KAK geomagnetic station during the M6.3 Fukushima earthquake on 28 December 2016. The gray line is the moment of the shock at 12:38:49 (UTC), while the red lines are the arrival of the P and S waves, respectively.
Remotesensing 15 05052 g0a3
Figure A4. Schematic PSRC variations in the rock dynamics and fracturing process. By connecting the loaded and unloaded ends of the rock sample to form a loop, the measured PSRC manifested an obvious step-like increment and positive and negative fluctuations before failure.
Remotesensing 15 05052 g0a4
A simulation was performed of the two-dimensional (2D) stress distribution in the extrusion process of the Pacific Plate under the Okhotsk Plate. The ANSYS 2021 R1 software was utilized for a numerical simulation to express the stress distribution. The section model, with a length of about 450 km and a depth of about 150 km, was mainly divided into continental crust, oceanic crust, and mantle. The mechanical properties of the layers at different depths are mainly based on previous studies [45,46]. The left side of the section was fixed, and the displacement constraint was imposed on the right side to simulate the difference in the stress concentrations caused by the Pacific Plate subducting westward at an average annual horizontal speed of 80 mm below the Japan Trench.
Figure A5. Two-dimensional grid model of related sections for simulating the equivalent stress distribution in the process of plate subduction. Different colors of strata represent their different mechanical properties and constitutive relationships.
Remotesensing 15 05052 g0a5
Figure A6. Estimation of PSRC amplitude based on the Biot–Savart law. (a) Schematic diagram of the Biot–Savart law in a vertical profile, where h is the length of the seismic PSRC; I is the current intensity; a is the Euclidian distance from the observation point to the line of the seismic PSRC; and θ 1 and θ 2 are the angles between the observation point and the two endpoints of the seismic PSRC, respectively. Point P is an observation point in the three-dimensional space. (b) Curve describing the quantitative relationship between the amplitude and length of PSRC. The estimated lower and upper limits of the length of this seismic PSRC were marked with red dotted lines.
Remotesensing 15 05052 g0a6
Figure A7. The thunderstorm event that occurred on 15 August 2023 and the corresponding geomagnetic anomalies detected at the KAK geomagnetic station during the period of interest. The thunderstorm lightning event was within no more than 5 km from the KAK station, and during this time, the amplitudes of the X and Y components of the geomagnetic anomaly detected at 01:07:40 were approximately 0.1 nT (yellow ellipse).
Remotesensing 15 05052 g0a7

References

  1. Wen, S.; Chen, C.H.; Yen, H.Y.; Yeh, T.K.; Liu, J.Y.; Hattori, K.; Peng, H.; Wang, C.H.; Shin, T.C. Magnetic storm free ULF analysis in relation with earthquakes in Taiwan. Nat. Hazards Earth Syst. Sci. 2012, 12, 1747–1754. [Google Scholar] [CrossRef]
  2. Hattori, K.; Han, P.; Yoshino, C.; Febriani, F.; Yamaguchi, H.; Chen, C. Investigation of ULF Seismo-Magnetic Phenomena in Kanto, Japan During 2000–2010: Case Studies and Statistical Studies. Surv. Geophys. 2013, 34, 293–316. [Google Scholar] [CrossRef]
  3. De Santis, A.; Marchetti, D.; Spogli, L.; Cianchini, G.; Pavón-Carrasco, F.J.; Franceschi, G.D.; Di Giovambattista, R.; Perrone, L.; Qamili, E.; Cesaroni, C.; et al. Magnetic Field and Electron Density Data Analysis from Swarm Satellites Searching for Ionospheric Effects by Great Earthquakes: 12 Case Studies from 2014 to 2016. Atmosphere 2019, 10, 371. [Google Scholar] [CrossRef]
  4. Soloviev, A.A. Geomagnetic Effect of the Earthquakes with Mw = 7.5–7.8 in Turkey on February 6, 2023. Dokl. Earth Sci. 2023, 511, 578–584. [Google Scholar] [CrossRef]
  5. Uyeda, S.; Nagao, T.; Kamogawa, M. Short-term earthquake prediction: Current status of seismo-electromagnetics. Tectonophysics 2009, 470, 205–213. [Google Scholar] [CrossRef]
  6. Varotsos, P.A.; Sarlis, N.V.; Skordas, E.S. Phenomena preceding major earthquakes interconnected through a physical model. Ann. Geophys. 2019, 37, 315–324. [Google Scholar] [CrossRef]
  7. Gotoh, K.; Akinaga, Y.; Hayakawa, M.; Hattori, K. Principal component analysis of ULF geomagnetic data for Izu islands earthquakes in July 2000. J. Atmos. Electr. 2002, 22, 1–12. [Google Scholar] [CrossRef]
  8. Xu, G.J.; Han, P.; Huang, Q.H.; Hattori, K.; Febriani, F.; Yamaguchi, H. Anomalous behaviors of geomagnetic diurnal variations prior to the 2011 off the Pacific coast of Tohoku earthquake (Mw9.0). J. Asian Earth Sci. 2013, 77, 59–65. [Google Scholar] [CrossRef]
  9. Hayakawa, M.; Itoh, T.; Hattori, K.; Yumoto, K. ULF electromagnetic precursors for an earthquake at Biak, Indonesia on February 17, 1996. Geophys. Res. Lett. 2000, 27, 1531–1534. [Google Scholar] [CrossRef]
  10. Ida, Y.; Yang, D.; Li, Q.; Sun, H.; Hayakawa, M. Detection of ULF electromagnetic emissions as a precursor to an earthquake in China with an improved polarization analysis. Nat. Hazards Earth Syst. Sci. 2008, 8, 775–777. [Google Scholar] [CrossRef]
  11. Hayakawa, M.; Kawate, R.; Molchanov, O.A.; Yumoto, K. Results of ultra-low-frequency magnetic field measurements during the Guam earthquake of 8 August 1993. Geophys. Res. Lett. 1996, 23, 241–244. [Google Scholar] [CrossRef]
  12. Iyemori, T.; Kamei, T.; Tanaka, Y.; Takeda, M.; Hashimoto, T.; Araki, T.; Okamoto, T.; Watanabe, K.; Sumitomo, N.; Oshiman, N. Co-seismic geomagnetic variations observed at the 1995 Hyogoken-Nanbu earthquake. J. Geomagn. Geoelectr. 1996, 48, 1059–1070. [Google Scholar] [CrossRef]
  13. Muafiry, I.N.; Heki, K. 3-D Tomography of the Ionospheric Anomalies Immediately Before and After the 2011 Tohoku-Oki (Mw 9.0) Earthquake. J. Geophys. Res. Space Phys. 2020, 125, e2020JA027993. [Google Scholar] [CrossRef]
  14. Heki, K. Ionospheric electron enhancement preceding the 2011 Tohoku-Oki earthquake. Geophys. Res. Lett. 2011, 38. [Google Scholar] [CrossRef]
  15. Derr, J.S. Earthquake lights; a review of observations and present theories. Bull. Seismol. Soc. Am. 1973, 63, 2177–2187. [Google Scholar]
  16. Fidani, C. The earthquake lights (EQL) of the 6 April 2009 Aquila earthquake, in central Italy. Nat. Hazards Earth Syst. Sci. 2010, 10, 967–978. [Google Scholar] [CrossRef]
  17. Heraud, J.A.; Lira, J.A. Co-seismic luminescence in Lima, 150 km from the epicenter of the Pisco, Peru earthquake of 15 August 2007. Nat. Hazards Earth Syst. Sci. 2011, 11, 1025–1036. [Google Scholar] [CrossRef]
  18. Theriault, R.; St-Laurent, F.; Freund, F.T.; Derr, J.S. Prevalence of earthquake lights associated with rift environments. Seismol. Res. Lett. 2014, 85, 159–178. [Google Scholar] [CrossRef]
  19. Barka, A. The 17 august 1999 Izmit earthquake. Science 1999, 285, 1858–1859. [Google Scholar] [CrossRef]
  20. Johnston, A.C. Light from seismic waves. Nature 1991, 354, 361. [Google Scholar] [CrossRef]
  21. St-Laurent, F.; Derr, J.S.; Freund, F.T. Earthquake lights and the stress-activation of positive hole charge carriers in rocks. Phys. Chem. Earth. 2006, 31, 305–312. [Google Scholar] [CrossRef]
  22. Liperovsky, V.A.; Meister, C.; Liperovskaya, E.V.; Davidov, V.F.; Bogdanov, V.V. On the possible influence of radon and aerosol injection on the atmosphere and ionosphere before earthquakes. Nat. Hazards Earth Syst. Sci. 2005, 5, 783–789. [Google Scholar] [CrossRef]
  23. Enomoto, Y.; Yamabe, T.; Okumura, N. Causal mechanisms of seismo-EM phenomena during the 1965–1967 Matsushiro earthquake swarm. Sci. Rep. 2017, 7, 44774. [Google Scholar] [CrossRef] [PubMed]
  24. Freund, F. Co-seismic earthquake lights: The underlying mechanism. Pure Appl. Geophys. 2019, 176, 3439–3450. [Google Scholar] [CrossRef]
  25. Brady, B.T.; Rowell, G.A. Laboratory investigation of the electrodynamics of rock fracture. Nature 1986, 321, 488–492. [Google Scholar] [CrossRef]
  26. Whitworth, R.W. Charged dislocations in ionic crystals. Adv. Phys. 1975, 24, 203–304. [Google Scholar] [CrossRef]
  27. Varotsos, P.; Alexopoulos, K.; Nomicos, K. Comments on the Pressure Variation of the Gibbs Energy for Bound and Unbound Defects. Phys. Status Solidi B 1982, 111, 581–590. [Google Scholar] [CrossRef]
  28. Hadjicontis, V.; Mavromatou, C. Transient electric signals prior to rock failure under uniaxial compression. Geophys. Res. Lett. 1994, 21, 1687–1690. [Google Scholar] [CrossRef]
  29. Freund, F. Charge generation and propagation in igneous rocks. J. Geodyn. 2002, 33, 543–570. [Google Scholar] [CrossRef]
  30. Freund, F.T.; Takeuchi, A.; Lau, B.W.S. Electric currents streaming out of stressed igneous rocks—A step towards understanding pre-earthquake low frequency EM emissions. Phys. Chem. Earth Parts A/B/C 2006, 31, 389–396. [Google Scholar] [CrossRef]
  31. Mao, W.; Wu, L.; Xu, Y.; Yao, R.; Lu, J.; Sun, L.; Qi, Y. Pressure-Stimulated Rock Current as Loading Diorite to Failure: Particular Variation and Holistic Mechanisms. J. Geophys. Res.-Solid Earth 2022, 127, e2022JB024931. [Google Scholar] [CrossRef]
  32. Takeuchi, A.; Futada, Y.; Okubo, K.; Takeuchi, N. Positive electrification on the floor of an underground mine gallery at the arrival of seismic waves and similar electrification on the surface of partially stressed rocks in laboratory. Terra Nova 2010, 22, 203–207. [Google Scholar] [CrossRef]
  33. Kamogawa, M.; Liu, J.; Fujiwara, H.; Chuo, Y.; Tsai, Y.; Hattori, K.; Nagao, T.; Uyeda, S.; Ohtsuki, Y. Atmospheric field variations before the March 31, 2002 M6. 8 earthquake in Taiwan. Terr. Atmos. Ocean. Sci. 2004, 15, 397–412. [Google Scholar] [CrossRef]
  34. Anastasiadis, C.; Triantis, D.; Hogarth, C.A. Comments on the phenomena underlying pressure stimulated currents in dielectric rock materials. J. Mater. Sci. 2007, 42, 2538–2542. [Google Scholar] [CrossRef]
  35. Li, M.; Wang, H.; Wang, D.; Shao, Z. Experimental study on characteristics of surface potential and current induced by stress on coal mine sandstone roof. Eng. Geol. 2020, 266, 105468. [Google Scholar] [CrossRef]
  36. Li, D.; Wang, E.; Li, Z.; Ju, Y.; Wang, D.; Wang, X. Experimental investigations of pressure stimulated currents from stressed sandstone used as precursors to rock fracture. Int. J. Rock Mech. Min. Sci. 2021, 145, 104841. [Google Scholar] [CrossRef]
  37. Jackson, J.D. Classical Electrodynamics; Wiley: New York, NY, USA, 1999. [Google Scholar]
  38. Skordas, E.; Kapiris, P.; Bogris, N.; Varotsos, P. Field experimentation on the detectability of co-seismic electric signals. Proc. Jpn. Acad. Ser. B 2000, 76, 51–56. [Google Scholar] [CrossRef]
  39. Vallianatos, F.; Triantis, D.; Tzanis, A.; Anastasiadis, C.; Stavrakas, I. Electric earthquake precursors: From laboratory results to field observations. Phys. Chem. Earth Parts A/B/C 2004, 29, 339–351. [Google Scholar] [CrossRef]
  40. Lira, J.A.; Mulas, M. Time difference correlation between earthquake lights and seismic ground accelerations. Appl. Geophys. 2021, 18, 9–16. [Google Scholar] [CrossRef]
  41. Katsumata, A. Depth of the Moho discontinuity beneath the Japanese islands estimated by traveltime analysis. J. Geophys. Res. Solid Earth 2010, 115. [Google Scholar] [CrossRef]
  42. Zhao, D.; Horiuchi, S.; Hasegawa, A. Seismic velocity structure of the crust beneath the Japan Islands. Tectonophysics 1992, 212, 289–301. [Google Scholar] [CrossRef]
  43. Feynman, R.P.; Leighton, R.B.; Sands, M. The Feynman Lectures on Physics; Vol. I. Am. J. Phys. 1965, 33, 750–752. [Google Scholar] [CrossRef]
  44. Rodebush, W.H.; Fiock, E.F. The Measurement of the Absolute Charge on the Earth’s Surface. Proc. Natl. Acad. Sci. USA 1925, 11, 402–404. [Google Scholar] [CrossRef] [PubMed]
  45. Loo, H.Y.; Gao, X.L.; Sun, J.X.; Mikumo, T.; Hirahara, K.; Yoshioka, S. Three-dimensional numerical modeling of earthquake migration along a northwestern Pacific Subduction Slab. Geophys. Res. Lett. 1992, 19, 313–316. [Google Scholar] [CrossRef]
  46. Jiang, H.; Deng, Z.H.; Gao, X.; Chen, M.; Yang, Z. Numerical modeling of earthquake generating processes in the Japan subduction slab. Chin. J. Geophys. 2013, 56, 2303–2312. (In Chinese) [Google Scholar]
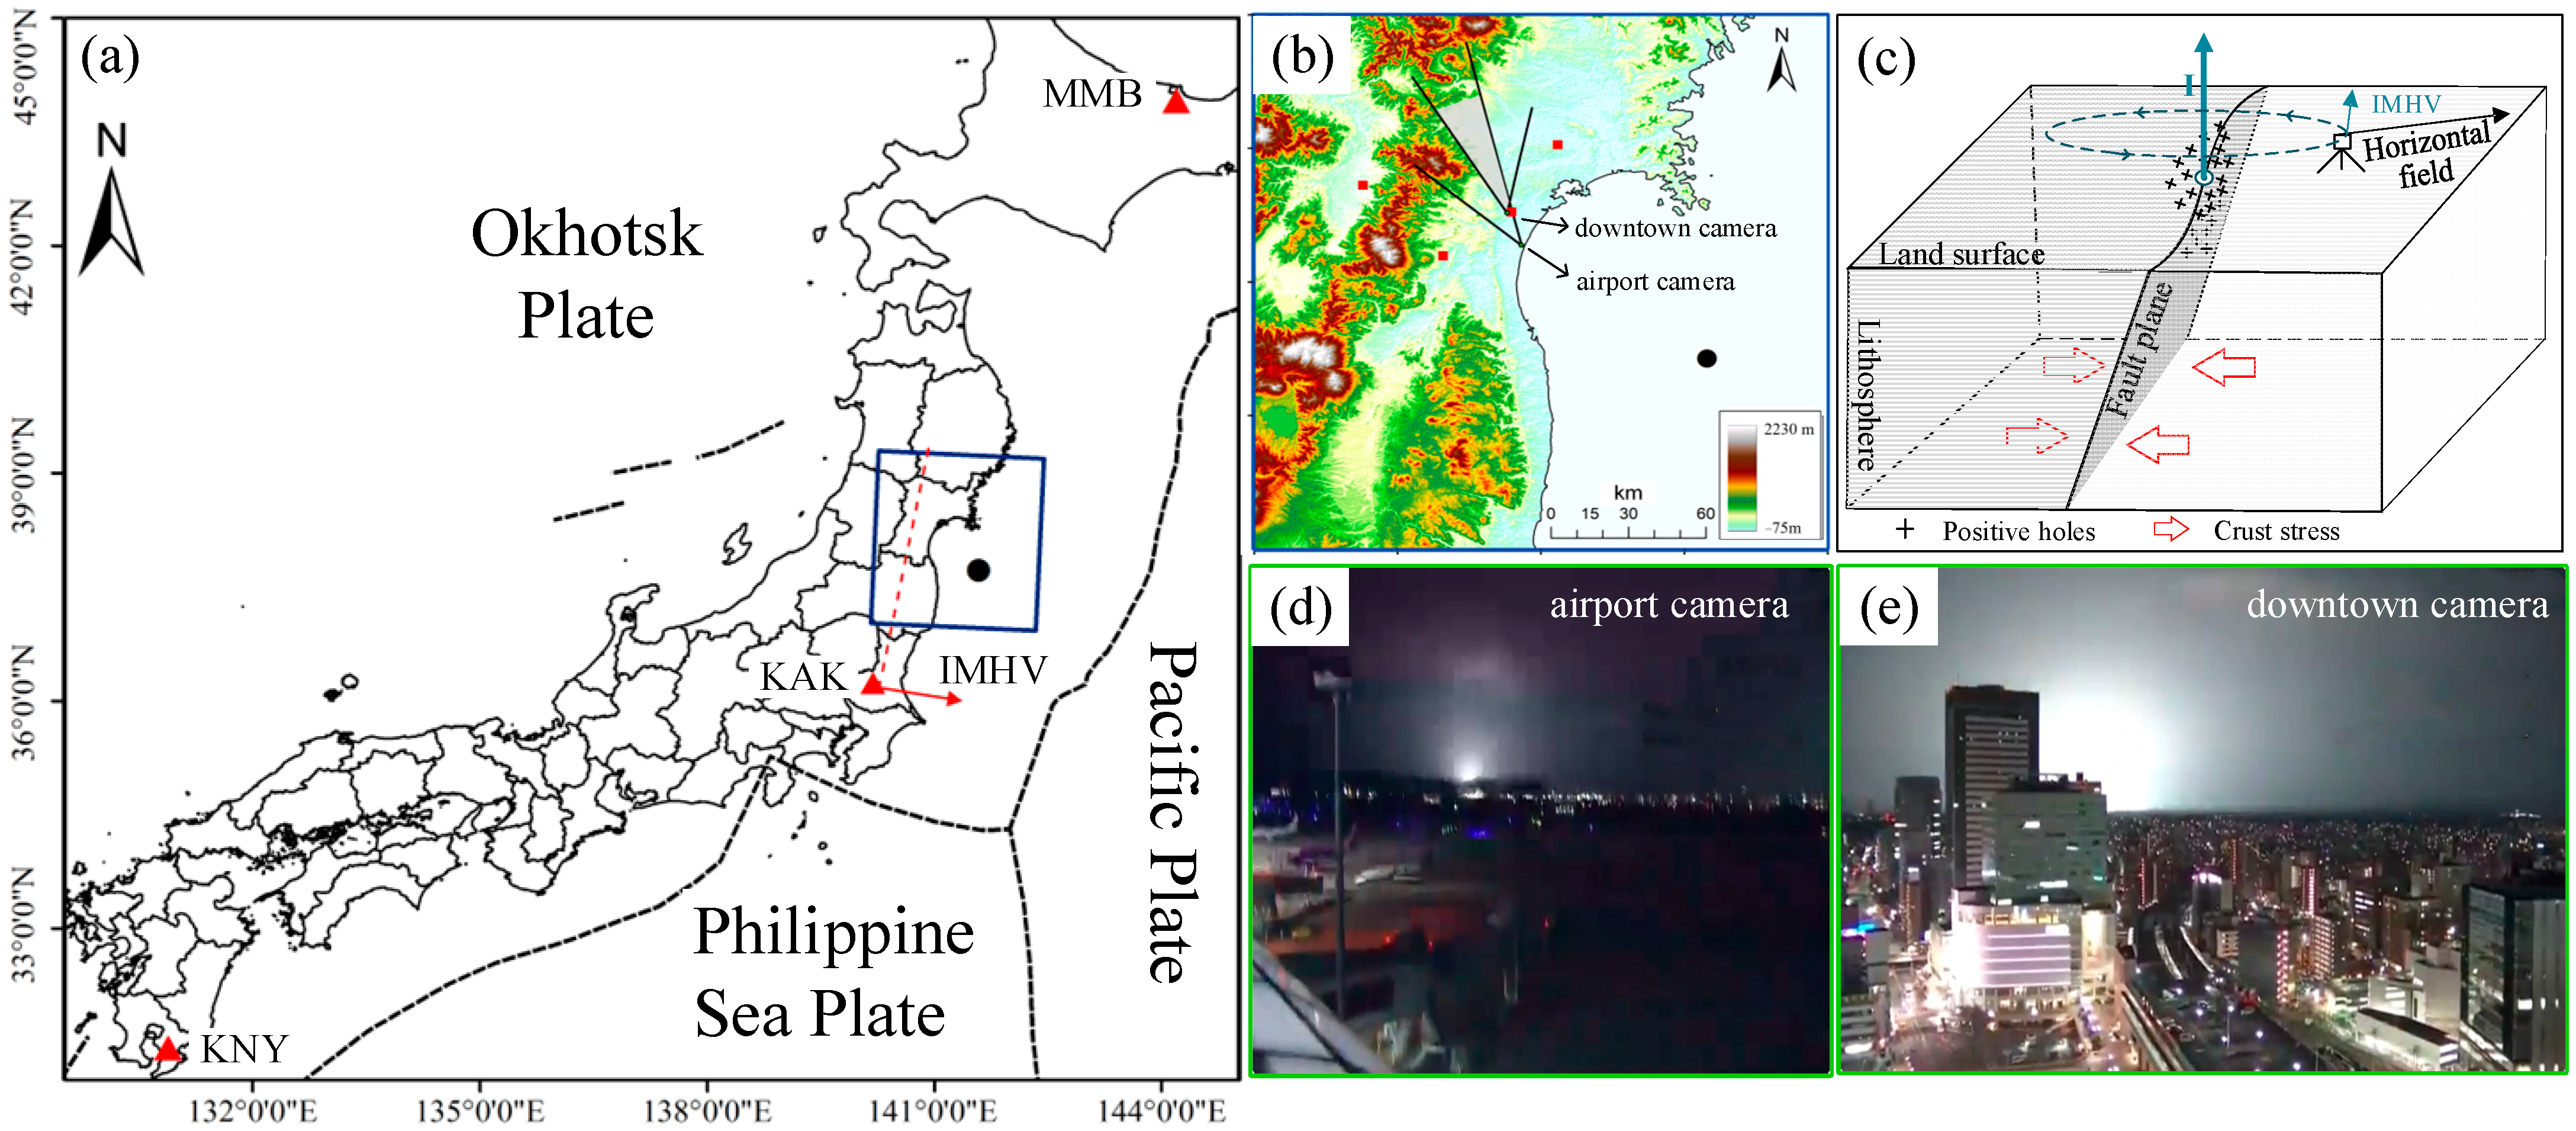
Figure 1. Location of the study area in northern Japan and schematic diagram of the induced magnetic horizontal vector (IMHV). (a) Location of the study area and geomagnetic stations (red triangle in the thumbnail) used in the study. The black circle indicates the epicenter of the Fukushima earthquake. The red arrow and the dotted line represent the IMHV and the normal line detected by the geomagnetic station KAK (discussed in detail below), respectively. (b) Geographical map of northeastern Japan and seismic stations (red square). Position and orientation of the downtown camera and airport camera, looking northwest. The overlapping portion of the fields of view of the cameras is marked as a gray area. (c) Schematic diagram of seismic PSRC and accompanying IMHV. The seismic currents caused by the accumulation and rapid release of P-holes were able to generate IMHV and superpose on the horizontal component of the original geomagnetic field. The dotted arrows refer to the induced magnetic fields caused by rock current. (d) EQL photographed in Sendai airport from 14:37:10.93 to 14:37:11.07 (UTC). (e) EQL photographed in downtown Sendai from 14:37:12.86 to 14:37:14.16 (UTC).
Remotesensing 15 05052 g001
Figure 2. Original observation data and first-order difference of the D and H components of the three geomagnetic stations from 14:36:30 to 14:37:30 (UTC). The blue line represents the moments when the earthquake lights occur.
Remotesensing 15 05052 g002
Disclaimer/Publisher’s Note: The statements, opinions and data contained in all publications are solely those of the individual author(s) and contributor(s) and not of MDPI and/or the editor(s). MDPI and/or the editor(s) disclaim responsibility for any injury to people or property resulting from any ideas, methods, instructions or products referred to in the content.