Article

Edge Consistency Feature Extraction Method for Multi-Source Image Registration

1
School of Computer Science and Technology, Xidian University, Xi’an 710071, China
2
Ministry of Water Resources, Beijing 101400, China
3
School of Telecommunication Engineering, Xidian University, Xi’an 710071, China
4
State Grid Jilin Province Electric Power Company Limited Information Communication Company, Changchun 130021, China
5
School of Electronic Engineering, Xidian University, Xi’an 710071, China
*
Author to whom correspondence should be addressed.
Remote Sens. 2023, 15(20), 5051; https://doi.org/10.3390/rs15205051
Submission received: 16 July 2023 / Revised: 24 August 2023 / Accepted: 25 August 2023 / Published: 21 October 2023

Abstract

:
Multi-source image registration has often suffered from great radiation and geometric differences. Specifically, grayscale and texture from similar landforms in different source images often show significantly different visual features, and these differences disturb the corresponding point extraction in the following image registration process. Considering that edges between heterogeneous images can provide homogeneous information and more consistent features can be extracted based on image edges, an edge consistency radiation-change insensitive feature transform (EC-RIFT) method is proposed in this paper. Firstly, the noise and texture interference are reduced by preprocessing according to the image characteristics. Secondly, image edges are extracted based on phase congruency, and an orthogonal Log-Gabor filter is performed to replace the global algorithm. Finally, the descriptors are built with logarithmic partition of the feature point neighborhood, which improves the robustness of the descriptors. Comparative experiments on datasets containing multi-source remote sensing image pairs show that the proposed EC-RIFT method outperforms other registration methods in terms of precision and effectiveness.

1. Introduction

With the continuous breakthrough of remote sensing technology, the ways to obtain information through multi-source satellites, unmanned aerial vehicles, and other sensors have gradually increased, and the space–air–ground integrated system based on multi-sensors has gradually improved. Due to the different methods and principles of data acquisition by different sensors, the acquired Earth observation data have their own information advantages, and edge intelligence greatly improves multi-source data transmission and processing speed [1]. In order to integrate the multi-source remote sensing data to achieve complementary advantages and improve the data availability, information fusion of remote sensing images is usually required. Multi-source image registration refers to the technology of matching images in the same scene obtained by different image sensors and establishing the spatial geometric transformation relationship between them. Its accuracy and efficiency will directly impact the subsequent tasks, such as remote sensing interpretation in land-use surveillance [2]. Although the remote sensing data are commonly coarse-registered with the spatial reference, there are still slight translation or rotation differences between the images. The fine-registration task is particularly important to realize the precise alignment of objects.
However, due to the large differences in the operating mechanisms and conditions of imaging sensors, multi-source remote sensing images often show significant variations in the geometric and radiometric features. These obvious differences between multi-source remote sensing images are reflected in the registration process as the same landform or the target in the image presents distinct image features, especially internal texture features. Therefore, algorithms such as SIFT proposed for homologous registration often fail [3]. Traditional multi-source image registration methods can be divided into two categories: region-based and feature-based methods. Region-based methods often use similarity measures and optimization methods to accurately estimate transformation parameters. A typical solution is to evaluate similarity with MI [4], which is generally limited by high computational complexity. Another approach is to improve processing efficiency through the domain transfer techniques such as fast Fourier Transform (FFT) [5]. However, facing large-scale remote sensing images, region-based methods are sensitive to severe noise caused by imaging sensors and atmosphere, making it difficult to be applied widely. Therefore, feature-based methods are more commonly used in the remote sensing field. These methods usually detect significant features between images (such as points, lines, and regions) and then identify correspondence by describing the detected features. The PSO-SIFT algorithm optimizes the calculation of image gradients based on SIFT and exploits the intrinsic information of feature points to increase the number of accurate matching points for the problem of multi-source image matching [6]. The applicatory multi-source data include optical, SAR, infrared, and LiDAR images, and the SAR and optical images are the most widely used and representative ones. Therefore, many studies focus on SAR–optical registration. OS-SIFT is mainly focused on SAR images and optical images matching and uses the multiscale exponential weighted average ratio and the multiscale Sobel operator to calculate the SAR image and optical image gradients to improve the robustness [7]. The multiscale histogram of local main orientation (MS-HLMO) [8] method develops a basic feature map for local feature extraction and a matching strategy based on Gaussian scale space. The development of deep learning technology has accelerated the research of computer vision, and more and more learning-based methods have emerged in the registration field [9]. A common strategy is to generate deep and advanced image representations, such as using the network to train feature detectors [10], descriptors [11], or similarity measures, instead of traditional registration steps. There are also many methods based on Siamese networks or pseudo-Siamese networks [12], which obtain the deep feature representation by training the network [13] and then calculate the similarity of the output feature map to achieve template matching. As the basis of the deep learning method, large datasets are critical to its performance. However, there are few available multi-source remote sensing datasets and the acquisition cost is high; labeled examples are even rarer, resulting in the difficulty of wide application to multi-source data, which greatly limits the development of learning-based methods.
These early feature-based methods are mainly based on gradient information, but the application in multi-source image registration is often limited due to the sensitivity to illumination differences, contrast differences, etc. In recent years, as the concept of phase congruency (PC) [14] has been introduced into image registration, more and more registration methods based on it show superior performance. The histogram of orientated phase congruency (HOPC) feature descriptor achieves matching between multiple modal images by constructing descriptors from phase congruency intensity and orientation information [15]. Li et al. proposed a radiation change insensitive feature transformation (RIFT) algorithm to detect significant corner and edge feature points on the phase congruency map and constructed the maximum index map (MIM) descriptor based on the Log-Gabor convolution image sequences [16], realizing the insensitivity to multi-modal image radiation changes. Yao et al. proposed a histogram of absolute phase consistency gradients (HAPCG) algorithm, which extended the phase consistency model, established absolute phase consistency directional gradients, and built the HAPCG descriptors [17] achieving robust matching between different source images with large illumination and contrast difference. Fan et al. proposed a 3MRS method based on a 2D phase consistency model to construct a new template feature based on Log-Gabor convolutional image sequences and used 3D phase correlation as a similarity metric [18]. In general, although these phase-congruency-based registration methods demonstrate excellent performance in multi-source image matching, there are still two problems for remote sensing images registration: (1) the interference of noise and texture on feature extraction cannot be avoided; (2) the computation of phase congruency involves Log-Gabor transforms at multiple scales and directions, which is heavy in computation and results in the extension of feature detection time.
The key to automatic registration of multi-source images lies in how to extract and match feature points between heterogeneous images. Since edges are relatively stable features in multi-source images, which can maintain stability when the imaging conditions or mode changes [19], feature extraction based on edge contour information can greatly enhance the registration performance. As shown in Figure 1, for the same area, terrain selected by the red box exhibits significant differences in multi-source images, while the edge marked with the green box tends to be more consistent. Therefore, a multi-source remote sensing image registration method based on homogeneous features is proposed in this paper, namely, edge consistency radiation-variation insensitive feature transform (EC-RIFT). Firstly, in order to suppress speckle noise without destroying edge integrity, a non-local mean filter is performed on SAR images, and edge enhancement is applied to visible images with abundant texture to help extract coherent features. Secondly, image edge information is extracted based on phase congruency, and the orthogonal Log-Gabor filter (OLG) is chosen instead of the global filter algorithm for feature dimension reduction, speeding up the feature detection. Finally, the EC-RIFT algorithm constructs descriptors based on the sector neighborhood of edge feature points, which is more sensitive to nearby points and improves the robustness of the descriptors, thus improving the registration accuracy. The main contributions of our paper are as follows:
  • To capture the similarity of geometric structures and morphological features, phase congruency is used to extract image edges, and the differences between multi-source remote sensing images are suppressed by eliminating noise and weakening texture.
  • To reduce computing costs, phase congruency models are constructed using Log-Gabor filtering in orthogonal directions.
  • To increase the dependability of descriptor features with richer description information, sector descriptors are built based on edge consistency features.
The rest of the paper is organized as follows: Section 2 introduces the proposed method in detail. Section 3 evaluates the proposed method by comparing experimental results with other representative methods. Section 4 discusses several important aspects related to the proposed method. Finally, the paper is concluded in Section 5.

2. Materials and Methods

In this section, we first give a brief introduction of RIFT. Firstly, the PC is calculated for each orientation of the Log-Gabor convolution, and the features on the maximum moment map are extracted by the FAST detector [20]. Then the amplitudes of the convolution results at each scale in the same orientation are summed to obtain the MIM. A convolution sequence ring structure is applied to generate multiple MIMs for each feature in the reference image. Based on the MIM, the descriptors are constructed with feature coding technology like the SIFT algorithm [3]. Finally, the nearest neighbor matching strategy is used on descriptors to obtain the initial correspondence, and the outliers are removed by fast sample consensus (FSC) algorithm [21].
The EC-RIFT algorithm process can be divided into five steps: image preprocessing, feature point detection, descriptor construction, feature matching, and outlier removal. The main process of the proposed framework is shown in Figure 2. The blue boxes indicate the focus of the research in this paper. The following subsections provide a detailed description. Moreover, the important symbols in the paper are explained in Table 1.

2.1. Multi-Source Image Preprocessing

The interference of noises and textures on infrared or LiDAR images is not as obvious as that on SAR images in terms of feature extraction. The regular denoise filters, such as median filters, are efficient for infrared images. The design of filters for SAR and optical images is emphasized in this section.

2.1.1. Non-Local Mean Filtering

SAR images are always corrupted by speckle noise, leading to the challenge of subsequent tasks such as feature detection, so it is necessary to suppress the speckle noise first. The non-local mean filtering algorithm (NLM) defines similar pixels as the same neighborhood pattern and uses the information within a fixed-size window around the pixel to represent it. The loss of image structure information during the noise reduction process can be avoided, and it thus performs well in maintaining image edge and structure information [22]. The NLM filtering is calculated as (1):
F O N L M x = w x , y F I N L M y
where F O N L M and F I N L M represent the output and input images of NLM filters, respectively, x and y represent the indices of pixels, and the weight w ( x , y ) represents the similarity between pixels x and y, which is determined by the distance | | V ( x ) V ( y ) | | between rectangular regions V(x), V(y), as shown in (2)–(4).
w x , y = 1 Z x e x p ( V x V y 2 h 2 )
V x V y 2 = 1 d 2 Σ z S d F I N L M x + z F I N L M y + z 2
Z x = Σ y e x p ( V x V y 2 h 2 )
where Z ( x ) is the normalization parameter, h is the smoothing parameter, S d denotes the search window region that regulates the degree of Gaussian function’s decay, d represents the window side, and z is the point within S d .

2.1.2. Co-Occurrence Filtering

To take full advantage of the edge information of image, the edges need to be enhanced while weakening the texture. The co-occurrence filter (CoF) is an edge-preserving filter in which pixel values that appear more frequently in the image are weighted higher in the co-occurrence matrix, so the image texture can be smooth without considering the grayscale difference [23]. Pixel values that rarely appear at the same time are weighted lower in the co-occurrence matrix, which can better maintain the boundaries. The CoF is defined according to (5):
F O C o F ( p ) = q N p G σ s p , q · M F I C o F ( p ) , F I C o F ( q ) · F I C o F ( q ) q N p G σ s p , q · M F I C o F ( p ) , F I C o F ( q )
where F O C o F and F I C o F represent the output and input images of CoF filters, respectively, p and q are pixel indices, G denotes the Gaussian filter, σ s is the standard deviation of G, and M is calculated from the co-occurrence matrix as (6)
M F I C o F ( p ) , F I C o F ( q ) = C F I C o F ( p ) , F I C o F ( q ) h F I C o F ( p ) h F I C o F ( q )
where h denotes the histogram of pixels, indicating the occurrence frequency of p and q. The co-occurrence matrix C is computed as (7).
C F I C o F ( p ) , F I C o F ( q ) = p , q e x p d p , q 2 2 σ 2
In Equation (7), d denotes the Euclidean distance, σ 2 is a fixed value, σ 2 = 2 5 + 1 .
The comparison of images with/without preprocessing is shown in Figure 3. There are significant geometric and radiometric differences between the original images, making it more difficult to be matched with high precision. It is clear that the speckle noises in SAR image Figure 3a are filtered in Figure 3b, and the textures in optical image Figure 3c are suppressed in Figure 3d with complete edge maintained. The edge information left in the two images has a stronger consistency.

2.2. Edge Feature Detection

Edge information can largely reflect the structural features of objects and is more stable in heterogeneous images, so feature detection based on complete edges can provide a more reliable foundation for registration. The phase congruency model can overcome the effects of contrast and brightness changes and extract more complete feature edges than gradients. The Log-Gabor filter is able to maintain zero direct current components in an even symmetric filter, and the bandwidth is arbitrary. Therefore, the Log-Gabor filter is efficient to calculate the phase congruency. However, the feature extraction based on it is time-consuming because of the high dimensions. The number of scales and orientations are set to four and six, respectively. Therefore, in this paper, a 2D orthogonal Log-Gabor filter (OLG) is used instead of the global filter to achieve feature dimension reduction [24].
The geometric structure of images can be well preserved by phase congruency. Oppenheim first identified the ability of phase to extract significant information from images [25], and later Morrone and Owens proposed a model of phase congruency [26]. Since the degree of phase congruency is independent of the overall amplitude of signal, it has better robustness and gives more detailed edge information than the gradient operator when employed for edge detection. Kovesi simplified the calculation of phase congruency with Fourier phase components and extended the model to 2D [14]. Kovesi employed Log-Gabor filters in the computation, which were demonstrated to be more natural for human eyesight.
The intensity value of phase congruency is calculated as Equation (8):
P C x , y = s o ω o x , y A s o x , y Δ Φ s o x , y T s o A s o x , y + ξ
where s and o respectively denote the filter scale and orientation, ω o denotes the weight, and ξ is a minimal constant preventing the denominator from being 0. A s o and ϕ s o denote the amplitude and phase of the PC, respectively, and can be derived from Equations (9) and (10):
A s o x , y = E s o x , y 2 + O s o x , y 2
ϕ s o x , y = a r c t a n O s o x , y / E s o x , y
E s o and O s o represent the results of even-symmetric filtering and odd-symmetric filtering convolved with image I, respectively. The calculation formula is shown in (11):
E s o x , y , O s o x , y = I x , y L e v e n x , y , s , o , I x , y L o d d x , y , s , o
L is a 2D Log-Gabor filtering function, defined as (12):
L ρ , θ , s , o = e x p ρ ρ s 2 2 σ ρ 2 e x p θ θ s o 2 2 σ θ 2
where σ represents the bandwidth, and ρ s and θ s o are the center frequencies of Log-Gabor filtering.
The edges extracted based on phase congruency are often used for edge detection because of their ability to be unaffected by local light variations in the image, and they can contain various information, especially information at low edge contrast.
A 2D OLG is formed with two Log-Gabor filters with mutually orthogonal directions, which can be expressed by (13). The OLG proposed reduces the amount of computation while avoiding the redundancy of features, and thus can improve the running speed under the premise of ensuring the integrity of features.
O L ρ , θ , s , o = | L ρ , θ , s , o L ρ , θ ± π 2 , s , o |
To validate the the effect of the OLG algorithm on removing redundant features, the FAST algorithm is applied based on the phase congruency representations processed in the two strategies, respectively, and the results are shown in Figure 4. Subfigures (a)–(d) denote features detected based on LG algorithm, and (e)–(h) are based on the OLG algorithm. To illustrate the effectiveness of the proposed algorithm, image pairs SAR1/OPT1 and SAR2/OPT2 of different landforms are selected for comparison. It can be observed that the OLG algorithm performs better in depicting the image edges, and some of the isolated points were removed compared with the results of LG. The feature points obtained by the orthogonal method tend to be more recognizable, which makes it more likely to obtain the correct match in the subsequent processing.

2.3. Sector Descriptor Construction

Referring to the RIFT algorithm, the descriptors construction of EC-RIFT is performed on the MIM. It accumulates the amplitudes A s o x , y in the same direction at N s scales first to obtain A o ( x , y ) , and then the MIM is constituted with the direction index value ω , which represents the maximum values of these pixels.
To enhance the robustness and uniqueness of the descriptors, the GLOH-like approach is chosen to construct the descriptors in this paper [27]. For the obtained features based on edge consistency, the statistical histogram in log-polar coordinates enables the descriptors to be more sensitive to near points than distant points. As shown in Figure 5, the pixels in the neighborhood of keypoints are divided into log-polar coordinate concentric circles with the radius set to 0.25 r and 0.75 r, supposing that the radius of neighborhood is r. If the area of the divided sector is too small, the features are not sufficient, while the larger section will increase the descriptor dimension and the burden of computation. The pixels are divided into eight equal parts in the angular, each equal part being π / 4 , so that 16 sectors and 1 circle are formed, for a total of 17 image sub-blocks. The points on the same ring are close to each other, so the feature points are equally discriminated. Each block computes a histogram of six directions, resulting in a descriptor vector of 17 × 6 = 102 dimensions. To simplify the calculation, if some descriptor component exceeds the threshold value, the component is set to the threshold size, and the threshold value is empirically set as 0.2 in this paper. Finally, the descriptor vector is normalized.

2.4. Feature Matching and Outlier Removal

An effective algorithm to match feature points is the Nearest Neighbor Distance Ratio (NNDR) method, which is proposed by Lowe. It screens out local features by comparing the distances of nearest neighbor and second nearest neighbor features, and filters out features with low discrimination. A feature point is more likely to be correctly matched if the point most similar to its descriptor is close, and the point less similar to it is farther away.
After the feature matching, there are still some mismatched point pairs, so the EC-RIFT algorithm chooses the FSC algorithm to remove the outliers and estimate the parameters of the affine transformation model.

3. Experiments and Results

In this section, we first introduce the datasets and evaluation metrics. Subsequently, we investigate the effectiveness of the proposed method in stages. Finally, aiming at proving the superiority of the EC-RIFT, the results are presented and evaluated by comparing them with four representative multi-source image registration methods.

3.1. Datasets

Two types of datasets are used to evaluate the registration performance of the EC-RIFT algorithm in this paper. The first is formed from seven pairs of SAR images and optical images with various sizes and sources. The image pairs in other modalities are also employed to assess the generalization ability of proposed algorithm. Both datasets are described in detail.
The SAR and optical images are obtained from different sensors, such as Terra SAR-X, Gaofen satellites, Google Earth, and Landsat satellites and aerial vehicles, covering various resolutions and sizes. The multi-source image dataset consists of infrared–optical, day–night, depth–optical pairs, widely employed in remote sensing image registration. All image pairs capture various terrains, including urban areas, fluvial deposits, rivers, and farmland, and the images exhibit significant geometric and radiometric differences, posing challenges for registration. The data are shown in Figure 6.

3.2. Evaluation Criterion

For quantitative evaluation, the repeatability [28], root mean square error (RMSE), and running time are selected to evaluate the performance of the proposed method.
Repeatability [28] is often used as a metric to evaluate the quality of detected features, which is defined to represent the rate of potential corresponding points in all detected points. The repeatability can be calculated as Equation (14):
R e p e a t a b i l i t y = N c N 1 + N 2 / 2
where N c represents the number of potential corresponding points, and N 1 and N 2 represent the total number of feature points detected in the reference image and moving image, respectively. If a feature point meets the conditions shown in Formula (15), it is considered as a potential corresponding point. Here, i represents the index of keypoint, ( x 1 i , y 1 i ) is the keypoint coordinates of the reference image, and ( x 2 i , y 2 i ) is the keypoint coordinates obtained after affine transformation of the moving image.
x 2 i x 1 i 2 + y 2 i y 1 i 2 < 2
The root mean square error (RMSE) is used to evaluate the precision of the registration results. RMSE is defined as (16):
R M S E = i = 1 n ( x 2 i x 1 i ) 2 + ( y 2 i y 1 i ) 2 n
where i is the pixel index, n is the number of matching pairs, ( x 1 i , y 1 i ) is the keypoint coordinates of the reference image, and ( x 2 i , y 2 i ) is the keypoint coordinates obtained after affine transformation of the image to be registered. The smaller the value of RMSE, the higher the precision of registration.

3.3. Registration Results and Analysis

To demonstrate the effect of each processing section on the registration results, experiments are designed to evaluate the registration results. The comparison experiments are conducted with HAPCG [17], OS-SIFT [7], LNIFT [29], and RIFT [16] algorithms to prove that the proposed method has better performance in registration. The experiments are implemented using MATLAB 2021b on a platform with Advanced Micro Devices, Inc. (AMD)-Ryzen-5-3400G with Radeon Vega Graphics 3.70-GHz CPU, and 16-GB RAM.

3.3.1. Comparison Experiment of Preprocessing Algorithms

The preprocessing step can help in realizing the registration of multi-source images with large radiometric differences. To demonstrate the effectiveness of the algorithm applied in this paper, Pair 6 is chosen for the experiment, whose similarity to the original data is too low to be registered by all algorithms. Figure 7 depicts the registration results obtained with/without the denoising and enhancement process. Subfigure (a) represents the matching result of original data, which is obviously unable to be registered. The SAR and optical images in (b) and (c) are preprocessed, respectively. Even if one of the images is processed, the image pairs failed to register. For the denoised SAR image and enhanced optical image, the corresponding points are matched correctly, as shown in (d). It is clear that the noise in the original SAR image and the texture in the optical image have a strong impact on registration, and more correct matching pairs are obtained after preprocessing.
In addition, comparison experiments are conducted on images preprocessed with aforementioned steps. As listed in Table 2, our method performs the best among the four methods in terms of RMSE and running time.
It should be noted that this step is optional for remote sensing image registration. There is serious radiation and geometric distortion in the data for this experiment, which brings greater challenges to registration, and the proposed steps contribute to extracting the corresponding features.

3.3.2. Comparison Experiment of OLG and LG

Since the OLG algorithm can reduce redundancy in feature detection, the repeatability is chosen to evaluate its effectiveness. A higher repeatability indicates a higher probability of extracting the corresponding features. The results are shown in Figure 8.
The OLG algorithm achieves scores higher than or equal to LG on all images, demonstrating the contribution to improving the registration accuracy.
In addition, the feature detection time and registration precision of OLG are tested in this experiment, and the results are listed in Table 3. The bold numbers in the table denote the best results. As can be seen from Table 3, for all image pairs, OLG can reduce the feature detection time by nearly half, and the accuracy is improved on all data.

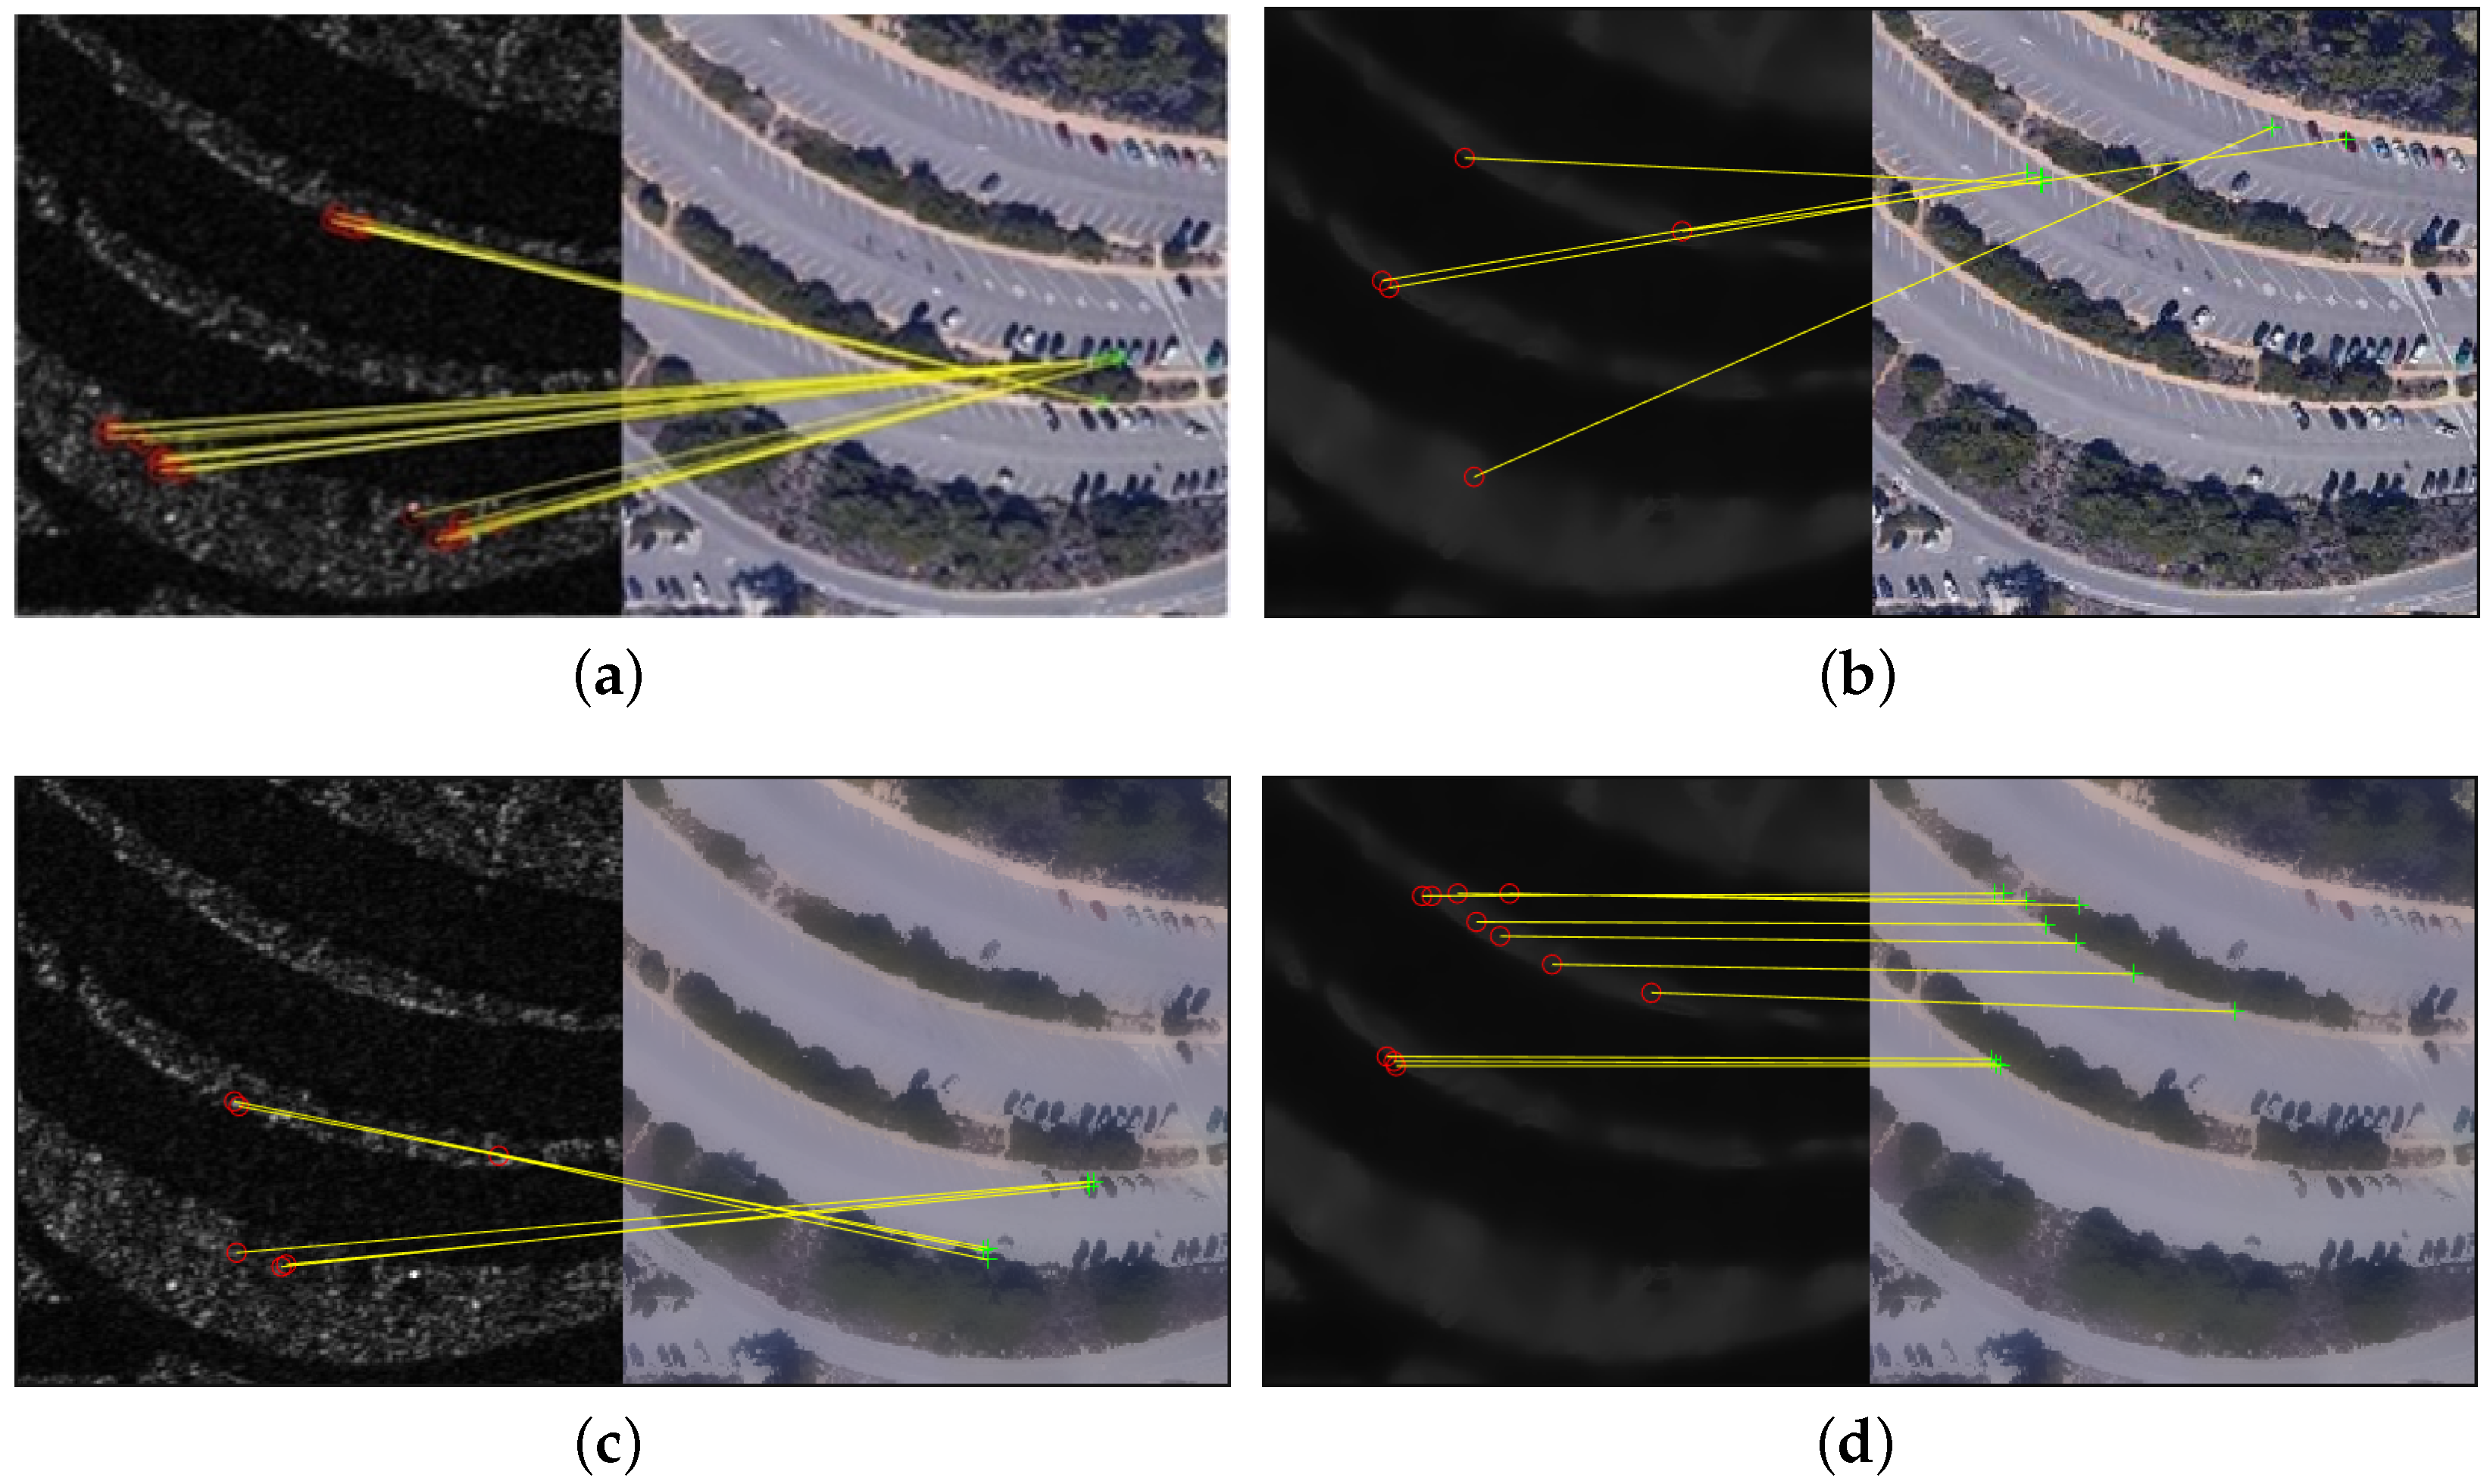
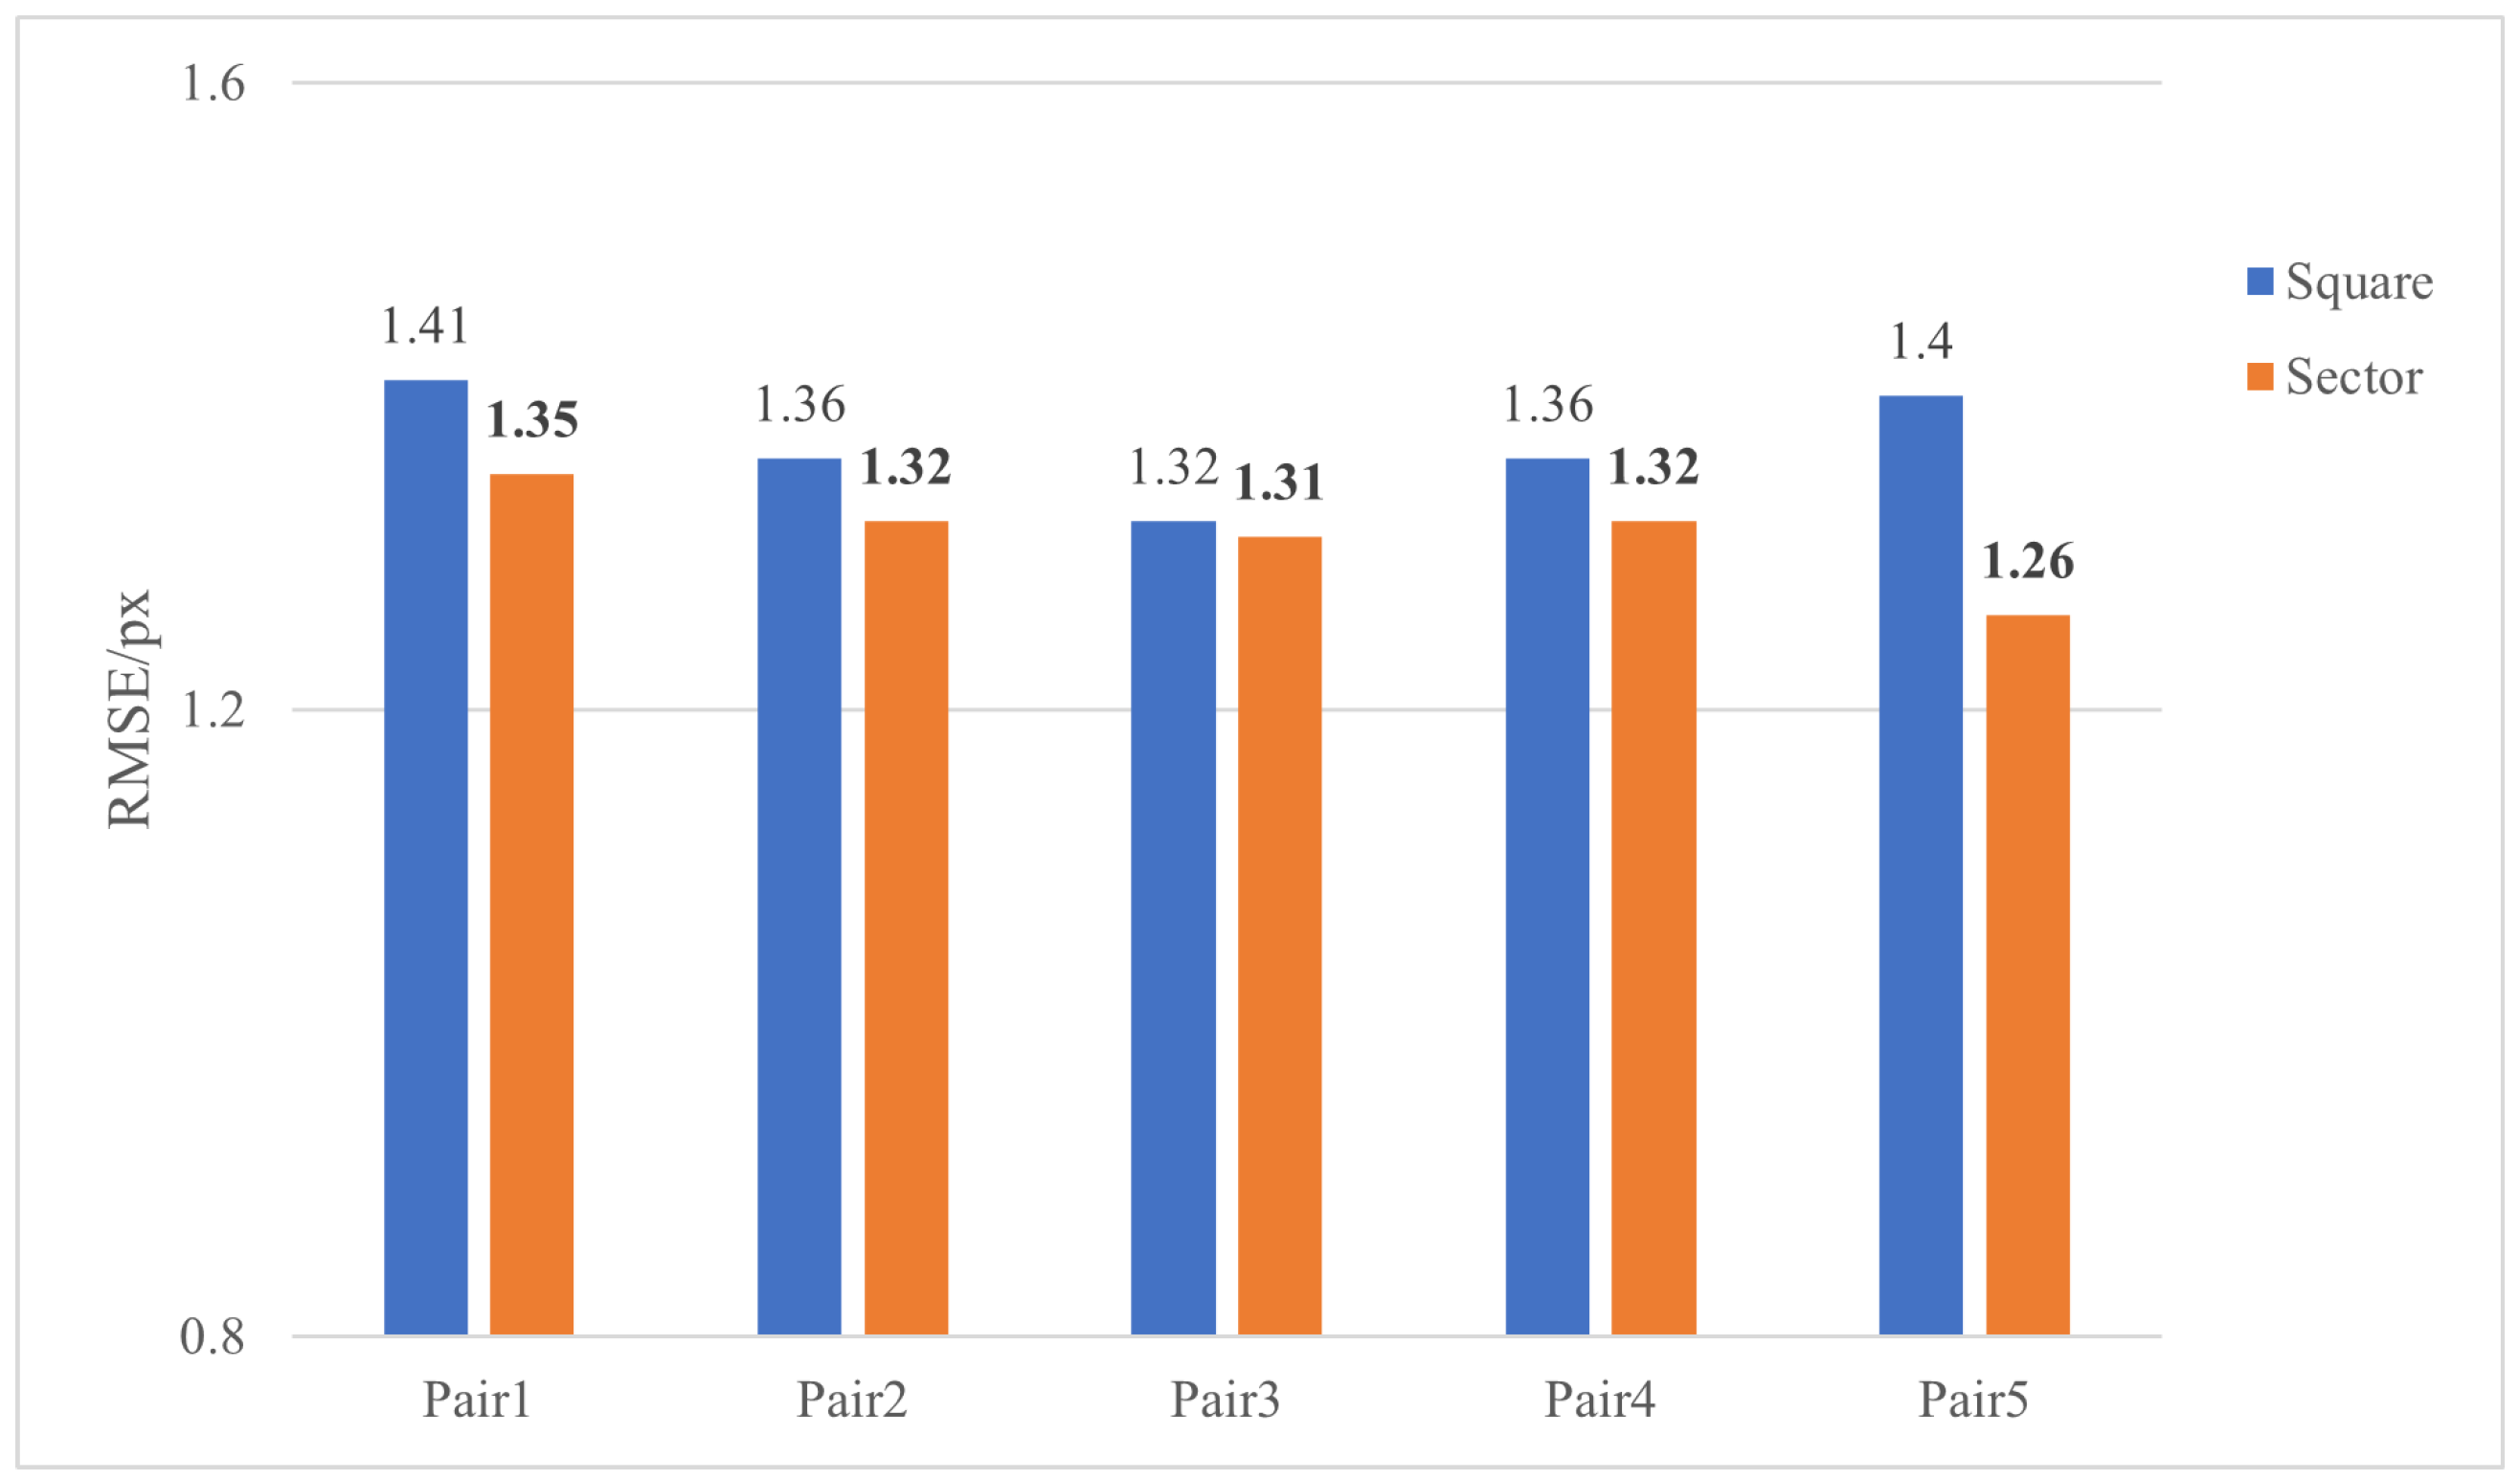
3.3.3. Comparison Experiment of Square Descriptor and Sector Descriptor

The purpose of this experiment is to compare the performance of square descriptors and the sector descriptors used in this paper. The similarity between the descriptor vectors on paired features determines the success rate of matching. In order to illustrate that the proposed descriptors are better capable of extracting the common information, we chose two metrics to measure the similarity of the paired descriptors. Cosine similarity and Pearson correlation coefficient are commonly used methods to measure the similarity between two vectors, both in the range of [−1, 1]. A value of 1 means that the vectors are completely similar, and −1 indicates the opposite.
Five pairs of points are selected randomly from Pair 1 for this experiment, then the descriptors are built in square and sector methods, respectively. The similarity of vectors are shown in the Figure 9. The bars in light color represent cosine similarity, and those in dark color represent Pearson correlation coefficient of two methods. The sector descriptor (the orange bars) outperforms the square descriptor (the blue bars) on all points selected. It thus proves that descriptors based on sector neighborhood fit the corresponding points matching better.
Furthermore, the comparison experiment of registration results is shown in Figure 10. For the reliability of the experiment, all parts of the method are kept consistent except for the descriptor construction step. This result demonstrates that our descriptors have a higher robustness and are thus conducive to multi-source image registration.

3.3.4. Comparative Results on SAR-Optical Data

To analyze the performance of the proposed method, we firstly conduct experiments on SAR and optical dataset, which is most commonly used in practice. For the fairness of the experiment, all methods use the same matching method and parameters are set under the recommendations of their authors.
Figure 11 represents the matching results of the EC-RIFT algorithm. It is clear that the sufficient features are matched correctly, confirming the effectiveness of the proposed method for SAR and optical image registration. Table 4 shows the quantitative results of the five methods. The EC-RIFT method is capable of steadily registering image pairs with lower error and time.
The performance of OS-SIFT is the most vulnerable. For Pairs 2–5, there are not enough correct matching pairs obtained by OS-SIFT, which we find unconvincing. The poor performance of the OS-SIFT algorithm is due to the lack of edge retention capacity, which reduces the accuracy of feature detecting and matching, and thus fails on the data with significant radiation variations. In terms of RMSE, the proposed method outperforms other methods in all image pairs. For Pair 1, the proposed EC-RIFT obtains the same value of RMSE as LNIFT in Pair 1, but it consumes less time. For Pair 2, the results obtained by our method are 38.97% and 11.19% better than those obtained by HAPCG and RIFT, respectively, achieving significant accuracy improvement. The LNIFT method fails on Pair 2 and Pair 4, and the RMSE of other pairs are slightly higher than the method proposed. The running times of the HAPCG method for Pair 4 and Pair 5 are lower than our method, but as shown in Figure 12, the average time for all image pairs of our method is 7.31 s, which is still the shortest among these methods. It should be noted that the OS-SIFT is annotated as N A N because it obtains valid results only on Pair 1 and takes longer than our algorithm on it. Taken together, the proposed method outperforms these popular methods in terms of robustness.

3.4. Comparative Results on Multi-Source Data

The experimental results on SAR–optical images demonstrate the effectiveness and superiority of our method. As an extension, we focus on the registration performance of other multi-source images in this subsection. It should be noted that the noise of multi-source data used in this experiment is weak, so there is no additional processing performed in the pre-processing step. The visual results are shown in Figure 13. The EC-RIFT method successfully matched a large number of points on these image pairs.
Table 5 lists the comparative registration results on multi-source images. The LNIFT and OS-SIFT fail on day–night data, and our method obtains robust registration results. The RMSE of the proposed method is the same as that of OS-SIFT and LNIFT on infrared–optical data, but the running time is shorter. For the day–night and depth–optical data, the EC-RIFT method achieves the highest accuracy.

4. Discussion

Taking both the quantitative and the qualitative results into account, the experimental results in Section 3 illustrate that the proposed method achieves better registration performance for multi-source images. In this section, we first validate the idea that smoothing textures and noises can enhance the edge features, which are more stable between multi-source images. Additionally, the rotation and scale invariances of the method are analyzed, leading to the limitations and future work expectations.

4.1. The Effect of Noises on MIM

Since image descriptors are built based on the histogram statistics of MIM, the distribution in the neighborhood of feature points on MIM determines the probability of corresponding points being matched. Therefore, we compare the MIMs of original images and processed images to research the effect of this step.
As shown in Figure 14, the influence of speckle noises are significant in the SAR image, and the irregular interference directly disturbs the robustness of descriptors. The textures which are not present in the SAR image also exacerbate the difference between MIMs. The MIMs of processed image pairs are much more similar, leading to higher registration accuracy.
Note that the preprocessing methods in this paper are selected according to the characteristics of the images. For images of other modalities, the idea of eliminating noise and texture differences between image pairs still holds, but the specific algorithms need to be redesigned.

4.2. Fine-Registration and Considerable Difference

The imaging spatial resolution difference between satellite and drone is great, and the imaging level is uneven between different satellites. The scale is different depending on the height, the rotation is different depending on the orbit, and the distortion is different depending on the modality. Therefore, the multi-sensor data for situational awareness needs to be fine-registered first in the space–air–ground integrated network [30].
Our research is based on the assumption that remote sensing images have been registered with geographic information, which means that there are mainly translation differences between the input image pairs. Actually, there is only a tiny scale difference on the coarse-registered images calibrated by the location or attitude information, and the rotation angle is subtle, in which case our method works well. The feature matching results of image pairs with scale and rotation differences are shown in Figure 15. The resolution of the SAR image in (a) is reduced from 500 px × 492 px to 400 px × 394 px, while the resolution of the optical image remains the original. The SAR images of two sizes are manually rotated clockwise by 5 degrees in (b) and (c), respectively. For indistinctive differences in scale and rotation, whether one or both exist in the image pairs, the proposed method can obtain enough matching pairs.
However, our method is sensitive to significant scale differences and rotation transformations, so it may fail in these scenes. In terms of rotation-invariance, the solution has been proposed in [31], but it is computationally heavy and time-consuming. In terms of scale-invariance, methods based on the image pyramid [32] may help to improve the registration performance. In future work, we will focus on proposing a more efficient approach to improve the feature invariance of significant scale and rotation.

5. Conclusions

Aiming at handling the challenge of extracting consistent features from multi-source images with severe geometric and radiometric distortions, this paper proposes a robust registration method based on the edge consistency features. We first design the denoising and enhancing algorithms according to the characteristics of remote sensing images to reduce the interference of redundant information on registration. Then the orthogonal method is adopted for feature extraction to improve computational efficiency. Finally, the sector-neighborhood descriptor is constructed to obtain a more robust representation. Compared with other representative registration methods, the proposed method obtains higher speed and accuracy, which can effectively realize the registration task of SAR and optical images. Due to the potential of real-time performance, the improved algorithm is expected to be applied in edge intelligence analysis [33] and on-orbit satellite platforms [34]. Furthermore, the proposed method is proven to have a superior generalization ability to be applied to images in other modalities. However, the proposed method may not work properly in the case of large rotation and scale deviation in the images, and we will explore the technology of geometric deformation invariance in the future work.

Author Contributions

Conceptualization, Y.Z.; methodology, Y.Z. and Z.H.; validation, Y.Z.; investigation, Z.D. and C.H.; writing—original draft preparation, Z.H. and N.L.; writing—review and editing, N.L. and C.C.; supervision and suggestions, L.C., Z.D., and C.C. All authors have read and agreed to the published version of the manuscript.

Funding

This work was supported by the National Key Research and Development Program of China(2020YFB1807500), the National Natural Science Foundation of China (62072360, 62001357, 62172438,61901367), the key research and development plan of Shaanxi province (2021ZDLGY02-09, 2023-GHZD-44, 2023-ZDLGY-54), the Natural Science Foundation of Guangdong Province of China (2022A1515010988), Key Project on Artificial Intelligence of Xi’an Science and Technology Plan (23ZDCYJSGG0021-2022, 23ZDCYYYCJ0008, 23ZDCYJSGG0002-2023), Xi’an Science and Technology Plan (20RGZN0005) and the Proof-of-concept fund from Hangzhou Research Institute of Xidian University (GNYZ2023QC0201).

Data Availability Statement

Not applicable.

Conflicts of Interest

The authors declare no conflict of interest.

Abbreviations

The following abbreviations are used in this manuscript:
SARSynthetic Aperture Radar
EC-RIFTEdge Consistency Radiation-variation Insensitive Feature Transform
NLMNon-local Mean
CoFCo-occurrence Filter
OLGOrthogonal Log-Gabor
RMSERoot Mean Square Error

References

  1. Chen, C.; Wang, C.; Liu, B.; He, C.; Cong, L.; Wan, S. Edge Intelligence Empowered Vehicle Detection and Image Segmentation for Autonomous Vehicles. IEEE Trans. Intell. Transp. Syst. 2023, 1–12. [Google Scholar] [CrossRef]
  2. Lv, N.; Zhang, Z.; Li, C. A hybrid-attention semantic segmentation network for remote sensing interpretation in land-use surveillance. Int. J. Mach. Learn. Cybern. 2023, 14, 395–406. [Google Scholar] [CrossRef]
  3. Lowe, D.G. Distinctive Image Features from Scale-Invariant Keypoints. Int. J. Comput. Vis. 2004, 60, 91–110. [Google Scholar] [CrossRef]
  4. Chen, H.M.; Varshney, P.K.; Arora, M.K. Performance of Mutual Information Similarity Measure for Registration of Multitemporal Remote Sensing Images. IEEE Trans. Geosci. Remote Sens. 2003, 41, 2445–2454. [Google Scholar] [CrossRef]
  5. Ye, Y.; Bruzzone, L.; Shan, J.; Bovolo, F.; Zhu, Q. Fast and Robust Matching for Multimodal Remote Sensing Image Registration. IEEE Trans. Geosci. Remote Sens. 2019, 57, 9059–9070. [Google Scholar] [CrossRef]
  6. Ma, W.; Wen, Z.; Wu, Y.; Jiao, L.; Gong, M.; Zheng, Y.; Liu, L. Remote Sensing Image Registration with Modified SIFT and Enhanced Feature Matching. IEEE Geosci. Remote Sens. Lett. 2016, 14, 3–7. [Google Scholar] [CrossRef]
  7. Xiang, Y.; Wang, F.; You, H. OS-SIFT: A Robust SIFT-Like Algorithm for High-Resolution Optical-to-SAR Image Registration in Suburban Areas. IEEE Trans. Geosci. Remote Sens. 2018, 56, 3078–3090. [Google Scholar] [CrossRef]
  8. Gao, C.; Li, W.; Tao, R.; Du, Q. MS-HLMO: Multiscale Histogram of Local Main Orientation for Remote Sensing Image Registration. IEEE Trans. Geosci. Remote Sens. 2022, 60, 1–14. [Google Scholar] [CrossRef]
  9. Ma, W.; Zhang, J.; Wu, Y.; Jiao, L.; Zhu, H.; Zhao, W. A Novel Two-Step Registration Method for Remote Sensing Images Based on Deep and Local Features. IEEE Trans. Geosci. Remote Sens. 2019, 57, 4834–4843. [Google Scholar] [CrossRef]
  10. Zhou, L.; Ye, Y.; Tang, T.; Nan, K.; Qin, Y. Robust Matching for SAR and Optical Images Using Multiscale Convolutional Gradient Features. IEEE Geosci. Remote Sens. Lett. 2022, 19, 1–5. [Google Scholar] [CrossRef]
  11. Zhuoqian, Y.; Tingting, D.; Yang, Y. Multi-temporal Remote Sensing Image Registration Using Deep Convolutional Features. IEEE Access 2018, 6, 38544–38555. [Google Scholar]
  12. Zhang, H.; Ni, W.; Yan, W.; Xiang, D.; Bian, H. Registration of Multimodal Remote Sensing Image Based on Deep Fully Convolutional Neural Network. IEEE J. Sel. Top. Appl. Earth Obs. Remote Sens. 2019, 12, 3028–3042. [Google Scholar] [CrossRef]
  13. Hughes, L.; Marcos, D.; Lobry, S.; Tuia, D.; Schmitt, M. A deep learning framework for matching of SAR and optical imagery. ISPRS J. Photogramm. Remote Sens. 2020, 169, 166–179. [Google Scholar] [CrossRef]
  14. Kovesi, P. Phase congruency: A low-level image invariant. Psychol. Res. 2000, 64, 136–148. [Google Scholar] [CrossRef]
  15. Ye, Y.; Shan, J.; Bruzzone, L.; Shen, L. Robust Registration of Multimodal Remote Sensing Images Based on Structural Similarity. IEEE Trans. Geosci. Remote Sens. 2017, 55, 2941–2958. [Google Scholar] [CrossRef]
  16. Li, J.; Hu, Q.; Ai, M. RIFT: Multi-Modal Image Matching Based on Radiation-Variation Insensitive Feature Transform. IEEE Trans. Image Process. 2020, 29, 3296–3310. [Google Scholar] [CrossRef]
  17. Yao, Y.; Zhang, Y.; Wan, Y.; Liu, X.; Guo, H. Heterologous Images Matching Considering Anisotropic Weighted Moment and Absolute Phase Orientation. Geomat. Inf. Sci. Wuhan Univ. 2021, 46, 1727. [Google Scholar]
  18. Fan, Z.; Liu, Y.; Liu, Y.; Zhang, L.; Zhang, J.; Sun, Y.; Ai, H. 3MRS: An Effective Coarse-to-Fine Matching Method for Multimodal Remote Sensing Imagery. Remote Sens. 2022, 14, 478. [Google Scholar] [CrossRef]
  19. Sui, H.; Liu, C.; Gan, Z. Overview of multi-modal remote sensing image matching methods. J. Geod. Geoinf. Sci. 2022, 51, 1848. [Google Scholar]
  20. Rosten, E.; Drummond, T. Machine learning for high-speed corner detection. In Proceedings of the ECCV 2006: 9th European Conference on Computer Vision, Graz, Austria, 7–13 May 2006; pp. 430–443. [Google Scholar]
  21. Wu, Y.; Ma, W.; Gong, M.; Su, L.; Jiao, L. A Novel Point-Matching Algorithm Based on Fast Sample Consensus for Image Registration. IEEE Geosci. Remote Sens. Lett. 2015, 12, 43–47. [Google Scholar] [CrossRef]
  22. Buades, A.; Coll, B.; Morel, J. A non-local algorithm for image denoising. In Proceedings of the 2005 IEEE Computer Society Conference on Computer Vision and Pattern Recognition (CVPR’05), San Diego, CA, USA, 20–25 June 2005; Volume 2, pp. 60–65. [Google Scholar]
  23. Jevnisek, R.J.; Avidan, S. Co-occurrence Filter. In Proceedings of the 2017 IEEE Conference on Computer Vision and Pattern Recognition (CVPR), Honolulu, HI, USA, 21–26 July 2017; pp. 3816–3824. [Google Scholar]
  24. Yang, H.; Fu, Y.; Zeng, J. Face recognition algorithm based on orthogonal Log-Gabor filter binary mode. J. Intell. Syst. 2019, 14, 330–337. [Google Scholar]
  25. Oppenheim, A.; Lim, J. The importance of phases in signal. IEEE Trans. Comput. Sci. 1981, 69, 333–382. [Google Scholar] [CrossRef]
  26. Morrone, M.C.; Owens, R.A. Feature detection from local energy. Pattern Recognit. Lett. 1987, 6, 303–313. [Google Scholar] [CrossRef]
  27. Mikolajczyk, K.; Schmid, C. A performance evaluation of local descriptors. IEEE Trans. Pattern Anal. Mach. Intell. 2005, 27, 1615–1630. [Google Scholar] [CrossRef] [PubMed]
  28. Mikolajczyk, K.; Schmid, C. An Affine Invariant Interest Point Detector. In Proceedings of the ECCV 2002, 7th European Conference on Computer Vision, Copenhagen, Denmark, 28–31 May 2002; Volume LNCS 2350. [Google Scholar]
  29. Li, J.; Xu, W.; Shi, P.; Zhang, Y.; Hu, Q. LNIFT: Locally Normalized Image for Rotation Invariant Multimodal Feature Matching. IEEE Trans. Geosci. Remote Sens. 2022, 60, 1–14. [Google Scholar] [CrossRef]
  30. Zhang, Y.; Chen, C.; Liu, L.; Lan, D.; Jiang, H.; Wan, S. Aerial Edge Computing on Orbit: A Task Offloading and Allocation Scheme. IEEE Trans. Netw. Sci. Eng. 2023, 10, 275–285. [Google Scholar] [CrossRef]
  31. Han, C. RI-LPOH: Rotation-Invariant Local Phase Orientation Histogram for Multi-Modal Image Matching. Remote Sens. 2022, 14, 4228. [Google Scholar]
  32. Gao, C.; Li, W. Multi-scale PIIFD for Registration of Multi-source Remote Sensing Images. J. Beijing Inst. Technol. 2021, 30, 12. [Google Scholar]
  33. Chen, C.; Yao, G.; Liu, L.; Pei, Q.; Song, H.; Dustdar, S. A Cooperative Vehicle-Infrastructure System for Road Hazards Detection with Edge Intelligence. IEEE Trans. Intell. Transp. Syst. 2023, 24, 5186–5198. [Google Scholar] [CrossRef]
  34. Hnatushenko, V.; Kogut, P.; Uvarov, M. Variational approach for rigid co-registration of optical/SAR satellite images in agricultural areas. J. Comput. Appl. Math. 2022, 400, 113742. [Google Scholar] [CrossRef]
Figure 1. Texture and edge differences between multi-source images. The red box represents textured terrain, and the green box contains significant edges.
Remotesensing 15 05051 g001
Figure 2. Implementation flow chart of EC-RIFT algorithm.
Remotesensing 15 05051 g002
Figure 3. Results of preprocessing. (a) Original SAR image. (b) Denoised SAR image. (c) Original optical image. (d) Enhanced optical image.
Remotesensing 15 05051 g003
Figure 4. Features detected with LG/OLG. (a) LG-SAR1. (b) LG-OPT1. (c) LG-SAR2. (d) LG-OPT2. (e) OLG-SAR1. (f) OLG-OPT1. (g) OLG-SAR2. (h) OLG-OPT2.
Remotesensing 15 05051 g004
Figure 5. The descriptors of EC-RIFT method.
Remotesensing 15 05051 g005
Figure 6. Dataset presentation. The (ag) denote sar-optical image pairs of different landforms. And the (hj) represent infrared-optical, day-night, depth-optical landforms, respectively.
Remotesensing 15 05051 g006
Figure 7. Registration results with/without preprocessing. (a) Without preprocessing. (b) SAR image is denoised. (c) Optical image is enhanced. (d) Both images are preprocessed.
Remotesensing 15 05051 g007
Figure 8. Repeatability of OLG and LG. The bold numbers represent the higher scores.
Remotesensing 15 05051 g008
Figure 9. The similarity of MIM.
Remotesensing 15 05051 g009
Figure 10. Comparison of OLG and LG. The bold numbers represent the best results.
Remotesensing 15 05051 g010
Figure 11. Matching results for SAR–optical images. (a) Pair 1. (b) Pair 2. (c) Pair 3. (d) Pair 4. (e) Pair 5.
Remotesensing 15 05051 g011
Figure 12. Average running time of registration methods.
Remotesensing 15 05051 g012
Figure 13. Matching results for multi-source images. (a) Infrared–optical. (b) Day–night. (c) Depth–optical.
Remotesensing 15 05051 g013
Figure 14. MIMs of images. (a) MIM of original image pairs. (b) MIM of processed image pairs.
Remotesensing 15 05051 g014
Figure 15. Matching results with scale and rotation differences. (a) Scale difference. (b) Rotation difference. (c) Rotation difference.
Remotesensing 15 05051 g015
Table 1. Explanations of important symbols.
SymbolExplanationSymbolExplanation
FIinput of filterAamplitude
FOoutput of filter ϕ phase
wweightsscale
Nnumberoorientation
ρ polar radius σ bandwidth
θ polar angle
Table 2. Comparison of preprocessed data registration results.
DataMethodRMSE/pxRunning Time/s
Pair 6HAPCG0.882.8
OS-SIFT× 1×
LNIFT1.3915.45
RIFT0.992.26
EC-RIFT0.951.99
Pair 7HAPCG1.592.56
OS-SIFT××
LNIFT1.2212.61
RIFT1.111.79
EC-RIFT0.921.76
1 The × means that the algorithm fails.
Table 3. Registration results of OLG and LG.
DataFilterDetection Time/sRMSE/px
Pair 1LG0.991.41
OLG0.581.35
Pair 2LG3.201.36
OLG1.811.32
Pair 3LG1.501.32
OLG1.041.27
Pair 4LG0.991.34
OLG0.651.33
Pair 5LG0.231.40
OLG0.151.29
Table 4. Comparison with other methods. The bold numbers represent the best performance.
DataMethodRMSE/pxRunning Time/s
Pair 1HAPCG1.959.98
OS-SIFT1.389.15
LNIFT1.3554.64
RIFT1.3710.45
EC-RIFT1.358.81
Pair 2HAPCG1.9526.13
OS-SIFT× 1×
LNIFT××
RIFT1.3414.26
EC-RIFT1.1911.01
Pair 3HAPCG1.9313.64
OS-SIFTNAN 2NAN
LNIFT1.2962.64
RIFT1.326.41
EC-RIFT1.285.06
Pair 4HAPCG1.977.98
OS-SIFT××
LNIFT××
RIFT1.359.36
EC-RIFT1.249.27
Pair 5HAPCG1.762.12
OS-SIFTNANNAN
LNIFT1.3310.01
RIFT1.363.95
EC-RIFT1.312.39
1 The × means that the algorithm fails. 2 The NAN represents the number of correct matching is less than five.
Table 5. Quantitative results for multi-source images. The bold numbers denote the best results.
DataMethodRMSE/pxRunning Time/s
Infrared–opticalHAPCG1.6518.66
OS-SIFT1.1616.71
LNIFT1.2964.73
RIFT1.1614.70
EC-RIFT1.1613.13
Day–nightHAPCG1.839.79
OS-SIFT× 1×
LNIFT××
RIFT1.2712.37
EC-RIFT1.2610.68
Depth–opticalHAPCG1.958.90
OS-SIFT1.418.80
LNIFT1.3655.06
RIFT1.3611.98
EC-RIFT1.3311.50
1 The × means that the algorithm fails.
Disclaimer/Publisher’s Note: The statements, opinions and data contained in all publications are solely those of the individual author(s) and contributor(s) and not of MDPI and/or the editor(s). MDPI and/or the editor(s) disclaim responsibility for any injury to people or property resulting from any ideas, methods, instructions or products referred to in the content.

