Abstract
This study aims to investigate potential archaeological proxies at a large Bronze Age fortification in Hungary, namely the Csanádpalota–Juhász T. tanya site, using open-access satellite data. Available Sentinel-2 images acquired between April 2017 and September 2022 were used. More than 700 images (727) were initially processed and filtered, accounting at the end of more than 400 (412) available calibrated Level 2A Sentinel images over the case study area. Sentinel-2 images were processed through image analysis. Based on pan-sharpened data, the visibility of crop marks was improved and enhanced by implementing orthogonal equations. Several crop marks, some still unknown, were revealed in this study. In addition, multi-temporal phenological observations were recorded on three archaeological proxies (crop marks) within the case study area, while an additional area was selected for calibration purposes (agricultural field). Phenological observations were performed for at least four complete phenological cycles throughout the study period. Statistical comparisons between the selected archaeological proxies were applied using a range of vegetation indices. The overall results indicated that phenological observations could be used as archaeological proxies for detecting the formation of crop marks.
1. Introduction
Archaeological proxies have been widely used in the past for detecting areas with potential interest [1]. The discovery of subsurface archaeological remains through archaeological proxies is usually applied by detecting the so-called “crop marks” [2,3]. Crop marks occur when healthy vegetation, such as barley or cereal crops, is cultivated over shallow buried archaeological remains. Therefore, the crops are either stressed (negative crop marks phenomenon) or enhanced (positive crop marks phenomenon) [2,4], and this can be used—once detected by remote sensing sensors—as a first indication (proxy) of the existence of buried remains.
The identification of crop marks is usually carried out by analyzing high-resolution satellite and airborne imageries. At the same time, ground spectroradiometers have also been tested successfully [5,6]. While the use of sub-meter satellite sensors is widely adopted [7,8], limitations still exist regarding (a) the use of medium-resolution datasets (e.g.,10 m, 20 m pixel resolution) and (b) the analysis of multi-temporal phenological observations of crop marks [4,9,10]. In addition, the use of earth observation sensors in several areas around the globe is still fragmented [11].
The investigation of remote sensing techniques for studying prehistoric sites is becoming increasingly appealing to scholars since it can provide valuable information in less time than systematic archaeological excavations, which usually take a long time to be completed. Of course, remote sensing in archaeology cannot replace field archaeology, but it can assist archaeologists in better understanding the sites even before excavations. While advanced remote sensing archaeology has a long record in some parts of the world (see [11,12]), in Eastern Europe this started to be popular only recently. The launch of the Google Earth platform, released in the beginning of the 21st century (2001), was a true revolution in viewing archaeological sites, as it was throughout the world [13,14,15]. Before this, the perspective from above for archaeological sites was entirely determined by existing aerial images. The use of aerial photographs in eastern European archaeology is now considered a standard procedure [16,17,18,19,20,21,22,23,24,25,26,27,28,29,30,31,32,33,34,35].
Megaforts are the most recognizable prehistoric sites in Eastern European archaeology. Megaforts, as Antony Harding refers to them [36], are Bronze Age fortifications built at the confluence of two major rivers, Mureş and Tisa. Because of their size, these sites quickly became the subject of archaeological investigations, both non-invasive and invasive. In the study [37], one of the first remote sensing papers describing the impressive fortification from Cornești-Iarcuri in Romania, which is considered to be Europe’s largest Bronze Age fortification, was published. In 2008, a follow-up paper was published [38]. Because of its impressive size, the Cornești-Iarcuri fortification quickly gained international attention, and other remote sensing techniques were used [39,40,41,42,43]. Another mega fort, Sântana, was discovered in southwestern Romania, north of the Mureș River. Remote sensing, including light detection and ranging (LiDAR) and ground geophysics, as well as comprehensive archaeological excavations, were also used to investigate the Sântana–Cetatea Veche site [44,45]. A more recent paper was published on the use of more advanced satellite image remote sensing techniques to study the sites of Cornești–Iarcuri and Sântana–Cetatea Veche [46].
The mega-fort of Gradište Iđoš in northern Serbia was also studied using remote sensing tools in 2020 [47]. In Hungary, two large fortifications stand up: Orosháza-Nagytatársánc and Csanádpalota–Juhász T. tanya. The latest is discussed in this paper. Only a little research has been done on Orosháza-Nagytatársánc [48,49], while Csanádpalota–Juhász T. tanya was investigated more thoroughly [50,51,52,53]. Many other large bronze-age fortifications were discovered within the region by photo interpretation of Google Earth images or other satellite images followed by verifications in the field [54,55].
The European space program, namely the Copernicus program, providing free and open access satellite optical datasets, like those of Sentinel 2A and 2B sensors, opened a new era in the scientific domain of remote sensing archaeology [4,9,56,57]. Images can be downloaded, through big data cloud hubs, in a very short period after the acquisition time, in a calibrated and corrected form, minimizing radiometric, atmospheric, and geometric distortions. Nevertheless, skepticism still exists in their use due to the medium resolution of the image provided (10- and 20-m resolution).
The scope of this study is twofold: from one hand, to utilize novel approaches for detecting archaeological proxies in an area limitedly studied in the past, in Csanádpalota-Juhász T. tanya in Hungary, increasing the archaeological visibility and understanding of the area, blended with existing knowledge. On the other hand, the study aims to present the importance of phenological observations—a topic limited discussed in the literature—for detecting archaeological proxies [58,59]. Satellite observations and phenological observations through the analysis of hundreds of Sentinels 2 images over the area of the Csanádpalota-Juhász T. tanya site are reported here.
2. Case Study
The Bronze Age fortification of Csanádpalota-Juhász T. tanya [60] located in the Great Hungarian Plain, south of Csanádpalota (Csongrád county), near the Romanian–Hungarian border, was selected as a case study (Figure 1). The mega fort of Csanádpalota-Juhász T. tanya, along with other sites of its kind like Cornești–Iarcuri, Sântana–Cetatea Veche, and Gradište Iđoš, is one of the most significant Bronze Age sites, not only because of its size but also because it is the expression of social paradigm change and represents the transition to another socio-cultural environment, where the power is shown by these massive structures. Between 2011 and 2013, the site was studied through rescue excavations carried out during the motorway construction connecting Szeged to the Hungarian–Romanian border [50,51,52,53,60]. Ditches and trash pits are archaeological features from the Bronze Age. Some ditches were “V” or “U” shaped with a depth of 2–3 m and a width of 4–7 m; others were smaller (the trace of the ditches can be seen in Figure 2). Ceramic vessels and artefacts made of bronze or horns were deposited in pits lying on the bottom of the north-south orientated ditch. The ditch was approximately 6–7 m wide and 1.5–2 m deep. After the ditch was abandoned, deliberate deposits were made [50,51,52,53,60].
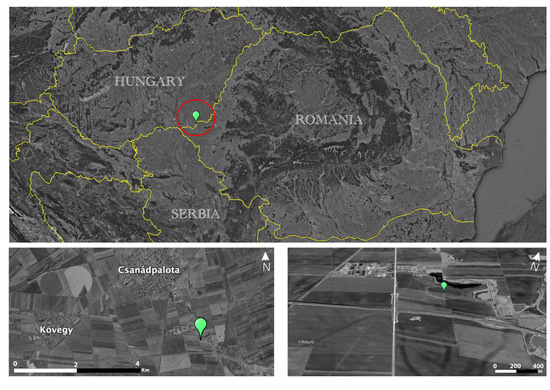
Figure 1.
Location of Csanádpalota-Juhász T. tanya (Google Earth Image—edited).
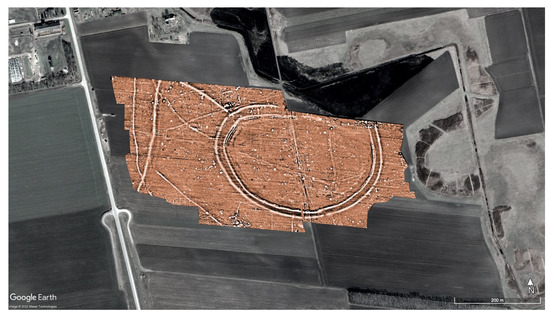
Figure 2.
The magnetic map of Csanádpalota-Földvár enclosure (after [53] Figure 3). This figure was created by georeferencing the image published in [53] Figure 3. The extracted RGB image was enhanced on the red band to better highlight the archaeological features. Visualisation dynamics −/+ 10 nT.
These fortifications are dated to the Late Bronze Age (between the end of the 16th century and the 10th and 9th centuries BCE) based on archaeological findings. At the same time, excavations revealed the construction of defense systems such as earth ramparts, palisades, and ditches, and the existence of violent conflicts that resulted in their destruction [45,61,62]. It is up to future research to ascertain how these fortifications were internally organized and to reconstruct the material culture of the communities that inhabited them.
The circular enclosure uncovered in the fortification’s core region, known as Földvár, was also explored during the rescue excavations. In this case, archaeological excavations were preceded by systematic archaeological material collecting, core drilling, aerial photography, and magnetic prospections. The rampart structure, which consisted of a strip of 30–40 cm of burnt adobe, was identified in the trench excavated here. Postholes were discovered behind it, most possibly forming a palisade. Two 3 m deep “V” shaped ditches located in front of the rampart were investigated. These ditches have also yielded significant archaeological material [50,51,52,53].
3. Methodology
3.1. Satellite Image Processing
In our study, 727 Sentinel 2A and 2B images available during the period from April 2017 until September 2022 were initially queried in the QGIS 3.26 environment using the “Semi-automatic classification” plugin [63]. Afterwards, by applying cloud coverage-image quality thresholds, the total Sentinel 2 dataset was dropped by half (57%), enabling us to proceed with 412 Sentinel 2 images. Figure 3 shows the total number of available Sentinel images per month, after the implementation of the cloud coverage and quality thresholds. The maximum number of Sentinel 2 images per month was 13 (August 2018), while the minimum was 0 (April 2017). For all months, except for April 2017, at least a single image was available over the case study area. The average number of images per month was estimated to be around 6.15 and a median value of 6.
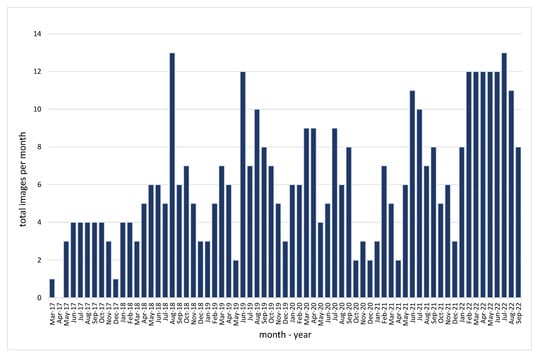
Figure 3.
Total Sentinel 2 (Level 2A) used in this study per month (period from April 2017 until September 2022).
The Sentinel images were retrieved from the Copernicus Open Access Hub (previously known as Sentinels Scientific Data Hub) as a Level-2A product (Bottom Of Atmosphere, BOA, reflectance images). Each Level-2A product is composed of 100 × 100 km2 tiles in cartographic geometry (UTM/WGS84 projection). Sentinel 2A and 2B optical sensors can record electromagnetic radiation in 13 spectral bands, with a range from the visible range to the shortwave infrared (SWIR) at a spatial resolution (ground sampling) of 10 and 20 m.
Then, individual Sentinel 2 images were downloaded and further analyzed in the ArcGIS Pro environment to enhance archaeological proxies. Different enhancement approaches were applied, including radiometric histogram enhancements, vegetation indices (see Table 1), pan-sharpening techniques (Gram–Schmidt method), and orthogonal transformations adopted by [46,64,65,66]. The overall results were compared with existing knowledge of the area.

Table 1.
Linear correlation coefficient of the four areas using the ARVI profiles.
3.2. Analysis of Phenological Profiles
More details regarding phenological observations were investigated for specific areas around the Csanádpalota-Juhász T. tanya site. Four different areas in the wider area of the site were analyzed based on their phenological profiles in the last five years. These areas are in relevant proximity, minimizing potential noise due to different types of soil, crop cultivation, and cultivation practice. Area 1 was selected in the outer circle of the archaeological proxy of the site; area 2 was defined at the center of the circular enclosure; area 3 was over a linear feature observed in the northwest part of the circular enclosure; area 4 was at an agricultural field, as shown in Figure 4.
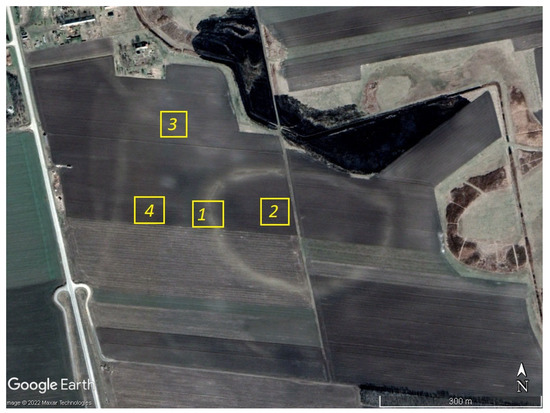
Figure 4.
Selected areas of interest at the Csanádpalota-Juhász T. tanya site. Area 1 is located in the outline of the circular enclosure of the site, area 2, at the center of the site, area 3 over a linear feature, and area 4 at a cultivated field close to the site (background high-resolution Maxar image of 4th March 2017, Google Earth).
In specific, utilizing the QGIS 3.26 environment and the “Semi-automatic classification” plugin [63], vegetation profiles were extracted based on the analysis of different vegetation indices. The latest included the Atmospheric Resistance Vegetation Index (ARVI), the Enhanced Vegetation Index (EVI), the Normalized Difference Vegetation Index (NDVI), and the Soil Adjusted Vegetation Index (SAVI). In addition, the Tasseled Cap transformation was retrieved for the three components of brightness, greenness, and wetness. The equations for these indices and the Tasseled Cap are provided in Table 1.
By employing time-series vegetation indices over a specific area of interest, phenological observations can be made, as shown in Figure 5. The NDVI index was explored to average over a period and map “normal” growing phenological conditions of the area of interest for a given time of year. Higher NDVI values were observed during the development and mid-season periods, while lower values were observed at the initial or late stages of the vegetation phenology. The latest can also be reported in cases of stressed conditions. Indeed, phenological observations can be further elaborated to describe vegetation’s health or even understand any stress conditions and vegetation changes.
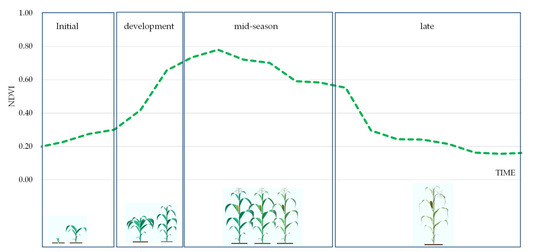
Figure 5.
Phenological diagram of crops at different stages of development along with the NDVI profile.
4. Results
4.1. Sentinel-2 Image Processing
Individual Sentinel-2 image satellite processing was carried out. Due to the complexity of the local geomorphological context of the site, which is in an area with several paleochannels, interpreting archaeological findings using medium-resolution satellite images can be challenging. The implementation of vegetation indices (see Table 1) in Sentinel-2 images did not yield satisfactory results, as shown in Figure 6. This was also reported in other references in the past [73,74,75].
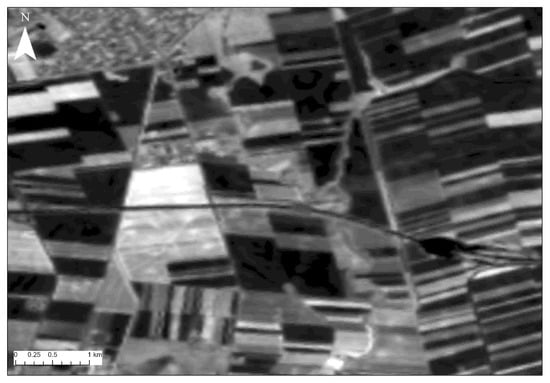
Figure 6.
NDVI index applied at Sentinel-2 image at the Csanádpalota-Juhász T. tanya site. No obvious archaeological proxies can be spotted in the area.
Therefore, it was decided to improve the spatial resolution of the 20 m spectral bands of the Sentinel-2 image to 10 m resolution using the Gram–Schmidt pan-sharpening method [76] (Figure 7, top). In addition, orthogonal transformations [64,65,66] were applied to Sentinel-2 images to enhance the presence of crop marks (Figure 7, bottom) and further support image interpretation. The spatially improved 10-m resolution Sentinel image allowed us to locate other fortification features north of the circular enclosure which can be cross-referenced with better quality images to provide a better image of defensive elements distribution (see Figure 8, left).
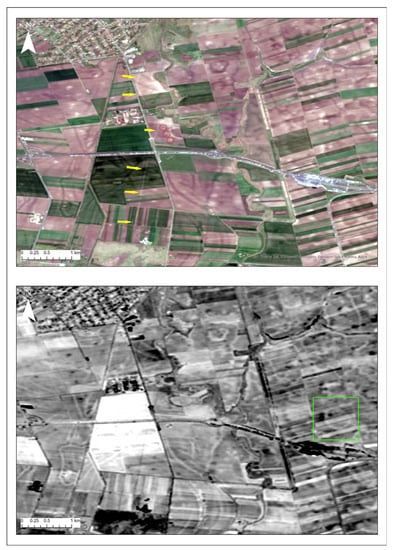
Figure 7.
Gram–Schmidt pan-sharpening Sentinel-2 image over Csanádpalota-Juhász T. tanya (top); results after the implementation of the orthogonal transformation (bottom). Specific areas shown with arrows, circles, and squares are discussed in the paper.
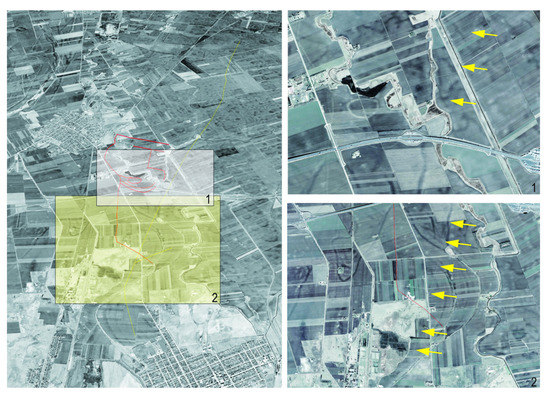
Figure 8.
Edited March 2017 satellite image (available in Google Earth Pro). Left: the red lines denote easily traceable features; the yellow line denotes a linear feature identified in archaeological papers on the fortification’s south-eastern part. The yellow line runs approximately 13 km between Nădlac and Mezhegyes. Right: Rectangles 1 and 2 show details of the regions highlighted on the left image—the yellow arrows indicate the linear feature.
As in the case of other similar investigations at sites in the wider area of Cornești and Sântana (see [46]), the analysis of satellite images related to Csanádpalota-Juhász T. tanya sparked several discussions and revealed novel archaeological features that will be confirmed by archaeologists in the future, given that only the filed survey can confirm or refute the current image of the fortification.
Pan-sharpening and orthogonal transformation (Figure 7) for Sentinel 2 satellite images, for example, highlight the presence of at least three interesting structures west of the main circular enclosure (Figure 7, red circles). When the position of these structures is compared to the existing magnetic map, the multispectral anomalies are caused by a number of rectangular archaeological features located within that area. The closest analogy for this multispectral signature is at Sântana–Cetatea Veche, where the central structure, which the magnetic map confirmed to be a large building, had a similar multispectral signature on Sentinel 2 images [46]. On pan-sharpened images, the western linear fortification system is well individualized (Figure 7, yellow arrows), whereas the presumed eastern system is completely invisible to multispectral analyses. However, local geomorphology played an important role on the eastern side—a north–south paleochannel runs through that area and could have served as protection for the eastern side. We believe that this idea could be explored further in the future by using a more elaborate geoarchaeological approach to determine the age of the paleochannel. The orthogonal transformation of Sentinel 2 revealed another circular structure 2 kilometers east of the site’s main enclosure, which is most likely a natural feature (Figure 7, green square). These circular depressions could occur in this fluvial landscape, but they should be confirmed in the field as well.
Nevertheless, the fortification system is still visible on Sentinel images—the central part, the western and northern ramparts. The fortification line, which is depicted in archaeological papers to the east ([51], Figure 4; [53], Figure 9), is not visible at all. The lack of any crop marks related to that fortification line was peculiar and intriguing, and it necessitated further investigation on more detailed images to explain why this feature was completely absent.
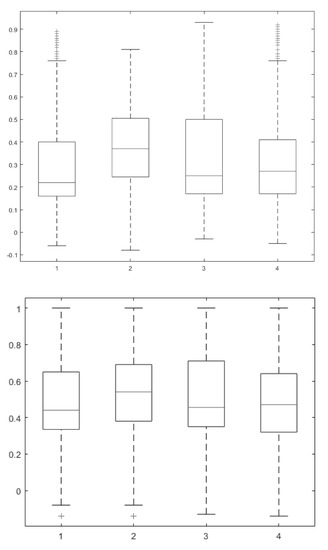
Figure 9.
(Top) Boxplot of the NDVI values of the four areas of interest over the Csanádpalota-Juhász T. tanya site. The X-axis corresponds to the selected area (area 1 is located in the outline of the circular enclosure of the site, area 2, at the center of the site, area 3 over a linear feature, and area 4 at a cultivated field in close proximity to the site), while Y-axis corresponds to the NDVI value (range −1 to +1). (Bottom) Boxplot of the same areas based on the ARVI index.
In Figure 8, a satellite image from March 2017 (available in Google Earth Pro) shows that the so-called eastern fortification line is a distinct feature that is not demanded to be in contact with the main fortification. Given that many of these linear features of considerable length can also be traced in the Romanian Banat, it may be a linear defensive earthwork. What is more intriguing is that this linear feature has a length of around 13 kilometers and can be traced from Nădlac to Mezőhegyes (Figure 8, yellow line), which leads us to believe it could be a medieval road which could have speculated the higher ground of a former rampart or element related to the Bronze Age fortification. Only future archaeological surveys will be able to determine the location of the eastern fortification line, if one exists.
4.2. Phenological Observations
Further to image analysis, phenological observations for the four areas (see Figure 4) were applied. The results are shown in the boxplots in Figure 9. The boxplot on top of Figure 9 indicates the median NDVI value (red line), the minimum and maximum score, and the first (lower) quartile, median, and third (upper) quartile. It is interesting to note that areas 1, 3, and 4 show comparable mean NDVI values, with different variances, while a difference is recorded for area 2. While the mean NDVI value is around 0.20–0.25 for areas 1, 2, and 4, the mean NDVI value for area 2 is around 0.40. Comparable results were retrieved for the four areas based on the ARVI index (Figure 9, bottom).
Areas 1 and 3 show similar patterns in contrast with areas 1 and 2 or areas 2 and 4. Indeed, if we use a trendline (linear regression model) to estimate the correlations between the different areas and the different indices used in this study (see Equations (1)–(6)), we can see a close similarity between areas 1 and 3. The linear correlation coefficient (r2) for all different combinations of areas and vegetation indices is shown in Table 2, Table 3, Table 4, Table 5 and Table 6. EVI index (Equation (2)) provided a very low correlation and is not listed here.
Table 2.
Linear correlation coefficient of the four areas using the ARVI profiles.
Table 3.
Linear correlation coefficient of the four areas using the NDVI profiles.
Table 4.
Linear correlation coefficient of the four areas using the SAVI profiles.
Table 5.
Linear correlation coefficient of the four areas using the SARVI profiles.
Table 6.
Linear correlation coefficient of the four areas using the TCG profiles.
If we consider the observations between profiles for areas 1 and 3, the r2 is exceptionally high (>0.87) for all indices, indicating a strong correlation (and behavior) between the two areas. In contrast, the linear correlation coefficient between areas 1 and 2 is lower (0.44), while the correlation between areas 1 and 4 is estimated to be around 0.52. In addition, the correlation coefficient (r2) for areas 2 and 3, as well as for areas 2 and 4, and 3 with 4, is calculated to be close to or lower than 0.50 for all indices.
Figure 10 shows the NDVI and ARVI plot matrixes for each one of the four areas (areas 1–4) using the whole dataset (412 images). The scatterplots are aligned with remarks made before (see Table 2, Table 3, Table 4, Table 5 and Table 6), as we can see that an almost linear correlation does exist between the two archaeological proxies over areas 1 and 3, in comparison, for instance, with results from areas 2 and 3 where the variance is more considerable. The diagonal rows of the matrices indicate the histogram of each area per vegetation index.
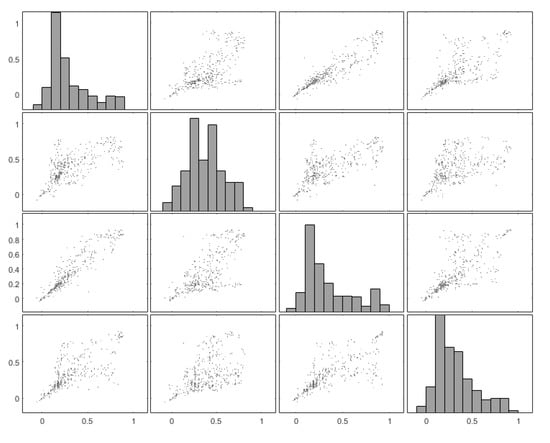
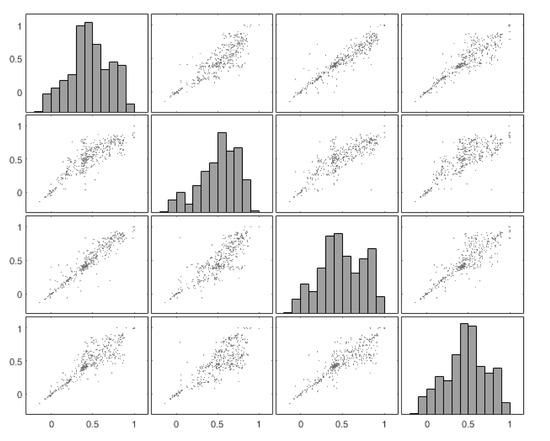
Figure 10.
(Top) Plot matrix of the NDVI values of the four areas of interest over the Csanádpalota-Juhász T. tanya site. The X-axis corresponds to the selected area, while Y-axis corresponds to each one of the four areas. (Bottom) Plot matrix as before using the ARVI index.
Phenological variations of all four areas selected during the study period (April 2017 until September 2022) were also studied. To better understand potential phenological variations due to the presence of archaeological proxies, one should recall the study of [5]. Non-homogenous areas with different soil compositions and environmental conditions can have a different impact on the phenological profile of a crop. Likewise, differences might occur due to different land management practices. In addition, as McCloy [77] argues, all these considerations lead to the hypothesis that the phenological curve—as detected from satellite sensors—can change in one of five ways (or a combination of them), as illustrated in Figure A1. In that study, the NDVI index was used to monitor phenological variations throughout time.
Figure 11 shows the phenological profile for the complete sample of the dataset (412 images). The x-axis displays the period based on the date of acquisition of the available images, while the Y-axis indicates the NDVI value. In addition, a moving average filter (2 periods) is applied (shown as lines in Figure 11) to smooth the sample. In particular, specific periods of interest can be considered those where the NDVI value is more significant than 0.2 (crops start to grow). Therefore, a value lower than 0.20 can be ignored, as these usually belong to other classes (e.g., soil, urban areas, and water bodies).
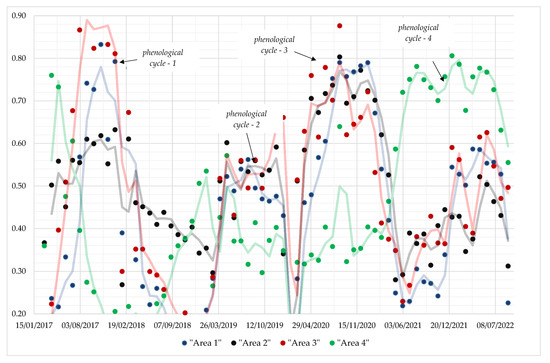
Figure 11.
Phenological profiles are shown as dots over areas 1, 2, 3 (archaeological proxies), and 4 (cultivated area). A moving average filter of 2 periods (line) was applied to smooth the datasets.
To analyze the phenological profiles—as shown in Figure 11—two parallel studies can be made: (a) a first study may be focused on examining how crops’ phenology is captured by the Sentinel sensors over archaeological proxies nearby, while (b) a second study can be focused on variations between areas with archaeological interest and “non-archaeological areas” (e.g., cultivated fields). For the study (a), a comparison between areas 1 and 3 was made. For this study (b), a comparison between areas 1, and 3 against area 4 was performed (see Figure 4).
As shown in Figure 11, differences between the NDVI values for all areas exist. The phenological cycle of the crops is well depicted at least four times for all areas. These cycles’ profile is similar to the expected pattern and illustrated in Figure A1. In general, areas 1 and 3 (archaeological proxies, indicated with blue and red lines in Figure 11) tend to provide similar patterns, such as synchronous periods for the start and end of the phenological cycles and high peaks during the same periods. In addition, the area 2 profile is comparable with areas 1 and 3 for at least two phenological periods (March 2019 until April 2020 and April 2020 until June 2021). A distinct contrast to these measurements is those recorded over area 4 (non-archaeological area). While for the first two phenological periods, no comparison can be made against the other three areas, in the latest two phenological cycles, we can observe significant variations: during the third phenological cycle, we have for area 4 a high peak value at the same period as the other three areas (areas 1–3), indicating that the same cultivation practices were followed, and crops were planted. Nevertheless, the maximum NDVI value was up to 0.50 against to around 0.80 for the rest three areas under examination. A reverse phenomenon was captured during the last (4th) phenological cycle, whereas higher NDVI values were depicted for area 4 (around 0.80) and lower, but still high, values for areas 1–3.
5. Conclusions
This study presented the results of remote sensing analysis over the mega fort Bronze Age site of the Csanádpalota-Juhász T. tanya in Hungary. For this purpose, 412 Sentinel-2 images covering the period 2017 to 2022 were used. The analysis was carried out in two steps: firstly by analysing single Sentinel-2 datasets using various image processing techniques, and secondly by examining the phenological profile of specific areas around the site.
For the first step, although the 20 m resolution was too coarse to spot any crop mark formation, the pan-sharpening technique enabled us to improve the spatial resolution at 10 m and proceed with image enhancement techniques. The overall results of this analysis highlighted the vast bulk of the previously known archaeological features (part of the fortification lines). Nevertheless, our analyses revealed several previously unknown features in the archaeological literature but also sparked debate over the eastern fortification line’s existence, which requires more investigations.
For the second step, interesting outcomes were generated concerning the potential use of phenological studies to detect crop marks. This topic still has limited discussion in the literature. Phenological similarities over archaeological proxies were reported (see areas 1 and 3), while the systematic spectral variation with non-archaeological areas (area 4) is also evident. This finding supports the hypothesis that studies dealing with the phenological profile of archaeological areas can be used as an indicator (proxy) for the existence of buried archaeological remains. Such studies must consider the proper use of multi-temporal analysis of remotely sensed data. Therefore, calibrated images provided by the Copernicus Programme seem ideal for the moment.
Future work can be considered, taking into consideration higher resolution datasets, including airborne and low altitude, to increase the archaeological visibility of the site further. At the same time, medium resolution interpterion and analysis can be carried out to investigate other similar sites located on the broader landscape.
Author Contributions
Conceptualization, methodology, A.A. and A.H.; writing—original draft preparation, A.A. and A.H.; writing—review and editing, A.A., A.H. and A.S. All authors have read and agreed to the published version of the manuscript.
Funding
Part of the image processing and analysis in this study was funded by the ENSURE project (innovative survey techniques for detection of surface and sub-surface archaeological remains), a Cyprus University of Technology internal funding.
Data Availability Statement
Not applicable.
Acknowledgments
A.H. would like to acknowledge PN-III-P1-1.1-PD-2019-0939, founded by UEFISCDI. A.A. would like to acknowledge the ENSURE project (Innovative survey techniques for detection of surface and sub-surface archaeological remains, CUT internal funding). The authors would like to acknowledge the use of open access and freely distributed satellite datasets from Copernicus Open Access Hub (for Sentinel 2 images).
Conflicts of Interest
The authors declare no conflict of interest. The funders had no role in the design of the study; in the collection, analyses, or interpretation of data; in the writing of the manuscript; or in the decision to publish the results.
Appendix A

Figure A1.
Phenological profiles under different conditions [5,77]. Case A: Change in the amplitude of the NDVI Phenological Curve in an area which is moisture constrained; a trend of increasing rainfall may result in an increase in peak greenness relative to the greenness out of the growing season (or the opposite which leads to a decrease of the peak greenness). Case B: Overall change of the greenness (NDVI) throughout the year for example in an area with similar (not the same) crop cultivation. Case C: Shift in the time of the peak in an area where changes in the temperature and/or rainfall regimes lead to a shift in the phenophase associated with growth, maturation and death. Case D: Lengthening of the growing season yielding a broader or narrower phenological trajectory through time as can occur with rising or falling temperatures in areas that are temperature constrained and lastly, Case E: Change in the shape of the phenological curve, during the phenological cycle in areas after the invasion of species or due to changes in the rainfall regime. On the other hand, this is also the case when the crop is characterized under stress due to the lack of soil nutrients. The latest might be related to buried archaeological remains such as walls (negative crop marks) ([5]).

References
- Parcak, S.H. Satellite Remote Sensing for Archaeology; Routledge Taylor and Francis Group Press: London, UK, 2009; p. 320. [Google Scholar]
- Agapiou, A.; Hadjimitsis, D.G.; Alexakis, D.D. Evaluation of Broadband and Narrowband Vegetation Indices for the Identification of Archaeological Crop Marks. Remote Sens. 2012, 4, 3892–3919. [Google Scholar] [CrossRef]
- Abate, N.; Aromando, A.; Lasaponara, R. Old Methods and New Technologies: A Multidisciplinary Approach to Archaeological Research in Sant’Arsenio (Salerno, Italy). In Proceedings of the International Conference on Computational Science and Its Applications, Saint Petersburg, Russia, 1–4 July 2019; Volume 11622. [Google Scholar] [CrossRef]
- Abate, N.; Elfadaly, A.; Masini, N.; Lasaponara, R. Multitemporal 2016–2018 Sentinel-2 Data Enhancement for Landscape Archaeology: The Case Study of the Foggia Province, Southern Italy. Remote Sens. 2020, 12, 1309. [Google Scholar] [CrossRef]
- Agapiou, A.; Hadjimitsis, D.G. Vegetation indices and field spectro-radiometric measurements for validation of buried architectural remains: Verification under area surveyed with geophysical campaigns. J. Appl. Remote Sens. 2011, 5, 05355. [Google Scholar] [CrossRef]
- Agapiou, A.; Hadjimitsis, D.G.; Alexakis, D.; Sarris, A. Observatory validation of Neolithic tells (“Magoules”) in the Thessalian plain, central Greece, using hyperspectral spectroradiometric data. J. Archaeol. Sci. 2012, 39, 1499–1512. [Google Scholar] [CrossRef]
- Calleja, J.F.; Requejo Pagés, O.; Díaz-Álvarez, N.; Peón, J.; Gutiérrez, N.; Martín-Hernández, E.; Cebada Relea, A.; Rubio Melendi, D.; Fernández Álvarez, P. Detection of buried archaeological remains with the combined use of satellite multispectral data and UAV data. Int. J. Appl. Earth Obs. Geoinf. 2018, 73, 555–573. [Google Scholar] [CrossRef]
- Lasaponara, R.; Masini, N. Detection of archaeological crop marks by using satellite QuickBird multispectral imagery. J. Archaeol. Sci. 2007, 34, 214–221. [Google Scholar] [CrossRef]
- Agapiou, A.; Alexakis, D.D.; Sarris, A.; Hadjimitsis, D.G. Evaluating the Potentials of Sentinel-2 for Archaeological Perspective. Remote Sens. 2014, 6, 2176–2194. [Google Scholar] [CrossRef]
- Berganzo-Besga, I.; Orengo, H.A.; Lumbreras, F.; Carrero-Pazos, M.; Fonte, J.; Vilas-Estévez, B. Hybrid MSRM-Based Deep Learning and Multitemporal Sentinel 2-Based Machine Learning Algorithm Detects Near 10k Archaeological Tumuli in North-Western Iberia. Remote Sens. 2021, 13, 4181. [Google Scholar] [CrossRef]
- Agapiou, A.; Lysandrou, V. Remote Sensing Archaeology: Tracking and mapping evolution in scientific literature from 1999–2015. J. Archaeol. Sci. Rep. 2015, 4, 192–200. [Google Scholar] [CrossRef]
- Luo, L.; Wang, X.; Guo, H.; Lasaponara, R.; Zong, X.; Masini, N.; Wang, G.; Shi, P.; Khatteli, H.; Chen, F.; et al. Airborne and spaceborne remote sensing for archaeological and cultural heritage applications: A review of the century (1907–2017). Remote Sens. Environ. 2019, 232, 111280. [Google Scholar] [CrossRef]
- Agapiou, A. Remote sensing heritage in a petabyte-scale: Satellite data and heritage Earth Engine© applications. Int. J. Digit. Earth 2017, 10, 85–102. [Google Scholar] [CrossRef]
- Liang, J.; Gong, J.; Li, W. Applications and impacts of Google Earth: A decadal review (2006–2016). ISPRS J. Photogramm. Remote Sens. 2018, 146, 91–107. [Google Scholar] [CrossRef]
- Luo, L.; Wang, X.; Guo, H.; Lasaponara, R.; Shi, P.; Bachagha, N.; Li, L.; Yao, Y.; Masini, N.; Chen, F.; et al. Google earth as a powerful tool for archaeological and cultural heritage applications: A review. Remote Sens. 2018, 10, 1558. [Google Scholar] [CrossRef]
- Miklós, Z. Légi Régészeti Kutatások 2003-ban—Aerial Archaeological Investigations in 2003; Régészeti Ku-tatások Magyarországon 2003—Archaeological Investigations in Hungary 2003; KÖH: Budapest, Hungary, 2004; pp. 127–145. [Google Scholar]
- Miklós, Z. Légi Régészeti Kutatások 2004-ben—Aerial Archaeological Investigations in 2004; Régészeti Ku-tatások Magyarországon 2004—Archaeological Investigations in Hungary 2004; KÖH: Budapest, Hungary, 2005; pp. 143–157. [Google Scholar]
- Miklós, Z. Légi Régészeti Kutatások 2005-ben—Aerial Archaeological Investigations in 2005; Régészeti Ku-tatások Magyarországon 2005—Archaeological Investigations in Hungary 2005; KÖH: Budapest, Hungary, 2006; pp. 161–170. [Google Scholar]
- Miklós, Z. Légi Régészeti Kutatások 2006-ban—Aerial Archaeological Investigations in 2006; RégészetiKutatások Magyarországon 2006—Archaeological Investigations in Hungary 2006; KÖH: Budapest, Hungary, 2007; pp. 37–146. [Google Scholar]
- Czajlik, Z. Légirégészeti Kutatások Magyarországon 2003-ban (Rövid Beszámoló az ELTE Régészettu-Dományi Intézetének Térinformatikai Kutató Laboratóriumában Folyó Munkáról)—Aerial Archaeological Investigations in Hungary in 2003 (A Short Report on the Work Done in the GIS Research Laboratory of the Institute of Archaeological Sciences, Eötvös Loránd University); Régészeti Kutatások Magyarországon 2003—Archaeological Investigations in Hungary 2003; KÖH: Budapest, Hungary, 2004; pp. 111–125. [Google Scholar]
- Czajlik, Z. Aerial archaeological prospection and documentation. The aerial archaeological archive of the Institute of Archaeological Sciences of the Eötvös Loránd University of Budapest (Summary of the activity in 1993–2005). Archeometriai Műhely 2007, 3, 1–10. [Google Scholar]
- Czajlik, Z. Aerial archaeology in the research of burial tumuli. Commun. Archaeol. Hung. 2008, 2008, 95–107. [Google Scholar]
- Asandulesei, A. Oblique air photography for chalcolithic sites from eastern Romania. Analysis and interpretation. Some examples. Stud. Antiq. Archaeol. 2014, 20, 69–89. [Google Scholar]
- Asăndulesei, A. GIS, Fotogrametrie și Geofizică în Arheologie. Investigații Non-Invazive în Așezări Cucuteni din România; Editura Universității “‘Alexandru Ioan Cuza’” din Iași: Iași, Romania, 2019. [Google Scholar]
- Ștefan, D.; Ștefan, M.-M. The drones are coming. What to choose? Low or Medium altitude aerial arcaheology on Limes Transalutanus. J. Anc. Hist. Archaeol. 2016, 3, 161–185. [Google Scholar] [CrossRef]
- Teodor, E.; Pețan, A.; Hegyi, A. A “new” Roman Temporary Camp in Parâng Mountains. Cercet. Arheol. 2018, XXV, 77–90. [Google Scholar] [CrossRef]
- Teodor, E.; Pețan, A.; Hegyi, A. Comments on the morphology of the hillfort from Muncel. ArheoVest, VI. In Memoriam Marian Gumă; Universitatea de Vest din Timișoara: Timișoara, Romania, 2018; pp. 683–706. [Google Scholar]
- Cociș, H. Surface and Low altitude surveys on the military vici from Sălaj county (Dacia Porolissensis). An. Banat. S.N Arheol.-Istor. 2018, XXVI, 35–52. [Google Scholar]
- Hegyi, A. Aplicarea Metodelor Specifice Geoștiințelor in Cercetări Arheologice din Sud-Vestul României (Teză Doctorat); Universitatea de Vest din Timișoara: Timișoara, Romania, 2018. [Google Scholar]
- Hegyi, A.; Sarris, A.; Curta, F.; Floca, C.; Fortiu, S.; Urdea, P.; Onaca, A.; Timofte, F.; Pisz, M.; Timut, S.; et al. Deserted medieval village reconstruction using applied geosciences. Remote Sens. 2020, 12, 1975. [Google Scholar] [CrossRef]
- Hegyi, A.; Urdea, P.; Floca, C.; Ardelean, A.; Onaca, A. Mapping the subsurface structures of a lost medieval village in South-Western Romania by combining conventional geophysical methods. Archaeol. Prospect. 2019, 26, 21–32. [Google Scholar] [CrossRef]
- Țentea, O.; Matei-Popescu, F.; Călina, V. Frontiera romană din Dacia Inferior. O trecere în revistă și o actualizare. 1. Cercet. Arheol. 2021, 28, 9–90. [Google Scholar] [CrossRef]
- Pisz, M.; Tomas, A.; Hegyi, A. Non-destructive research in the surroundings of the Roman Fort Tibiscum (today Romania). Archaeol. Prospect. 2020, 27, 219–238. [Google Scholar] [CrossRef]
- Stavilă, A.; Hegyi, A.; Craiovan, B. Non-invasive archaeological research performed in the Middle Bronze Age settlement from Alioș-Valea Alioşu (Timiș County, Romania). Structures, chronology, and perspectives. Ziridava Stud. Arcaheologica 2020, 34, 168–188. [Google Scholar]
- Floca, C.; Gogâltan, F.; Hegyi, A.; Chiroiu, P.; Forțiu, S. Using the water power in preindustrial Banat. A historical archaeology study on the Lower Timiș River, Ziridava. Ziridava Stud. Archaeol. 2021, 35, 371–418. [Google Scholar]
- Harding, A. Corneşti-Iarcuri and the rise of mega-forts in Bronze Age Europe. In Proceedings of the Fortifications: The Rise and Fall of Defended Sites in Late Bronze and Early Iron Age of South-East Europe, Timişoara, Romania, 11–13 November 2015; pp. 9–14. [Google Scholar]
- Micle, D.; Măruia, L.; Dorogostaisky, L. The earth works from Cornești—”Iarcuri” (Orțișoara Village, Timiș County) in the light of recent field research. An. Banat. SN 2006, XIV, 283–306. [Google Scholar]
- Micle, D.; Török-Oance, M.; Măruia, L. The morpho-topographic and cartographic analysis using GIS and Remote Sensing techniques of the archaeological site Cornesti “Iarcuri”, Timis County, Romania. In Proceedings of the Advances on Remote Sensing for Archaeology and Cultural Heritage Management, Proceedings of the 1st International EARSeL Workshop CNR, Rome, Italy, 30 September–4 October 2008; pp. 387–393. [Google Scholar]
- Heeb, B.S.; Szentmiklosi, A.; Wiecken, J.M. Zu den wallringen von Corneşti-Iarcuri, Jud. Timiş, Rumänien—Forschungsgeschichte und neueste untersuchungen. Prahistorische Z. 2008, 83, 179–188. [Google Scholar] [CrossRef]
- Heeb, B.; Teinz, K.; Bälärie, A.; Szentmiklosi, A.; Lehmphul, R. Zum Fund eines Schuhgefäßfragments in Corneşti-Iarcuri. Mitt. Der Berl. Ges. Fur Anthropol. Ethnol. Und Urgesch. 2018, 39, 51–54. [Google Scholar]
- Nykamp, M.; Hoelzmann, P.; Heeb, B.S.; Szentmiklosi, A.; Schütt, B. Holocene sediment dynamics in the environs of the fortification enclosure of Corneşti-Iarcuri in the Romanian Banat. Quat. Int. 2016, 415, 190–203. [Google Scholar] [CrossRef]
- Nykamp, M.; Knitter, D.; Timár, G.; Krause, J.; Heeb, B.S.; Szentmiklosi, A.; Schütt, B. Estimation of wind-driven soil erosion of a loess-like sediment and its implications for the occurrence of archaeological surface and subsurface finds—An example from the environs of Corneşti-Iarcuri, western Romania. J. Archaeol. Sci. Rep. 2017, 12, 601–612. [Google Scholar] [CrossRef]
- Szentmiklosi, A.; Heeb, B.S.; Heeb, J.; Harding, A.; Krause, R.; Becker, H. Corneşti-Iarcuri—A Bronze Age town in the Romanian Banat? Antiquity 2011, 85, 819–838. [Google Scholar] [CrossRef]
- Gogâltan, F.; Sava, V. Sântana Cetatea Veche—A Bronze Age earthwork on the lower Mureş; Bronze Age: Arad, Israel, 2010; 99p. [Google Scholar]
- Gogâltan, F.; Sava, V. A violent end. An attack with clay sling projectiles against the late bronze age fortification in Sântana. In Ronzezeitliche Burgen Zwischen Taunus und Karpaten/Bronze Age Hillforts between Taunus and Carpathian Mountains; Hansen, S., Krause, R., Eds.; Verlag Dr. Rudolf Habelt GmbH: Frankfurt am Main, Germany, 2018; pp. 349–369. [Google Scholar]
- Agapiou, A.; Hegyi, A.; Gogâltan, F.; Stavilă, A.; Sava, V.; Sarris, A.; Floca, C.; Dorogostaisky, L. Medium Resolution Multispectral Satellite Images for Archaeological Prospection: Exploring the Largest Known Bronze Age Earthworks in Europe. Int. J. Appl. Earth Obs. Geoinf. 2022, in press. [Google Scholar]
- Molloy, B.; Jovanović, D.; Bruyère, C.; Marić, M.; Bulatović, J.; Mertl, P.; Horn, C.; Milašinović, L.; Mirković-Marić, N. A New Bronze Age Mega-fort in Southeastern Europe: Recent Archaeological Investigations at Gradište Iđoš and their Regional Significance. J. Field Archaeol. 2020, 45, 293–314. [Google Scholar] [CrossRef]
- Milo, P.; Lichtenstein, L.; Rózsa, Z.; Tencer, T.; Fekete et Marek Vlach, Z. Geophysical Survey at archaeological site Kaszaper, Békés County, Hungary. ArchéoSciences 2009, 33, 115–116. [Google Scholar] [CrossRef]
- Czukor, P.; Priskin, A.; Szalontai, C.; Szeverényi, V. Késő bronzkori földvárak a Dél-Alföldön. In A második Hajdúböszörményi Szitula és Kapcsolatrendszere; Szabó, G.V., Bálint, M., Váczi, G., Lőrinczy, G., Eds.; Régészettudományi Intézet: Budapest, Hungary, 2017; pp. 211–230. [Google Scholar]
- Czukor, P.; Priskin, A.; Szalontai, C.; Szeverényi, V. Csanádpalota, Földvár (KÖH 86463) (Csongrád megye) B, Á, Ú. Régészeti Kut Magy. 2013, 30–31. Available online: https://archeodatabase.hnm.hu/hu/download/15368/file/189661c3-2fce-4a49-80d3-7f3e511dd928?type=pdf (accessed on 25 November 2022).
- Priskin, A.; Czukor, P.; Szalontai, C.; Szeverényi, V. Research into the structure of Late Bronze Age settlements in the southern Great Hungarian Plain: “Enclosed Space—Open Borders” Project. Hung Archaeol. e-J. 2013, 1–6. Available online: https://www.academia.edu/5119466/Research_into_the_Structure_of_Late_Bronze_Age_Settlements_in_the_Southern_Great_Hungarian_Plain (accessed on 25 November 2022).
- Szeverényi, V.; Priskin, A.; Czukor, P.; Torma, A.; Tóth, A. Élelmiszer-termelés, település és társadalom a késő bronzkorban Délkelet-Magyarorszá-gon: Esettanulmány Csanádpalota-Földvár erődített település alapján. MóraFerenc Múzeum Évkönyve 2015, 2, 41–66. [Google Scholar]
- Szalontai, C.; Priskin, A.; Czukor, P.; Szeverényi, V. Őskori Tájhasználat a Délkelet-Alföldön Néhány Késő Bronzkori Földvár Alapján. VII; Magyar Tájökológiai Koferencia Iterdiszipliáris tájkutatás a XXI; Százada: Szeged, Hungary, 2017; pp. 565–573. [Google Scholar]
- Dorogostaisky, L.; Ardelean, A. Rezultatele cercetărilor de teren (2014) a patru mari așezări fortificate de la sfârșitul epocii bronzului din Câmpia de Vest: Biled–Șandra, Cenei, Sânnicolau Mare și Pecica. ArheoVest. In Honorem Gheorghe Lazarovici, Interdisciplinaritate în Arheologie; ArheoVest: Timișoara, Romania, 2014; Volume 6, pp. 323–347. [Google Scholar]
- Dorogostaisky, L.; Hegyi, A. Noi ipoteze de lucru pentru cercetarea epocii bronzului în Banat (II). Un posibil complex de fortificații și așezări în arealul localităților Variaș-Satchinez (jud. Timiș). ArheoVest. In Honorem Doina Benea; ArheoVest: Timișoara, Romania, 2017; Volume V, pp. 747–770. [Google Scholar]
- Lasaponara, R.; Abate, N.; Masini, N. On the Use of Google Earth Engine and Sentinel Data to Detect Lost Sections of Ancient Roads. The Case of Via Appia. IEEE Geosci. Remote Sens. Lett. 2021, 19, 1–5. [Google Scholar] [CrossRef]
- Tapete, D.; Cigna, F. Appraisal of Opportunities and Perspectives for the Systematic Condition Assessment of Heritage Sites with Copernicus Sentinel-2 High-Resolution Multispectral Imagery. Remote Sens. 2018, 10, 561. [Google Scholar] [CrossRef]
- Agapiou, A.; Lysandrou, V.; Lasaponara, R.; Masini, N.; Hadjimitsis, D.G. Study of the Variations of Archaeological Marks at Neolithic Site of Lucera, Italy Using High-Resolution Multispectral Datasets. Remote Sens. 2016, 8, 723. [Google Scholar] [CrossRef]
- Conesa, F.C.; Orengo, H.A.; Lobo, A.; Petrie, C.A. An Algorithm to Detect Endangered Cultural Heritage by Agricultural Expansion in Drylands at a Global Scale. Remote Sens. 2023, 15, 53. [Google Scholar] [CrossRef]
- Szeverényi, V.; Priskin, A.; Czukor, P. Csanádpalota-Juhász, T. tanya (M43 55. lh.) késő bronzkori erődített település feltárása: Előzetes jelentés a 2011–2013. Évi ásatások eredményeiről. A Móra Ferenc Múzeum Évkönyv 2014, 1, 35–60. [Google Scholar]
- Sava, V.; Gogâltan, F.; Krause, R. First steps in the dating of the bronze age mega-fort in Sântana-Cetatea Veche (Southwestern Romania). In Bronze Age Fortresses in Europe. Proceedings of the Second International LOEWE Conference, 9–13 October 2017, Alba Iulia, Romania; Hansen, S., Krause, R., Eds.; ACADEMIC: Bonn, Germany, 2019; pp. 161–176. [Google Scholar]
- Krause, R.; Szentmiklosi, A.; Heeb, B.; Lehmphul, R.; Teinz, K.; Bălărie, A.; Herbig, C.; Stobbe, A.; Schmid, J.; Schäffler, D.; et al. Cornești-Iarcuri. Die Ausgrabungen 2013 und 2014 in der befestigten Großsiedlung der späten Bronzezeit im rumänischen Banat. Eurasia Antiq. 2019, 22, 133–184. [Google Scholar]
- Congedo, L. Semi-Automatic Classification Plugin: A Python tool for the download and processing of remote sensing images in QGIS. J. Open Source Softw. 2021, 6, 3172. [Google Scholar] [CrossRef]
- Agapiou, A. Orthogonal equations for the detection of archaeological traces de-mystified. J. Archaeol. Sci. Rep. 2016, 14, 792–799. [Google Scholar] [CrossRef]
- Agapiou, A.; Alexakis, D.D.; Sarris, A.; Hadjimitsis, D.G. Orthogonal re-projection of spectral bands using medium and high-resolution satellite images for the detection of archaeological crop marks. Remote Sens. 2013, 5, 6560. [Google Scholar] [CrossRef]
- Agapiou, A.; Alexakis, D.D.; Sarris, A.; Hadjimitsis, D.G. Linear 3-D transformations of Landsat 5 TM satellite images for the enhancement of archaeological signatures during the phenological of crops. Int. J. Remote Sens. 2015, 36, 20–35. [Google Scholar] [CrossRef]
- Kaufman, Y.J.; Tanré, D. Atmospherically resistant vegetation index (ARVI) for EOS-MODIS. IEEE Trans. Geosci. Remote Sens. 1992, 30, 261–270. [Google Scholar] [CrossRef]
- Huete, A.R.; Liu, H.Q.; Batchily, K.; van Leeuwen, W. A comparison of vegetation indices over a global set of TM images for EOS-MODIS. Remote Sens. Environ. 1997, 59, 440–451. [Google Scholar] [CrossRef]
- Rouse, J.W.; Haas, R.H.; Schell, J.A.; Deering, D.W.; Harlan, J.C. Monitoring the Vernal Advancements and Retrogradation (Greenwave Effect) of Nature Vegetation; NASA/GSFC Final Report; NASA: Greenbelt, MD, USA, 1974. [Google Scholar]
- Huete, A.R. A Soil Adjusted Vegetation Index (SAVI). Remote Sens. Environ. 1988, 25, 295–309. [Google Scholar] [CrossRef]
- Cerra, D.; Agapiou, A.; Cavalli, R.M.; Sarris, A. An objective assessment of hyperspectral indicators for the detection of buried archaeological relics. Remote Sens. 2018, 10, 500. [Google Scholar] [CrossRef]
- IDB: Index Database from the University of Bonn. Available online: www.indexdatabase.de (accessed on 25 November 2022).
- Agapiou, A. Enhancement of archaeological proxies at non-homogenous environments in Remotely Sensed Imagery. Sustainability 2019, 11, 3339. [Google Scholar] [CrossRef]
- Bennett, R.; Welham, K.; Hill, R.A.; Ford, A.L.J. The application of vegetation indices for the prospection of archaeological features in grass-dominated environments. Archaeol. Prospect. 2012, 19, 209–218. [Google Scholar] [CrossRef]
- Agapiou, A. Optimal spatial resolution for the detection and discrimination of archaeological proxies in areas with spectral heterogeneity. Remote Sens. 2020, 12, 136. [Google Scholar] [CrossRef]
- Ehlers, M.; Klonus, S.; Åstrand, J.P.; Rosso, P. Multi-sensor image fusion for pansharpening in remote sensing. Int. J. Image Data Fusion 2010, 1, 25–45. [Google Scholar] [CrossRef]
- McCloy, K.R. Development and evaluation of phenological change indices derived from time series of image data. Remote Sens. 2010, 2, 2442–2473. [Google Scholar] [CrossRef]


Disclaimer/Publisher’s Note: The statements, opinions and data contained in all publications are solely those of the individual author(s) and contributor(s) and not of MDPI and/or the editor(s). MDPI and/or the editor(s) disclaim responsibility for any injury to people or property resulting from any ideas, methods, instructions or products referred to in the content. |
© 2023 by the authors. Licensee MDPI, Basel, Switzerland. This article is an open access article distributed under the terms and conditions of the Creative Commons Attribution (CC BY) license (https://creativecommons.org/licenses/by/4.0/).