Article

National Scale Maize Yield Estimation by Integrating Multiple Spectral Indexes and Temporal Aggregation

1
Key Laboratory of Spatial Data Mining & Information Sharing of Ministry of Education, School of Physics and Information Engineering, Fuzhou University, Fuzhou 350116, China
2
School of Earth Sciences and Spatial Information Engineering, Hunan University of Science and Technology, Xiangtan 411201, China
3
Fujian Jingwei Digital Technology Corporation, Fuzhou 350001, China
*
Author to whom correspondence should be addressed.
Remote Sens. 2023, 15(2), 414; https://doi.org/10.3390/rs15020414
Submission received: 18 November 2022 / Revised: 31 December 2022 / Accepted: 4 January 2023 / Published: 10 January 2023
(This article belongs to the Special Issue Monitoring Agricultural Land-Use Change and Land-Use Intensity Ⅱ)

Abstract

:
Maize yield in China accounts for more than one-fourth of the global maize yield, but it is challenged by frequent extreme weather and increasing food demand. Accurate and timely estimation of maize yield is of great significance to crop management and food security. Commonly applied vegetation indexes (VIs) are mainly used in crop yield estimation as they can reflect the greenness of vegetation. However, the environmental pressures of crop growth and development are difficult to monitor and evaluate. Indexes for water content, pigment content, nutrient elements and biomass have been developed to indirectly explain the influencing factors of yield, with extant studies mainly assessing VIs, climate and water content factors. Only a few studies have attempted to systematically evaluate the sensitivity of these indexes. The sensitivity of the spectral indexes, combined indexes and climate factors and the effect of temporal aggregation data need to be evaluated. Thus, this study proposes a novel yield evaluation method for integrating multiple spectral indexes and temporal aggregation data. In particular, spectral indexes were calculated by integrating publicly available data (remote sensing images and climate data) from the Google Earth Engine platform, and county-level maize yields in China from 2015 to 2019 were estimated using a random forest model. Results showed that the normalized moisture difference index (NMDI) is the index most sensitive to yield estimation. Furthermore, the potential of adopting the combined indexes, especially NMDI_NDNI, was verified. Compared with the whole-growth period data and the eight-day time series, the vegetative growth period and the reproductive growth period data were more sensitive to yield estimation. The maize yield in China can be estimated by integrating multiple spectral indexes into the indexes for the vegetative and reproductive growth periods. The obtained R2 of maize yield estimation reached 0.8. This study can provide feature knowledge and references for index assessments for yield estimation research.

1. Introduction

In the next few decades, mankind will be faced with the combined challenge of increasing global food production and reducing environmental damage [1]. Eradicating hunger and achieving food security by 2030 is an important goal of the United Nations [2]. The demand for food production is expected to increase by 70–100% by 2050, and food production can be increased by improving crop yields on existing farmlands [3]. China is the largest smallholder system in the world [4], and it is the second largest producer of maize at the global level [3]. However, agricultural systems in China are highly heterogeneous because of climate, topography and management (crop rotation and intercropping) complexities [5]. Obtaining information on the spatial and temporal distribution of maize yield in a timely and accurate manner is essential in ensuring national food security and rationalizing the agricultural structure [3].
Crop yield estimation is a challenging task due to a variety of complex factors. Crop yields depend mainly on climate, soil, genotype and management factors [2,6], which can be formulated as Yield = f (climate) + (soil) + (genotype) + (management). These variables can be further described as follows. (1) Climate variables (temperature, precipitation and phenology) are widely used for crop yield prediction [7]. Land surface temperature (LST) is sensitive to heat stress and water stress, and it is widely used for crop yield estimation [7,8]. Climate factors are usually obtained via remote sensing technology. However, information pertaining to soil, genotype and management is difficult to monitor directly by simply using remote sensing; in fact, the indexes used to obtain information are derived indirectly. (2) Soil variables refer to soil moisture, salinity and nutrients [9]. Normalized difference water index (NDWI) [10] is sensitive to soil moisture content, which is directly related to crop growth status and yield [9]. Nitrogen (N) content provides important nutrients to the kernel, and it can reflect the level of maize management and soil nutrition [9]. (3) Management variables include irrigation, fertilization, crop rotation and intercropping. Management practices (fertilization and irrigation) and crop breeding can also improve crop yield [11]. (4) For the genotype variables, climate and genotype jointly affect many aspects of plant physiology, including chlorophyll content, biomass, plant water content and final grain yield [12,13]. Most of these factors are biophysical variables. Biophysical variables include leaf area index (LAI), vegetation cover, fraction of absorbed photo synthetically active radiation (fAPAR), pigment content (chlorophyll, carotenoid, anthocyanin), nitrogen content, canopy water content and biomass [14,15,16].
Vegetation indexes (VIs) are the most commonly used indexes in crop yield estimation [17,18]. Examples of VIs are the normalized difference vegetation index (NDVI), leaf area index (LAI) [17,19] and wide dynamic range vegetation index [20]. However, NDVI tends to be saturated at the peak of the growth season [21]. Compared with other VIs (e.g., LSTs), the near-infrared reflectance of vegetation (NIRv) has great potential in predicting maize and soybean yields [18,22]. The solar-induced chlorophyll fluorescence (SIF) index can also approximate the enhanced vegetation index (EVI) from the aspect of crop growth performance when the resolution of spatial imagery is low [7]. Nonetheless, VIs have shortcomings: they have been developed for specific targets [23], and their applicability largely depends on vegetation type and local conditions [24]. Although VIs can describe the greenness of vegetation, the effects of environmental stress on crop growth and development are seldom evaluated adequately [21,25]. Furthermore, although partial yield variability can be captured by VIs, a considerable amount of these variabilities are hardly sufficiently explained [4].
Maize is a C4 crop that is more sensitive to environmental changes (i.e., temperature and rainfall) than other crops [26], and it has been widely used for yield estimation [27]. Environmental variables, such as temperature and precipitation, and soil data [4] have been previously integrated into VIs. Some studies have proven that combining multisource remote sensing, fluorescence and environmental data can improve yield prediction [7,28,29]. Moreover, temperature and rainfall across different periods have varying impacts on yield [30]. Despite these findings, the complex and nonlinear effects of environmental factors on crop growth [31] entail great uncertainties for yield prediction [30].
Many features can be used in yield estimation, but only a few of them have a direct impact [9]. A study evaluating remote sensing (climate and soil) data found that the green chlorophyll index, LST and temperature are sensitive to yield estimation [10]. Other studies evaluating environmental data (climate and soil data), multiple satellite data (VIs and SIF) and surface temperature data, among others, determined the importance of topography, EVI, soil hydraulic and nutrient indexes of yield prediction; however, optical-based VIs share somewhat similar information and hence can hardly enhance EVI-related findings [32]. Past studies also verified the limitations of spectral indexes, and knowing which index is more effective for crop yield estimation is seldom discussed [7,25]. Pigment, nutrient element and biomass indexes are rarely used in crop yield estimation [33,34], despite their close relation to yield estimation. The N partitioning index at anthesis, which can describe the proportion of aboveground N of crop composition at flowering, is closely related to crop nitrogen uptake; they are used in a few yield estimation studies [35,36]. Indexes reflecting chlorophyll content were used in cotton yield prediction [37]. Incidentally, only a few studies have systematically evaluated the sensitivity of spectral indexes and climate factors [10,32].
Different periods affect yield estimation to varying degrees [38]. In many yield estimation studies, indexes for the whole-growth period are commonly used [18,39]. The life cycle of maize consists of nutrition and reproduction. During the vegetative growth period, stems and leaves grow vigorously, and nitrogen accumulates continuously. During the reproductive period, the crop accumulates more nutrients, and more nutrients are transferred to the grain [40]. These two periods vary in their impact on crop yield. For example, the period (from silking to dough, i.e., from nutritional development to reproductive development) is a critical period for maize as it is most sensitive to environmental changes [20]. In recent studies, indexes representing different growth periods have been used to estimate crop yield [20,41,42]. These studies have used regreening-to-filling period indexes for yield estimation, and they have achieved high prediction accuracy [33]. In summary, the sensitivity of indexes for different growth periods need to be further explored. According to the literature, time series data have good yield estimation potential [7,17,43]. Temporal aggregation data are usually assessed using coarse-to-detailed time scales in yield estimation studies [44].
Currently, mainstream yield prediction methods include physical simulation models and machine learning models [10] among which representative crop models include those developed by the international maize and wheat improvement center (CIMMYT) [45]. The CIMMYT recommends the use of models to monitor and evaluate the growth and development of wheat and maize [46,47]. CIMMYT-based models can capture primary crop growth processes and genotype-environment-management interactions [48]. In most models, knowledge from physiological studies is an important element, such as the Crop growth model, which incorporates knowledge derived from genetic information [46]. The strong reliance on knowledge can be explained by large-scale yield estimation being limited by the difficulty of developing parameters for crop varieties and management practices [3]. In addition, some crop models oversimplify or obscure real-life processes, such as high temperature and drought stress [49]. Although machine learning can capture the nonlinear relationships between yield estimation and different parameters [50] and crop yield characteristics from time series data [28,43], relevant mechanisms are difficult to reveal due to the technology’s black box problem [51]. An effective solution is to acquire feature knowledge for yield estimation through exploration.
In this study, the influencing factors (i.e., climate, soil, genotype and management factors) of crop yield were considered to overcome the shortcomings of current estimation studies. The whole-growth period was divided into two subperiods, namely the vegetative growth period and reproductive growth period. The sensitivity of indexes for water content, pigment content, nutrients, biomass and climate factors and the effect of temporal aggregation data on yield estimation were systematically assessed. Then a novel method for yield estimation was developed by integrating multiple spectral indexes and temporal aggregation data. Finally, the proposed method was used to estimate maize yield for a given period (2015–2019). The main objectives of this research were to assess the sensitivity of biophysical variables (i.e., pigment content, nitrogen content and canopy water content), to assess the effect of temporal aggregation data on yield estimation and to explore how to realize national maize yield estimation by integrating feature knowledge related to multiple spectral indexes and temporal aggregation data.

2. Materials and Methods

2.1. Study Region

The global total maize yield data were obtained from the database of the Food and Agriculture Organization of the United Nations (FAOSTAT) (https://www.fao.org/faostat/zh/#data/QCL accessed on 18 November 2022) from which the proportions of total maize yields of different countries were calculated. According to the data, maize yield in China accounts for more than one-fourth (28%) of the global maize yield (Figure S1 of Supplementary Materials). Therefore, China was selected as the study area. The total grain yield in China reached 65 × 107 tons in 2015, while the total maize yield reached 26.5 × 10⁷ tons in the same year (Figure S2 in Supplementary Materials). In terms of trends, the increase in total maize yield before 2015 was rapid, whereas the increase after 2015 was slow. Thus, the study period between 2015 and 2019 was selected. The nine agricultural regions in China are shown in Figure 1a. Maize is mainly distributed in the Northeast China Plain, North China Plain, Inner Mongolia, Ningxia, mountainous areas in Southwest China and hilly areas in South China (http://www.stats.gov.cn accessed on 18 November 2022). The planting mode of maize in the country is complex as it involves single-season maize cropping, winter wheat-maize rotation and rice-maize rotation, among others [52]. In this study, the yield distribution per unit area in 2018 was mapped, based on statistical data (Figure 1b). In most provinces of the Northeast China Plain and North China Plain and the central region of Yunnan, the yield range was between 6000 and 8000 kg/ha. In the northern regions of Gansu and Xinjiang, the yield exceeded 8000 kg/ha. In Ningxia, Hubei, Guizhou and Guangxi provinces, the yield was lower than 5000 kg/ha.

2.2. Materials

2.2.1. Remote Sensing and Climate Data

The satellite data used in this study were obtained from MODIS, EAR5 and TerraClimate. MODIS includes MOD09A1 and MYD11A2, while MOD09A1 provides eight-day maximum composite images with spatial resolutions of 500 m. The spectral indexes were extracted from MOD09A1, and the climate data were extracted from MYD11A2, EAR5 and TerraClimate. VIs (i.e., NDVI) are often used to estimate the yield, but this approach is insufficient. The influencing factors of yield include climate, soil, genotype and management. In this study, the indexes for the aforementioned factors were calculated using MODIS data, which were obtained from the Google Earth Engine (GEE) platform. The spectral index used in the study is presented in Table 1, while its detailed description is given in Supplementary Materials. The relationships of the indexes and the influencing factors from the perspective of research methodology are presented in Section 2.3. MYD11A2 provides 1 km of satellite data. LSTday and LSTnight, which can capture heat stress and water stress, especially during the extremely dry growth seasons, were selected in this study [53]. The images were preprocessed for declouding, desnowing and interpolation. Tmean, Tmin, Tmax and total precipitation were obtained from the monthly and daily data of EAR5. Monthly evapotranspiration, radiation, soil moisture and vapor pressure deficit (VPD) data were obtained from TerraClimate. The climate factors are listed in Table 2. GEE provides information on the collection, processing and analysis of remote sensing data sources [54]; hence, the preprocessing and index calculation in this study were completed on the GEE platform (Supplementary Materials for the code link).

2.2.2. Statistical Data

County-level maize yield statistics from 2015 to 2019 were obtained from the databases of the National Bureau of Statistics (www.stats.gov.cn accessed on 18 November 2022) and China Economic and Social Data Research Platform (http://data.cnki.net/Yearbook/ accessed on 18 November 2022). The outliers were preprocessed using two methods. First, yield data exceeding the average value plus/minus twice the standard deviation were isolated. Second, by referring to box diagrams and histograms, a small number of outliers were removed. Land cover or crop maps are widely used in extant studies, whereas annual dynamic crop distribution maps are rarely used [17]. In this study, the maize distribution data from 2015 to 2019 were derived via the maize mapping method of the two-band EVI (EVI2)/NMDI increase/decrease ratio index for the peak growth period [55]. The global total maize yield data were downloaded from FAOSTAT (https://www.fao.org/faostat/zh/#data/QCL accessed on 18 November 2022).

2.3. Method

This study developed a remote sensing method for maize yield estimation by integrating multiple spectral indexes and temporal aggregation data. The three main parts of the method are importance assessment, temporal aggregation assessment and maize yield estimation, as shown in Figure 2. At present, the commonly applied VIs are being widely used in yield estimation. The main influencing factors of yield are climate, soil, genotype and management. Clearly, commonly applied VIs are insufficient for yield estimation. In this study, the indexes closely related to yield, such as moisture content, pigment content, biomass, nitrogen content and climate factors, were calculated. These indexes could also either directly or indirectly reflect the climate, soil, genotype and management factors. The details of each factor are as follows: (1) climate: temperature, precipitation and phenology; (2) soil: moisture and nutrients (nutrient elements); (3) soil in relation to management: nitrogen content in nutrient elements (fertilization) and soil water content (irrigation); and (4) climate and genotype: chlorophyll content, biomass and plant water content, among other aspects of plant physiology.
The overall strategy of this study can be summarized as follows. First, the whole-growth period was subdivided into vegetative and reproductive growth periods, and the sensitivity of indexes for climate, soil, genotype and management was systematically assessed using random forest (RF) models. Second, the effect of temporal aggregation data on yield estimation was evaluated using the eight-day time series data of the whole-growth period and the two specific growth periods (vegetative growth and reproductive growth). Finally, the process of integrating multiple spectral indexes and temporal aggregation data, with the aim of achieving national-scale maize yield estimation at the county level, was explored.

2.3.1. Phenological Period Calculation

The whole-growth period was further divided into the vegetative growth period and the reproductive growth period to distinguish their distinct effects on crop yield estimation. For the calculations, this study focused on the period when the third leaf had fully expanded (V3 period), the heading date (HE) and the maturity period (MA) of maize [5]. The period from V3 to HE was taken as the vegetative growth period, while the period from HE to MA was taken as the reproductive growth period. In the V3, HE and MA calculations, the nine agricultural regions in China and the mean value of the EVI2 time series [56] of each agricultural region were also considered. The EVI2 time series was masked using the maize data layer, and the mean phenological period of each agricultural region was determined. On this basis, the V3, HE and MA values of each agricultural region were obtained.

2.3.2. RF Models and Importance Assessment

The principle of RFs [57] lies in the use of “tree predictors” in which all trees in the forest have the same distribution. An RF model first trains a large number of decision trees and then performs estimation by averaging all individual trees or carrying out votes. Randomness is introduced, and the best trees are searched according to the random features. As the number of trees increases, the generalization error of the forest converges to a limit. Bagging is used to reduce variance and overfitting [57]. In RF, the number of parameters for leaves, forest size and tree roots can be adjusted.
In this study, RF [58] was used for importance analysis. The calculation strategy can be summarized as follows. First, RFs are used for weighting. Let X be a feature, and its importance is calculated as X = Σ (errOOB2 − errOOB1)/N, where N refers to N trees in the forest, and ErrOOB1 represents the error of out-of-pocket data. A part of the data is selected for training the decision tree through repeated sampling, while approximately one-third of the remaining data is used for performance evaluation and calculation of the prediction error rate of the model. Noise interference is randomly added to the X features of all samples (out-of-bag data), and the error of the out-of-bag data is recalculated and recorded as errOOB2. If errOOB2 appears after the addition of random noise, then X has a great impact on the prediction results of the samples.

2.3.3. Index Importance Assessment

VIs (17), leaf water content (8), pigment content (12), nutrient elements (3), biomass (3) and climate factors (10), totaling 53 indexes, were identified (Table 1 and Table 2). Then the sensitivity of the indexes was evaluated. The strategy can be summarized as follows. The mean values of spectral indexes at the pixel level were calculated for the whole-growth period (V3-MA) in 2018, followed by the mean value of each index for each county. The sensitivity of the 53 indexes was evaluated via the RF method, and the indexes most sensitive to yield estimation for each category were determined.
Knowledge about the sensitivity of spectral indexes is limited. In this study, the most important spectral indexes (i.e., derived from the indexes most sensitive to yield estimation) were further identified by combining relevant indexes (Equations (1) and (2)). We designed the combined indexes aimed at: first, the original indexes could reflect some information. The combined indexes may reflect the information from different indexes, thus avoiding the use of more complex indexes and eliminating data redundancy. Second, compared to single index, the combined indexes may enhance the sensitivity to yield. A schematic of the calculation design is shown in Figure 3.
X = A B A + B
X = ( A B ) A
In the equation, A, B represents different indexes. X represents the combined indexes.
Finally, the sensitivity of the spectral indexes, combined indexes and climate factors was assessed via RF to obtain the indexes most sensitive to yield estimation for each category.

2.3.4. Temporal Aggregation Assessment

In most yield estimation studies, phenology is investigated in relation to the whole-growth period. However, the effects may differ considerably for the vegetative and reproductive growth periods, and transgressions are even noticeable in the time series data of crop yield [20,41,59]. Aimed at further exploring the effect of temporal aggregation data on yield estimation, additional indexes (excluding those mentioned in Section 2.3.3) for yield estimation were calculated (Table 3). First, the mean values of spectral indexes (11), climate factors (10) and combined indexes (7) were calculated according to the two growth periods (i.e., vegetative and reproductive) of maize from 2015 to 2019. The mean values of the indexes for each county were also computed. Then the mean values of the eight-day time series data for the spectral indexes (11), meteorological factors (6) and combined indexes (7) were calculated according to the two aforementioned growth periods of maize from 2015 to 2019 (excluding 2016). During calculations, we found that the values of some indexes were missing due to the influence of image cloudiness and shadows; the maize phenology data of some counties somewhat deviated from the actual maize phenology; and the eight-day time series data in 2016 were incomplete. TerraClimate uses monthly data; thus, the eight-day time series data of evapotranspiration, shortwave radiation, soil moisture and VPD could not be computed.
Finally, the best growth period in relation to yield estimation was determined. The impact of temporal aggregation data was assessed with respect to the whole-growth period, the two growth periods (vegetative and reproductive) and the eight-day time series.

2.3.5. Maize Yield Estimation

In this study, RFs were used to evaluate maize yield according to the whole-growth period, the two growth periods (vegetative and reproductive) and the eight-day time series. By evaluating the effect of temporal aggregation data on yield estimation, we obtained the phenological period most sensitive to yield estimation. Here, the phenological period, which is the growth period most sensitive to yield estimation, was used to estimate maize yield. In addition, the process of how to integrate multiple spectral indexes and temporal aggregation data as a means of achieving maize yield estimation was explored. The strategy can be summarized as follows: First, 56 indexes for the nutritional/vegetative and reproductive growth periods were ranked in terms of importance and then analyzed. Second, the index most sensitive to yield estimation was taken as the basic index. On the basis of the highest to lowest importance, two indexes were integrated into the most sensitive indexes for yield estimation, and the yield estimation results denoted by R2 were recorded. Finally, the process of how to integrate multiple spectral indexes and temporal aggregation data to obtain the best yield estimates was explored, and the reasons for the influence of yield on spatial patterns were identified.

2.3.6. Model Evaluation Metrics

The maize yield estimated results were evaluated in two ways. First, 70% of the annual yield data was randomly selected as the training samples, and the remaining 30% was used as the test samples. The coefficient of determination (R2) and root mean square error (RMSE) was used for evaluation. Then, the leave-one-year-out-validation schedule was used to evaluate the model’s accuracy [60]. The difference between the observed and predicted yield distributions and the overestimations/underestimations was analyzed.

3. Results

3.1. Index Importance Assessment Results

3.1.1. Importance Ranking of the Spectral Index

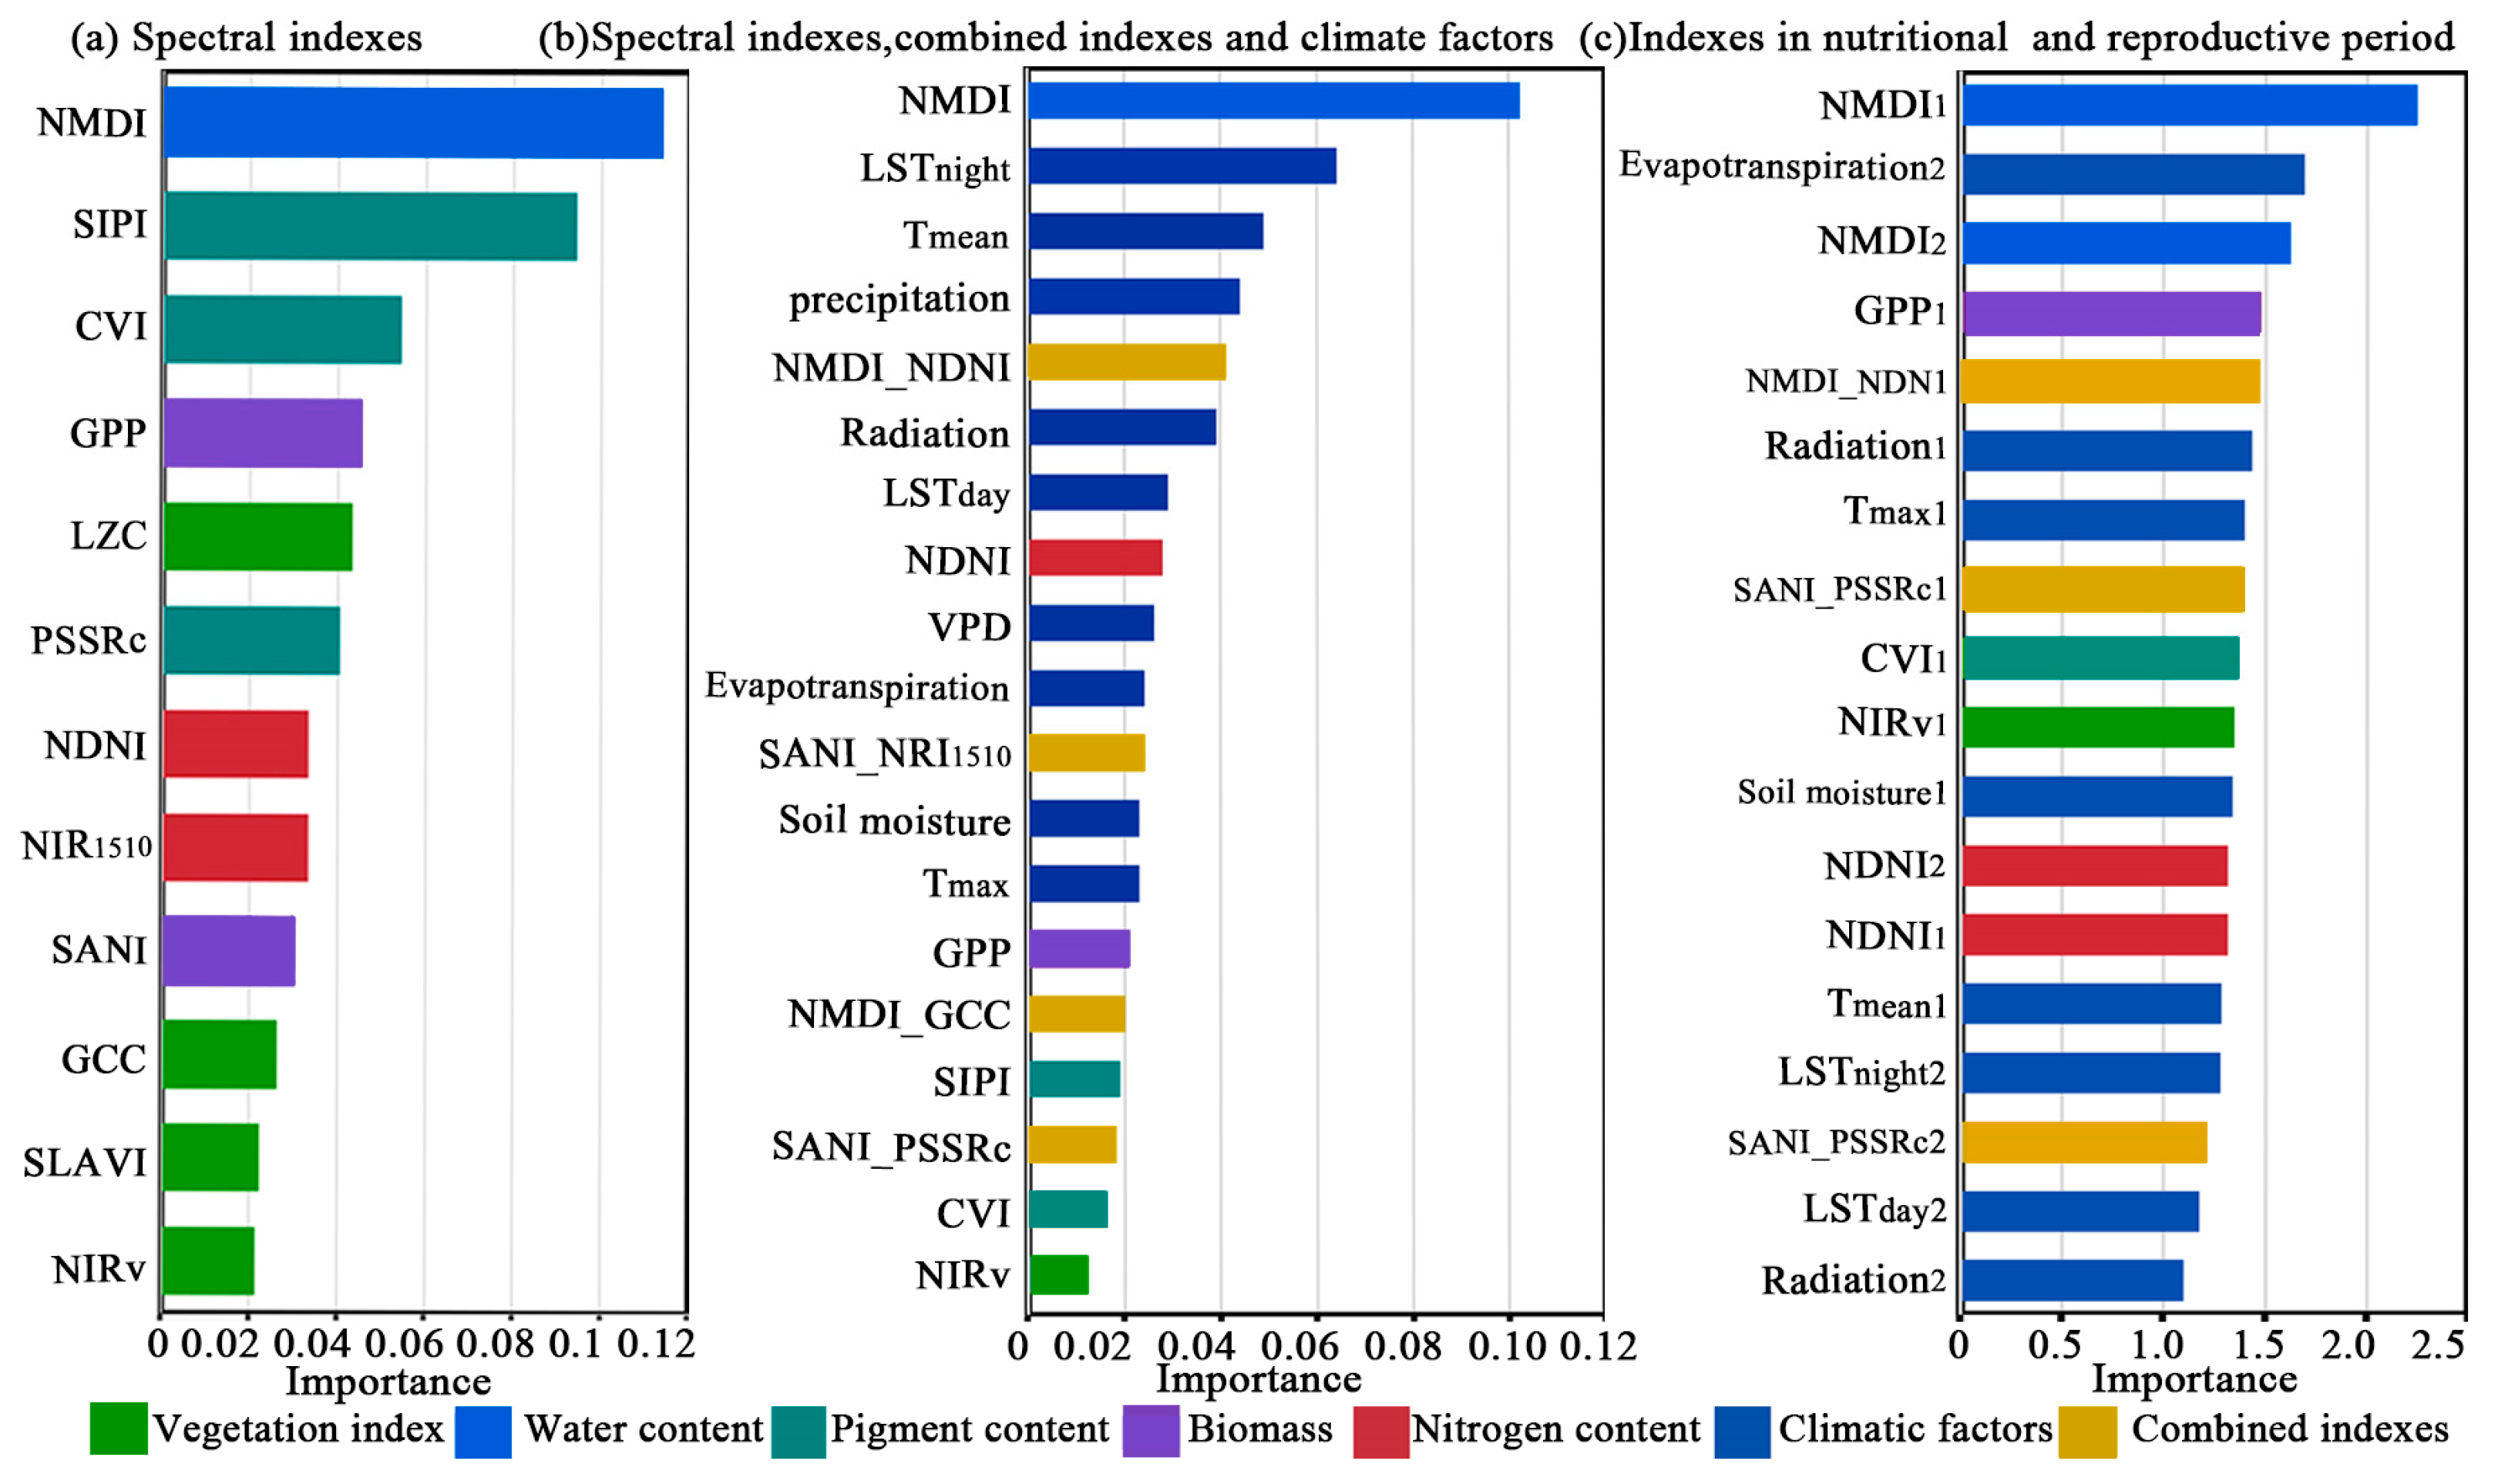
First, the mean values of the spectral indexes for the whole-growth period in 2018 were calculated, and the mean values of each pixel for each county were counted. Then importance analysis was performed using RF, and certain spectral indexes sensitive to yield estimation were initially screened. Figure 4a shows the results of the importance rankings of the spectral indexes. The results show that the NMDI (water content) is the index most sensitive to maize yield estimation, whereas NIRv, a commonly used VI, ranks poorly. Among the indexes for pigment content, the structure insensitive pigment index (SIPI) [61] and chlorophyll vegetation index (CVI) [62] are sensitive to the estimation of maize yield. Among the indexes for nutrient content, NDNI and nitrogen index (NRI1510) [63] are the ones most sensitive to yield estimation. Among the indexes for biomass, GPP is the most sensitive index, indicating its great potential for yield estimation [64].

3.1.2. Importance Ranking of Multiple Indexes

The spectral indexes, combined indexes and climate factors were jointly evaluated in terms of importance ranking, with NMDI outranking the other indexes (Figure 4b). Among the nutrients for N content, NDNI is the index most sensitive to yield estimation. After incorporating the climate factors, we found that some of them were more effective than the spectral indexes in estimating maize yield. NMDI, LSTnight, Tmean and precipitation are part of the top four rankings, indicating that temperature is a sensitive index for estimating yield. Shortwave radiation ranks sixth, suggesting that radiation is also sensitive to yield estimation. The combined indexes designed in this study, particularly NMDI_NDNI (fifth rank), SANI_PSSRc, SANI_NRI1510 and NMDI_GCC, obtained better rankings than the original spectral indexes (i.e., before combination). On this basis, the spectral indexes, combined indexes and climate factors, which were more critical than the VI (i.e., NIRv), were selected, totaling 28 indexes.

3.1.3. Effect of Temporal Aggregation Data on Maize Yield Estimation

The effect of temporal aggregation data on yield estimation was assessed according to the whole-growth period, the two growth periods (nutritional/vegetative and reproductive) and the eight-day time series (Figure 4c). The assessment can be summarized as follows. First, 893 training samples and 243 test samples were selected to estimate maize yield by using the indexes for the whole-growth period in 2018. Second, 3274 training samples and 772 test samples were used to estimate maize yield by using the indexes for the vegetative and reproductive growth periods from 2015 to 2019 (except 2016). Third, maize yield was estimated using the eight-day time series covering 2015 to 2019 (except 2016), and the numbers of training and test samples were 3223 and 3691, respectively. During the assessment, we found that some indexes of the eight-day time series were missing, and some sample data needed to be excluded. The coefficient of determination (R2) values were 0.58 for the whole-growth period, 0.7175 for the vegetative and reproductive growth periods and 0.6901 for the eight-day time series. A comparison of the results indicates that the indexes for the vegetative and reproductive growth periods have great potential for yield estimation.
Then the sensitivity of the indexes for vegetative and reproductive growth periods was evaluated. In the evaluation of the indexes for the whole-growth period (Section 3.1.2), 28 indexes were preselected, and 56 indexes for the vegetative and reproductive growth periods from 2015 to 2019 were calculated. Figure 4c shows the importance ranking of the indexes for the vegetative and reproductive growth periods. The following indexes are effective in yield estimation: NMDI, GPP, CVI and NDNI (vegetative growth period); radiation, Tmax and soil moisture (soil); NMDI_NDNI and SANI_PSSRc (combined indexes); NMDI and NDNI (reproductive growth period); and evaporation, LSTnight, LSTday and radiation (climate factors). NMDI_NDNI has a higher sensitivity than NDNI. In addition, the R2 of maize yield estimation based on indexes of the vegetative growth period (R2 = 0.73) was higher than that of the reproductive growth period (R2 = 0.68).
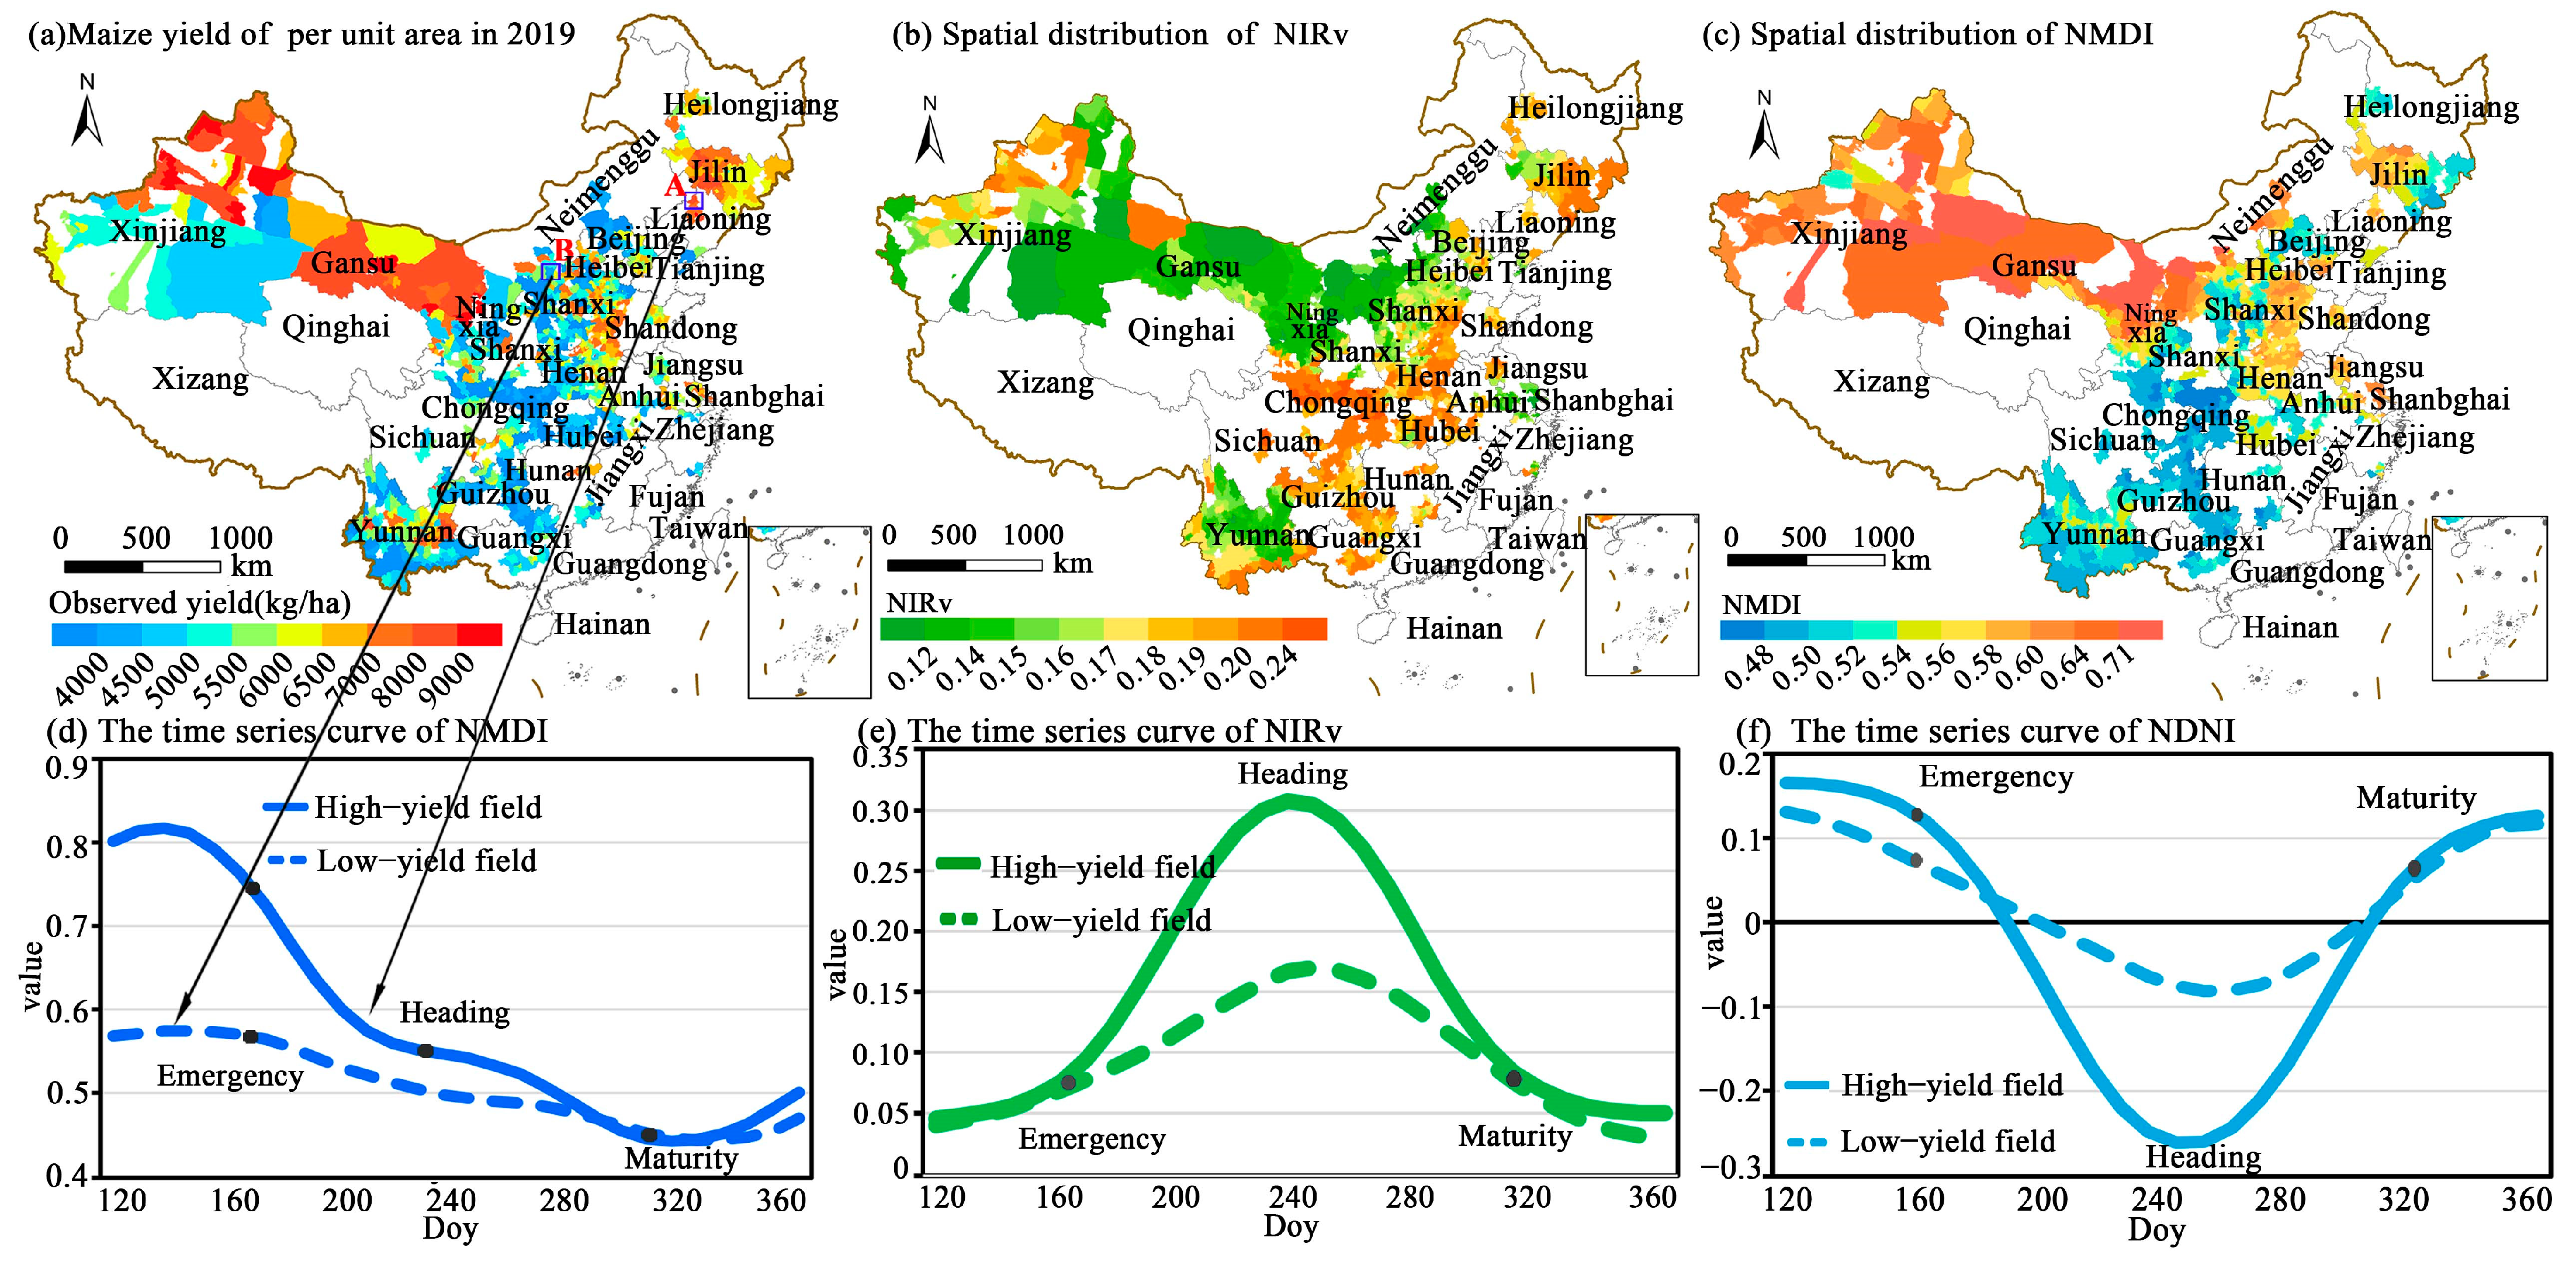
The relationship between multiple spectral indexes and yield estimation was explored by mapping the spatial distribution of maize yield per unit area and NIRv and NMDI in 2019. The spatial distribution of NMDI (Figure 5c) was consistent with that of yield estimation in general, whereas the spatial distribution of NIRv (Figure 5b) and yield estimation differed in some regions, such as Ningxia, Shanxi and Yunnan. Then the time series curves of the multiple spectral indexes of maize in high- and low-yield fields in 2019 are also plotted in Figure 5; the other time series curves are shown in Figure S3 in Supplementary Materials. The responses of biophysical variables to maize yield estimation can be summarized in three forms: declining trend (NMDI; Figure 5d); increasing and then decreasing trend (CVI; Figure 5e); and decreasing and then increasing trend (NDNI; Figure 5f). The time series signals of the high-yield field are higher than those of the low-yield field. The water content, pigment content, biomass and nutrient element features increased during the vegetative growth period of maize and decreased during the reproductive growth period. The findings indicate that feature knowledge is an important aspect of maize yield estimation.

3.2. Maize Yield Estimation Results

Maize Yield Estimation by Integrating Different Indexes
At present, most yield estimation studies are conducted at the provincial level. In this work, by adopting the linear fitting method, the NMDI and NDVI of the whole-growth period in 2018 were used to estimate the yield at the provincial level. The R2, obtained by only using NMDI (Figure 6a), was 0.49, whereas that obtained using only NDVI was only 0.23. At the county scale, the R2 obtained using only NMDI was 0.22, indicating the difficulty of conducting yield estimation at the county level. This finding may be attributed to differences in technology, arable land management practices, solar and thermal resources, the uneven distribution of water resources and climate change [5]. Nonetheless, the nutritional/vegetative and reproductive growth periods have great potential for yield estimation. When only NMDI was used to estimate the yield, the R2 increased to 0.41 (Figure 6b). Regardless of the results, the proposed strategy can improve the accuracy of yield estimation at the county level, but it is more appropriate at the provincial level. In terms of the yield estimation in China from 2015 to 2019, the R2 reached 0.8.
Our strategy for maize yield estimation can be summarized as follows. First, the changes in estimation accuracy with an increasing number of indexes were explored. In this study, 4120 training samples and 975 test samples were randomly selected based on the indexes of the vegetative and reproductive growth periods from 2015 to 2019, and maize yields were further estimated by integrating multiple spectral indexes and temporal aggregation data. Figure 7a shows the yield estimation accuracy. As previously discussed in Section 3.1.3, NMDI1 (i.e., the NMDI of the vegetative growth period) ranks first in terms of importance, as shown in Figure 4c; therefore, it was used as the benchmark index. Then, two other indexes were incorporated in series (i.e., from high to low according to importance), and the R2 was recorded. Increasing the number of indexes to 20 (i.e., the top 20 indexes based on importance) improved the R2 (0.78; Figure 7b). Furthermore, R2 essentially remained stable even when the number of indexes was increased. In this study, the maximum R2 was 0.8.
Second, the 2019 data were taken as an example for exploration, and NMDI1 was used as the benchmark index for yield estimation. Maps were built to easily view the relevant results, including a scatter map of observed and predicted yields (Figure 8a,b), spatial distribution map of the indexes (Figure 9a,c) and a difference map of observed and predicted yields (Figure 9b,d). Furthermore, the change rule of overestimation/underestimation (i.e., from dispersion to aggregation), with an increasing number of multiple spectral indexes of the vegetative and reproductive growth periods, was explored. The aforementioned strategy allowed for the influencing factors and the spatial pattern of yield estimation to be gradually revealed.
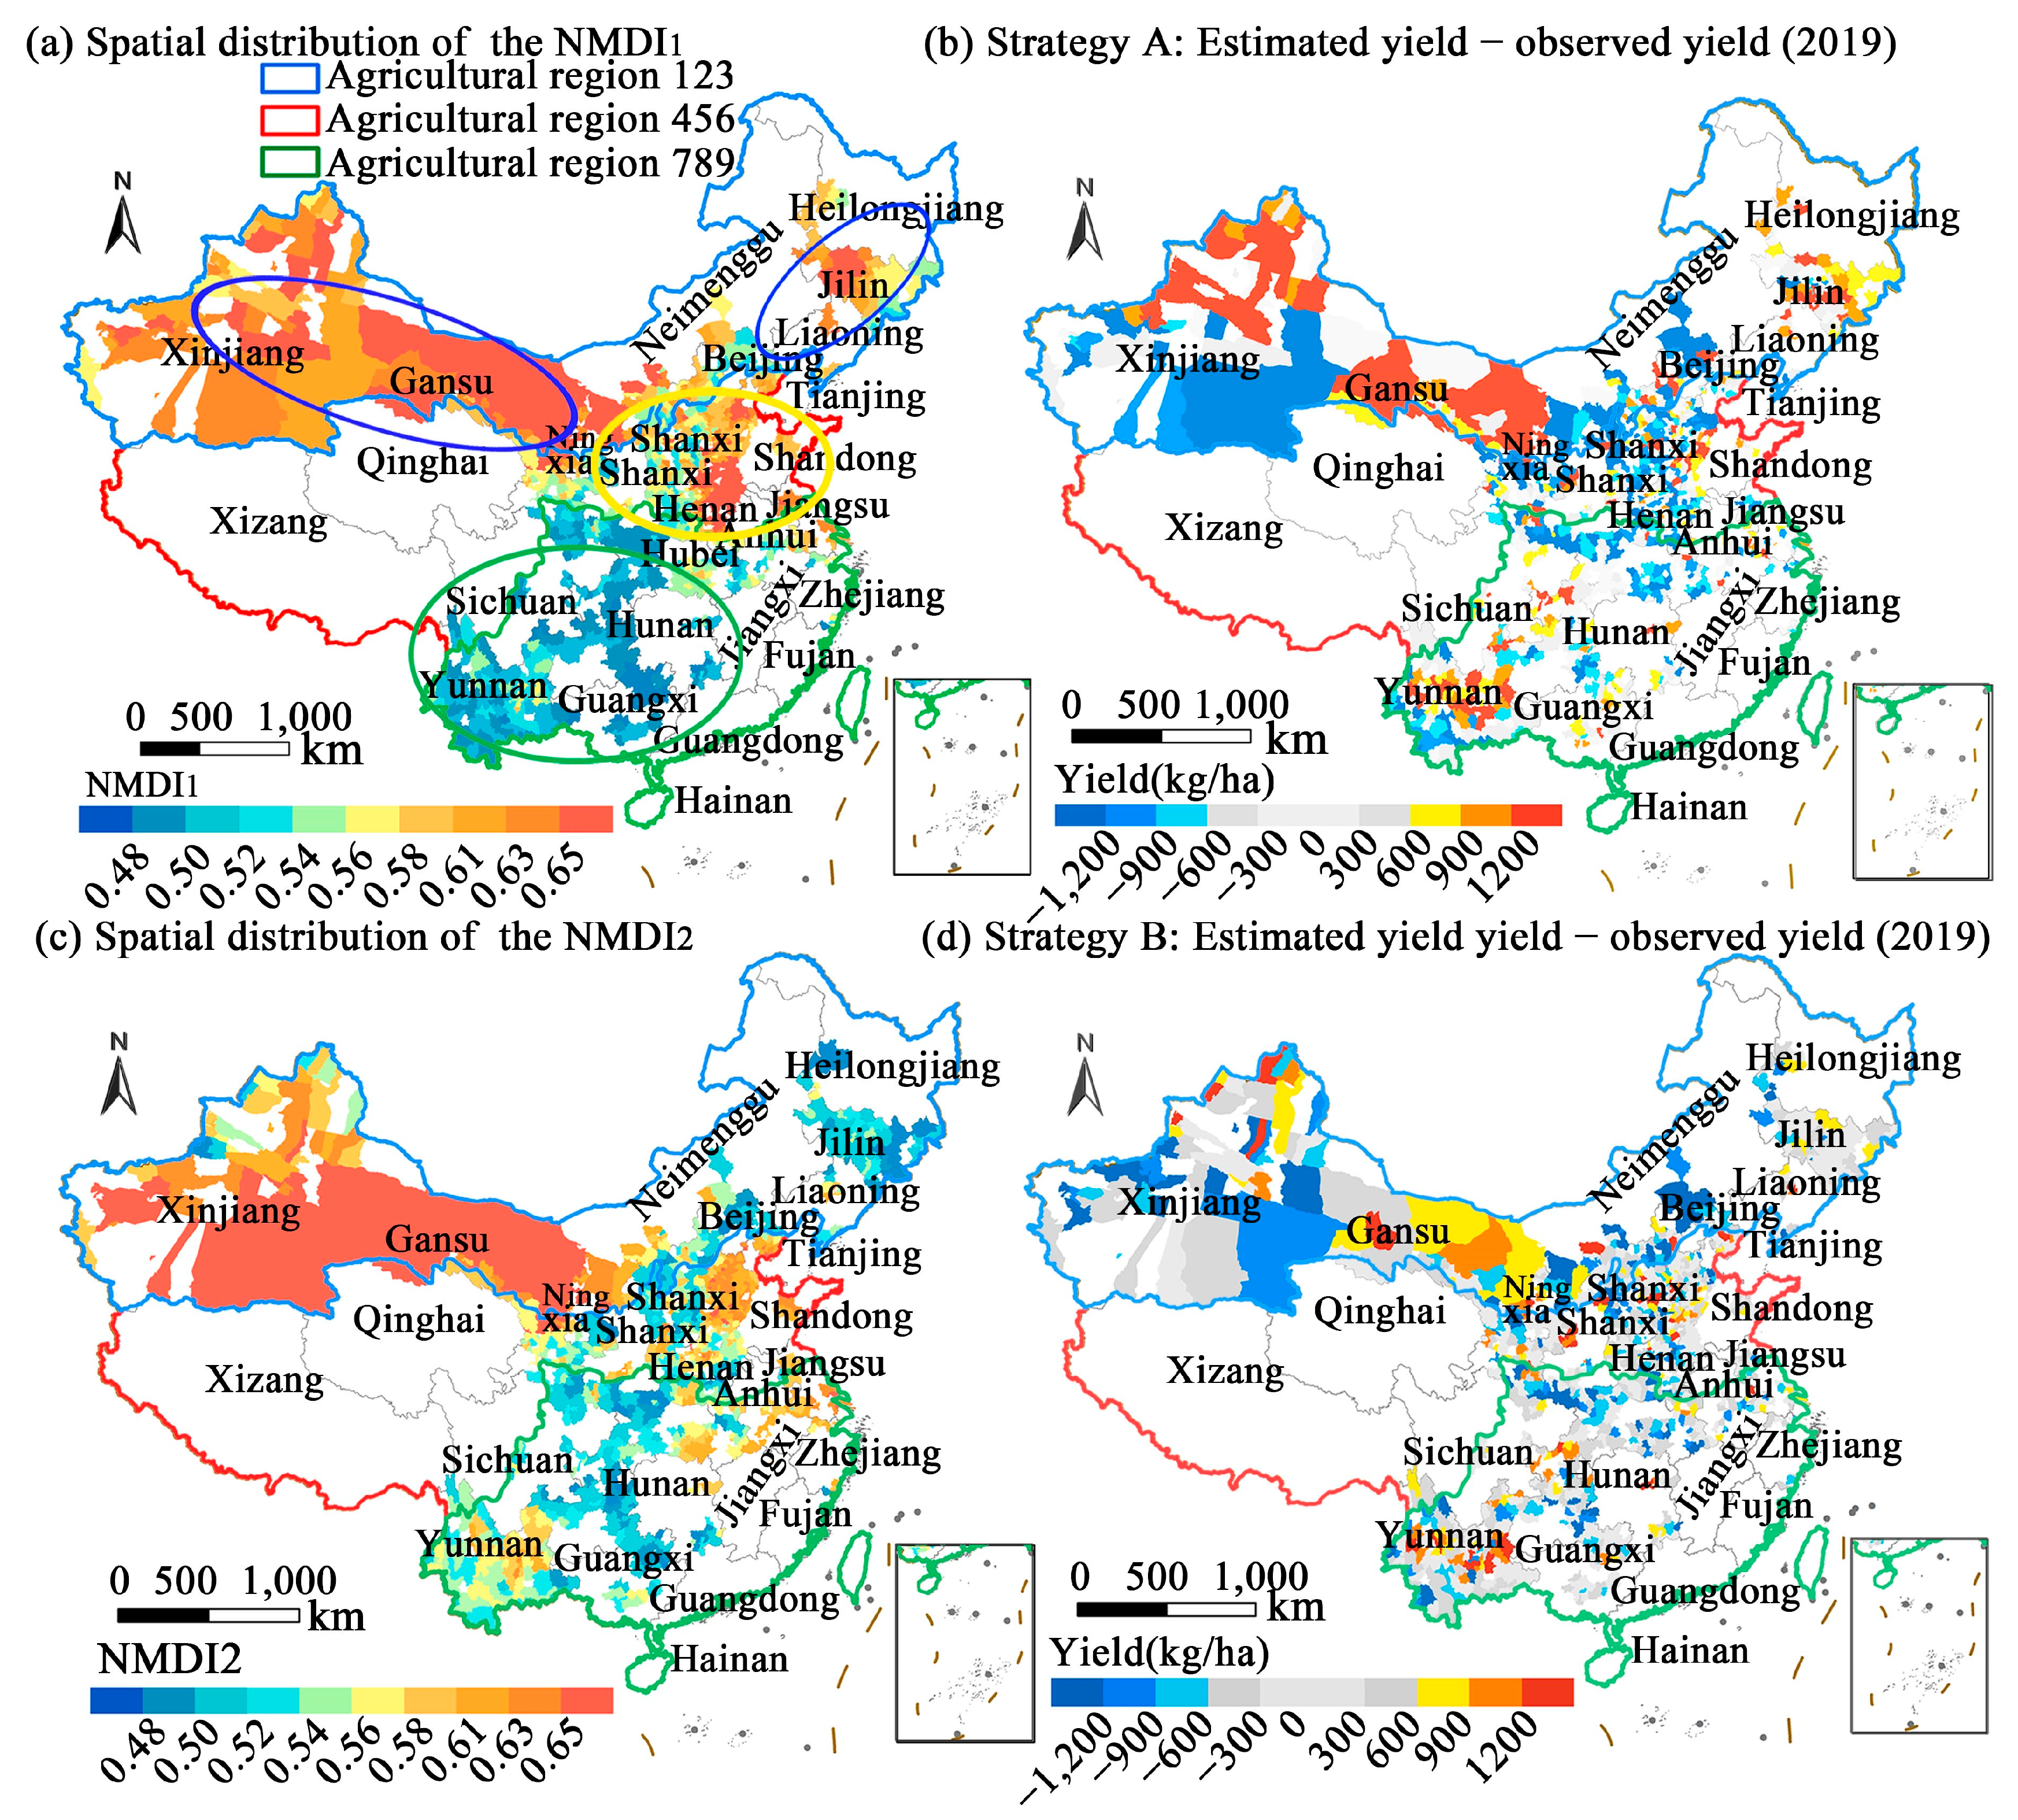
In strategy A, NMDI1 was used to estimate the yield (Figure 7a). The coefficient of determination R2 was 0.2837; RMSE = 2583.5 kg/ha; and the overestimation/underestimation values were relatively dispersed (Figure 8a). The spatial distribution of NMDI1 (Figure 9a) was consistent with the spatial distribution of yield estimation (Figure 5a). In Xinjiang and Gansu, the NMDI is greater than 0.65; the soil is dry; and the vegetation water content is low. Maize production in this region is mainly distributed in oasis and basin areas. In densely vegetated areas, NMDI increases almost linearly with leaf water content [65]. The North China Plain and Northeast China Plain have a higher NMDI, indicating adequate water content, which is closely related to yield. According to the spatial distribution of the differences between observed and predicted yields (Figure 9b), overestimations are mainly distributed in most counties of Xinjiang, Gansu and Yunnan, whereas underestimations are mainly distributed in the southwestern counties of Xinjiang and the North China Plain, including Shanxi, Hebei, Henan and Hubei.
In strategy B, evapotranspiration, NMDI2 and GPP1 were integrated into NMDI1. The R2 increased from 0.28 to 0.62; RMSE decreased from 2583.5 kg/ha to 950.04 kg/ha (Figure 8b). Overestimation and underestimation decreased, indicating the importance of the aforementioned indexes to yield estimation. Figure 9c further shows that NMDI2 is closely related to yield estimation in terms of spatial features, and the yield estimation accuracy can be further improved by using indexes for the reproductive growth period. The difference map between the observed and predicted yields (Figure 9d) shows a decreasing trend of overestimation and underestimation. On this basis, indexes for pigment and nitrogen content were further integrated to improve yield estimation accuracy. The R2 reached 0.78 (RMSE = 747.15 kg/ha) when the top 20 most important indexes were used. When the number of indexes was further increased, R2 gradually became stable.
Most studies have used multisource remote sensing (i.e., spatial and temporal data) through deep learning. The R2 in China and the United States at the county level were reportedly in the range of 0.75 to 0.78 [7,10,66]. In this study, maize yield estimation involved the integration of soil, genotype and management indexes, achieving R2 in the range of 0.78 to 0.8. More importantly, despite the missing or incomplete soil and geographic space data, our results were similar to those obtained by other studies, hence proving the effectiveness of the proposed method. Detailed discussions are presented in Supplementary Materials.

Maize Yield Spatial Distribution

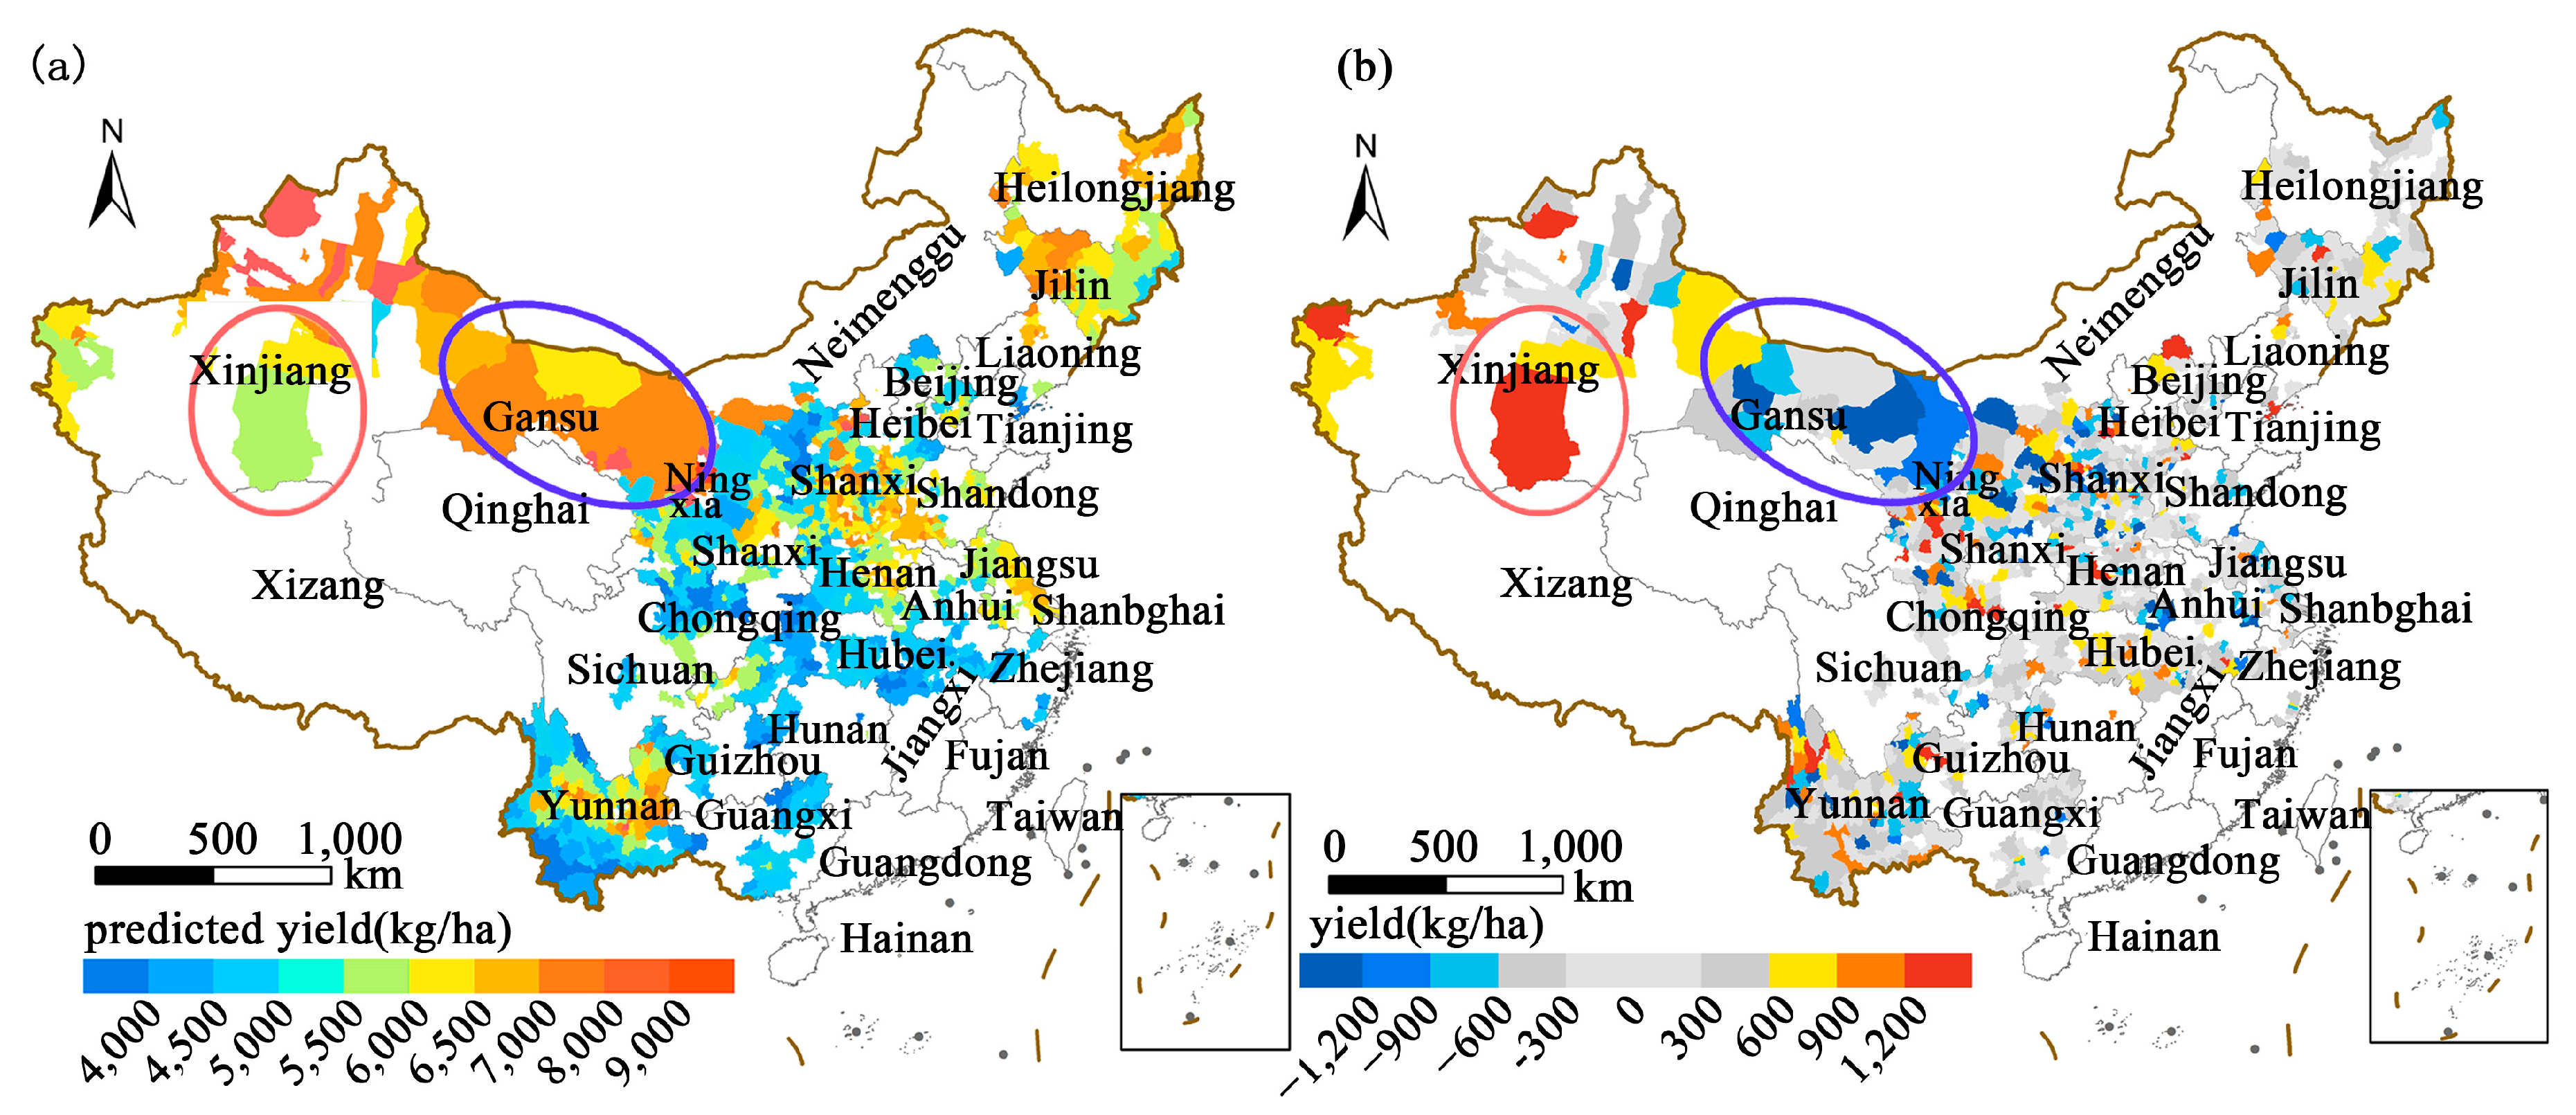
The top 20 most important indexes were used to estimate the maize yield between 2015 and 2019. The best estimation results were attained by the indexes for nutritional/vegetative and reproductive growth periods. Subsequently, by taking 2018 as an example, the spatial distribution of yield and the influencing factors of yield were analyzed, and the spatial distribution of the difference between observed and estimated yields in 2015, 2016, 2017 and 2019 was plotted (Figure S4 in Supplementary Materials). Figure 10a verifies the relatively high maize yield in counties in the northern parts of China and the low maize yield in counties in the central and southern regions, which is consistent with the study of Zhang et al. [7]. The maize yields in some counties of Ningxia, Gansu, Inner Mongolia and northern Xinjiang reached 8000 kg/ha and even higher. Although cultivation areas are small, maize is grown at relatively low altitudes in areas with suitable temperature and sufficient water supply, hence the high maize yields. In Heilongjiang, Jilin and Liaoning in the northeast; in Shanxi, Shandong, Henan and Jiangsu in the north; and in Yunnan, the maize yields are relatively high, reaching 6000 kg/ha. By contrast, maize yields are lower in the counties of Hubei, Hunan, Guizhou and Guangxi, with less than 5000 kg/ha and even less than 4000 kg/ha in other counties. The distribution of maize in these areas is dispersed.
The spatial distribution patterns of overestimation and underestimation are shown in Figure 10b. The difference between the observed and predicted yields in most counties, including those in the North and Northeast China Plains and the southern region, is negligible (~600 kg/ha). Overestimation was mainly distributed in the counties of Xinjiang, Ningxia and Shaanxi. Particularly in Xinjiang, the overestimation was between 600 and 1200 kg/ha. In the western counties of Gansu and Ningxia, the maize yield was underestimated by 600–900 kg/ha, even reaching 1200 kg/ha. In some counties of Shandong, Shanxi and Yunnan on the North China Plain, the maize yield was underestimated by 600–900 kg/ha.

4. Discussion

4.1. Sensitivity of Different Dimensional Indexes

VIs are the indexes mainly used in yield estimation. Although VIs can depict the greenness of vegetation, they cannot adequately capture the environmental stresses on crop growth and development. Furthermore, although VIs can capture yield variability, their wide estimation results are difficult to explain. In this study, the indexes most sensitive to yield estimation were determined based on climate, soil, genotype and management indexes. Evaluations of the indexes for the whole-growth period (Figure 4b) indicate that NMDI is the most important index for yield estimation, further suggesting precise data from using this index in maize mapping [55]. Previous studies have shown that water-related indexes are sensitive to maize yield estimation [7], which may be explained by maize being a crop with high water demand [67]. The chlorophyll index also has great potential in estimating yield [68]. In this study, SIPI, CVI and PSSRc (pigment content indexes) and NRI1510 and NDNI (nitrogen content indexes) were all sensitive to yield estimation. Previous studies have also shown that nitrogen content has great yield estimation potential, with the nitrogen planar domain index stably estimating aboveground biomass [69]. The use of NRI1510 is effective in combining the advantages of nitrogen and chlorophyll absorption characteristics [65].

4.2. Sensitivity of the Nutritional/Vegetative Growth and Reproductive Growth Indexes

In this study, the sensitivity of the indexes varied considerably across the different growth periods. For the vegetative growth period, the indexes most sensitive to yield estimation were NMDI, GPP, CVI and NDNI; for the reproductive growth period, they were NMDI and NDNI (Figure 5). These findings may be related to the growth mechanism of maize. Hence, the characteristics of maize during the nutritional/vegetative and reproductive growth periods were explored by analyzing the time series curves of the indexes. For the nutritional/vegetative growth period, the water content increased (Figure 5d); the nitrogen content (Figure 5f) gradually increased; and biomass accumulation increased (Figure S3d,e in Supplementary Materials). These trends gradually decreased in the reproductive growth period.
The responses of the indexes to yield estimation can be summarized as follows. First, chlorophyll content increases from preflowering to maturity and gradually decreases after maturity, which is consistent with the findings of other studies [70]. Second, nitrogen continuously accumulates during the nutritional/vegetative growth period, but the accumulation slows down during the filling period [71]. As maize grows, the ability to absorb photosynthetic radiation increases, and carbohydrates are synthesized from CO2 and water [70,72]. Organic matter accumulates up to the R5 (Dent) period, remains high and then steadily increases in the mature stage [71,73]. For the reproductive growth period, NMDI and NDNI are the indexes most sensitive to yield estimation (Figure 4). This can be explained by maize being a crop with high water demand [67]. More N content is transported to the kernel in the reproductive growth period [74]. At this period, LSTnight and LSTday, which reflect water stress, are sensitive to maize yield [7]. Therefore, multiple spectral indexes contribute more to yield estimation in the nutritional/vegetative growth period, while climate factors contribute more in the reproductive growth period. This finding is consistent with those obtained by other studies showing that early peaks in the growth period help in crop yield prediction and that climate indexes provide additional information on the different periods of crop development [32].

4.3. Effect of Temporal Aggregation Data on Maize Yield Estimation

In most recent yield estimation studies, indexes across different periods are used for crop yield estimation [20,41,59]. In this study, the effect of temporal aggregation data on yield estimation was evaluated according to the whole-growth period, the two periods of growth (nutritional/vegetative and reproductive growth periods) and the eight-day time series. As the phenological period shifted from coarse to detailed, the change trend of R2 initially increased and then decreased. The vegetative and reproductive growth periods (R2 = 0.71) are more advantageous for yield estimation than the whole-growth period (R2 = 0.58) and eight days of time series data (R2 = 0.69). The possible reasons for this finding are as follows. First, when only the indexes of the whole-growth period are used, the effect of different growth periods on yield estimation is essentially ignored. Second, when the eight-day time series data are used to estimate yield, the estimation accuracy is affected by the differences in phenological periods of different areas (i.e., between the northern and southern regions of China). The actual phenological period is usually delayed from south to north. Nonetheless, the same number of periods should be used as input to the estimation model.
Dividing phenology into two periods of growth (vegetative and reproductive growth) is an effective approach for yield estimation, especially since the evaluation between the two periods can be distinguished from each other. Nonetheless, the indexes for the vegetative growth period (R2 = 0.73) have more potential for estimating yield than those for the reproductive growth period (R2 = 0.68). This finding can be attributed to the most sensitive indexes under each category, which were selected in this study from the main influencing factors (climate, soil, genotype and management factors). Therefore, these indexes for the vegetative growth period can reflect maize growth and organic matter accumulation. In the absence of extreme weather effects (i.e., high temperature and drought) in the reproductive growth period, early yield estimation can be realized only by using the index of the vegetative growth period, which is consistent with the findings of existing research. An advance period of one to two months is needed to achieve a desirable wheat yield estimation effect [50].

4.4. Yield Estimation Effect after Integrating Different Indexes

In crop yield estimation, the most widely used index is NDVI [34], but it is prone to saturation. Furthermore, the yield estimation ability of VIs in the mature period is limited [75]. In this study, the indexes for the climate factors, water content, pigment content and nutrient elements were integrated into the VIs as a means of improving yield estimation accuracy. Our findings showed that R2 can reach 0.80. In the extant yield estimation research, different spectral indexes and environmental factors have also been combined. For instance, Cai et al. used a multidimensional vegetation index (i.e., EVI and SIF) to estimate the wheat yield in Australia, and the R2 reached 0.75 [21]. In other studies, the R2 of crop yield estimation reached 0.66–0.77 after integrating climate factors and VIs [20,21,76]. Zhang et al. used VIs and climate factors to estimate maize yields in China at the county level from 2001 to 2015, and an estimation R2 of 0.75 was achieved [7]. Previous studies have also estimated crop yield by integrating water content and chlorophyll [30,77], with R2 improving to 0.6–0.79 [78]. Soil data were used to estimate crop yield in China at the county level, and the R2 reached 0.78 [66]. In this study, only the climate factors and spectral index were considered, but the yield estimation accuracy can still approximate the yield estimation by simply using soil data. Spectral indexes can be obtained via remote sensing technology, which not only overcomes the difficulty of obtaining large-scale soil data but also the indirect derivation of indexes for genotype and the environment (e.g., pigment, nutrient elements and biomass).
CIMMYT proposed a variety of crop models, and the data they used mainly included evapotranspiration, mean temperature, max temperature, min temperature, rainfall, low rainfall, radiation, heat stress factor, water stress factor, leaf area increment, nitrogen content, irrigation, apparent radiation use, cultivar/line, day length and latitude [46,47]. However, the costs of monitoring the data are high, and data collection is even more expensive. In our study, the following indexes were assessed: (1) climate factors: temperature, precipitation and phenology; (2) soil and management factors: nitrogen content in nutrient elements (fertilizer) and soil moisture; and (3) climate and genotype factors: many aspects of plant physiology, including chlorophyll content, biomass and plant water content. The parameters provided in this study can be input into the crop model, further allowing the crop model to illustrate its advantages. Consequently, large-scale crop yield estimation results can be obtained.

4.5. Uncertainties and Future Work

The uncertainties and future work are as follows. First, the influencing factors of yield are climate, soil, genotype and management factors, among which the latter three were indirectly obtained. In future research, more potential indexes for soil, genotype and management will be added. Alternatively, new types of indexes may be aimed at further improving the precision of yield estimation. Second, in this study, the vegetative and reproductive growth periods were used for yield estimation, but the corresponding differences in phenology may not have been fully extracted. In the future, we plan to subdivide the growth period as follows: turning-green period, jointing period, heading period and maturity period. In this manner, the optimal phenological phase of maize yield prediction could be obtained [79], and early crop yield estimation can be realized [80]. Finally, MODIS data are mainly used in this study. Future research may include Sentinel and other radar data to estimate crop yield in finer farmlands.

5. Conclusions

This study proposes a maize yield estimation method that integrates feature knowledge of multiple spectral indexes and temporal aggregation data at the county level. In particular, the maize yield in China from 2015 to 2019 was evaluated. The findings of this research can be summarized as follows. (1) The water content index is more effective than the VI in maize yield estimation. Among the multiple spectral indexes, NMDI is the index most sensitive to yield estimation. (2) The effect of temporal aggregation data on yield estimation can be evaluated using the whole-growth period, the two specific growth periods (vegetative and reproductive growth periods) and the eight-day time series. The accuracy of yield estimation initially increased and then decreased as the phenological period shifted from coarse to detailed. (3) The incorporation of water content, pigment content, nitrogen content and climate factors led to the gradual improvement of yield estimation R2 and RMSE, and R2 reached 0.7832 (RMSE = 741.1503 kg/ha) prior to leveling off to a maximum of 0.8. These findings correspond to the mechanisms of the influencing factors on yield estimation. Stable crop yield estimation at the county level was realized, and the potential of the proposed method for yield estimation was confirmed. The research results are expected to provide the feature knowledge and references for index assessments for large-scale crop yield estimation research.

Supplementary Materials

The following supporting information can be downloaded at: https://www.mdpi.com/article/10.3390/rs15020414/s1, Figure S1: Proportion of total maize yield of each country in the world in 2020; Figure S2: Statistics of total grain and maize yield in China from 2005 to 2020; Figure S3: Time series curves of the main indicators of maize in China; Figure S4: Spatial distribution of difference between observed yield and estimated yield; Table S1: Spectral index; Table S2: Climatic factors; Table S3: Combined indexes; Table S4: Comparison between this research and other research methods.

Author Contributions

Y.H.: Data curation; Formal analysis; Methodology; Resources; Writing—original draft; Writing—review and editing; validation. B.Q.: Formal analysis; Methodology; Project administration; Software; Funding acquisition; Supervision; Writing—review & editing. F.C.: Formal analysis; Visualization; Validation. C.C.: Formal analysis; Visualization; Supervision. Y.S.: Formal analysis; Visualization. D.Z.: The original draft preparation; visualization. L.L.: Resources; Investigation. A.X.: Resources; Investigation. All authors have read and agreed to the published version of the manuscript.

Funding

This work is supported by the National Key Research and Development Program of China (No. 2022YFD2001101, 2021YFB3901303), National Natural Science Foundation of China (grant no. 42171325,41771468, 41801393), the Science Bureau of Fujian Province (2020N5002).

Data Availability Statement

Not applicable.

Acknowledgments

We are grateful to Qianshun Chen for his support in providing information on yield influencing factors and food safety and nutrition. We are very grateful to the Editorial Board and anonymous reviewers for offering insightful suggestions and detailed comments that significantly improved the manuscript.

Conflicts of Interest

The authors declare that they have no known competing financial interest or personal relationship that could have appeared to influence the work reported in this paper.

References

  1. Godfra, H.C.J.; Beddington, J.R.; Crute, I.R.; Haddad, L.; Lawrence, D.; Muir, J.F.; Jules Pretty, S.R.; Sandy, M.; Toulmin, T.C. Food Security The Challenge of Feeding 9 Billion People. Science 2010, 327, 812–818. [Google Scholar] [CrossRef] [Green Version]
  2. Elavarasan, D.; Vincent, P.M.D. Crop Yield Prediction Using Deep Reinforcement Learning Model for Sustainable Agrarian Applications. IEEE Access 2020, 8, 86885–86901. [Google Scholar] [CrossRef]
  3. van Wart, J.; Kersebaum, K.C.; Peng, S.; Milner, M.; Cassman, K.G. Estimating crop yield potential at regional to national scales. Field Crops Res. 2013, 143, 34–43. [Google Scholar] [CrossRef] [Green Version]
  4. Zhang, L.; Zhang, Z.; Luo, Y.; Cao, J.; Xie, R.; Li, S. Integrating satellite-derived climatic and vegetation indices to predict smallholder maize yield using deep learning. Agric. For. Meteorol. 2021, 311, 108666. [Google Scholar] [CrossRef]
  5. Luo, Y.; Zhang, Z.; Chen, Y.; Li, Z.; Tao, F. ChinaCropPhen1km: A high-resolution crop phenological dataset for three staple crops in China during 2000–2015 based on leaf area index (LAI) products. Earth Syst. Sci. Data 2020, 12, 197–214. [Google Scholar] [CrossRef] [Green Version]
  6. Filippi, P.; Whelan, B.M.; Vervoort, R.W.; Bishop, T.F.A. Mid-season empirical cotton yield forecasts at fine resolutions using large yield mapping datasets and diverse spatial covariates. Agric. Syst. 2020, 184, 102894. [Google Scholar] [CrossRef]
  7. Zhang, L.; Zhang, Z.; Luo, Y.; Cao, J.; Tao, F. Combining Optical, Fluorescence, Thermal Satellite, and Environmental Data to Predict County-Level Maize Yield in China Using Machine Learning Approaches. Remote Sens. 2020, 12, 21. [Google Scholar] [CrossRef] [Green Version]
  8. Cao, J.; Zhang, Z.; Tao, F.; Zhang, L.; Luo, Y.; Zhang, J.; Han, J.; Xie, J. Integrating Multi-Source Data for Rice Yield Prediction across China using Machine Learning and Deep Learning Approaches. Agric. For. Meteorol. 2021, 297, 108275. [Google Scholar] [CrossRef]
  9. Muruganantham, P.; Wibowo, S.; Grandhi, S.; Samrat, N.H.; Islam, N. A Systematic Literature Review on Crop Yield Prediction with Deep Learning and Remote Sensing. Remote Sens. 2022, 14, 1990. [Google Scholar] [CrossRef]
  10. Ma, Y.; Zhang, Z.; Kang, Y.; Özdoğan, M. Corn yield prediction and uncertainty analysis based on remotely sensed variables using a Bayesian neural network approach. Remote Sens. Environ. 2021, 259, 112408. [Google Scholar] [CrossRef]
  11. Rashid, M.; Bari, B.; Yusup, Y.; Kamaruddin, M. A comprehensive review of crop yield prediction using machine learning approaches with special emphasis on palm oil yield prediction. IEEE Access 2021, 9, 63406–63439. [Google Scholar] [CrossRef]
  12. Sinsawat, V.; Leipner, J.; Stamp, P.; Fracheboud, Y. Effect of heat stress on the photosynthetic apparatus in maize (Zea mays L.) grown at control or high temperature. Environ. Exp. Bot. 2004, 52, 123–129. [Google Scholar] [CrossRef]
  13. Lee, E.A.; Tollenaar, M. Physiological Basis of Successful Breeding Strategies for Maize Grain Yield. Crop Sci. 2007, 47, S-202–S-215. [Google Scholar] [CrossRef]
  14. Clevers, J. Beyond NDVI: Extraction of biophysical variables from remote sensing imagery. In Land Use and Land Cover Mapping in Europe; Springer: Cham, Switzerland, 2014; pp. 363–381. [Google Scholar]
  15. Upreti, D.; Huang, W.; Kong, W.; Pascucci, S.; Pignatti, S.; Zhou, X.; Ye, H.; Casa, R. A comparison of hybrid machine learning algorithms for the retrieval of wheat biophysical variables from sentinel-2. Remote Sens. 2019, 11, 481. [Google Scholar] [CrossRef] [Green Version]
  16. De Grave, C.; Verrelst, J.; Morcillo-Pallarés, P.; Pipia, L.; Rivera-Caicedo, J.P.; Amin, E.; Belda, S.; Moreno, J. Quantifying vegetation biophysical variables from the Sentinel-3/FLEX tandem mission: Evaluation of the synergy of OLCI and FLORIS data sources. Remote Sens. Environ. 2020, 251, 112101. [Google Scholar] [CrossRef]
  17. Luo, Y.; Zhang, Z.; Cao, J.; Zhang, L.; Zhang, J.; Han, J.; Zhuang, H.; Cheng, F.; Tao, F. Accurately mapping global wheat production system using deep learning algorithms. Int. J. Appl. Earth Obs. Geoinf. 2022, 110, 102823. [Google Scholar] [CrossRef]
  18. Peng, B.; Guan, K.; Zhou, W.; Jiang, C.; Frankenberg, C.; Sun, Y.; He, L.; Köhler, P. Assessing the benefit of satellite-based Solar-Induced Chlorophyll Fluorescence in crop yield prediction. Int. J. Appl. Earth Obs. Geoinf. 2020, 90, 102126. [Google Scholar] [CrossRef]
  19. Huang, J.; Tian, L.; Liang, S.; Ma, H.; Becker-Reshef, I.; Huang, Y.; Su, W.; Zhang, X.; Zhu, D.; Wu, W. Improving winter wheat yield estimation by assimilation of the leaf area index from Landsat TM and MODIS data into the WOFOST model. Agric. For. Meteorol. 2015, 204, 106–121. [Google Scholar] [CrossRef] [Green Version]
  20. Jiang, H.; Hu, H.; Zhong, R.; Xu, J.; Xu, J.; Huang, J.; Wang, S.; Ying, Y.; Lin, T. A deep learning approach to conflating heterogeneous geospatial data for corn yield estimation: A case study of the US Corn Belt at the county level. Glob. Chang. Biol. 2020, 26, 1754–1766. [Google Scholar] [CrossRef]
  21. Cai, Y.; Guan, K.; Lobell, D.; Potgieter, A.B.; Wang, S.; Peng, J.; Xu, T.; Asseng, S.; Zhang, Y.; You, L.; et al. Integrating satellite and climate data to predict wheat yield in Australia using machine learning approaches. Agric. For. Meteorol. 2019, 274, 144–159. [Google Scholar] [CrossRef]
  22. Peng, Y.; Nguy-Robertson, A.; Arkebauer, T.; Gitelson, A.A. Assessment of Canopy Chlorophyll Content Retrieval in Maize and Soybean: Implications of Hysteresis on the Development of Generic Algorithms. Remote Sens. 2017, 9, 226. [Google Scholar] [CrossRef] [Green Version]
  23. Qiao, K.; Zhu, W.; Xie, Z. Application conditions and impact factors for various vegetation indices in constructing the LAI seasonal trajectory over different vegetation types. Ecol. Indic. 2020, 112, 106153. [Google Scholar] [CrossRef]
  24. Gan, L.; Cao, X.; Chen, X.; Dong, Q.; Cui, X.; Chen, J. Comparison of MODIS-based vegetation indices and methods for winter wheat green-up date detection in Huanghuai region of China. Agric. For. Meteorol. 2020, 288–289, 108019. [Google Scholar] [CrossRef]
  25. Guan, K.; Wu, J.; Kimball, J.S.; Anderson, M.C.; Frolking, S.; Li, B.; Hain, C.R.; Lobell, D.B. The shared and unique values of optical, fluorescence, thermal and microwave satellite data for estimating large-scale crop yields. Remote Sens. Environ. 2017, 199, 333–349. [Google Scholar] [CrossRef] [Green Version]
  26. Zhang, X.; Wang, Y.; Guo, Y.; Luo, J.; Shen, Y. Spatio-temporal characteristics of the hydrothermal conditions in the growth period and various growth stages of maize in China from 1960 to 2018. Chin. J. Eco-Agric. 2021, 29, 1417–1429. [Google Scholar]
  27. Yasin, M.; Ahmad, A.; Khaliq, T.; Habib-ur-Rahman, M.; Niaz, S.; Gaiser, T.; Ghafoor, I.; Hassan HSu Qasim, M.; Hoogenboom, G. Climate change impact uncertainty assessment and adaptations for sustainable maize production using multi-crop and climate models. Environ. Sci. Pollut. Res. 2022, 29, 18967–18988. [Google Scholar] [CrossRef]
  28. Schwalbert, R.A.; Amado, T.; Corassa, G.; Pott, L.P.; Prasad, P.V.V.; Ciampitti, I.A. Satellite-based soybean yield forecast: Integrating machine learning and weather data for improving crop yield prediction in southern Brazil. Agric. For. Meteorol. 2020, 284, 107886. [Google Scholar] [CrossRef]
  29. Sakamoto, T. Incorporating environmental variables into a MODIS-based crop yield estimation method for United States corn and soybeans through the use of a random forest regression algorithm. ISPRS J. Photogramm. Remote Sens. 2020, 160, 208–228. [Google Scholar] [CrossRef]
  30. Kern, A.; Barcza, Z.; Marjanović, H.; Árendás, T.; Fodor, N.; Bónis, P.; Bognár, P.; Lichtenberger, J. Statistical modelling of crop yield in Central Europe using climate data and remote sensing vegetation indices. Agric. For. Meteorol. 2018, 260–261, 300–320. [Google Scholar] [CrossRef]
  31. Rettie, F.M.; Gayler, S.; KDWeber, T.; Tesfaye, K.; Streck, T. Climate change impact on wheat and maize growth in Ethiopia: A multi-model uncertainty analysis. PloS ONE 2022, 17, e0262951. [Google Scholar] [CrossRef]
  32. Li, Z.; Ding, L.; Xu, D. Exploring the potential role of environmental and multi-source satellite data in crop yield prediction across Northeast China. Sci. Total Environ. 2022, 815, 152880. [Google Scholar] [CrossRef]
  33. Tian, H.; Wang, P.; Tansey, K.; Zhang, J.; Zhang, S.; Li, H. An LSTM neural network for improving wheat yield estimates by integrating remote sensing data and meteorological data in the Guanzhong Plain, PR China. Agric. For. Meteorol. 2021, 310, 108629. [Google Scholar] [CrossRef]
  34. Vergara-Díaz, O.; Zaman-Allah, M.A.; Masuka, B.; Hornero, A.; Zarco-Tejada, P.; Prasanna, B.M.; Cairns, J.E.; Araus, J.L. A Novel Remote Sensing Approach for Prediction of Maize Yield Under Different Conditions of Nitrogen Fertilization. Front. Plant Sci. 2016, 7, 666. [Google Scholar] [CrossRef] [PubMed] [Green Version]
  35. Gaju, O.; Allard, V.; Martre, P.; Le Gouis, J.; Moreau, D.; Bogard, M.; Hubbart, S.; Foulkes, M.J. Nitrogen partitioning and remobilization in relation to leaf senescence, grain yield and grain nitrogen concentration in wheat cultivars. Field Crop. Res. 2014, 155, 213–223. [Google Scholar] [CrossRef]
  36. Chen, B.; Lu, X.; Yu, S.; Gu, S.; Huang, G.; Guo, X.; Zhao, C. The Application of Machine Learning Models Based on Leaf Spectral Reflectance for Estimating the Nitrogen Nutrient Index in Maize. Agriculture 2022, 12, 1839. [Google Scholar] [CrossRef]
  37. Shanmugapriya, P.; Latha, K.; Pazhanivelan, S.; Kumaraperumal, R.; Karthikeyan, G.; Sudarmanian, N. Cotton yield prediction using drone derived LAI and chlorophyll content. J. Agrometeorol. 2022, 24, 348–352. [Google Scholar] [CrossRef]
  38. Tiedeman, K.; Chamberlin, J.; Kosmowski, F.; Ayalew, H.; Sida, T.; Hijmans, R.J. Field Data Collection Methods Strongly Affect Satellite-Based Crop Yield Estimation. Remote Sens. 2022, 14, 1995. [Google Scholar] [CrossRef]
  39. Mateo-Sanchis, A.; Piles, M.; Muñoz-Marí, J.; Adsuara, J.E.; Pérez-Suay, A.; Camps-Valls, G. Synergistic integration of optical and microwave satellite data for crop yield estimation. Remote Sens. Environ. 2019, 234, 111460. [Google Scholar] [CrossRef]
  40. Ji, Z.; Pan, Y.; Zhu, X.; Wang, J.; Li, Q. Prediction of Crop Yield Using Phenological Information Extracted from Remote Sensing Vegetation Index. Sensors 2021, 21, 1406. [Google Scholar] [CrossRef]
  41. Xu, H.; He, H.; Yang, K.; Ren, H.; Zhu, T.; Ke, J.; You, C.; Guo, S.; Wu, L. Application of the Nitrogen Nutrition Index to Estimate the Yield of Indica Hybrid Rice Grown from Machine-Transplanted Bowl Seedlings. Agronomy 2022, 12, 742. [Google Scholar] [CrossRef]
  42. Li, X.; Geng, H.; Zhang, L.; Peng, S.; Xin, Q.; Huang, J.; Li, X.; Liu, S.; Wang, Y. Improving maize yield prediction at the county level from 2002 to 2015 in China using a novel deep learning approach. Comput. Electron. Agric. 2022, 202, 107356. [Google Scholar] [CrossRef]
  43. Cui, Y.; Liu, S.; Li, X.; Geng, H.; Xie, Y.; He, Y. Estimating Maize Yield in the Black Soil Region of Northeast China Using Land Surface Data Assimilation: Integrating a Crop Model and Remote Sensing. Front. Plant Sci. 2022, 13, 915109. [Google Scholar] [CrossRef] [PubMed]
  44. Ji, Z.; Pan, Y.; Zhu, X.; Zhang, D.; Wang, J. A generalized model to predict large-scale crop yields integrating satellite-based vegetation index time series and phenology metrics. Ecol. Indic. 2022, 137, 108759. [Google Scholar] [CrossRef]
  45. Basnet, B.R.; Crossa, J.; Dreisigacker, S.; Pérez-Rodríguez, P.; Manes, Y.; Singh, R.P.; Rosyara, U.R.; Camarillo-Castillo, F.; Murua, M. Hybrid Wheat Prediction Using Genomic, Pedigree, and Environmental Covariables Interaction Models. Plant Genome 2019, 12, 180051. [Google Scholar] [CrossRef] [PubMed] [Green Version]
  46. Hunt, L.A.; Reynolds, M.P.; Sayre, K.D.; Rajaram, S.; White, J.W.; Yan, W. Crop Modeling and the Identification of Stable Coefficients that May Reflect Significant Groups of Genes. Agron. J. 2003, 95, 20–31. [Google Scholar] [CrossRef]
  47. Hodson, D.P.; White, J.W. Use of spatial analyses for global characterization of wheat-based production systems. J. Agric. Sci. 2007, 145, 115–125. [Google Scholar] [CrossRef]
  48. Xin, Y.; Tao, F. Optimizing genotype-environment-management interactions to enhance productivity and eco-efficiency for wheat-maize rotation in the North China Plain. Sci. Total Environ. 2019, 654, 480–492. [Google Scholar] [CrossRef]
  49. Tao, F.; Rötter, R.P.; Palosuo, T.; Gregorio Hernández Díaz-Ambrona, C.; Mínguez, M.I.; Semenov, M.A.; Kersebaum, K.C.; Nendel, C.; Specka, X.; Hoffmann, H.; et al. Contribution of crop model structure, parameters and climate projections to uncertainty in climate change impact assessments. Glob. Chang. Biol. 2018, 24, 1291–1307. [Google Scholar] [CrossRef]
  50. Wang, Y.; Zhang, Z.; Feng, L.; Du, Q.; Runge, T. Combining Multi-Source Data and Machine Learning Approaches to Predict Winter Wheat Yield in the Conterminous United States. Remote Sens. 2020, 12, 1232. [Google Scholar] [CrossRef] [Green Version]
  51. Shih Hc Stow, D.A.; Weeks, J.R.; Coulter, L.L. Determining the Type and Starting Time of Land Cover and Land Use Change in Southern Ghana Based on Discrete Analysis of Dense Landsat Image Time Series. IEEE J. Sel. Top. Appl. Earth Obs. Remote Sens. 2016, 9, 2064–2073. [Google Scholar] [CrossRef]
  52. Zhang, J.; Feng, L.; Yao, F. Improved maize cultivated area estimation over a large scale combining MODIS-EVI time series data and crop phenological information. Isprs J. Photogramm. Remote Sens. 2014, 94, 102–113. [Google Scholar] [CrossRef]
  53. Pede, T.; Mountrakis, G.; Shaw, S.B. Improving corn yield prediction across the US Corn Belt by replacing air temperature with daily MODIS land surface temperature. Agric. For. Meteorol. 2019, 276–277, 107615. [Google Scholar] [CrossRef]
  54. Gorelick, N.; Hancher, M.; Dixon, M.; Ilyushchenko, S.; Thau, D.; Moore, R. Google Earth Engine: Planetary-scale geospatial analysis for everyone. Remote Sens. Environ. 2017, 202, 18–27. [Google Scholar] [CrossRef]
  55. Qiu, B.; Huang, Y.; Chen, C.; Tang, Z.; Zou, F. Mapping spatiotemporal dynamics of maize in China from 2005 to 2017 through designing leaf moisture based indicator from Normalized Multi-band Drought Index. Comput. Electron. Agric. 2018, 153, 82–93. [Google Scholar] [CrossRef]
  56. Jiang, Z.; Huete, A.R.; Didan, K.; Miura, T. Development of a two-band enhanced vegetation index without a blue band. Remote Sens. Environ. 2008, 112, 3833–3845. [Google Scholar] [CrossRef]
  57. Breiman, L. Random Forests. Mach. Learn. 2001, 45, 5–32. [Google Scholar] [CrossRef] [Green Version]
  58. Nicodemus, K.K. Letter to the Editor: On the stability and ranking of predictors from random forest variable importance measures. Brief. Bioinform. 2011, 12, 369–373. [Google Scholar] [CrossRef] [Green Version]
  59. Kaiyu, G.; Zhan, L.; Nagraj, R.L.; Feng, G.; Donghui, X.; The, H.N.; Zhenzhong, Z. Mapping Paddy Rice Area and Yields Over Thai Binh Province in Viet Nam From MODIS, Landsat, and ALOS-2/PALSAR-2. IEEE J. Sel. Top. Appl. Earth Obs. Remote Sens. 2018, 11, 1–15. [Google Scholar]
  60. Wang, X.; Huang, J.; Feng, Q.; Yin, D. Winter Wheat Yield Prediction at County Level and Uncertainty Analysis in Main Wheat-Producing Regions of China with Deep Learning Approaches. Remote Sens. 2020, 12, 1744. [Google Scholar] [CrossRef]
  61. Penuelas, J.; Baret, F.; Filella, I. Semi-empirical indices to assess carotenoids/chlorophyll a ratio from leaf spectral reflectance. Photosynthetica 1995, 31, 221–230. [Google Scholar]
  62. Vincini, M.; Frazzi, E.; D’Alessio, P. Comparison of narrow-band and broad-band vegetation indices for canopy chlorophyll density estimation in sugar beet. In Precision Agriculture’07 Papers Presented at the 6th European Conference on Precision Agriculture, Skiathos, Greece, 3–6 June, 2007; Wageningen Academic Publishers: Wageningen, The Netherlands, 2007; pp. 189–196. [Google Scholar]
  63. Herrmann, I.; Karnieli, A.; Bonfil, D.J.; Cohen, Y.; Alchanatis, V. SWIR-based spectral indices for assessing nitrogen content in potato fields. Int. J. Remote Sens. 2010, 31, 5127–5143. [Google Scholar] [CrossRef]
  64. Michael, M.; Kevin, T.; Jesslyn, B. Optimizing a remote sensing production efficiency model for macro-scale GPP and yield estimation in agroecosystems. Remote Sens. Environ. 2018, 217, 258–271. [Google Scholar]
  65. Wang, L.; Qu, J.J. NMDI: A normalized multi-band drought index for monitoring soil and vegetation moisture with satellite remote sensing. Geophys. Res. Lett. 2007, 34, 117–131. [Google Scholar] [CrossRef]
  66. Sun, J.; Lai, Z.; Di, L.; Sun, Z.; Shen, Y. Multi-level deep learning network for county-level corn yield estimation in the U.S. Corn Belt. IEEE J. Sel. Top. Appl. Earth Obs. Remote Sens. 2020, 99, 5048–5060. [Google Scholar] [CrossRef]
  67. Shuangjie, J.; Hongwei, L.; Jiang, Y.; Guoqiang, Z.; Hezhou, W.; Shenjiao, Y.; Qinghua, Y.; Jiameng, G.; Ruixin, S. Effects of drought on photosynthesis and ear development characteristics of maize. Acta Ecol. Sin. 2020, 40, 854–863. [Google Scholar]
  68. Cheng, T.; Song, R.; Li, D.; Zhou, K.; Zheng, H.; Yao, X.; Tian, Y.; Cao, W.; Zhu, Y. Spectroscopic Estimation of Biomass in Canopy Components of Paddy Rice Using Dry Matter and Chlorophyll Indices. Remote Sens. 2017, 9, 319. [Google Scholar] [CrossRef] [Green Version]
  69. Li, F.; Mistele, B.; Hu, Y.; Yue, X.; Yue, S.; Miao, Y.; Chen, X.; Cui, Z.; Meng, Q.; Schmidhalter, U. Remotely estimating aerial N status of phenologically differing winter wheat cultivars grown in contrasting climatic and geographic zones in China and Germany. Field Crops Res. 2012, 138, 21–32. [Google Scholar] [CrossRef]
  70. Ghazali, M.F.; Wikantika, K.; Aryantha, I.N.P.; Maulani, R.R.; Yayusman, L.F.; Sumantri, D.I. Integration of Spectral Measurement and UAV for Paddy Leaves Chlorophyll Content Estimation. Sci. Agric. Bohem. 2020, 51, 86–97. [Google Scholar] [CrossRef]
  71. Woli, K.P.; Sawyer, J.E.; Boyer, M.J.; Abendroth, L.J.; Elmore, R.W. Corn Era Hybrid Dry Matter and Macronutrient Accumulation across Development Stages. Agron. J. 2017, 109, 751–761. [Google Scholar] [CrossRef]
  72. Hendry, G.; Price, A. Stress Indicators: Chlorophylls and Carotenoids; Chapman and Hall: London, UK, 1993. [Google Scholar]
  73. Center, C.F.; Jones, G.D.; Carter, M.T. Dry Matter Accumulation and Depletion in Leaves, Stems, and Ears of Maturing Maize. Agron. J. 1970, 62, 535–537. [Google Scholar] [CrossRef]
  74. Gaju, O.; Allard, V.; Martre, P.; Snape, J.W.; Heumez, E.; Legouis, J.; Moreau, D.; Bogard, M.; Griffiths, S.; Orford, S. Identification of traits to improve the nitrogen-use efficiency of wheat genotypes. Field Crop. Res. 2011, 123, 139–152. [Google Scholar] [CrossRef]
  75. Yang, Q.; Shi, L.; Han, J.; Zha, Y.; Zhu, P. Deep convolutional neural networks for rice grain yield estimation at the ripening stage using UAV-based remotely sensed images. Field Crop. Res. 2019, 235, 142–153. [Google Scholar] [CrossRef]
  76. Johnson, D.M. An assessment of pre- and within-season remotely sensed variables for forecasting corn and soybean yields in the United States. Remote Sens. Environ. 2014, 141, 116–128. [Google Scholar] [CrossRef]
  77. Leroux, L.; Castets, M.; Baron, C.; Escorihuela, M.-J.; Bégué, A.; Lo Seen, D. Maize yield estimation in West Africa from crop process-induced combinations of multi-domain remote sensing indices. Eur. J. Agron. 2019, 108, 11–26. [Google Scholar] [CrossRef]
  78. Feng, L.; Wang, Y.; Zhang, Z.; Du, Q. Geographically and temporally weighted neural network for winter wheat yield prediction. Remote Sens. Environ. 2021, 262, 112514. [Google Scholar] [CrossRef]
  79. Yang, B.; Zhu, W.; Rezaei, E.E.; Li, J.; Sun, Z.; Zhang, J. The Optimal Phenological Phase of Maize for Yield Prediction with High-Frequency UAV Remote Sensing. Remote Sens. 2022, 14, 1559. [Google Scholar] [CrossRef]
  80. Cheng, M.; Penuelas, J.; McCabe, M.F.; Atzberger, C.; Jiao, X.; Wu, W.; Jin, X. Combining multi-indicators with machine-learning algorithms for maize yield early prediction at the county-level in China. Agric. For. Meteorol. 2022, 323, 109057. [Google Scholar] [CrossRef]
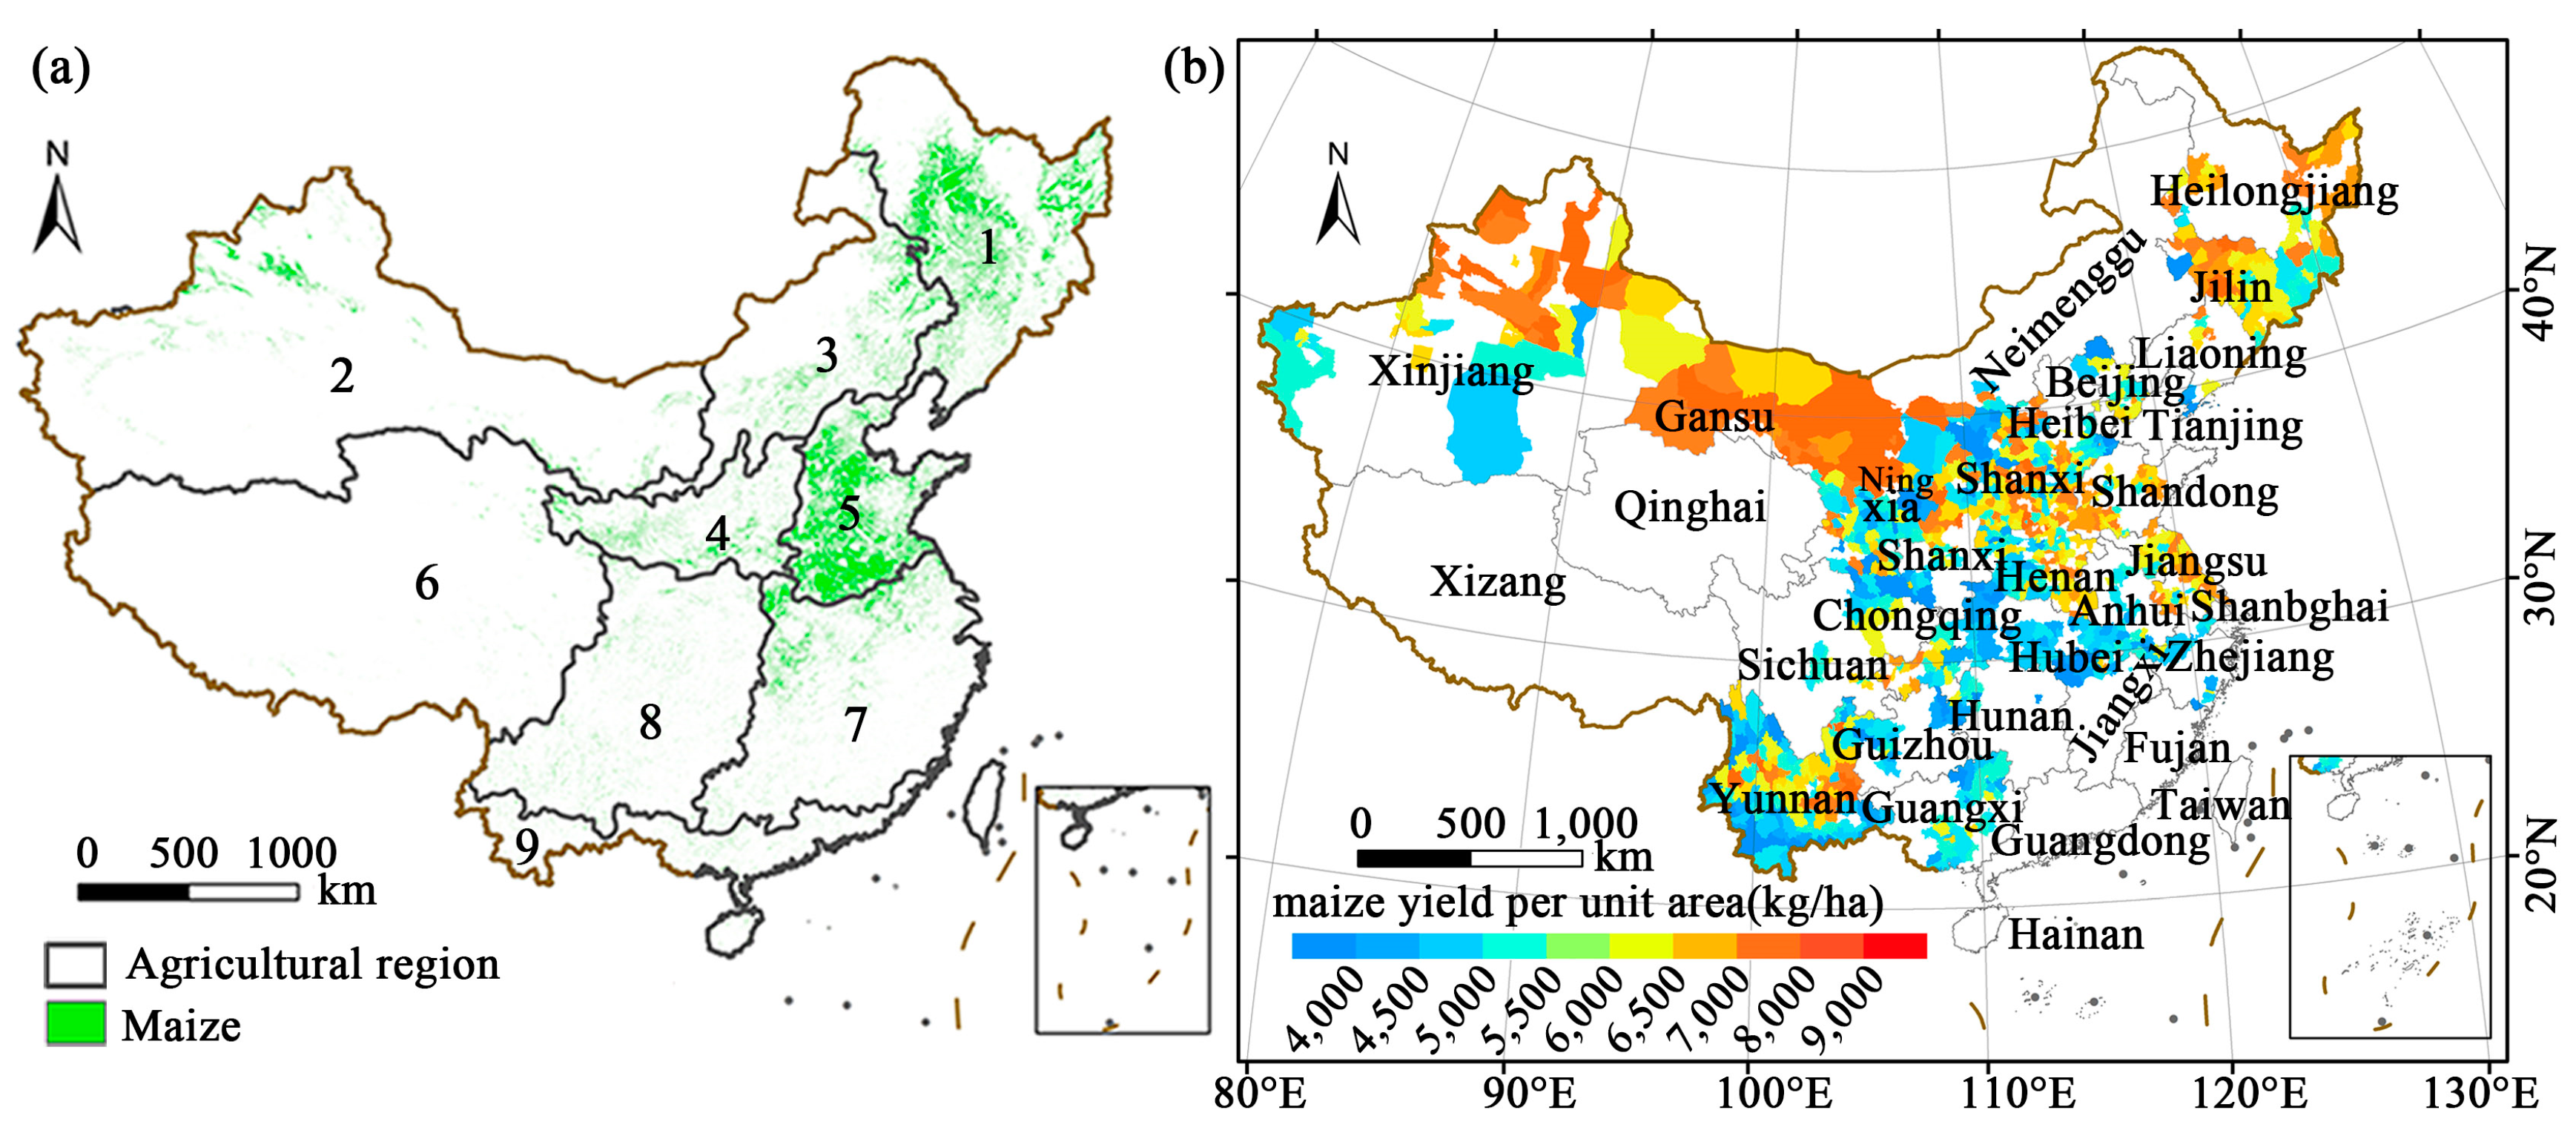
Figure 1. Map overview of the study area: (a) distribution of maize in 2018 and agricultural areas; (b) distribution of maize yield per unit area in 2018. Note: Agricultural region 1: Northeast China region, 2: Gansu new region, 3: the Inner Mongolia and region along the Great Wall, 4: Loess Plateau region, 5: Huang-Huai-Hai region, 6: Qinghai Tibet region, 7: Middle and lower reaches of the Yangtze River, 8: Southwest China, 9: South China.
Remotesensing 15 00414 g001
Figure 2. Proposed methodology of parameter (index) development for yield estimation.
Remotesensing 15 00414 g002
Figure 3. Combined indexes.
Remotesensing 15 00414 g003
Figure 4. Importance ranking of the (a) spectral indexes, (b) three types of indexes (spectral indexes, combined indexes and climate factors) and (c) indexes for the vegetative and reproductive growth periods. Note: NMDI represents the value of the whole-growth period; NMDI1 represents the value of the vegetative growth period; and NMDI2 represents the value of the reproductive growth period.
Remotesensing 15 00414 g004
Figure 5. Relationship between yield estimation and different indexes: (a) spatial distribution of maize yield per unit area; (b) NIRv and (c) NMDI; change patterns of (d) NMDI, (e) CVI and (f) NDNI with yield in 2019. Note: (df) show the time series curves of the high-yield fields in Kangning County, Liaoning City and Liaoning Province (yield = 8808 kg/ha) and the low-yield fields in Pianguan County, Shanxi City and Shanxi Province (yield = 3723.3708 kg/ha).
Remotesensing 15 00414 g005
Figure 6. Yield estimations at the (a) provincial level and (b) county level; (c) effect of temporal aggregation data on yield estimation. Note: NMDI represents the value of the whole-growth period, and 1 and 2 in “NMDI1 and 2” and “T1 and 2” represent the values of both the vegetative and reproductive growth periods.
Remotesensing 15 00414 g006
Figure 7. (a) Maize yield estimation by integrating multiple spectral indexes and temporal aggregation data, (b) Maize yield estimation accuracy of strategy C. Note: NMDI1 represents the value of the vegetative growth period. NMDI2 represents the value of the reproductive growth period. Other items are similar.
Remotesensing 15 00414 g007
Figure 8. (a) Maize yield estimation accuracy of strategy A, (b) Maize yield estimation accuracy of strategy B.
Remotesensing 15 00414 g008
Figure 9. Strategy A: (a) spatial distribution of NMDI1 and (b) distribution of the differences between observed and estimated yields; Strategy B: (c) spatial distribution of NMDI1 and (d) distribution of differences between observed and estimated yields. Note: NMDI1 represents the value of the vegetative growth period; NMDI2 represents the value of the reproductive growth period; and the others are similar.
Remotesensing 15 00414 g009
Figure 10. Spatial distribution of (a) observed yield in 2018 and (b) difference between observed and estimated yields in 2018.
Remotesensing 15 00414 g010
Table 1. Spectral indexes.
Index TypeIndexes
Vegetation EVI2, NDVI, GEM, ARVI2, OSAVI, PVR, WDRVI, BNDVI, NDPI, NIRv, VARIgreen, SLAV, ATSAVI, LAIbrown, LZC, VIgreen, GCC
Water contentNDMI, NDII, LSW, SIWSI6, SIWSI7, MNDWI, NMDI, GVMI
Carotenoid contentPSSRc, PSNDc, CRI550, PRI, SIPI
Chlorophyll content GNDVI, PSSRb, GCVI, NDFI685, CVI, CIgreen
Anthocyanin contentmACI
Nutrient contentNDNI, NRI1510, NDSI
BiomassGPP, SANI, DMCI
Table 2. Climate factors.
DataClimate FactorResenting MeaningSpatial
Resolution
Time
Resolution
Units
ERA5TmaxMaximum air temperature at 2 m height27,830 mDailyK
TmeanAverage air temperature at 2 m height27,830 mDailyK
TminMinimum air temperature at 2 m height27,830 mDailyK
Total_precipitationTotal precipitation27,830 mDailym
TerraClimateEvapotranspirationActual evapotranspiration4638.3 mMonthlymm
RadiationDownward surface shortwave radiation4638.3 mMonthlyW/m2
Soil moistureSoil moisture4638.3 mMonthlymm
VPDVapor pressure deficit4638.3 mMonthlykPa
MOD09A1LSTdayDay land surface temperature1 kmDailyKelvin
LSTnightNight land surface temperature1 kmDailyKelvin
Table 3. Brief descriptions of spectral indexes, climate factors and combined indexes.
Index TypeIndex
Spectral indexesNMDI, SIPI, CVI, GPP, LZC, PSSRc, CRI550, NDNI, NRI1510, GCC, NIRv
Climate factorsLSTday,LSTnight, Tmax, Evapotranspiration, soil moisture, Shortwave radiation, VPD, Tmean, Tmin, Total precipitation
Combined indexesNMDI_NDNI, SANI_NRI1510, NMDI_GCC, SANI_PSSRc, SANI_CRI550, LZC_SIPI
Disclaimer/Publisher’s Note: The statements, opinions and data contained in all publications are solely those of the individual author(s) and contributor(s) and not of MDPI and/or the editor(s). MDPI and/or the editor(s) disclaim responsibility for any injury to people or property resulting from any ideas, methods, instructions or products referred to in the content.