Article

Observation of Near-Inertial Internal Gravity Waves in the Southern South China Sea

1
School of Naval Architecture and Ocean Engineering, Jiangsu University of Science and Technology, Zhenjiang 212100, China
2
State Key Laboratory of Tropical Oceanography, South China Sea Institute of Oceanology, Chinese Academy of Sciences, Guangzhou 510301, China
3
Southern Marine Science and Engineering Guangdong Laboratory, Guangzhou 511458, China
4
Southern Marine Science and Engineering Guangdong Laboratory, Zhuhai 519082, China
*
Author to whom correspondence should be addressed.
Remote Sens. 2023, 15(2), 368; https://doi.org/10.3390/rs15020368
Submission received: 16 November 2022 / Revised: 4 January 2023 / Accepted: 5 January 2023 / Published: 7 January 2023
(This article belongs to the Section Ocean Remote Sensing)

Abstract

:
Two sets of more than 850 days of mooring records and satellite altimeter data are used to explore the features and spatiotemporal evolution of near-inertial waves (NIWs) near Nansha Island in the southern South China Sea (SCS). The observed NIWs are dominated by clockwise (downward energy propagation) motions and show a clear blue shift with a distinct peak frequency of 1.09 f during two large NIW events. The near-inertial kinetic energy (NIKE) is primarily concentrated in the upper layer and radiated downward. The largest value of depth-integrated NIKE reaches 3.5 KJ/m2. Besides, the NIWs are dominated by the first three modes, which account for 80% of the total NIKE. Moreover, the depth-integrated NIKE exhibits an apparent seasonal variation, with the largest NIKE in winter, which is almost three times larger than that in other seasons. Every large NIKE event is attributed to the passage of storms and is dominated by mode-2 NIWs. The dominance of the mode-2 NIWs is likely caused by the interaction between NIWs and mesoscale eddies.

Graphical Abstract

1. Introduction

Near-inertial waves (NIWs), or internal waves with a frequency near the inertial frequency f and containing almost half of the total kinetic energy in the internal waveband, are ubiquitous in the ocean [1,2,3]. The generation mechanisms of NIWs can be rapid-changing wind, nonlinear wave-wave interaction, mesoscale eddies, or geostrophic adjustment of currents in the ocean interior [4,5,6,7,8,9,10]. Among these various mechanisms, the predominant generation mechanism for NIWs is the wind [1,11,12,13,14]. According to prior estimations, wind work offers 0.3–1.5 TW for near-inertial motion of the surface boundary layer, which is similar to the power transition of surface tides to internal tides [15,16]. Compared to internal tides, NIWs are generally higher mode and have strong shear that modulates the stratification through the wave strain and thus changes the stability of the water column [16]. They are likely to play an important role in upper ocean mixing, affecting biogeochemistry and climate processes [17,18,19,20,21].
Wind stress fluctuations with frequencies near the inertial band can resonantly force inertial motions in the surface mixed layer [11]. After the generation of NIWs excited by wind, NIWs with high vertical wavenumber (high-mode) stay in the generation region due to their slow propagation, whereas those with low vertical wavenumber (low-mode) may travel hundreds of kilometers to the equator from the generation region [22,23]. The wind forcing required for inertial motions is mainly triggered by the passing of storms, hurricanes, or typhoons [23,24,25,26,27]. Because of this, NIWs often show strong time variability compared to the internal wave continuum.
The South China Sea (SCS) is the largest and deepest marginal sea in the western Pacific Ocean, and around 10.2 typhoons commonly influence it every year [28,29,30,31,32]. Owing to the complex topography and the effect of the East Asia Monsoon, the SCS contains abundant and active internal tides and near-inertial oscillations [33,34,35,36,37,38,39,40,41]. A variety of mooring measurements have been made to examine the variability of NIWs in the northern SCS in recent years. Xu et al. [8] pointed out that the observed NIWs were seasonally independent and comparable to the semidiurnal motions, and NIW energy and shear were significantly enhanced during the passage of a typhoon in the northwestern SCS. However, through more than 3 years of observation material from different mooring sites in the northwestern SCS, Chen et al. [42] found that near-inertial kinetic energy shows seasonal variability in the subsurface depth and that the near-inertial kinetic energy is the largest in the autumn. Upon further analysis, Chen et al. [42] also pointed out that the seasonal variation of the near-inertial kinetic energy was generated by passing storms. Using the same moored current observations in the northwestern SCS, Ma et al. [43] showed that almost 22–29% of the tropical cyclone-induced near-inertial energy entered the deep layer. Through HYCOM ocean model reanalysis results, Cao et al. [44] indicated that the variation of typhoon induced near-inertial waves were related to the research site and mainly concentrated in the basin with water depths greater than 1000 m.
Therefore, the NIWs induced by different storms in different mooring areas may show different features. Besides, the research on the near-inertial internal waves has mainly focused on the northern part of the SCS; however, the NIWs in the southern SCS have seldom been addressed through field observations. By the aid of long-term high-quality field observation data, Shang et al. [36] discovered that internal tide energy shows apparent seasonal variation in the southern SCS. Thus, it is natural to question whether the NIWs, the other most energetic internal wave in the internal wave spectrum, have the same seasonal feature in the southern SCS. In order to fully understand the role that NIWs play in the large-scale ocean circulation and upper ocean mixing, a comprehensive and profound study of the characteristics of NIWs in the entire SCS is necessary. Given these considerations, the modal structure and spatiotemporal evolution of the NIWs are investigated based on long-term observation dates in the southern SCS.
The paper is organized as follows: Section 2 describes the data information and methods used in this study; Section 3.1 outlines the current spectra; Section 3.2 focuses on the characteristics of NIWs; Section 3.3 examines the modal contents of NIWs; Section 4 discusses the results; and finally, conclusions are presented in Section 5.

2. Data and Methods

2.1. Data

Figure 1 shows the observational mooring site (red star) near Nansha Island, with a local water depth of 1680 m. The observational mooring site was located at 9°47.351′N, 112°56.659′. On 25 May 2009, the first set of mooring systems was deployed near Nansha Island, and they were recycled on 10 November 2010. After that, the second set of mooring system was launched on 10 November 2010 and recycled on 6 December 2011. Each mooring system was equipped with two ADCPs (an upward-looking Workhorse Broadband WHLS75K ADCP and a downward-looking Workhorse Broadband WHLS150K ADCP). The WHLS75K ADCP was deployed near 400 m depth, with a sampling interval of 8 m and a time interval of one hour. The WHLS150K ADCP was placed near 1400 m depth, with a sampling interval of 4 m and a time interval of half an hour (Table 1). The instrument sampling interval was short enough to record adequate near-inertial information. Shang et al. [36] provided detailed information about the mooring data.
The effective observation depths for the two observation periods are 14–390 m, 1377–1445 m, and 31–415 m, 1401–1489 m, respectively. Figure 2 shows raw currents in eastward and northward directions in January 2010. From the raw observational data, an obvious internal wave motion and upward propagating phase can be seen. Besides, the eastward current is clearly stronger than the northward current.
Additionally, in order to obtain the seawater density (Figure 3a) and buoyancy frequency profile, N(z) (Figure 3b), we also used the 1°× 1° seasonal average climate temperature and salinity data near the mooring site from the World Ocean Atlas 2009 (WOA2009).
In order to examine the influence of wind work on the near-inertial motions, the wind speed data at ten meters above the sea surface are used, which are from the fifth generation of the European Center for Medium-Range Weather Forecasts reanalysis (ERA5) [45]. The temporal resolution of the wind data is 1 h and the spatial resolution is 0.25° (https://cds.climate.copernicus.eu/cdsapp, accessed on 5 May 2020). Besides, we also use the Joint Typhoon Warning Center (JTWC) best-tracking data on tropical cyclones (TCs) to investigate the storm-induced large NIWs (Figure 1). Sea level anomalies (SLA) data and geostrophic current anomalies with a spatial resolution of 0.25° from AVISO (Archiving, Validation, and Interpretation of Satellite Oceanographic dataset, https://www.aviso.altimetry.fr/en/data/data-acces.html, accessed on 10 November 2016) are used to describe eddy features during January and December 2010.

2.2. Band-Pass Filtering

Band-pass filtering is used to get the near-inertial components. The bandpass filter used in this study is a fourth-order Butterworth filter. The upper and lower bandwidths of the bandpass filtering are set to [0.8–1.2] f to extract the NIWs, which exclude the diurnal and semi-diurnal frequency bands. The near-inertial frequency f at the observational site is 0.3410 cpd (1 cpd = 2π/86 400/s).

2.3. Modal Decomposition

Internal waves can be superimposed by a series of discrete baroclinic modes, from low mode to high mode, in a flat-bottomed ocean (water depth H) [46]. The modal decomposition depends on the vertical buoyancy frequency profile N(z). The vertical displacement ψ ( z ) and the horizontal velocity Π ( z ) caused by internal waves can be determined by the following equations and boundary conditions:
d 2 ψ ( z ) d z 2 + N 2 ( z ) C n 2 ψ ( z ) = 0
ψ ( 0 ) = ψ ( H ) = 0
and
Π ( z ) = ρ 0 C n 2 d ψ ( z ) / d z
where ρ0 is the ocean density, Cn is the eigenspeed, and the modal number corresponds to n [46]. Overall, four-mode solutions are computed for all moorings at this point.
The near-inertial horizontal velocity is expressed as
u ( z , t ) = n = 1 4 u n ( t ) ψ n ( z )
and
v ( z , t ) = n = 1 4 v n ( t ) ψ n ( z )
where u n ( t ) and v n ( t ) represent the time variation of the baroclinic modal amplitudes and ψ n ( z ) is the vertical structures of the baroclinic modes [46,47,48].
The corresponding depth-integrated near-inertial kinetic energy (NIKE) is then calculated from the above modal-fit baroclinic perturbation u ( z , t ) and v ( z , t ) , by
N I K E = H 0 1 2 ρ 0 ( u ( z , t ) 2 + v ( z , t ) ) d z
where water density ρ 0 is calculated from WOA2009 (Figure 3a).

3. Results

3.1. Current Spectra

During the vertical propagation of internal waves, the amplitude and vertical wavelength of the internal wave will change due to the influence of the buoyancy frequency. To remove the impact of the local stratification on the amplitude of the oscillations at a specific depth, the observational current velocity was scaled based on the Wentzel–Kramers–Brillouin (WKB) scaling [49]. The current velocity in each layer was normalized following u n ( z ) = u ( z ) / ( N ( z ) / N 0 ) 1 / 2 , where the buoyancy frequency N(z) is derived from the 1° × 1° seasonal average climate temperature and salinity data near the mooring site from WOA2009. The depth mean buoyancy frequency N 0 , was calculated between 0 and 1680 m.
Due to the effect of the earth’s rotation, the horizontal velocity trajectories of the ocean are often asymmetrical (rotating clockwise or anticlockwise). In order to analyze the rotation variation of the current velocity vector, Gonella [50] introduced the rotary spectrum method to analyze the time series of the velocity vector. To identify deterministic motions and polarization of internal waves, the rotary frequency spectrum is also used for the WKB-scaled velocity profiles.
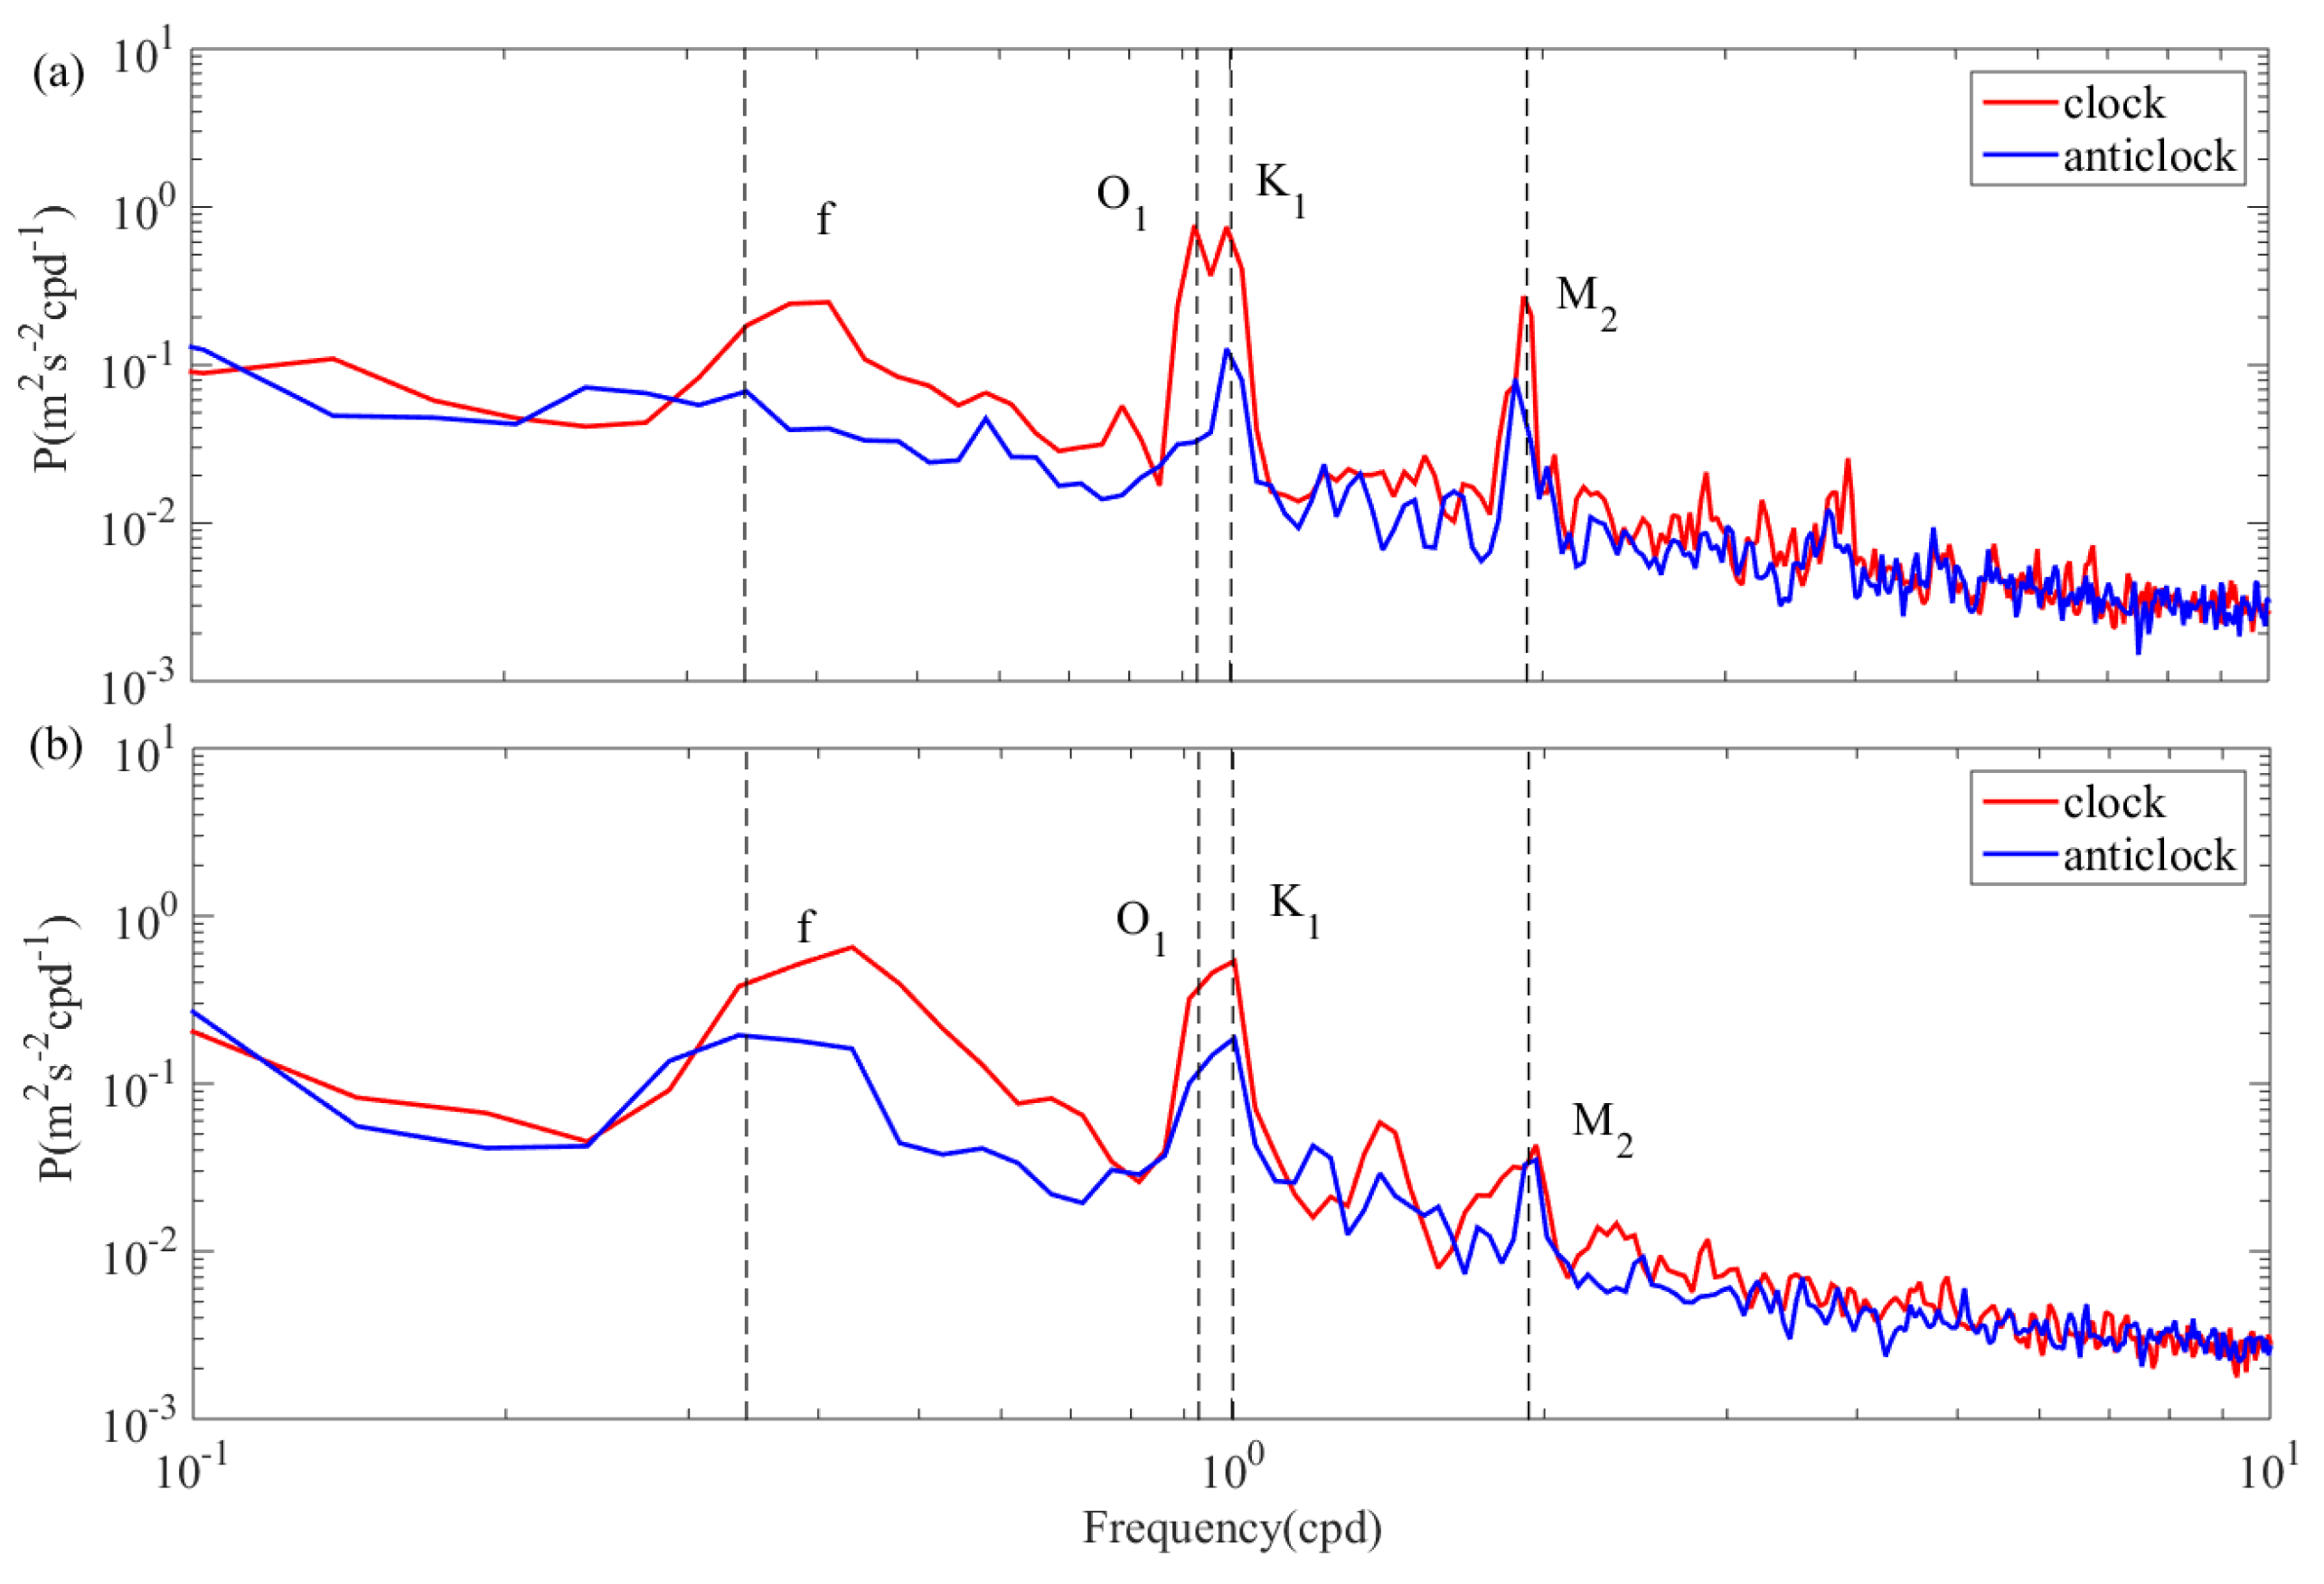
Figure 4 shows the rotary spectra of the depth-averaged WKB-scaled velocity profiles during January and December 2010. Considering the mixed layer is about 30 m and that the last 6% (upper 30 m) of the upward-looking ADCP may have undetermined errors, the rotary spectrum above 30 m is removed. For near-inertial waves, clockwise and anticlockwise motions are coupled with downward and upward energy propagation, which are marked with red and blue lines, respectively (Figure 4).
The rotary spectra of the WKB-scaled raw velocity show significant peaks at diurnal (0.93 cpd) and semidiurnal (1.93 cpd) frequencies during January and December 2010. The spectra of the near-inertial motions exhibit a slight blue shift with a peak frequency of 1.18 f (0.4024 cpd) during January (Figure 4a) and December (Figure 4b) 2010. Further, the clockwise motions in near-inertial frequency are apparent and even stronger than those in semidiurnal tidal frequency, especially during the observation period in December 2010. The dominance of clockwise rotating in the near-inertial band, indicating that the near-inertial internal wave energy propagates downward [49].
During January and December 2010, the anticlockwise rotary component was much smaller than the clockwise component in the internal tidal band. The diurnal tidal currents tend to be polarized, while the semidiurnal tidal currents are more rectilinear during December 2010 (Figure 4b).

3.2. Characteristics of NIWs

To explore the temporal variance of NIWs in the southern SCS, near-inertial motion is extracted by bandpass filtering. The filtering order is fourth order, and the corresponding filtering frequency band is between 0.8 f and 1.2 f [16].
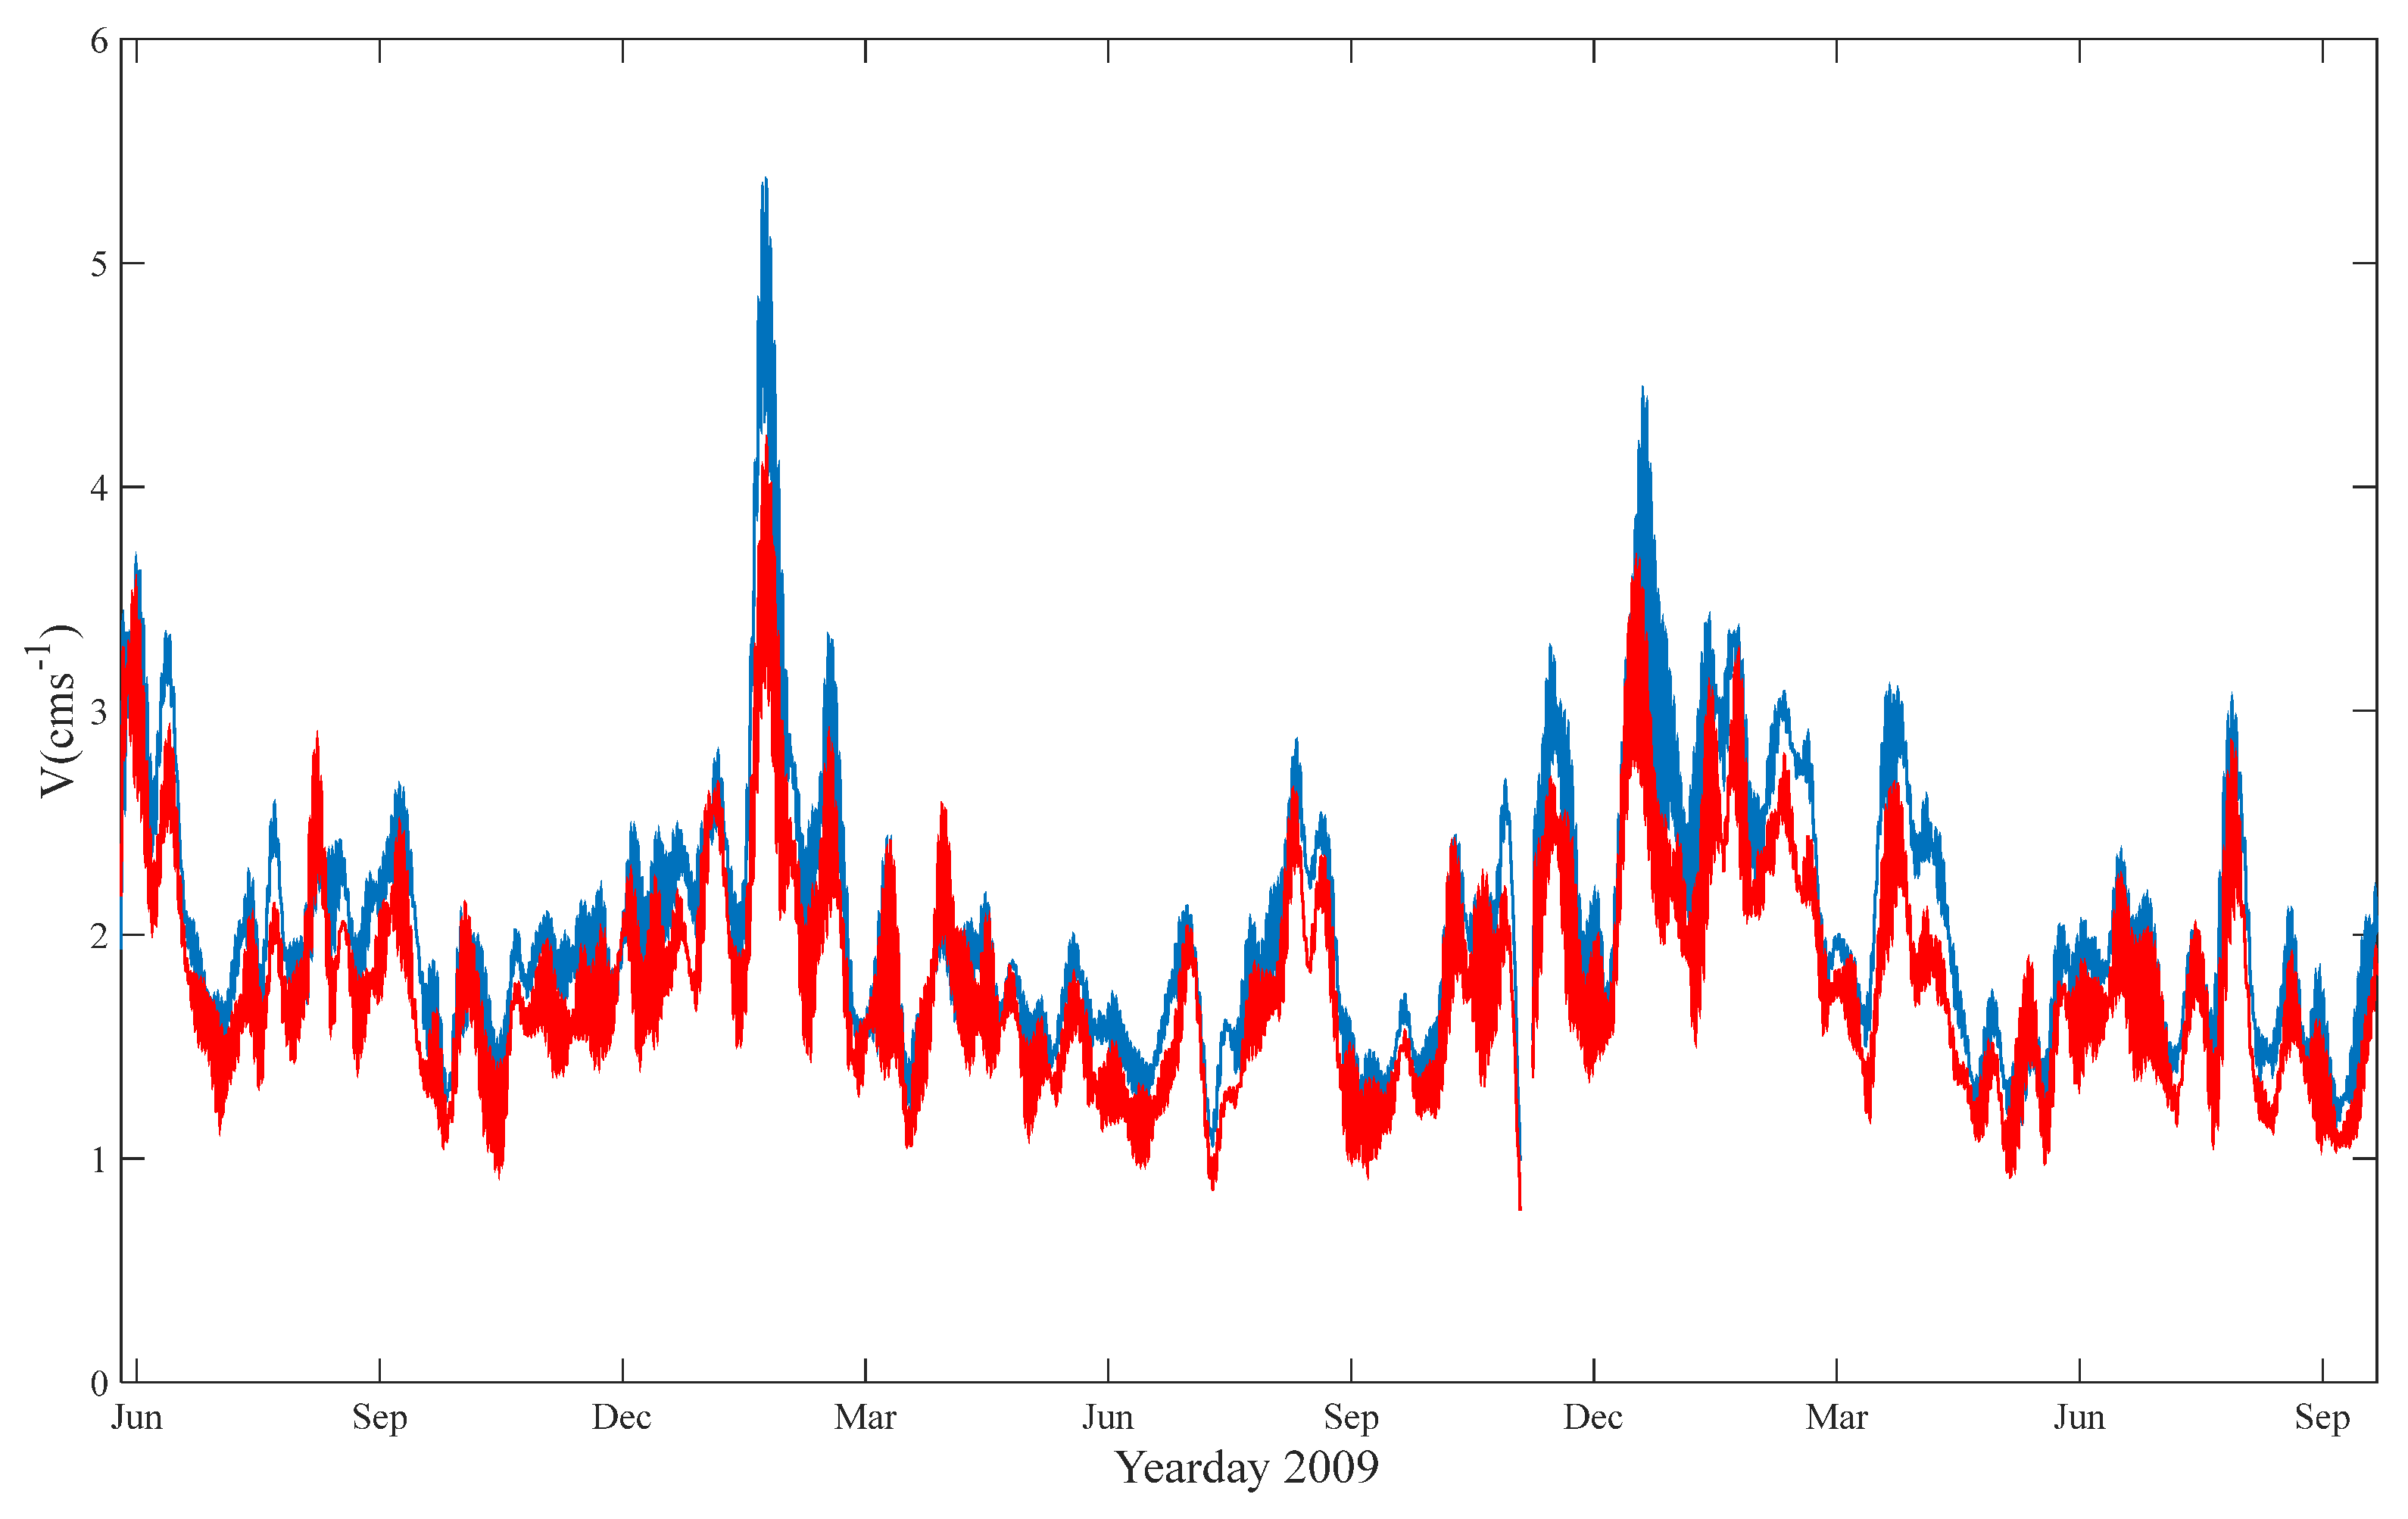
Figure 5 shows depth-averaged velocity amplitudes of raw near-inertial current (blue) and WKB-scaled current (red) from May 2009 to October 2011. The depth-averaged amplitude of WKB-scaled near-inertial current is slightly smaller than the depth-averaged velocity amplitudes averaged of raw near-inertial current. Besides, the near-inertial velocity amplitude presents an obvious seasonal variation. The depth-averaged near-inertial velocity amplitude in winter (defined as December, January, and February) is much larger than that in the other three seasons. The maximum amplitude in winter is about 5.4 cm/s. Two strong near-inertial internal wave amplitudes mainly occurred in January and December 2010 during the entire observation period, which led to the seasonal variation of the depth-averaged amplitudes.
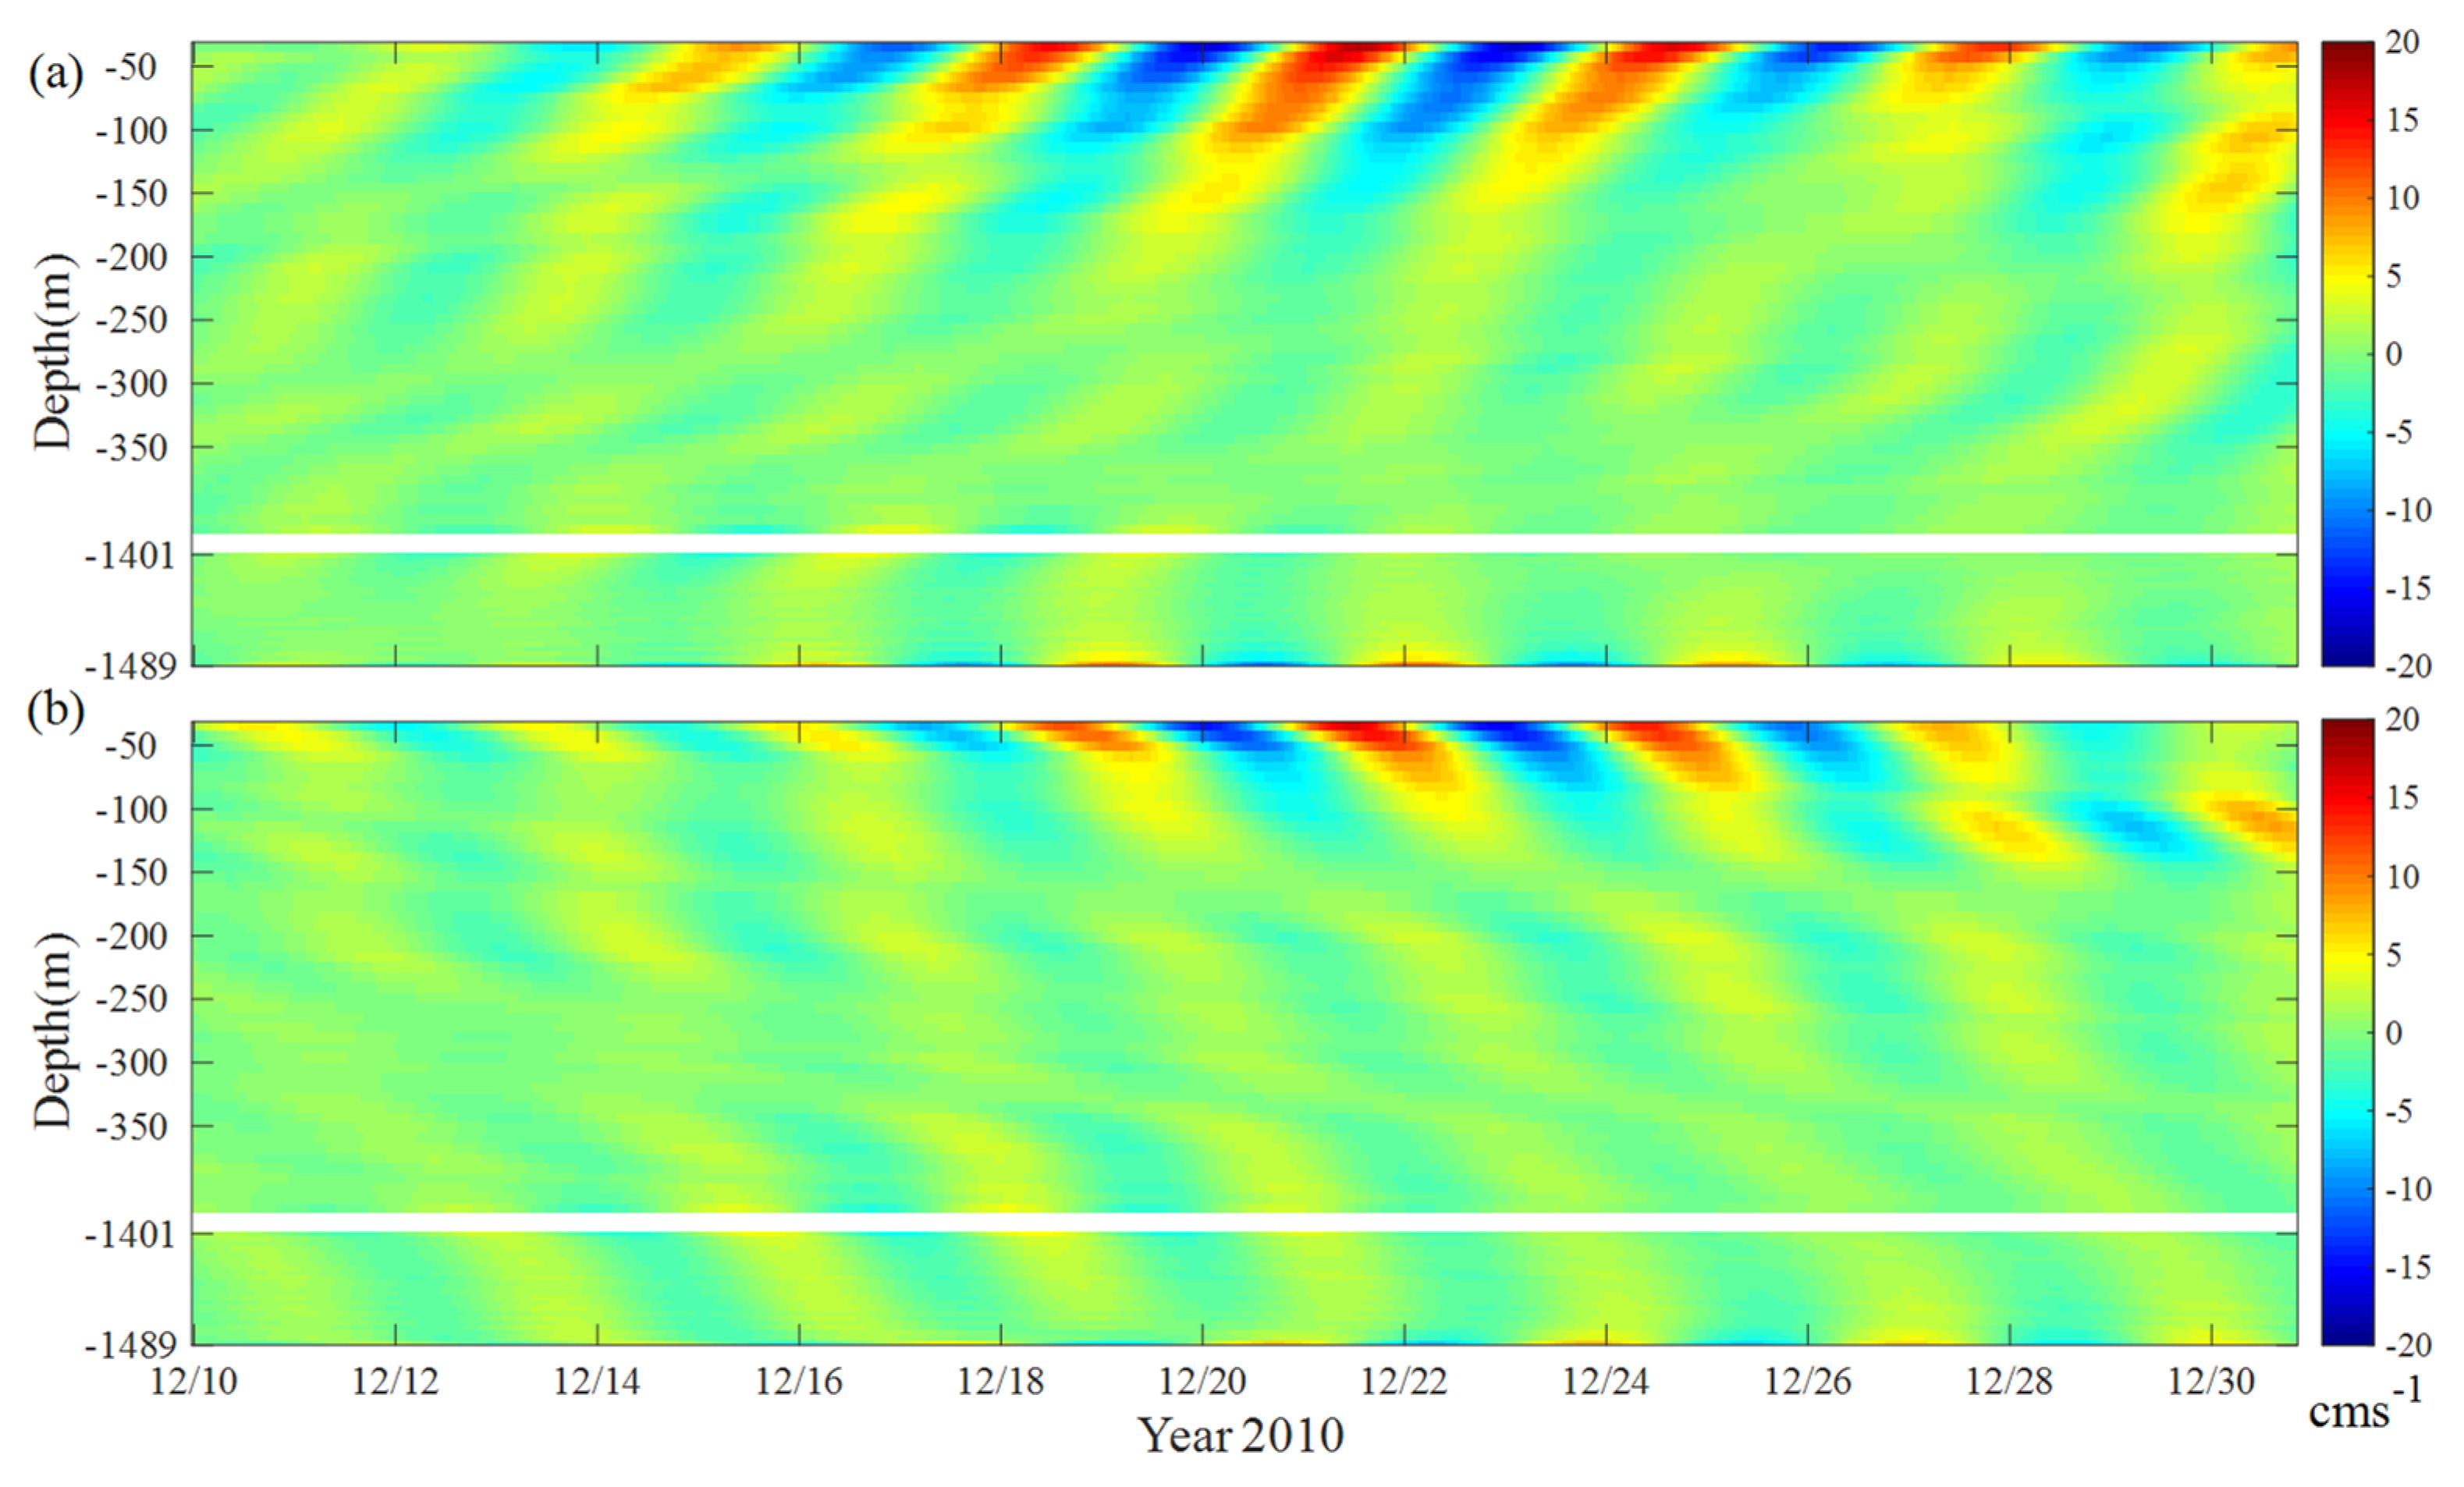
Figure 6 and Figure 7 show the depth-time maps of near-inertial currents for two large near-inertial events in January and December 2010. It can be found that the eastward current components (Figure 6a,b and Figure 7a,b) are much larger than the northward (Figure 6c,d and Figure 7c,d) current components, and the inertial velocity in the upper layer is also much larger than that in the deep layer. Compared to unscaled near-inertial velocities, the depth-time maps of WKB-scaled near-inertial velocities are similar in shape and only slightly smaller than unscaled near-inertial velocities. This may indicate that the local stratification had less influence on the vertical propagation of near-inertial waves during the observation period.
Shang et al. [36] found that the diurnal internal tidal currents showed clearly opposite phases in the upper and lower layers. However, compared with the mode-1 internal tide that dominates the diurnal tidal currents, the vertical structure of the near-inertial currents in shallow and deep waters is relatively complicated, implying that multimodal near-inertial motion dominates. Besides, the vertical scale of NIWs is from 200 to 300 m and rotates clockwise with depth, indicating downward energy propagation dominates, which is in harmony with rotary spectra results (Figure 4).
Through 2D Fourier filtering, the eastward velocities are further decomposed into downward and upward energy-propagating components. Figure 8 and Figure 9 show the depth-time maps of the upward phase (downward energy) and downward phase (upward energy) propagating eastward near-inertial velocity components.
The upward phase propagating near-inertial velocity (Figure 8a) is much larger than the downward phase propagating velocity (Figure 8b) in January 2010, which means NIWs are dominated by downward energy propagation, as shown in Figure 4 and Figure 6. Besides, the upward phase propagating near-inertial velocity is dominated by surface (less than 200 m) intensified near-inertial currents. For the second large near-inertial motion, the upward phase propagating near-inertial velocity is also larger than the downward phase propagating velocity in December 2010 (Figure 9). The upward phase propagating near-inertial motions were mainly concentrated in the surface layer (upper 100 m) in December 2010.

3.3. Modal Contents of NIWs

To document the spatial and temporal variation of NIWs, the dynamical modal decomposition is performed on the horizontal velocities (u and v) of the near-inertial internal waves [47,51]. According to equation (6), the depth-integrated NIKE for modes 1–4 are calculated during the study period.
Figure 10 shows the vertical structure of time-averaged NIKE profiles for modes 1–4 (mode-1: green line; mode-2: magenta line; mode-3: blue line; mode-4: grey line; and the sum of the four modes: black line). Besides, the NIKE for each profile is also calculated by E = 1 2 ρ ( u 2 + v 2 ) , u and v represents the raw undecomposed near-inertial currents. The maximum time-averaged NIKE for the sum of the four modes is 0.78 J/m3, which is slightly smaller than the near-inertial kinetic energy calculated from the raw, undecomposed near-inertial currents. Besides, the depth profile of the four modes (Figure 10, black line) shows the general variation of near-inertial energy calculated from the raw, undecomposed near-inertial currents (Figure 10, black dotted line). Due to the large gap (~1000 m) between the upper and lower ADCPs at the mooring, the total NIKE is the sum of the combination of the first four modes in this paper.
The NIKE is mainly concentrated in the upper layer and radiated downward, consistent with the mechanism of surface wind forcing. Dynamical modes suggest that NIWs in the surface layer (less than 100 m) are largely contributed by mode-1 initially, indicating a surface energy source, whereas higher modes (modes 2–4) turn to dominate NIKE as NIWs propagate downward. Mode-1 near-inertial motion accounts for 43.65% of the total NIKE in the surface layer (30–100 m), followed by mode-2, mode-3, and mode-4, which account for 24.59%, 13.81%, and 17.06% of the total energy, respectively. For depths greater than 100 m, mode-3 near-inertial motion accounts for 35% of the total NIKE, followed by mode-2, mode-4, and mode-1, which account for 27.6%, 20.8%, and 16.6% of the total energy, respectively.
NIWs with a lower mode (low vertical wavenumber) usually propagate faster than those with a higher mode (high vertical wavenumber). NIWs with lower modes (mode 1) quickly left the observation area, whereas those with higher modes (modes 2–4) stayed locally longer, which may induce the dominance of first-mode NIWs in the surface layer and the dominance of higher modes in the deep layer [42,52].
The time series of the depth-integrated NIKE for modes 1–4 during the mooring observation period is given in Figure 11. According to previous research, the modal decomposition of diurnal internal tidal waves was dominated by mode-1 motions at the observation site. The kinetic energy of diurnal internal tidal waves displayed an apparent seasonal variability, with larger energy in summer and winter than that in the other two seasons (spring and autumn) in the southern SCS [36]. The modal content of NIWs in southern SCS is also explored during the study period (Table 2).
For NIWs, the first three modes (modes 1–3) are stronger than mode-4. Figure 11 shows that mode-1, mode-2, and mode-3 NIKE account for approximately 23%, 28%, and 29% of the total NIKE (the sum of the four modes), respectively. The largest value of NIKE reaches 3.5 KJ/m2 in December 2010.
Besides, the depth-integrated NIKE is also found to exhibit an apparent seasonal variation, with the largest NIKE in winter (herein defined as December to February) (Table 2), which is consistent with the results of Figure 5. The NIKE in winter is more than 0.324 KJ/m2 during the observation period, which is three times more than the NIKE in spring (March to May). The NIKE in autumn (September to November) is 0.12 KJ/m2, and in summer (June to August), is 0.115 KJ/m2. The NIKE in autumn and summer is also slightly larger than that in spring, which is different from the seasonal variation of diurnal internal tidal kinetic energy in southern SCS [36]. Besides, NIWs have more intermittency in comparison with internal tides at our observation site, the latter of which are much more constant in time and space [36,37,52,53].

4. Discussion

In Section 3, it can be found that the NIKE in two events (January 2010 and December 2010) is much larger than the mean value (Figure 11), and each high NIKE may be associated with at least one storm. Besides, the NIKE in December 2010 is almost twice as large as the NIKE in January. The two large NIKE events during the entire observational period are further explored in this section.
Figure 12 and Figure 13 show the time series of the two strong NIKE in Figure 11 (Figure 12b and Figure 13b) and the corresponding near-surface (10 m) wind speed (Figure 12a,b and Figure 13a,b). According to the near-surface wind-speed data from ERA5 and tropical cyclones (TCs) from the JTWC, we find the strong NIWs in January 2010 and December 2010 are generated by two “Nameless” storms passing around 18 January 2010 (SID: 2010018N07113) and 11 December 2010 (SID: 2010346N09115) (Figure 1). A naming convention is adopted for the convenience of describing the two “Nameless” storms. We name the “Nameless” storms passing around 18 January 2010 (SID: 2010018N07113) as “January storm” and the “Nameless” storms passing around 11 December 2010 (SID: 2010346N09115) as “December storm”. The strong NIWs in late January and December 2010 exhibit a 5-10 day delay correlation with rapid-changing wind work, which indicates storm-induced NIWs in the southern SCS [54].
The large near-inertial oscillations in January 2010 were generated by the “January storm” passing around 18 January 2010. The depth-integrated NIKE in the surface layer intensified on 23 January 2010. Then, the NIKE began to gradually decrease and eventually vanish in early February 2010 (Figure 6 and Figure 12c). Compared with the large near-inertial oscillations in January 2010 induced by the “January storm”, another large near-inertial oscillation in December 2010 generated by the “December storm” was much stronger with a maximum value of 3.5 KJ/m2. This may be because the storm in December 2010 was much closer to the observation site (Figure 1). After the storm passed around 11 December 2010, the NIWs in the surface layer gradually intensified on 22 December 2010, then began to gradually decrease and eventually faded away in early January 2011 (Figure 13c). The maximum wind speed and the average wind speed at the mooring station reach 14.4 m/s and 8.5 m/s, respectively, during the passage of the “December storm”. At the stage of NIKE significant intensification, the wind speed in December (>10 m/s) is stronger than that in January (<10 m/s).
Another interesting phenomenon is that the two large NIKE events are dominated by mode-2 NIWs. It is clearly shown that “January storm”-induced NIWs in January 2010 are dominated by mode-2 motions, which account for 32% of the total NIKE, followed by mode-3 (30%), mode-1 (24%), and mode-4 (14%) (Figure 12). Figure 13 shows that the NIWs induced by the “December storm” in December 2010 are also dominated by mode-2 motions, which account for 35% of the total NIKE.
Besides, after the “January storm” passed the mooring site, a continuous mode-2 near-inertial packet radiated downward from 30 to 350 m, and the near-inertial peak velocity exceeded 20 cm/s (Figure 6a and Figure 8a). According to previous research, because mesoscale eddies frequently appear in the SCS, the interaction between low-mode internal waves and mesoscale eddies can generate higher-mode internal waves [55,56].
Figure 14 shows the sea level anomaly from AVISO and the geostrophic current anomaly during two large NIKE events. Two large near-inertial wave events in January and December 2010 were all affected by cyclonic eddies (Figure 14). Therefore, we speculate that the dominance of the higher modes is likely caused by the interaction between the NIWs and mesoscale eddies. Due to the limits of mooring sites and diverse oceanographic phenomena, the generation of mode-2 NIWs still needs further exploration.
Previous studies have pointed out that the frequency of the near-inertial oscillation is not strictly equal to the local inertial frequency f but will be modulated by the background vorticity, resulting in an increase (blue shift) or decrease (red shift) of the near-inertial frequency [9,42,57]. Kunze [57] states that the relationship between the effective inertial frequency fe and the local inertial frequency f0 is as follows: f e = f 0 + ζ / 2 , ζ = u / y v / x is the background vorticity. Figure 15 shows the background vorticity calculated from satellite data at the mooring site in January 2010.The mean effective inertial frequency fe is 0.3716 cpd, which is 9% higher than the local inertial frequency f0 during the first large NIKE event. The background vorticity during the second large NIKE event is also positive (Figure 14). Therefore, the spectra of the near-inertial motions exhibit a slight blue shift with a peak frequency of 1.09 f during January and December 2010 (Figure 4).

5. Conclusions

Near-inertial waves are ubiquitous in the ocean, but research on the near-inertial wave in the SCS are mainly limited to the northern SCS, with only a few studies based on field observations in the southern SCS. Using two sets of more than 850 days of mooring records and satellite altimeter data, this paper documents the characteristics and spatiotemporal evolution of NIWs in the southern SCS for the first time.
The rotary frequency spectrum shows that the observed NIWs are dominated by clockwise motions. Under the influence of positive background vorticity, the spectra of the near-inertial motions exhibit a slight blue shift with a peak frequency of 1.09 during January and December 2010. The depth-averaged near-inertial velocity amplitude in winter is much larger than that in the other three seasons. Modal decomposition indicates that the NIKE is mainly concentrated in the surface layer and radiated downward. NIWs in the surface layer are largely contributed by mode-1 motion, whereas higher modes turn to dominate NIKE as NIWs propagate downward.
Besides, the depth-integrated NIKE is dominated by the first three modes and exhibits an apparent seasonal variation, with the largest NIKE in winter, which is three times larger than the NIKE in spring. Every large NIKE event may be attributed to the passage of storms and is dominated by mode-2 NIWs. The sea level anomaly and the geostrophic currents anomaly from AVISO show that two large near-inertial wave events in January and December 2010 were all affected by cyclonic eddies. Therefore, we speculate that the dominance of the mode-2 NIWs is likely caused by the interaction between NIWs and mesoscale eddies. Both numerical models and more high-quality observational data are needed to further explore the generation of mode-2 NIWs in the southern SCS.

Author Contributions

Conceptualization, Q.L.; methodology, Q.L. and X.X.; investigation, Q.L. and X.S.; resources, Q.L. and S.X; data curation, Q.L. and J.C.; writing—original draft preparation, Q.L.; writing—review and editing, J.G. and X.W.; visualization, Q.L. and H.M.; supervision, X.S.; project administration, Q.L.; funding acquisition, Q.L. and H.M. All authors have read and agreed to the published version of the manuscript.

Funding

This research was funded by the Natural Science Foundation of Jiangsu Province, grant number BK20210885, the Natural Science Foundation of the Jiangsu Higher Education Institutions, grant number 20KJD170005, and the National Natural Science Foundation of China, grant number 42076005.

Data Availability Statement

The data presented in this study are available on request from the corresponding author.

Acknowledgments

Data from the best-track data of tropical cyclones (TCs) from the Joint Typhoon Warning Center (JTWC) are available online at https://www.ncei.noaa.gov/data/international-best-track-archive-for-climate-stewardship-ibtracs/v04r00/access/netcdf/. The 1° × 1° seasonal-mean climatological temperature and salinity data from the World Ocean Atlas 2009 (WOA2009) are available online at https://climatedateguide.ucar.edu/climate-data/world-ocean-atlas09. The ERA5 wind products are available at https://cds.climate.copernicus.eu/cdsapp. The absolute dynamic topography and geostrophic current data from the AVISO dataset are available at https://www.aviso.altimetry.fr/en/data.html. The processed mooring data used to construct the figures in this work are also available, and anyone who wants to get access to these data could contact the corresponding author.

Conflicts of Interest

The authors declare no conflict of interest. The funders had no role in the design of the study; in the collection, analyses, or interpretation of data; in the writing of the manuscript; or in the decision to publish the results.

References

  1. Alford, M.H.; Gregg, M.C. Near-inertial mixing: Modulation of shear, strain and microstructure at low latitude. J. Geophys. Res. Ocean. 2001, 106, 16947–16968. [Google Scholar] [CrossRef]
  2. Ferrari, R.; Wunsch, C. Ocean Circulation Kinetic Energy: Reservoirs, Sources, and Sinks. Annu. Rev. Fluid Mech. 2009, 41, 253–282. [Google Scholar] [CrossRef] [Green Version]
  3. Xie, X.; Liu, Q.; Shang, X.; Chen, G.; Wang, D. Poleward propagation of parametric subharmonic instability-induced inertial waves. J. Geophys. Res. Ocean. 2016, 121, 1881–1895. [Google Scholar] [CrossRef] [Green Version]
  4. Xie, X.-H.; Shang, X.-D.; Chen, G.-Y.; Sun, L. Variations of diurnal and inertial spectral peaks near the bi-diurnal critical latitude. Geophys. Res. Lett. 2009, 36, 02606. [Google Scholar] [CrossRef]
  5. Nikurashin, M.; Ferrari, R. Radiation and dissipation of internal waves generated by geostrophic gotions impinging on small-scale topography: Application to the Southern Ocean. J. Phys. Oceanogr. 2010, 40, 2025–2042. [Google Scholar] [CrossRef]
  6. Alford, M.H.; Cronin, M.; Klymak, J. Annual Cycle and Depth Penetration of Wind-Generated Near-Inertial Internal Waves at Ocean Station Papa in the Northeast Pacific. J. Phys. Oceanogr. 2012, 42, 889–909. [Google Scholar] [CrossRef]
  7. Liang, X.; Thurnherr, A. Eddy-Modulated Internal Waves and Mixing on a Midocean Ridge. J. Phys. Oceanogr. 2012, 42, 1242–1248. [Google Scholar] [CrossRef]
  8. Xu, Z.; Yin, B.; Hou, Y.; Xu, Y. Variability of internal tides and near-inertial waves on the continental slope of the northwestern South China Sea. J. Geophys. Res. Ocean. 2013, 118, 197–211. [Google Scholar] [CrossRef]
  9. Le Boyer, A.; Alford, M.H.; Pinkel, R.; Hennon, T.D.; Yang, Y.J.; Ko, D.; Nash, J. Frequency Shift of Near-Inertial Waves in the South China Sea. J. Phys. Oceanogr. 2020, 50, 1121–1135. [Google Scholar] [CrossRef] [Green Version]
  10. Wang, S.; Cao, A.; Chen, X.; Li, Q.; Song, J. On the resonant triad interaction over mid-ocean ridges. Ocean Model. 2021, 158, 101734. [Google Scholar] [CrossRef]
  11. Pollard, R.T.; Millard, R.C., Jr. Comparison between observed and simulated wind-generated inertial oscillations. Deep. Sea Res. Oceanogr. Abstr. 1970, 17, 153–175. [Google Scholar] [CrossRef]
  12. Jiang, J.; Lu, Y.; Perrie, W. Estimating the energy flux form the wind to ocean inertial motions: The sensitivity to surface wind fields. Geophys. Res. Lett. 2005, 32, L15610. [Google Scholar] [CrossRef]
  13. Furuichi, N.; Hibiya, T.; Niwa, Y. Model-predicted distribution of wind-induced internal wave energy in the world’s oceans. J. Geophys. Res. Atmos. 2008, 113, C09034. [Google Scholar] [CrossRef]
  14. Rimac, A.; von Storch, J.-S.; Eden, C.; Haak, H. The influence of high-resolution wind stress field on the power input to near-inertial motions in the ocean. Geophys. Res. Lett. 2013, 40, 4882–4886. [Google Scholar] [CrossRef]
  15. Wunsch, C. The Work Done by the Wind on the Oceanic General Circulation. J. Phys. Oceanogr. 1998, 28, 2332–2340. [Google Scholar] [CrossRef]
  16. Alford, M.H.; MacKinnon, J.A.; Simmons, H.L.; Nash, J.D. Near-Inertial Internal Gravity Waves in the Ocean. Annu. Rev. Mar. Sci. 2016, 8, 95–123. [Google Scholar] [CrossRef] [Green Version]
  17. Moehlis, J.; Smith, S.L. Radiation of Mixed Layer Near-Inertial Oscillations into the Ocean Interior. J. Phys. Oceanogr. 2001, 31, 1550–1560. [Google Scholar] [CrossRef]
  18. Simmons, H.; Alford, M. Simulating the Long-Range Swell of Internal Waves Generated by Ocean Storms. Oceanography 2012, 25, 30–41. [Google Scholar] [CrossRef]
  19. Jochum, M.; Briegleb, B.P.; Danabasoglu, G.; Large, W.G.; Norton, N.J.; Jayne, S.R.; Alford, M.H.; Bryan, F.O. The Impact of Oceanic Near-Inertial Waves on Climate. J. Clim. 2013, 26, 2833–2844. [Google Scholar] [CrossRef] [Green Version]
  20. Alford, M.H.; Peacock, T.; MacKinnon, J.A.; Nash, J.D.; Buijsman, M.C.; Centurioni, L.R.; Chao, S.-Y.; Chang, M.-H.; Farmer, D.M.; Fringer, O.B.; et al. The formation and fate of internal waves in the South China Sea. Nature 2015, 521, 65–69. [Google Scholar] [CrossRef]
  21. Gao, J.; Ma, X.; Dong, G.; Chen, H.; Liu, Q.; Zang, J. Investigation on the effects of Bragg reflection on harbor oscillations. Coast. Eng. 2021, 170, 103977. [Google Scholar] [CrossRef]
  22. Garrett, C. What is the “near-inertial” band and why is it different from the rest of the internal wave spectrum? J. Phys. Oceanogr. 2001, 31, 962–971. [Google Scholar] [CrossRef]
  23. Alford, M.H. Improved global maps and 54-year history of wind-work on ocean inertial motions. Geophys. Res. Lett. 2003, 30, 1424. [Google Scholar] [CrossRef] [Green Version]
  24. Mayer, D.A.; Mofjeld, H.O.; Leaman, K.D. Near-Inertial Internal Waves Observed on the Outer Shelf in the Middle Atlantic Bight in the Wake of Hurricane Belle. J. Phys. Oceanogr. 1981, 11, 87–106. [Google Scholar] [CrossRef]
  25. D’Asaro, E.A. The Energy Flux from the Wind to Near-Inertial Motions in the Surface Mixed Layer. J. Phys. Oceanogr. 1985, 15, 1043–1059. [Google Scholar] [CrossRef]
  26. Cuypers, Y.; Le Vaillant, X.; Bouruet-Aubertot, P.; Vialard, J.; McPhaden, M.J. Tropical storm-induced near-inertial internal waves during the Cirene experiment: Energy fluxes and impact on vertical mixing. J. Geophys. Res. Ocean. 2013, 118, 358–380. [Google Scholar] [CrossRef] [Green Version]
  27. Cao, A.; Guo, Z.; Song, J.; Lv, X.; He, H.; Fan, W. Near-Inertial Waves and Their Underlying Mechanisms Based on the South China Sea Internal Wave Experiment (2010–2011). J. Geophys. Res. Ocean. 2018, 123, 5026–5040. [Google Scholar] [CrossRef]
  28. Wang, G.H.; Su, J.L.; Ding, Y.H.; Chen, D. Tropical cyclone genesis over the south China sea. J. Mar. Syst. J. Eur. Assoc. Mar. Sci. Tech. 2007, 68, 318–326. [Google Scholar] [CrossRef]
  29. Sun, L.; Zheng, Q.A.; Wang, D.X.; Hu, J.; Tai, C.K.; Sun, Z. A case study of near-inertial oscillation in the South China Sea using mooring obser-vations and satellite altimeter data. J. Oceanogr. 2011, 67, 677–687. [Google Scholar] [CrossRef]
  30. Yang, B.; Hou, Y. Near-inertial waves in the wake of 2011 Typhoon Nesat in the northern South China Sea. Acta Oceanol. Sin. 2014, 33, 102–111. [Google Scholar] [CrossRef]
  31. Ma, Y.; Zhang, S.; Qi, Y.; Jing, Z. Upper ocean near-inertial response to the passage of two sequential typhoons in the northwestern South China Sea. Sci. China Earth Sci. 2019, 62, 863–871. [Google Scholar] [CrossRef]
  32. He, H.; Cao, A.; Wang, Y.; Song, J. Evolution of oceanic near-inertial waves induced by typhoon Sarika (2016) in the South China Sea. Dyn. Atmos. Ocean. 2022, 100, 101332. [Google Scholar] [CrossRef]
  33. Gao, J.; Ma, X.; Zang, J.; Dong, G.; Ma, X.; Zhu, Y.; Zhou, L. Numerical investigation of harbor oscillations induced by focused transient wave groups. Coast. Eng. 2020, 158, 103670. [Google Scholar] [CrossRef]
  34. Guan, S.; Zhao, W.; Huthnance, J.; Tian, J.; Wang, J. Observed upper ocean response to typhoon Megi (2010) in the Northern South China Sea. J. Geophys. Res. Ocean. 2014, 119, 3134–3157. [Google Scholar] [CrossRef] [Green Version]
  35. Yang, B.; Hou, Y.J.; Hu, P.; Liu, Z.; Liu, Y. Shallow Ocean response to tropical cyclones observed on the continental shelf of the north-western South China Sea. J. Geophys. Res. Ocean. 2015, 120, 3817–3836. [Google Scholar] [CrossRef]
  36. Shang, X.; Liu, Q.; Xie, X.; Chen, G.; Chen, R. Characteristics and seasonal variability of internal tides in the southern South China Sea. Deep. Sea Res. Part I Oceanogr. Res. Pap. 2015, 98, 43–52. [Google Scholar] [CrossRef]
  37. Liu, Q.; Xie, X.; Shang, X.; Chen, G. Coherent and incoherent internal tides in the southern South China Sea. Chin. J. Oceanol. Limnol. 2016, 34, 1374–1382. [Google Scholar] [CrossRef]
  38. Liu, J.; He, Y.; Li, J.; Cai, S.; Wang, D.; Huang, Y. Cases Study of Nonlinear Interaction Between Near-Inertial Waves Induced by Typhoon and Diurnal Tides Near the Xisha Islands. J. Geophys. Res. Ocean. 2018, 123, 2768–2784. [Google Scholar] [CrossRef]
  39. Xu, J.; Huang, Y.; Chen, Z.; Liu, J.; Liu, T.; Li, J.; Cai, S.; Ning, D. Horizontal variations of typhoon-forced near-inertial oscillations in the south China sea simulated by a numerical model. Cont. Shelf Res. 2019, 180, 24–34. [Google Scholar] [CrossRef]
  40. Li, R.X.; Chen, C.S.; Dong, W.J.; Beardsley, R.C.; Wu, Z.; Gong, W.; Liu, Y.; Liu, T.; Xu, D. Slope-intensified storm-induced near-inertial oscillations in the South China Sea. J. Geophys. Res. Ocean. 2021, 126, e2020JC016713. [Google Scholar] [CrossRef]
  41. Liu, Q.; Shang, X.D.; Xie, X. Observations of semidiurnal M2 internal tidal parametric subharmonic instability in the north-eastern South China Sea. J. Oceanol. Limnol. 2021, 39, 8. [Google Scholar]
  42. Chen, G.; Xue, H.; Wang, D.; Xie, Q. Observed near-inertial kinetic energy in the northwestern South China Sea. J. Geophys. Res. Ocean. 2013, 118, 4965–4977. [Google Scholar] [CrossRef]
  43. Ma, Y.; Wang, D.; Shu, Y.; Chen, J.; He, Y.; Xie, Q. Bottom-reached near-inertial waves induced by the tropical cyclones, Conson and Mindulle, in the South China Sea. J. Geophys. Res. Ocean. 2022, 127, e2021JC018162. [Google Scholar] [CrossRef]
  44. Cao, A.; Guo, Z.; Pan, Y.; Song, J.; He, H.; Li, P. Near-Inertial Waves Induced by Typhoon Megi (2010) in the South China Sea. J. Mar. Sci. Eng. 2021, 9, 440. [Google Scholar] [CrossRef]
  45. Hersbach, H.; Bell, B.; Berrisford, P.; Hirahara, S.; Horányi, A.; Muñoz-Sabater, J.; Nicolas, J.; Peubey, C.; Radu, R.; Schepers, D.; et al. The ERA5 Global Reanalysis. Q. J. R. Meteorol. Soc. 2020, 146, 1999–2049. [Google Scholar] [CrossRef]
  46. Gill, A.E. Atmosphere-Ocean Dynamics; Academic Press: New York, NY, USA, 1982. [Google Scholar]
  47. Nash, J.; Alford, M.H.; Kunze, E. Estimating Internal Wave Energy Fluxes in the Ocean. J. Atmos. Ocean. Technol. 2005, 22, 1551–1570. [Google Scholar] [CrossRef] [Green Version]
  48. Zhao, Z.; Alford, M.H.; Mackinnon, J.A.; Pinkel, R. Long-Range Propagation of the Semidiurnal Internal Tide from the Ha-waiian Ridge. J. Phys. Oceanogr. 2010, 40, 713–736. [Google Scholar] [CrossRef] [Green Version]
  49. Leaman, K.D.; Sanford, T.B. Vertical energy propagation of inertial waves: A vector spectral analysis of velocity pro-files. J. Geophys. Res. 1975, 80, 1975–1978. [Google Scholar] [CrossRef]
  50. Gonella, J. A rotary-component method for analyzing meteorological and oceanographic vector time series. Deep Sea Res. Oceanogr. Abstr. 1972, 19, 833–846. [Google Scholar] [CrossRef]
  51. Gill, A.E. On the Behavior of Internal Waves in the Wakes of Storms. J. Phys. Oceanogr. 1984, 14, 1129–1151. [Google Scholar] [CrossRef]
  52. Fu, L.-L. Observations and models of inertial waves in the deep ocean. Rev. Geophys. Space Phys. 1981, 19, 141–170. [Google Scholar] [CrossRef]
  53. Shen, J.; Fang, W.; Zhang, S.; Qiu, Y.; Zhang, J.; Xie, X. Observed Internal Tides and Near-Inertial Waves in the Northern South China Sea: Intensified f-Band Energy Induced by Parametric Subharmonic Instability. J. Geophys. Res. Ocean. 2020, 125, e2020JC016324. [Google Scholar] [CrossRef]
  54. Park, J.J.; Kim, K.; Schmitt, R.W. Global distribution of the decay timescale of mixed layer inertial motions observed by satellite-tracked drifters. J. Geophys. Res. Atmos. 2009, 114, C11010. [Google Scholar] [CrossRef] [Green Version]
  55. Dunphy, M.; Lamb, K.G. Focusing and vertical mode scattering of the first mode internal tide by mesoscale eddy interaction. J. Geophys. Res. Ocean. 2014, 119, 523–536. [Google Scholar] [CrossRef]
  56. Asselin, O.; Thomas, L.; Young, W.; Rainville, L. Refraction and straining of wind-generated near-inertial waves by barotropic eddies. J. Phys. Oceanogr. 2020, 50, 3439–3454. [Google Scholar] [CrossRef]
  57. Kunze, E. Near-Inertial Wave Propagation in Geostrophic Shear. J. Phys. Oceanogr. 1985, 15, 544–565. [Google Scholar] [CrossRef]
Figure 1. The topography of southern SCS and the observation location of the mooring site are marked by the star (red). Three hourly tracks of “Nameless” storms (SID: 2010018N07113, January storm; green dot solid line; and SID: 2010346N09115, December storm, orange dot solid line) are denoted.
Remotesensing 15 00368 g001
Figure 2. Depth-time maps of raw currents in the eastward (a) and northward (b) directions in January 2010.
Remotesensing 15 00368 g002
Figure 3. (a) Seawater density and (b) buoyancy frequency profiles computed from WOA2009.
Remotesensing 15 00368 g003
Figure 4. Spectra for clockwise (red) and anticlockwise (blue) components of the depth-averaged WKB-scaled velocity during January (a) and December (b) 2010.
Remotesensing 15 00368 g004
Figure 5. Depth-averaged velocity amplitudes of raw near-inertial current (blue) and WKB-scaled current (red).
Remotesensing 15 00368 g005
Figure 6. Depth-time maps of raw near-inertial velocities (a,c) and WKB-scaled velocities (b,d) in eastward (a,b) and northward (c,d) directions in January 2010.
Remotesensing 15 00368 g006
Figure 7. Depth-time maps of raw near-inertial velocities (a,c) and WKB-scaled velocities (b,d) in eastward (a,b) and northward (c,d) directions in December 2010.
Remotesensing 15 00368 g007
Figure 8. Depth-time maps of the (a) upward phase propagating eastward near-inertial velocity and (b) downward phase propagating eastward near-inertial velocity components in January 2010.
Remotesensing 15 00368 g008
Figure 9. Depth-time maps of the (a) upward phase (downward energy) propagating eastward near-inertial velocity components and (b) downward phase (upward energy) propagating eastward near-inertial velocity components in December 2010.
Remotesensing 15 00368 g009
Figure 10. Vertical structures of the time-averaged NIKE for the first four modes (mode-1: green line; mode-2: magenta line; mode-3: blue line; mode-4: grey line), the sum of the four modes (black line), and the time-averaged NIKE calculated from the undecomposed near-inertial currents (black dotted line).
Remotesensing 15 00368 g010
Figure 11. Time series of the depth-integrated NIKE for the first four modes. The values in the brackets indicate the percentage of the corresponding modal NIKE in the total NIKE (the sum of the four modes) during the entire observation period.
Remotesensing 15 00368 g011
Figure 12. Time series of the wind (a), the wind speed amplitude (b), and the first strong NIKE (c) are marked by the red dashed rectangle in Figure 10. The values in the brackets indicate the percentage of the corresponding modal NIKE in the total NIKE (the combination of the four modes) during the corresponding observation period. The black dotted line denotes 0:00 on 18 January.
Remotesensing 15 00368 g012
Figure 13. Time series of the wind (a), the wind speed amplitude (b), and the second strong NIKE (c) are marked by the black dashed rectangle in Figure 8. The values in the brackets indicate the percentage of the corresponding modal NIKE in the total NIKE (the combination of the four modes) during the corresponding observation period. The black dotted line denotes 0:00 on 12 December.
Remotesensing 15 00368 g013
Figure 14. Sea level anomaly and the geostrophic currents anomaly from the altimeter data on 22 January 2010 (a), 24 January 2010 (b), 20 December 2010 (c), and 22 December 2010 (d). The observation site is marked by the red star.
Remotesensing 15 00368 g014
Figure 15. (a) Depth-time map of NIKE calculated from the undecomposed near-inertial currents in January 2010; (b) background vorticity at the mooring site during the corresponding observation period.
Remotesensing 15 00368 g015
Table 1. Observational data.
MooringEffective Depths (m)Sampling Time (h)Sampling
Interval
(m)
First MooringWHLS75K ADCP14~39018
WHS150K ADCP1377~14450.54
Second MooringWHLS75K ADCP31~41518
WHS150K ADCP1401~14890.54
Table 2. Time-averaged NIKE in the four seasons.
Kinetic Energy (KJ/m2)Mode 1Mode 2Mode 3Mode 4Sum
Spring0.0180.0320.0360.0210.107
Summer0.0270.0290.0360.0230.115
Autumn0.0150.0430.0370.0250.120
Winter0.0830.0850.0890.0670.324
Disclaimer/Publisher’s Note: The statements, opinions and data contained in all publications are solely those of the individual author(s) and contributor(s) and not of MDPI and/or the editor(s). MDPI and/or the editor(s) disclaim responsibility for any injury to people or property resulting from any ideas, methods, instructions or products referred to in the content.