Article

Study on the Quantitative Precipitation Estimation of X-Band Dual-Polarization Phased Array Radar from Specific Differential Phase

1
Key Laboratory of Land Surface Process and Climate Change in Cold and Arid Regions, Technology Service Center, Northwest Institute of Eco-Environment and Resources, Chinese Academy of Sciences, Lanzhou 730000, China
2
Pingliang Land Surface Process and Severe Weather Research Station, Chinese Academy of Sciences, Pingliang 744015, China
3
Gansu Land Surface Process & Severe Weather Observation and Research Station, Pingliang 744015, China
4
Key Laboratory for Mesoscale Severe Weather/MOE and School of Atmospheric Science, Nanjing University, Nanjing 210023, China
5
Key Laboratory of Transportation Meteorology of China Meteorological Administration, Nanjing Joint Institute for Atmospheric Sciences, Nanjing 210041, China
6
Guangzhou Meteorological Observatory, Guangzhou 511430, China
*
Author to whom correspondence should be addressed.
Remote Sens. 2023, 15(2), 359; https://doi.org/10.3390/rs15020359
Submission received: 31 October 2022 / Revised: 29 December 2022 / Accepted: 3 January 2023 / Published: 6 January 2023

Abstract

:
In this study, the quantitative precipitation estimation (QPE) capability of three X-band dual-polarization phased array radars (PAR) in Guangzhou, South China, was demonstrated, with an S-band operational dual-polarization radar as the benchmark. Rainfall rate (R) estimators based on the specific differential phase (KDP) for summer precipitation for both X-band and S-band radars were derived from the raindrop size distributions (DSDs) observed by a 2-dimensional video disdrometer (2DVD) in South China. Rainfall estimates from the radars were evaluated with gauge observations in three events, including pre-summer rainfall, typhoon precipitation, and local severe convective precipitation. Observational results showed that radar echoes from the X-band PARs suffered much more severely from attenuation than those from the S-band radar. Compared to S-band observations, the X-band echoes can disappear when the signal-to-noise ratio drops to a certain level due to severe attenuation, resulting in different estimated rainfall areas for X- and S-band radars. The attenuation corrected by KDP had good consistency with S-band observations, but the accuracy of attenuation correction was affected by DSD uncertainty and may vary in different types of precipitation. The QPE results demonstrated that the R(KDP) estimator produced better rainfall accumulations from the X-band PAR observations compared to the S-band observations. For both the X-band and S-band radars, the estimates of hourly accumulated rainfall became more accurate in heavier rainfall, due to the decreases of both the DSD uncertainty and the impact of measurement errors. In the heavy precipitation area, the estimation accuracy of the X-band radar was high, and the overestimation of the S-band radar was obvious. Through the analysis of the ZH-ZDR distribution in the three weather events, it was found that the X-band PAR with the capability of high spatiotemporal observations can capture minute-level changes in the microphysical characteristics, which help improve the estimation accuracy of ground rainfall.

1. Introduction

In the late 1970s, the idea of dual-polarization weather radar was put forward by alternately transmitting mutually orthogonal horizontal polarization waves and vertical polarization waves [1]. In addition to the reflectivity factor (ZH), dual-polarization weather radars can measure multiple parameters, such as the differential reflectivity factor (ZDR), copolar cross-correlation (ρhv), differential phase (ΦDP), and the propagation phase shift rate (KDP) [2]. A large number of observational studies have been conducted over the past 20 years, demonstrating that dual-polarization radars can have good performance in quantitative precipitation estimation (QPE) [3,4,5,6,7,8,9,10,11]. With the development of radar technology, dual-polarization radars have made great progress in the detection of various types of weather systems. Currently, the time for most operational radars to complete a volume scan is 5–6 min, which makes it relatively difficult to meet the requirements for the observation of some rapidly developing severe convective weather objects.
Although past studies have proposed to use sufficiently dense and fast radar observations to predict the evolution in 3D structures of severe convective weather [12], this has not been realized after many years of development. The prediction level of the numerical model can be improved with the data assimilation of a set of high-time-resolution radars [13]. However, it is difficult to obtain high-time-resolution data through a mechanical scanning antenna. Although some radars used for scientific research can provide fast scanning in a very short time, most mechanical scanning radars used for operational observation still cannot meet the requirements [14].
More recently, phased array antennas have been used for weather radars [15]. Each radiation unit in the phased array antenna is independently controlled in phase and amplitude and can obtain accurate beam pointing to realize the observation in arbitrary directions. Currently, phased-array radars (PARs) usually use electronic scanning in at least one direction (e.g., in elevation) and have an agile beam steering strategy. Usually, PARs can complete the scanning of the whole airspace in 1–2 min, much more rapidly than conventional dish-based radars, and obtain a large amount of meteorological information at the same time [16,17,18,19,20,21]. To accurately capture the 3D structure of convective bubbles in convective clouds within 1–3 min [22] and the structure of downburst flow [23], a phased array dual-polarization weather radar will be the first choice. Additionally, phased array dual-polarization radar can also carry out data assimilation with high temporal and spatial resolution [21] and more accurate ground QPE [24,25]. In terms of precipitation nowcasting, PARs have the advantage in terms of 3D motion tracking at spatial scales of 1–10 km up to several minutes [22].
Nowadays, more and more PARs have been built by the weather service, but there are few studies on QPE using PARs. China’s meteorological administration has an X-band dual-polarization PAR network in Guangzhou. Because of the variabilities of DSD characteristics in different regions, the past rain rate estimators are not suitable for these radars. In this study, the QPE capability was evaluated by using three X-band dual-polarization PARs in Guangzhou and combining them with two-year DSD data in South China. Section 2 introduces the test instruments and basic methods. The T-matrix method was used to simulate the corresponding dual-polarization radar variables. In Section 3, the corresponding dual-polarization radar QPE relationship was established with gauge observations to test the QPE performance. In Section 4, the microphysical characteristics of different types of rainfall were analyzed, and the results of the tests were discussed and summarized in Section 5.

2. Data and Methods

2.1. PARs and DSD Measurement

The data for this study were obtained by X-band dual-polarization PARs (wavelength: 3.2 cm) deployed by the Guangzhou Meteorological Bureau in Panyu (23°N, 113.31°E), Nansha (22.78°N, 113.56°E), and Huadu (23.42°N, 113.24°E), as well as the Guangzhou S-band dual-polarization radar (wavelength: 10.4 cm) at 23°N, 113.35°E (Figure 1). The PARs adopt one-dimensional electronic phased array scanning, which means that the scanning in the vertical direction is electrical and the scanning in the horizontal direction is mechanical. The antenna of the PARs consists of 64 solid-state transmit/receive (T/R) modules. The transmitter’s peak power was 256 w, and the dynamic range was over 85 dB. The PARs incorporated pulse compression by transmitting a long coded pulse (20 μs) and processing the received echo to obtain a relatively narrow pulse (0.2 μs). The 12-layer elevation scanning in the vertical direction took only approximately 0.25 s, and the time to complete a volume scanning was 1.5 min. The rapid evolution of weather systems within 5–40 km of the radar can be observed with dual-polarization information. The Guangzhou S-band dual-polarization radar had an observation range of 230 km, the attenuation of which was very small. It took ~6 min for the Guangzhou S-band radar to complete a volume scan.
Two years of DSDs observed by a two-dimensional video disdrometer (2DVD) located in FOSHAN were used to derive simulated dual-polarization radar parameters and radar-based QPE relationships. The newly designed third-generation 2DVD was equipped with faster cameras. For reduced splash effects, only the drops inside the measurement inlet were counted. The vertical and horizontal resolutions of raindrop diameter were both better than 0.19 mm. The 1-min-averaged data with a total number of drops less than 50 or rain rate < 0.1 mm/h were considered noise and discarded [26,27].

2.2. Parameterization of Radar

Using the T-matrix scattering simulation method [28], the corresponding dual-polarization radar variables can be calculated based on the DSD observations. In this study, the axis ratio model of raindrops in [29] was used in the scattering simulation, the raindrop temperature was set at 10 °C, and the mean inclination angle was set at 0°. The equivalent radar reflectivity factor Zh,v (mm6 m−3) was defined as follows:
Z h , v = 4 λ 4 π 4 | K w | 2 D min D max | f h h , v v ( π , D ) | 2 N ( D ) d D
where D (mm) was the equivalent diameter of the raindrops, N(D) (m−3 mm−1) corresponded to the number concentration of raindrops in a specific particle size range in a unit volume, λ was the radar wavelength, and Dmin and Dmax were the minimum and maximum equivalent diameters of the actual DSD, respectively. Kw was the dielectric constant value of liquid water, and fhh,vv(π, D) (mm) represented the backscattering amplitude in the horizontal or vertical direction. The logarithmic form of the horizontal equivalent reflectivity factor ZH = 10log10(Zh) had a unit of dBZ. The specific differential phase KDP (°km−1) was calculated based on the forward scattering amplitude f(0, D) (mm):
K DP = 180 π λ D min D max R e [ f h h ( 0 , D ) f v v ( 0 , D ) ] N ( D ) d D
where Re represents the real part of the integral, while fhh(0, D) and fvv(0, D) (mm) are the forward scattering amplitudes in the horizontal and vertical directions, respectively. The rain rate R(mm/h) can be calculated by:
R = 0.6 π × 10 3 D min D max D 3 v ( D ) N ( D ) d D
where v(D) was the terminal velocity (m s−1).
A large number of studies show that R(KDP) was less affected by the DSD uncertainty than R(ZH), since Zh, KDP, and R are approximately proportional to the 6th, 4.24th, and 3.67th moments of the DSD. R(KDP) also had an advantage for QPE in the mixed precipitation of rain and hail because KDP was only sensitive to rainfall considering the irregular shapes of hailstones and the continuous rolling and rotation behaviors in the falling processes. In addition, KDP was not affected by calibration error, attenuation, or partial beam blockage if the signal-to-noise ratio was high enough. Previous studies have shown that radar QPE relationships are different under different climatic backgrounds [5,30,31]. Before using X-band phased array dual-polarization radar to quantitatively estimate the rainfall in the summer precipitation processes in Guangzhou and using the S-band radar for evaluation, it was necessary to establish QPE relationships for them based on the DSD observations.

2.3. QPE Algorithm and Quantification

To quantitatively evaluate the estimation results of each QPE relationship, the normalized absolute error (NE), root-mean-square error (RMSE), and correlation coefficient (CC) were calculated:
N E = i = 1 N [ | R K DP ( i ) R G ( i ) | ] i = 1 N R G ( i )
R M S E = [ 1 N i = 1 N [ R K DP ( i ) R G ( i ) ] 2 ] 1 / 2
C C = i = 1 N [ R K DP ( i ) R K DP ¯ ] [ R G ( i ) R G ¯ ] [ i = 1 N [ R K DP ( i ) R K DP ¯ ] ] 1 / 2 [ i = 1 N [ R G ( i ) R G ¯ ] ] 1 / 2
where R K DP was the rainfall or rainfall rate estimate from KDP and R G was the reference value. R K DP ¯ and R G ¯ were the corresponding mean values. N was the sampling number.
A total of 8341 one-minute-averaged DSD data points in Foshan were used to calculate the X-band and S-band dual-polarization radar variables as well as the rain rates. The R-KDP relationships were fitted by the least squares method (Figure 2), given as R ( K DP ) = 21.75 K DP 0.84 for the X-band and R ( K DP ) = 58.01 K DP 0.785 for the S-band. It should be noted that coefficient a can be affected by local climatology. The R(KDP) estimators derived from the 2DVD data in South China can represent the unique DSD characteristics in that specific area and allow more accurate QPEs, which differ from the relationships in other regions. Overall, the coefficient of the R-KDP relationship for X-band radars in South China was higher than that for continental precipitation, e.g., R ( K DP ) = 18.15 K DP 0.79 and R ( K DP ) = 14 K DP 0.75 [6,8]. For a given KDP, e.g., 1°km−1, the estimated rainfall was nearly 20–37% higher than the value obtained using the continental relation. In Figure 2, for the same rainfall rate (R < 60 mm/h), the KDP value of the X-band radar was approximately 2–4 times that of the S-band. In addition, a Zh-R relationship was also fitted, as shown in Table 1 for further comparison.
Figure 3 shows the R(KDP) and intrinsic R directly calculated from the DSDs observed by the 2DVD, demonstrating the performance of R(KDP) under “ideal conditions” by neglecting measurement errors. For X-band, NE = 0.06, RMSE = 5.63 mm/h, and CC = 0.98; for S-band, NE = 0.08, RMSE = 7.19 mm/h, and CC = 0.97. According to the results, the R(KDP) for X-band was better than S-band with a lower NE, a lower RMSE, and a higher CC.

2.4. Attenuation Correction

The electromagnetic wave is attenuated by the scattering and absorption of precipitation particles. Attenuation is directly positively correlated to the rainfall rate, which gets more obvious with the shorter radar wavelength. The ZH and ZDR of C-band and X-band radars will be severely underestimated after heavy precipitation. The attenuated ZH and ZDR would lead to obvious errors if they were directly used for rainfall estimation or microphysical parameter retrieval. Therefore, it was necessary to make the attenuation correction before quantitative retrieval in our study. After upgrading to the dual-polarization capability, KDP was not affected by attenuation when the signal-to-noise ratio was large enough, and there was an approximately linear relationship between KDP and attenuation. The application of KDP greatly improves the accuracy of attenuation correction.
The specific horizontal attenuation AH and the specific differential attenuation ADP can be approximately expressed in terms of KDP as follows:
A H = a 1 K DP b 1
A DP = a 2 K DP b 2
The attenuation correction relationships obtained by least squares fitting using DSD data for the PARs were A H = 0.32 K DP 1.04 and A DP = 0.03 K DP 1.19 (Figure 4).
On 2 May 2018, the Panyu PAR observed a heavy precipitation weather process (Figure 5). Combined with the data from the Guangzhou S-band radar, it can be seen that the PAR severely attenuates in the heavy rainfall area, and the rain area after a strong echo cannot be detected. After attenuation correction using KDP, the echoes within and after the strong echo region were enhanced. To further evaluate the performance of attenuation correction, the observations from the S-band radar, 4 km away from the Panyu PAR, were used for quantitative comparison (Figure 6). The ZH observed by the X-band PAR was rapidly attenuated within and after the severe rainfall region. After attenuation correction, the echo in the heavy rainfall area was similar to that of the S-band radar, with some inconsistency probably attributed to the differences in instrument location and radar wavelength.

3. Quantitative Precipitation Estimation

The Asian monsoon has a strong influence on the climate in Guangzhou. Warm and moist air is transported from the ocean to the continent of China during the summer monsoon season (May–September), creating a favorable environment for convective activities in the region. In this period, there is pre-summer rainfall, typhoon precipitation, and severe convective precipitation, and these weather events account for the majority of the annual precipitation. Three heavy precipitation weather events in Guangzhou on June 7 (pre-summer rainfall), August 19 (typhoon precipitation), and September 4 (severe convective precipitation) in 2020 were selected for QPE evaluation. Two hours of observation data were selected for each weather process, and the accuracy of the radar estimation of the ground rainfall rate was evaluated by gauge observations. The calculation steps of radar QPE corresponding to the point-to-point observation results of each gauge observation were as follows: (1) the coordinates of the two radars were converted from the polar coordinate system into a rectangular coordinate system, and the volume of scan data of the two radars was gridded, and the dual-polarization radar variables within 1000 m × 1000 m at a 1000 m height were selected and averaged; (2) the precipitation intensity corresponding to each group of volume scan data was estimated by using the precipitation relation R(KDP), and it was accumulated hourly; (3) the radar-estimated rainfall data were interpolated to the rainfall station. Figure 7 shows the scatter diagram and the number density function (NDF) of precipitation estimation using the R(KDP) relationship and surface rainfall stations. It can be seen that NE was 0.27, RMSE was 6.53 mm, and CC was 0.91 for the estimated hourly accumulated rainfall by the X-band PAR of the three weather processes. For the S-band radar, NE was 0.32, RMSE was 7.52 mm, and CC was 0.90. When the hourly accumulated rainfall was relatively low (<10 mm), the diversity of the results was high, mainly because the accuracy of KDP was affected by the measurement errors in weak precipitation areas. When the hourly accumulated rainfall > 10 mm, the estimation results were closer to the gauge observations. Overall, the accuracy of the X-band radar R(KDP) was better than that of the S-band radar, mainly because the KDP value of the X-band radar was much higher than that of the S-band radar and because it was not easily affected by radar miscalibration, attenuation, and uncertainty in precipitation microphysical characteristics. In areas with heavy precipitation, the estimation accuracy of the X-band radar was high, and the overestimation of the S-band radar was more obvious.
Table 2 summarizes the comparison results. When the hourly accumulated rainfall was lower than 10 mm, there was little difference between the X-band and S-band, and the NE, RMSE, and CC of R(KDP) were 0.64, 4.04 mm, and 0.3 for the X-band radar, and 0.63, 4.5 mm, and 0.31 for the S-band radar, respectively. When the hourly rainfall was greater than 10 mm and less than 30 mm, the NE, RMSE, and CC of R(KDP) were 0.26, 6.21 mm, and 0.7 for the X-band radar, and 0.34, 5.68 mm, and 0.6 for the S-band radar, respectively. For hourly accumulated rainfall larger than 30 mm, the NE, RMSE, and CC of R(KDP) are 0.13, 5.68 mm, and 0.95 for the X-band radar, and 0.2, 10.28 mm, and 0.92 for the S-band radar, respectively. As pointed out by [32], KDP is proportional to D4.24 for larger drop sizes, whereas KDP is proportional to D5.6 for smaller drop sizes. The rain rate is approximately proportional to the 3.67th moment of the DSD. For light rainfall, raindrop size is comparatively small, and the KDP is more easily influenced by the changes in DSD compared to the results in heavy rainfall. This could also help to explain the low accuracy of R(KDP) for measuring light rainfall, in addition to the relatively high uncertainty in KDP in light rainfall. These results also show that QPE can be improved by considering the temporal and spatial variability of the DSD relationship.
Figure 8a–c shows the ZH, ZDR, and KDP of the 2.7 elevation plan position indicator (PPI) scan of the pre-summer rainband. There was a large area of intense rainfall embedded in the stratiform precipitation region. In convection centers, the ZH values can exceed 55 dBZ, the ZDR exceeds 2.5 dB, and the KDP reaches 8°/km, indicating that the instant rain rate can exceed 112 mm/h. The precipitation in the stratiform regions was modest and uniformly distributed, with ZH less than 30 dBZ, ZDR less than 1 dB, and KDP less than 2°/km. In Figure 8a–c, KDP corresponding to the large ZH was substantially different, demonstrating that the application of R(KDP) to QPE can reveal more detailed features of precipitation. PPI scans of the typhoon rainband are shown in Figure 8d–f. It can be found that ZDR was mostly less than 2 dB in areas of high reflectivity factor (40 < ZH < 55 dBZ). ZDR was an excellent indicator of the median drop diameter, and the typhoon precipitation mostly consisted of small raindrops. Figure 8g–i shows the values of ZH, ZDR, and KDP for the severe convective rainband. The ZH in the leading convective region exceeded 55 dBZ, with ZDR over 3 dB and KDP reaching 8°/km. The volume scanning data showed that the 30-dBZ radar echoes in the convective region can reach 10 km, much higher than those of the pre-summer rainfall event (about 6.7 km) and the typhoon (about 5 km). Because 30 dBZ was commonly used to determine how high the updraft could transport precipitation-size ice particles [33], Figure 8 suggested that the severe convective rainband had a more distinct ice-phase process with larger particles owing to the strong updraft. In addition, the severe convective rainband consisted of larger raindrops than the other two events.
Figure 9 shows the distribution of the hourly accumulated rainfall for all the volumes of scan data observed by X-band radar and S-band radar. The scatter diagram in the figure corresponds to the location of gauge observations, and the color indicates the ratio of the hourly accumulated rainfall estimates and independent gauge observations. The ratio less than or greater than 1 indicates that the radar QPE results were underestimated or overestimated. The gauges within the effective range of radar observations provided the 5-min surface cumulative rainfall observations, and the data were used for the point-to-point evaluation of the X-band and S-band radars. Figure 9a,b shows the pre-summer rainfall event in Guangzhou observed using the X-band PAR at Huadu station and the S-band radar station between 10:00 and 11:00 on 7 June 2020, Beijing time. During this period, the maximum hourly accumulated rainfall observed by the gauge observations was 64 mm, and the maximum hourly accumulated rainfall estimated from the X-band radar and S-band radar in the heavy rainfall center was greater than 80 mm. The NE value for the X-band radar was 0.24, the RMSE value was 6.33 mm, and the CC value was 0.97. The NE value of the S-band radar was 0.33, the RMSE value was 9.29 mm, and the CC value was 0.94. In the echo center area of 113.1°E–113.3°E, the error ratio between the gauge observations and the radar-estimated rainfall was lower than 1.3. Because the attenuation of the X-band radar was severe in the heavy rainfall area, especially in the area to the east of 113.5°E, it was difficult for the X-band radar to observe effective precipitation, which means that the X-band radar severely underestimates precipitation in this area. Figure 9c,d shows the precipitation in Typhoon Higos observed by the X-band PAR radar at Nansha station and the S-band radar between 13:00 and 14:00 Beijing time on 19 August 2020. The maximum hourly accumulated rainfall observed by the gauge observations at that time was ~30 mm. In the heavy rainfall center of the typhoon storm zone, the accuracy of the X-band radar was better than that of the S-band radar. The NE value of the X-band radar was 0.24, the RMSE value was 4.49 mm, and the CC value was 0.9; the NE value of the S-band radar was 0.35, the RMSE value was 5.54 mm, and the CC value was 0.77. It can be found that the accumulated rainfall estimated by the X-band PAR radar was more evenly continuous than the S-band radar, indicating that the data with a high temporal resolution of the X-band PAR radar can observe the fast evolution of the typhoon precipitation. Figure 9e,f shows the local heavy precipitation observed by the X-band PAR at Panyu station and the S-band radar between 17:00 and 18:00 Beijing time on 4 September 2020. The gauge observations showed that the maximum hourly accumulated rainfall at that time was ~40 mm, the NE value of the X-band radar was 0.39, the RMSE value was 7.2 mm, and the CC value was 0.84. The NE value for the S-band radar was 0.44, the RMSE value was 10.59 mm, and the CC value was 0.74. Table 3 summarizes the reliability of the rainfall estimators for the X-band and S-band radars.
In the three weather processes, the QPE performance of the X-band PAR and the S-band weather radar was different. In the pre-summer rainfall process, both of them have high estimation accuracy for heavy precipitation. However, the attenuation effect of the X-band in the strong echo area cannot be ignored, which can probably be supplemented by observations of the X-band radars in other directions. For typhoons and local severe convective rainfall events with very fast movements, the X-band PAR radar’s fast volume scan mode can capture weather evolution more accurately than the S-band radar.

4. Relation to Microphysical Characteristics

The performance of the radar QPE is affected by the microphysical characteristics of precipitation systems, as shown in many studies [34,35,36]. The microphysical characteristics of precipitation are closely related to the intensity and system type of precipitation and can vary season-by-season. The difference in surface microphysical characteristics in the precipitation process can be represented by its DSDs. The dual-polarization radar variables can also represent the DSD characteristics of precipitation. For example, ZH represents the overall intensity of the reflected echo of precipitation particles, and its value is jointly affected by the concentration of precipitation particles and the average particle size. ZDR is mainly affected by the average size of the precipitation particles. The combined distribution of ZH-ZDR values is usually used to study DSD characteristics. For a given ZH value, the larger (or smaller) the ZDR value is, the larger (or smaller) the average size of the DSD. In contrast, for a given ZDR value, the larger (or smaller) the ZH value is, the higher (lower) the particle swarm number concentration. For the three heavy precipitation events in this study, the characteristics of ZH-ZDR relationships were analyzed. The advantages of X-band PAR in QPE were shown from the perspective of microphysics, which may help deepen the understanding of the impact of microphysics on radar QPE.
Figure 10 shows the normalized density of ZH-ZDR at 1 km height in the pre-summer rainfall observed by the Huadu PAR between 10 and 11 a.m. Beijing time on 7 June 2020. The results for the Guangzhou S-band radar are also shown for comparison. There were three X-band PAR volume scans corresponding to the S-band radar volume scan observations. The color represents the normalized occurrence frequency of the corresponding ZH-ZDR value. As shown in Figure 10a–c, the ZH value changed little in this period, but the ZDR value decreased gradually. It meant that the concentration of small raindrops in the cloud increased rapidly in this period, and the ground rainfall in this period was mainly generated by high concentrations of raindrops. The S-band radar only made a volume scan once in this period and cannot observe the changing characteristics of microphysics in the corresponding cloud.
Similar to Figure 10 and Figure 11, they give the results of Typhoon Higos observed by the Nansha PAR and the S-band radar on 19 August 2020, Beijing time. Compared with pre-summer rainfall, the raindrop diameter of precipitation in typhoon weather was much smaller, which indicated that precipitation was mainly contributed by high raindrop concentration and the raindrop diameter did not play a leading role, similar to the conclusion by [30]. The S-band radar data also revealed that typhoon precipitation was mainly caused by small raindrops.
Figure 12 shows the normalized density of ZH-ZDR of the local heavy precipitation weather events observed by the Panyu PAR and the S-band radar station between 17:00 and 18:00 on 4 September 2020. Figure 12a–c shows that the ZH and ZDR values increased rapidly within one minute (Figure 12b), which indicated that the diameter of the raindrops in the cloud increased rapidly during this period. The rainfall was mainly contributed by large raindrops. In the next one and a half minute period, the ZDR value decreased rapidly, indicating that the concentration of small raindrops in the cloud increased rapidly in this period and that the ground rainfall in this period was mainly contributed by the high concentration of raindrops. During this time, the S-band radar cannot observe the variation characteristics of the corresponding microphysical processes. This can probably explain why the rainfall obtained by the X-band radar was better than that obtained by the S-band radar.

5. Conclusions

Based on the observation of X-band dual-polarization PARs and a 2DVD, the radar QPE results of the summer precipitation system in Guangzhou, China, were evaluated and improved. First, based on 2DVD observations, the QPE relations R(ZH) and R(KDP) suitable for summer precipitation in the Guangzhou urban area were established for X-band dual-polarization radars. Using the established QPE relationship, the overall precipitation estimation and evaluation of the effective precipitation process of the pre-summer rainband, the typhoon precipitation rainband, and the local severe convective precipitation rainband observed in Guangzhou in 2020 were carried out. Based on the difference in ZH-ZDR microphysical characteristics, the microphysical variation characteristics of the three rainfall processes were discussed, and the reason why the X-band PAR quantitatively estimates the ground rainfall rate better than the S-band radar was proposed. The main conclusions are summarized as follows:
(1)
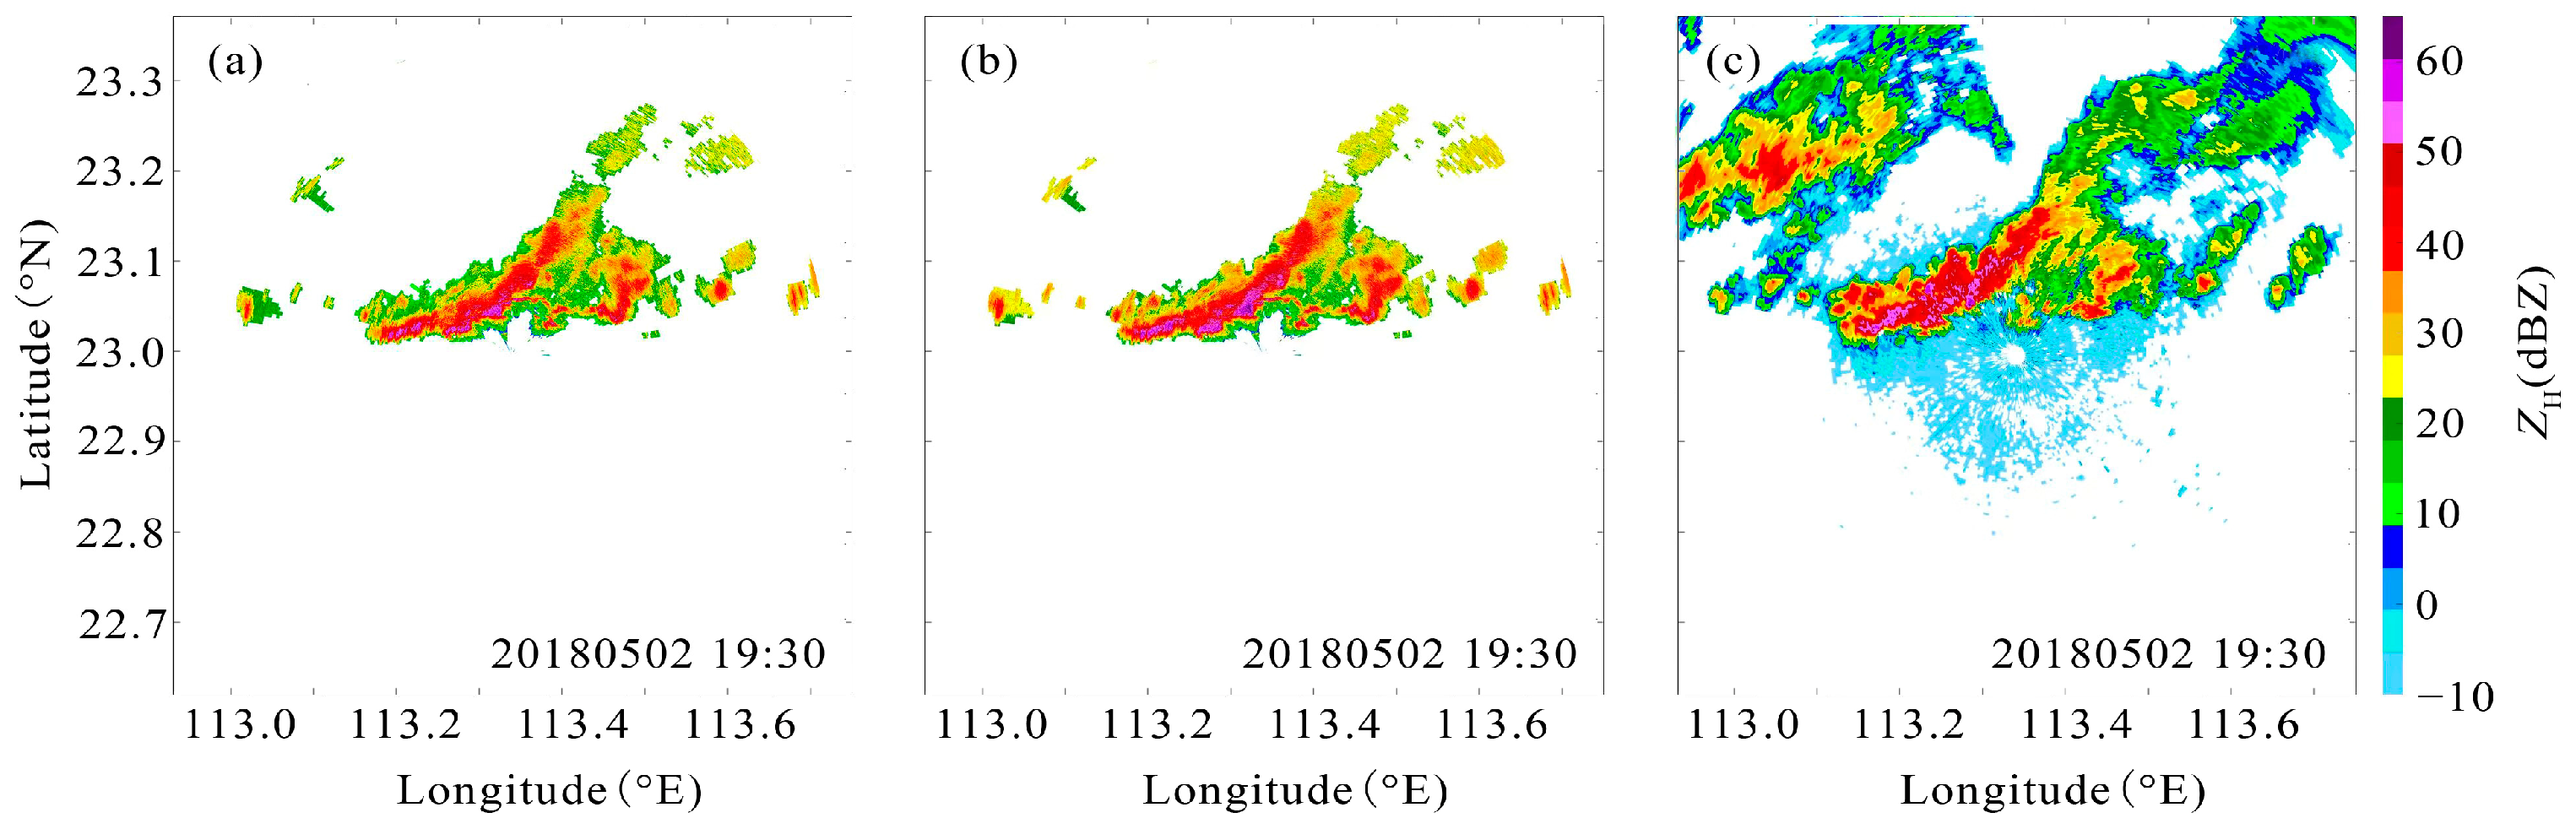
First, the two-year summer DSD observations by a 2DVD in South China and the T-matrix simulation algorithm were used to calculate the corresponding dual-polarization radar variables. The attenuation correction relationships for X-band dual-polarization radars were established. Through an example, it was found that the KDP-AH relationship can correct the X-band attenuation to a certain extent. However, in heavy rainfall, the far-end correction performance was not good (Figure 5 and Figure 6). The disagreement between the attenuation-corrected measurement of the X-band PARs and the S-band measurement was mainly due to DSD uncertainty in attenuation correction, measurement errors, the lack of co-location of the radars, and the wavelength difference. Compared to S-band observations, the X-band echoes can disappear when the signal-to-noise ratio drops to a certain level due to severe attenuation, resulting in different estimated rainfall areas for X- and S-band radars. This could be partially compensated by the cooperative observation of radar networks in the future.
(2)
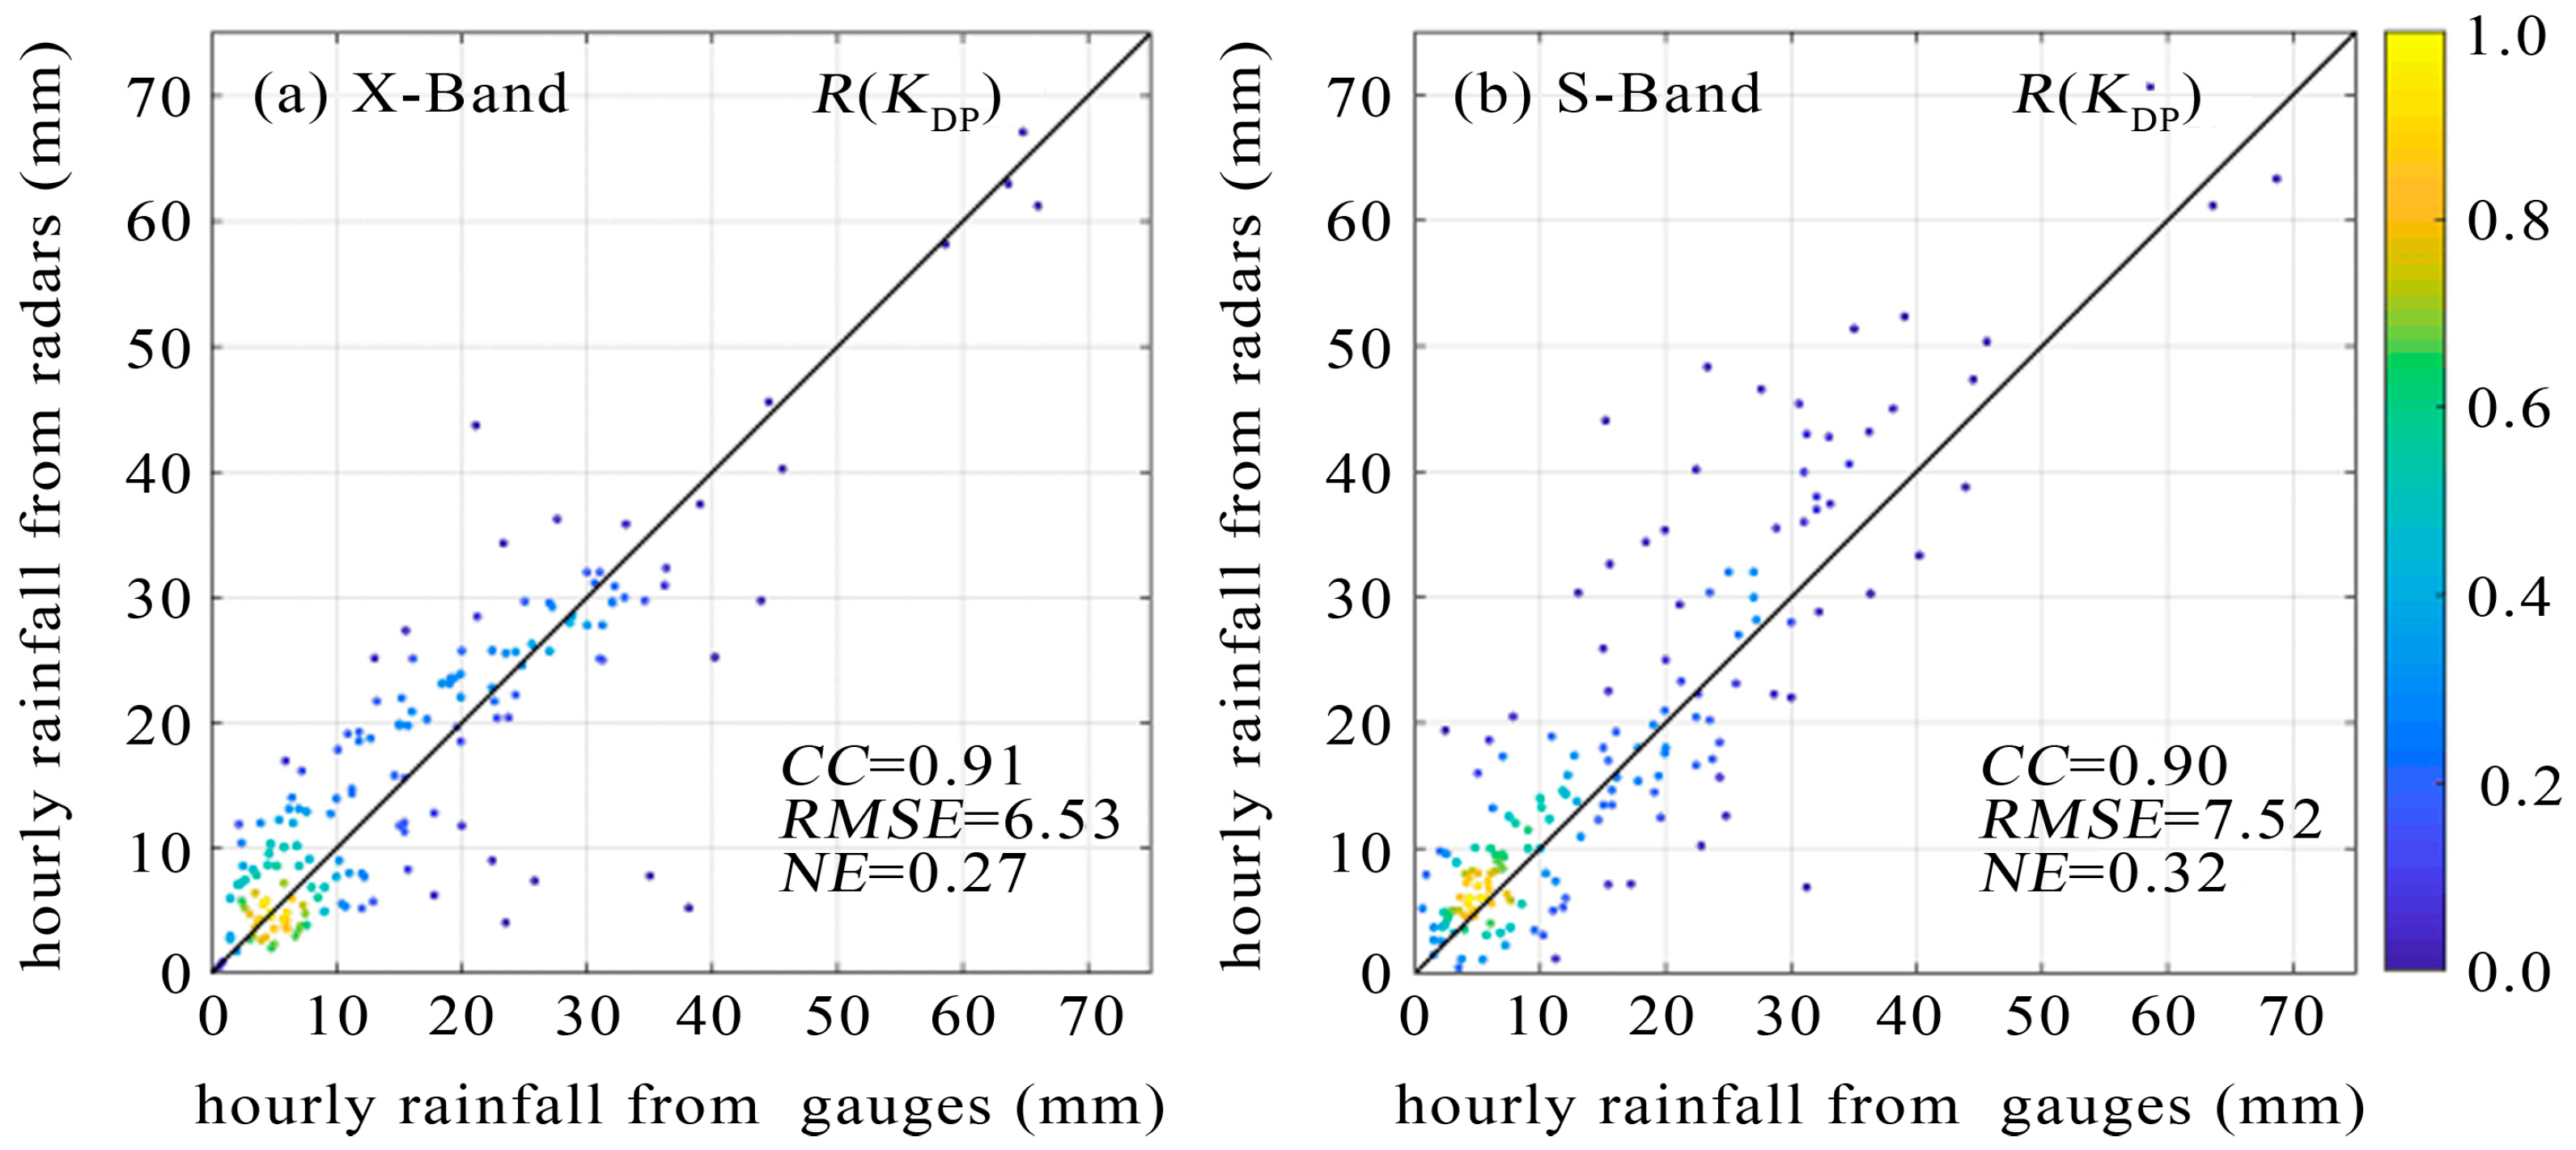
The precipitation relations R(Zh) and R(KDP) for X-band and S-band dual-polarization radars were established. The results showed that there were some differences between the corresponding coefficients of each relationship. For the same rainfall rate, the KDP value of the X-band polarization radar was approximately 2–4 times that of the S-band, which shows that KDP observed by short-wavelength radars has a higher sensitivity for QPE than that of S-band radars. The estimated R(KDP) of the fitted relationship was compared with the rainfall rate R directly calculated from DSD data, and it was found that the X-band estimator was better than that of the S-band radar.
(3)
The radar QPE results of the three precipitation processes (the pre-summer rainband, typhoon precipitation rainband, and local severe convective precipitation rainband) in 2020 were evaluated. When the rain rate was low (e.g., <10 mm/h), the X-band and S-band radars had great uncertainty for rainfall estimation. As the rainfall got more intense, the KDP was less affected by the DSD uncertainty and measurement errors, and the accuracy of the X-band and S-band radar to estimate the rain rate improved. It is also noted that there was an overestimation for the heaviest rainfall, while the estimates from the X-band PAR radar were more accurate than those from the S-band radar. For fast-moving weather systems, the X-band PARs demonstrated the advantages of temporal resolution. However, the X-band’s attenuation impact in the strong echo area cannot be disregarded and can be supplemented by observations of the X-band radars in other directions, which is why more and more X-band PAR radar networks are being constructed.
(4)
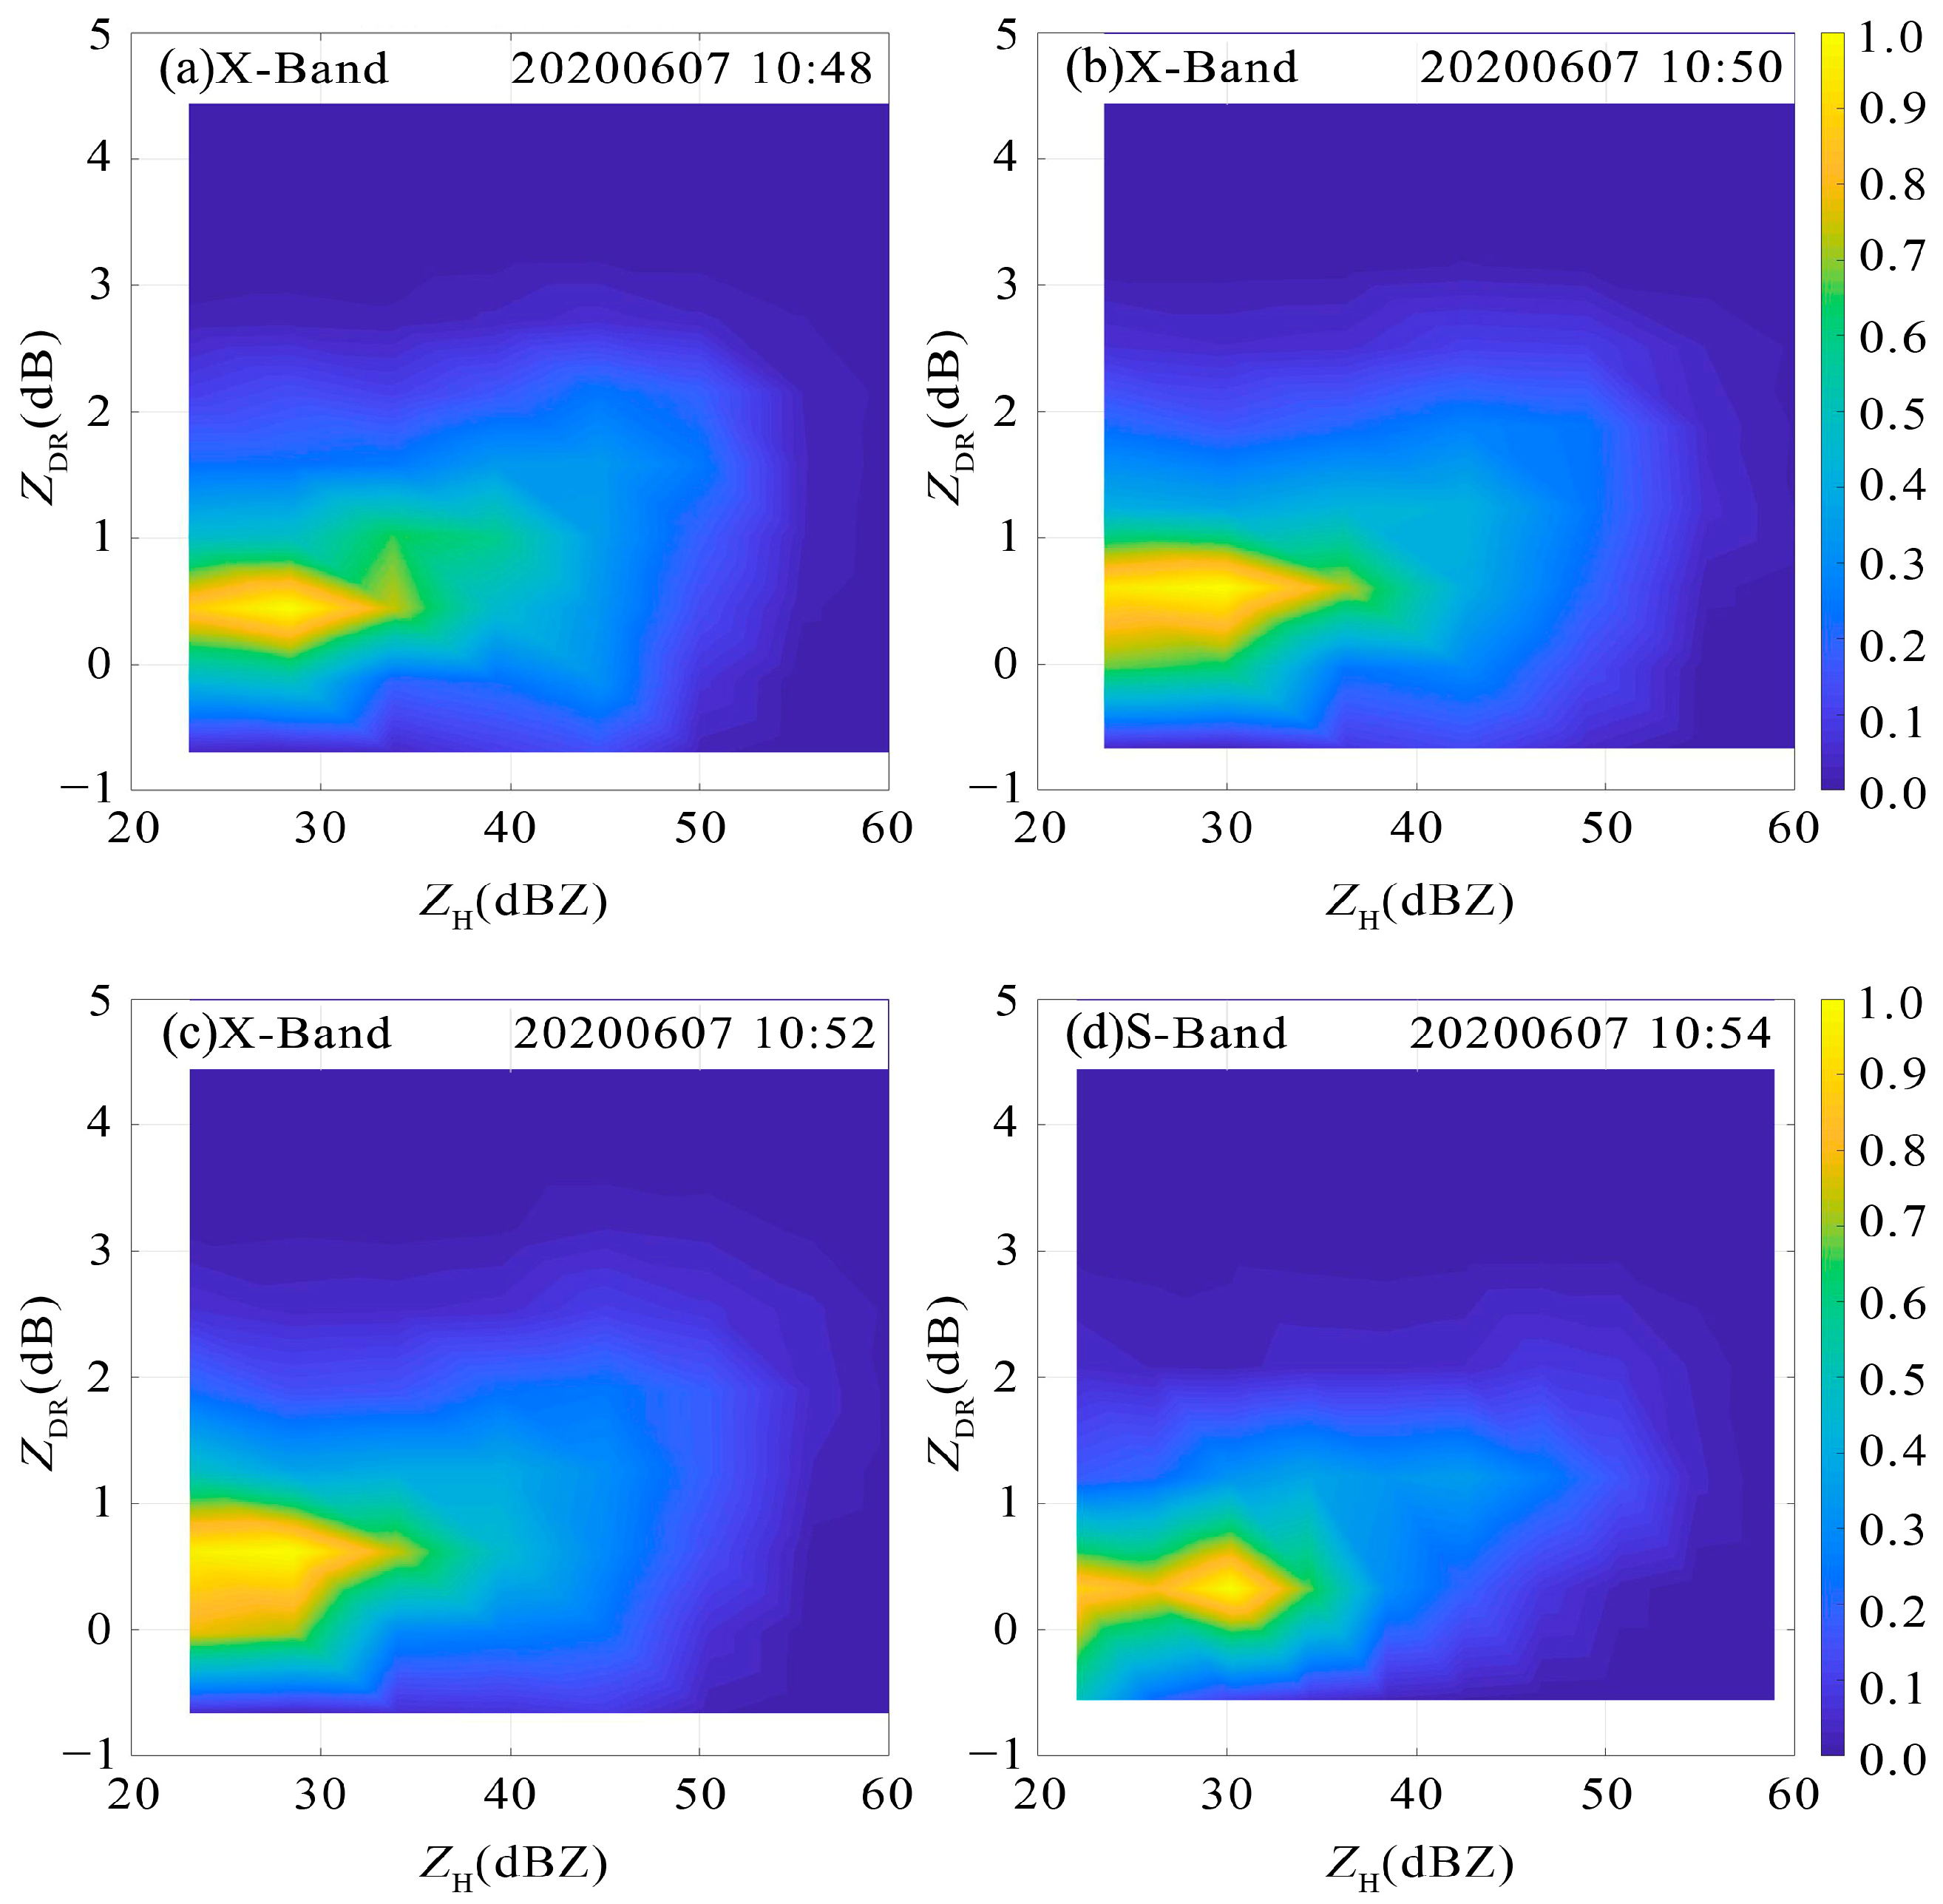
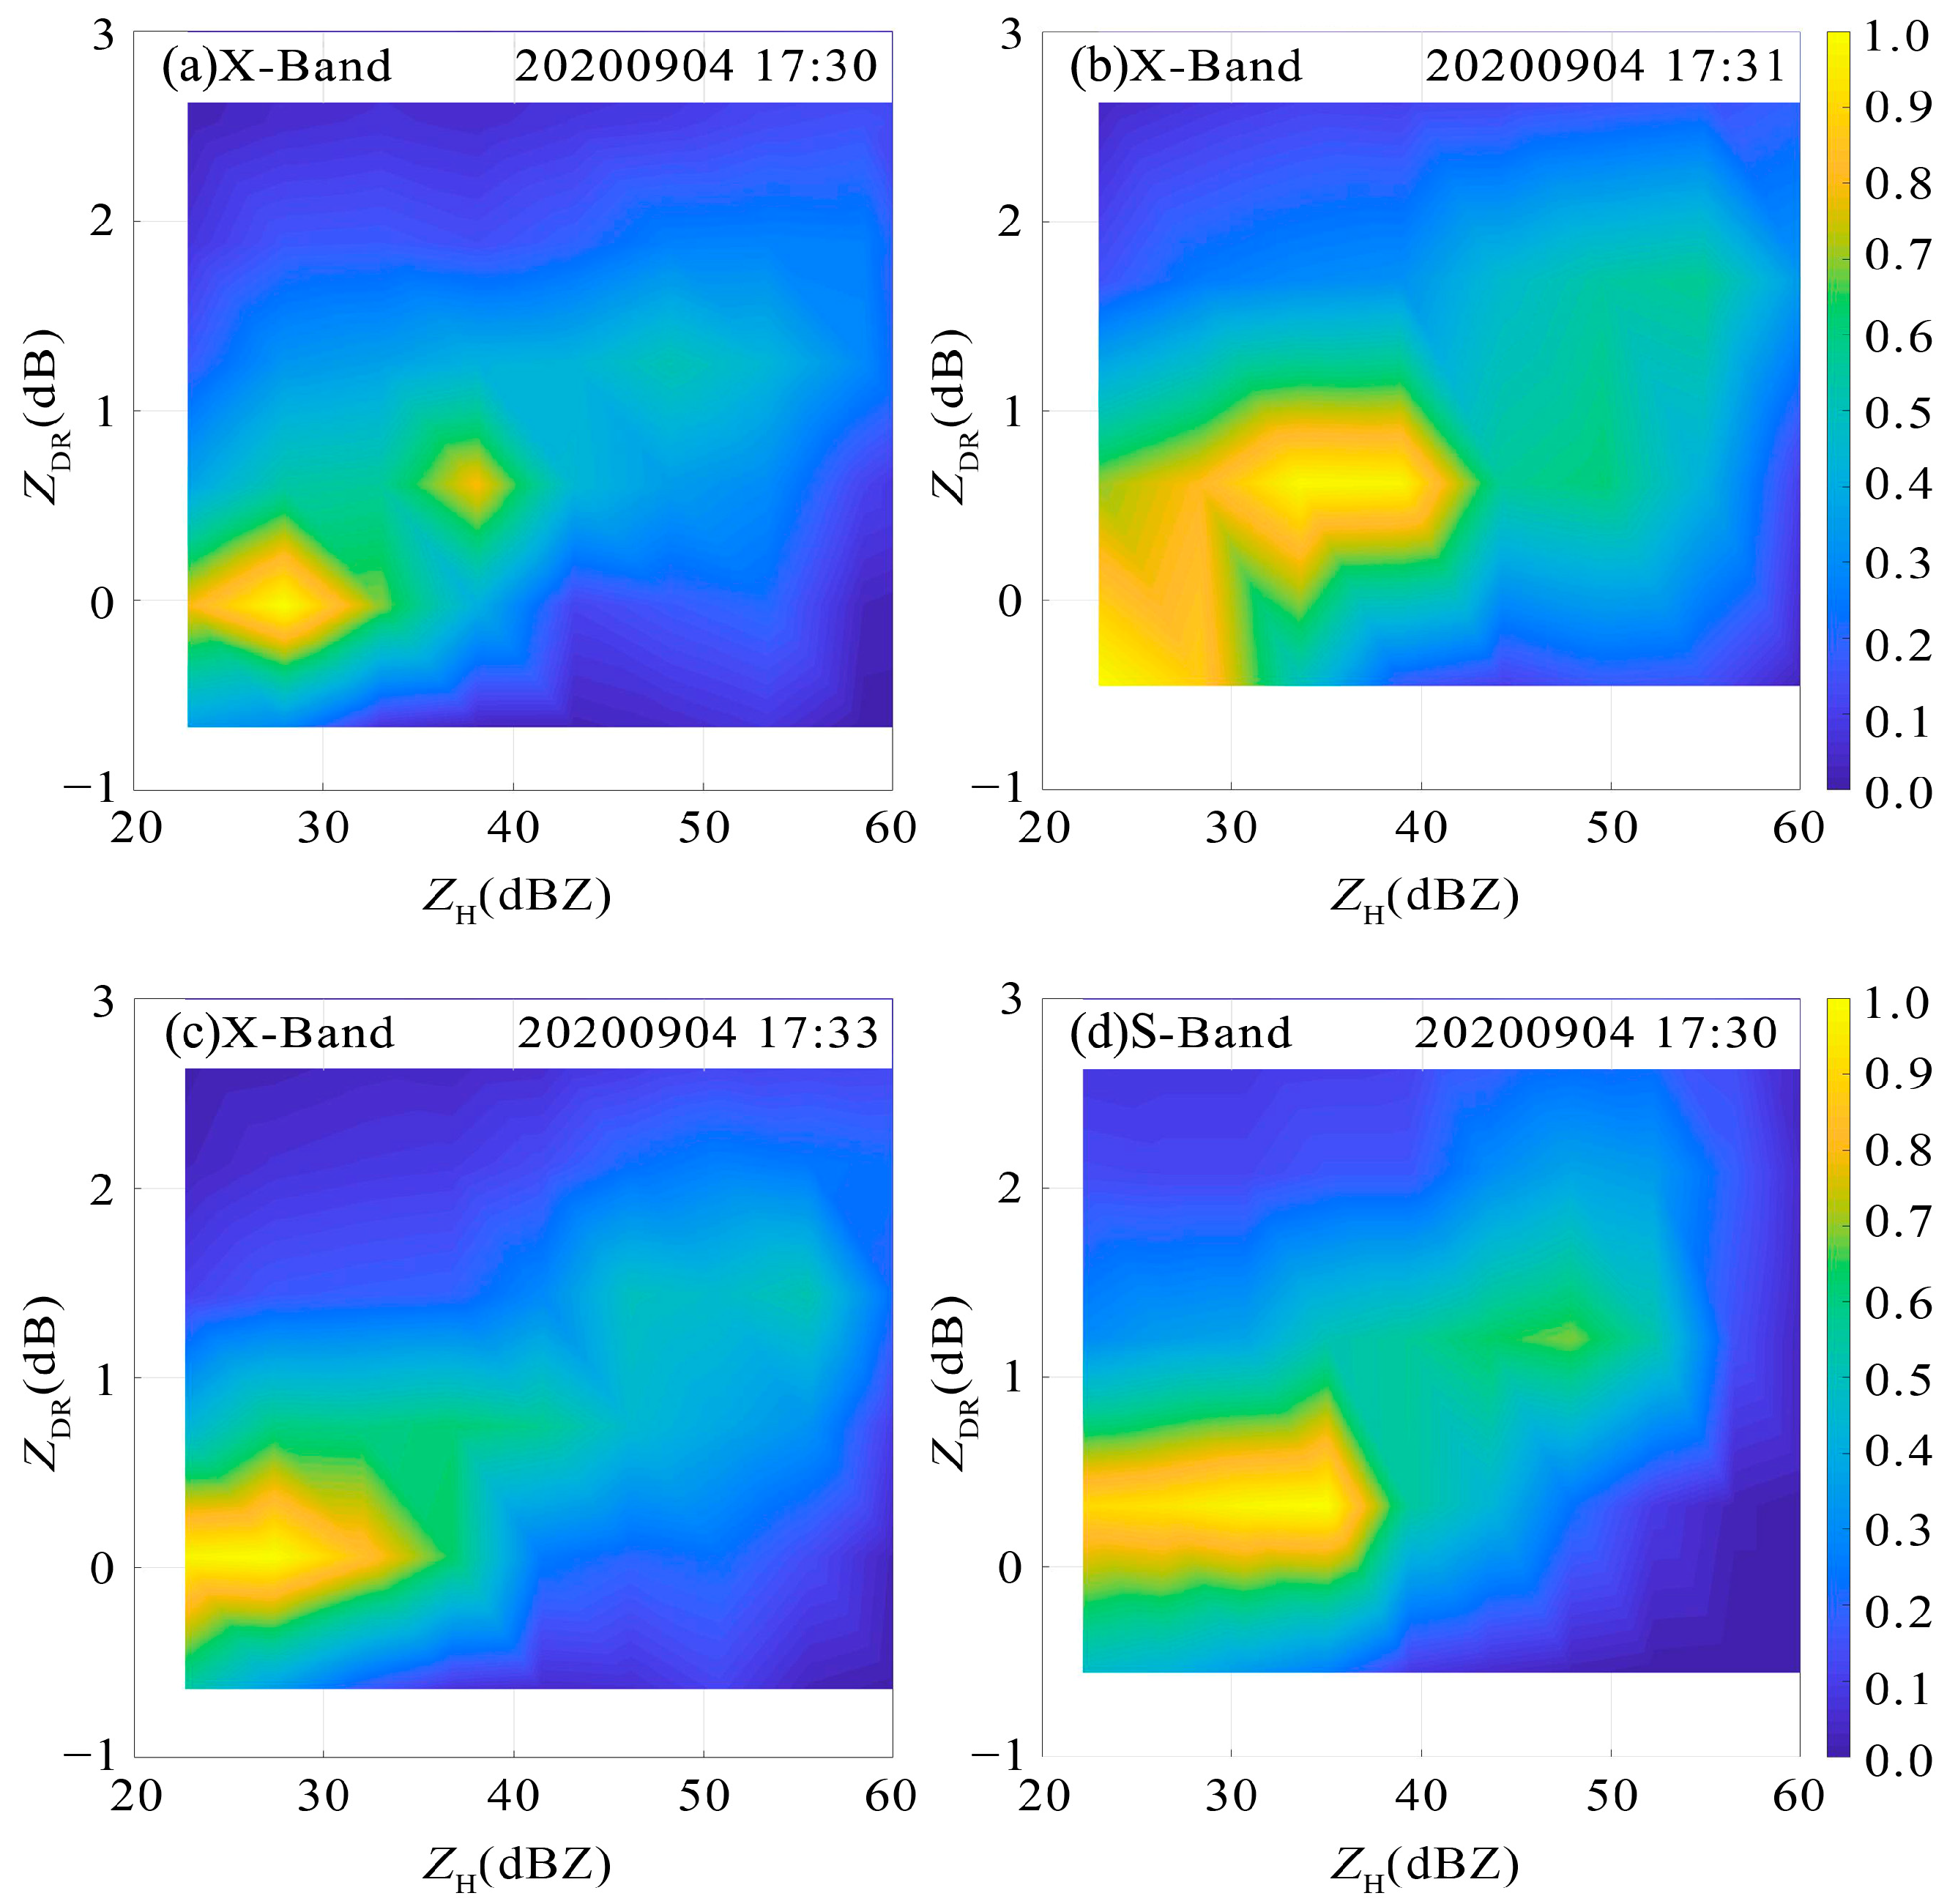
The ZH-ZDR distributions were useful for determining the variety of DSDs in various precipitation systems. It was found that the mean size of raindrops in the typhoon precipitation rainband was smaller than the other two events, and the X-band PARs with high spatiotemporal resolution observation ability can capture minute-level microphysical process changes and improve the estimation accuracy of the ground rainfall rate through accumulation and networking observation.

Author Contributions

Conceptualization, H.H. and K.Z.; methodology, G.Z.; software, G.C. and H.H.; validation, G.Z., formal analysis, G.Z.; investigation, G.Z.; resources, G.Z.; data curation, Y.Z.; writing—original draft preparation, G.Z.; writing—review and editing, G.Z., H.H., and K.Z.; visualization, G.Z.; project administration, Z.Y.; funding acquisition, K.Z. and Y.Y. All authors have read and agreed to the published version of the manuscript.

Funding

This work was supported by the National Natural Science Foundation of China (Grants 41905019 and 61827901), the Open Grants of the State Key Laboratory of Severe Weather (Grant 2021LASW-A01), and the Gansu Science and Technology Program (Grant No.18JR2RA005).

Institutional Review Board Statement

Not applicable.

Informed Consent Statement

Not applicable.

Data Availability Statement

All freely available data are mentioned in the Section 2.

Acknowledgments

Technical support was provided by the Technology Service Center, Northwest Institute of Eco-Environment and Resources, Chinese Academy of Sciences. Thanks go to the anonymous reviewers for their constructive comments and suggestions for the manuscript.

Conflicts of Interest

The authors declare no conflict of interest.

References

  1. Seliga, T.A.; Bringi, V.N. Potential Use of Radar Differential Reflectivity Measurements at Orthogonal Polarizations for Measuring Precipitation. J. Appl. Meteorol. 1976, 15, 69–76. [Google Scholar] [CrossRef]
  2. Brunkow, D.; Bringi, V.N.; Kennedy, P.C.; Rutledge, S.A.; Chandrasekar, V.; Mueller, E.A.; Bowie, R.K. A Description of the CSU-CHILL National Radar Facility. Am. Meteorol. Soc. 2000, 17, 1596–1608. [Google Scholar] [CrossRef]
  3. Anagnostou, M.N.; Kalogiros, J.; Anagnostou, E.N.; Papadopoulos, A. Experimental results on rainfall estimation in complex terrain with a mobile X-band polarimetric weather radar. Atmos. Res. 2009, 94, 579–595. [Google Scholar] [CrossRef]
  4. Anagnostou, M.N.; Kalogiros, J.; Anagnostou, E.N.; Tarolli, M.; Papadopoulos, A.; Borga, M. Performance evaluation of high-resolution rainfall estimation by X-band dual-polarization radar for flash flood applications in mountainous basins. J. Hydrol. 2010, 394, 4–16. [Google Scholar] [CrossRef]
  5. Zhao, G.; Chu, R.; Zhang, T.; Li, J.; Shen, J.; Wu, Z. Improving the rainfall rate estimation in the midstream of the Heihe River Basin using raindrop size distribution. Hydrol. Earth Syst. Sci. 2011, 15, 943–951. [Google Scholar] [CrossRef] [Green Version]
  6. Wang, Y.; Chandrasekar, V. Quantitative Precipitation Estimation in the CASA X-band Dual-Polarization Radar Network. J. Atmos. Ocean. Technol. 2010, 27, 1665–1676. [Google Scholar] [CrossRef]
  7. Shakti, P.C.; Maki, M.; Shimizu, S.; Maesaka, T.; Kim, D.S.; Lee, D.I.; Iida, H. Correction of Reflectivity in the Presence of Partial Beam Blockage over a Mountainous Region Using X-Band Dual Polarization Radar. J. Hydrometeorol. 2013, 14, 744–764. [Google Scholar] [CrossRef]
  8. Matrosov, S.Y.; Cifelli, R.; Gochis, D. Measurements of Heavy Convective Rainfall in the Presence of Hail in Flood-Prone Areas Using an X-Band Polarimetric Radar. J. Appl. Meteorol. Climatol. 2013, 52, 395–407. [Google Scholar] [CrossRef] [Green Version]
  9. Koffi, A.K.; Gosset, M.; Zahiri, E.P.; Ochou, A.D.; Kacou, M.; Cazenave, F.; Assamoi, P. Evaluation of X-band polarimetric radar estimation of rainfall and rain drop size distribution parameters in West Africa. Atmos. Res. 2014, 143, 438–461. [Google Scholar] [CrossRef]
  10. Vulpiani, G.; Baldini, L.; Roberto, N. Characterization of Mediterranean hail-bearing storms using an operational polarimetric X-band radar. Atmos. Meas. Tech. 2015, 8, 4681–4698. [Google Scholar] [CrossRef]
  11. Anagnostou, M.; Nikolopoulos, E.; Kalogiros, J.; Anagnostou, E.; Marra, F.; Mair, E.; Bertoldi, G.; Tappeiner, U.; Borga, M. Advancing Precipitation Estimation and Streamflow Simulations in Complex Terrain with X-Band Dual-Polarization Radar Observations. Remote Sens. 2018, 10, 1258. [Google Scholar] [CrossRef] [Green Version]
  12. Rinehart, R.E.; Garvey, E.T. Three-dimensional storm motion detection by conventional weather radar. Nature 1978, 273, 287–289. [Google Scholar] [CrossRef]
  13. Shapiro, A.; Robinson, P.; Wurman, J.; Gao, J. Single-Doppler Velocity Retrieval with Rapid-Scan Radar Data. J. Atmos. Ocean. Technol. 2003, 20, 1758–1775. [Google Scholar] [CrossRef]
  14. Pazmany, A.L.; Mead, J.B.; Bluestein, H.B.; Snyder, J.C.; Houser, J.B. A Mobile Rapid-Scanning X-band Polarimetric (RaXPol) Doppler Radar System. J. Atmos. Ocean. Technol. 2013, 30, 1398–1413. [Google Scholar] [CrossRef]
  15. Palmer, R.; Bodine, D.; Kollias, P.; Schvartzman, D.; Zrnić, D.; Kirstetter, P.; Zhang, G.; Yu, T.Y.; Kumjian, M.; Cheong, B.; et al. A Primer on Phased Array Radar Technology for the Atmospheric Sciences. Bull. Am. Meteorol. Soc. 2022, 103, E2391–E2416. [Google Scholar] [CrossRef]
  16. Zrnic, D.S.; Kimpel, J.F.; Forsyth, D.E.; Shapiro, A.; Crain, G.; Ferek, R.; Heimmer, J.; Benner, W.; McNellis, F.T.J.; Vogt, R.J. Agile-Beam Phased Array Radar for Weather Observations. Bull. Am. Meteorol. Soc. 2007, 88, 1753–1766. [Google Scholar] [CrossRef]
  17. Guifu, Z.; Doviak, R.J.; Zrnic, D.S.; Crain, J.; Staiman, D.; Al-Rashid, Y. Phased Array Radar Polarimetry for Weather Sensing: A Theoretical Formulation for Bias Corrections. IEEE Trans. Geosci. Remote Sens. 2009, 47, 3679–3689. [Google Scholar] [CrossRef]
  18. Doviak, R.J.; Lei, L.; Zhang, G.; Meier, J.; Curtis, C. Comparing Theory and Measurements of Cross-Polar Fields of a Phased Array Weather Radar. IEEE Geosci. Remote Sens. Lett. 2011, 8, 1002–1006. [Google Scholar] [CrossRef]
  19. Zrnic, D.S.; Zhang, G.; Doviak, R.J. Bias Correction and Doppler Measurement for Polarimetric Phased Array Radar. IEEE Trans. Geosci. Remote Sens. 2011, 49, 843–853. [Google Scholar] [CrossRef]
  20. Wu, C.; Liu, L.; Liu, X.; Li, G.; Chen, C. Advances in Chinese Dual-Polarization and Phased Array Weather Radars: Observational Analysis of a Supercell in Southern China. J. Atmos. Ocean. Technol. 2018, 35, 1785–1806. [Google Scholar] [CrossRef]
  21. Adachi, T.; Mashiko, W. High Temporal-Spatial Resolution Observation of Tornadogenesis in a Shallow Supercell Associated With Typhoon Hagibis (2019) Using Phased Array Weather Radar. Geophys. Res. Lett. 2020, 47, e2020GL089635. [Google Scholar] [CrossRef]
  22. Otsuka, S.; Tuerhong, G.; Kikuchi, R.; Kitano, Y.; Taniguchi, Y.; Ruiz, J.J.; Satoh, S.; Ushio, T.; Miyoshi, T. Precipitation Nowcasting with Three-Dimensional Space–Time Extrapolation of Dense and Frequent Phased Array Weather Radar Observations. Weather. Forecast. 2015, 31, 329–340. [Google Scholar] [CrossRef]
  23. Adachi, T.; Kusunoki, K.; Yoshida, S.; Arai, K.I.; Ushio, T. High-Speed Volumetric Observation of a Wet Microburst Using X-Band Phased Array Weather Radar in Japan. Mon. Weather. Rev. 2016, 144, 3749–3765. [Google Scholar] [CrossRef]
  24. Kikuchi, H.; Ushio, T.; Mizutani, F.; Wada, M. Improving the Accuracy of Rain Rate Estimates Using X-Band Phased Array Weather Radar Network. IEEE Trans. Geosci. Remote Sens. 2018, 56, 6986–6994. [Google Scholar] [CrossRef]
  25. Kikuchi, H.; Suezawa, T.; Ushio, T.; Takahashi, N.; Hanado, H.; Nakagawa, K.; Osada, M.; Maesaka, T.; Iwanami, K.; Yoshimi, K.; et al. Initial Observations for Precipitation Cores With X-Band Dual Polarized Phased Array Weather Radar. IEEE Trans. Geosci. Remote Sens. 2020, 58, 3657–3666. [Google Scholar] [CrossRef]
  26. Islam, T. The scattering simulation of DSDs and the polarimetric radar rainfall algorithms at C-band frequency. J. Atmos. Sol. -Terr. Phys. 2014, 119, 42–52. [Google Scholar] [CrossRef]
  27. You, C.H.; Lee, D.I.; Kang, M.Y. Rainfall Estimation Using Specific Differential Phase for the First Operational Polarimetric Radar in Korea. Adv. Meteorol. 2014, 2014, 413717. [Google Scholar] [CrossRef] [Green Version]
  28. Zhang, G.; Vivekanandau, J.; Brandes, E. A method for estimating rain rate and drop size distribution from polarimetric radar measurements. IEEE Trans. Geosci. Remote Sens. 2001, 39, 830–841. [Google Scholar] [CrossRef] [Green Version]
  29. Brandes, E.A.; Zhang, G.; Vivekanandan, J. Experiments in Rainfall Estimation with a Polarimetric Radar in a Subtropical Environment. J. Appl. Meteorol. 2002, 41, 674–685. [Google Scholar] [CrossRef]
  30. Wang, M.; Zhao, K.; Xue, M.; Zhang, G.; Liu, S.; Wen, L.; Chen, G. Precipitation microphysics characteristics of a Typhoon Matmo (2014) rainband after landfall over eastern China based on polarimetric radar observations. J. Geophys. Res. Atmos. 2016, 121, 12–415. [Google Scholar] [CrossRef]
  31. Wen, L.; Zhao, K.; Zhang, G.; Xue, M.; Zhou, B.; Liu, S.; Chen, X. Statistical characteristics of raindrop size distributions observed in East China during the Asian summer monsoon season using 2-D video disdrometer and Micro Rain Radar data. J. Geophys. Res. Atmos. 2016, 121, 2265–2282. [Google Scholar] [CrossRef] [Green Version]
  32. Ryzhkov, A.V.; Giangrande, S.E.; Schuur, T.J. Rainfall estimation with a polarimetric prototype of the operational WSR-88D radar. J. Appl. Meteorol. 2003, 44, 502–515. [Google Scholar] [CrossRef] [Green Version]
  33. Liu, C.; Zipser, E.J. Global distribution of convection penetrating the tropical tropopause. J. Geophys. Res. 2005, 110. [Google Scholar] [CrossRef] [Green Version]
  34. Huang, G.J.; Bringi, V.N.; Munchak, S.J.; Kummerow, C.D.; Marks, D.A.; Wolff, D.B. Comparison of Drop Size Distribution Parameter (D0) and Rain Rate from S-Band Dual-Polarized Ground Radar, TRMM Precipitation Radar (PR), and Combined PR–TMI: Two Events from Kwajalein Atoll. J. Atmos. Ocean. Technol. 2012, 29, 1603–1616. [Google Scholar] [CrossRef] [Green Version]
  35. Matrosov, S.Y.; Cifelli, R.; Neiman, P.J.; White, A.B. Radar Rain-Rate Estimators and Their Variability due to Rainfall Type: An Assessment Based on Hydrometeorology Testbed Data from the Southeastern United States. J. Appl. Meteorol. Climatol. 2016, 55, 1345–1358. [Google Scholar] [CrossRef]
  36. Kumjian, M.R.; Prat, O.P.; Reimel, K.J.; van Lier-Walqui, M.; Morrison, H.C. Dual-Polarization Radar Fingerprints of Precipitation Physics: A Review. Remote Sens. 2022, 14, 3706. [Google Scholar] [CrossRef]
Figure 1. Location of X-band dual-polarization phased array radar and S-band dual-polarization radar at Guangzhou on the digital terrain elevation map.
Remotesensing 15 00359 g001
Figure 2. R(KDP) relationship for X-band (a) and S-band (b) radars, derived by the least squares method of the observations.
Remotesensing 15 00359 g002
Figure 3. A comparison between the R(KDP) and the intrinsic rainfall rate Rcal directly observed by the 2DVD for X-band (a) and S-band (b).
Remotesensing 15 00359 g003
Figure 4. The KDP-AH (a) and KDP-ADP (b) relationships for the X-band PAR fitted by DSD data.
Remotesensing 15 00359 g004
Figure 5. Measurements of ZH from the Panyu PAR (a) without attenuation correction and (b) after attenuation correction at the 6.3 deg elevation at 19:30 on 2 May 2018; (c) Measurements of ZH from the Guangzhou S-band radar at the 6 deg elevation at 19:30 on 2 May 2018.
Remotesensing 15 00359 g005
Figure 6. The ZH of the X-band PAR before (blue) and after (red) attenuation correction at an azimuth of 5 deg and an elevation of 6.3 deg corresponding to Figure 5. The black line is from the S-band radar, also at an azimuth of 5 deg and an elevation of 6 deg.
Remotesensing 15 00359 g006
Figure 7. The NDFs of estimated hourly accumulated rainfall from (a) X-band R(KDP) and (b) S-band R(KDP) versus the gauge observations for all precipitation cases.
Remotesensing 15 00359 g007
Figure 8. ZH, ZDR, and KDP observed by the X-band PAR radar at the 2.7-deg-elevation in the (ac) pre-summer rainband at 10:30 on June 7, the (df) typhoon rainband at 13:30 on August 19, and the (gi) severe convective rainband at 17:30 on September 4.
Remotesensing 15 00359 g008
Figure 9. Comparison of hourly accumulated rainfall obtained using R(KDP) with gauge observations in the pre-summer rainfall between 10:00–11:00 on June 7, the typhoon precipitation between 13:00–14:00 on August 19, and the severe convective precipitation rainband between 17:00–18:00 on September 4. (a,c,e) for X-band band radar and (b,d,f) for S-band band radar. The color of the bubble charts shows bias ratios ( R K DP /Rgauge) between the hourly accumulated rainfall estimates and independent gauge observations.
Remotesensing 15 00359 g009
Figure 10. The normalized density of ZH-ZDR. in the pre-summer rainband observed by the Huadu X-band PAR at (a) 10:48, (b) 10:50, (c) 10:52, and (d) the S-band radar at 10:54 on 7 June 2020.
Remotesensing 15 00359 g010
Figure 11. The normalized density of ZH-ZDR. in the Typhoon Higos rainband observed by the Nansha X-band PAR at (a) 13:00, (b) 13:02, (c) 13:04, and (d) the S-band radar at 13:00 on 19 August 2020.
Remotesensing 15 00359 g011
Figure 12. The normalized density of ZH-ZDR in the local heavy precipitation rainband observed by the Panyu X-band PAR at (a) 17:30, (b) 17:31, (c) 17:33, and (d) the S-band radar at 17:30 on 4 September 2020.
Remotesensing 15 00359 g012
Table 1. The coefficients of the R(Zh) and R(KDP) for X-band and S-band dual-polarization radars in South China fitted by DSD data in Foshan.
X-BandS-Band
Typeabab
R(Zh)0.0460.6380.03520.6727
R(KDP)21.750.8458.010.785
Table 2. NE, RMSE (mm), and CC between the hourly accumulated rainfall from R(KDP) and gauge measurements corresponding to Figure 7.
Hourly Accumulated Rainfall (mm)X-BandS-Band
NERMSECCNERMSECC
R < 100.644.040.30.634.50.31
10 < R < 300.266.210.70.345.680.6
R > 300.135.680.950.2010.280.92
Table 3. The NE, RMSE, and CC for the estimation of hourly accumulated rainfall in pre-summer rainfall, typhoon precipitation, and severe convective precipitation for X- and S-band radars estimated by R(KDP) corresponding to Figure 9.
Rain TypeQPE TypeNERMSE (mm)CC
pre-summerX-band0.246.330.97
rainfallS-band0.339.290.94
typhoonX-band0.244.490.9
precipitationS-band0.355.540.77
severe convectiveX-band0.397.20.84
precipitationS-band0.4410.590.74
Disclaimer/Publisher’s Note: The statements, opinions and data contained in all publications are solely those of the individual author(s) and contributor(s) and not of MDPI and/or the editor(s). MDPI and/or the editor(s) disclaim responsibility for any injury to people or property resulting from any ideas, methods, instructions or products referred to in the content.

