Article

Estimating Reservoir Storage Variations by Combining Sentinel-2 and 3 Measurements in the Yliki Reservoir, Greece

by
Nikolaos Gourgouletis
1,*,
Georgios Bariamis
1,
Marios N. Anagnostou
2,3 and
Evangelos Baltas
1
1
Department of Water Resources & Environmental Engineering, School of Civil Engineering, National Technical University of Athens, Str. Iroon Politexniou 9, 157 80 Zografou, Greece
2
Department of Informatics, School of Information Science & Informatics, Ionian University, Plateia Tsirigoti 7, 491 00 Corfu, Greece
3
Institute of Environmental Research and Sustainable Development, National Observatory of Athens, I. Metaxas and Vassilis Pavlou, 152 36 Penteli, Greece
*
Author to whom correspondence should be addressed.
Remote Sens. 2022, 14(8), 1860; https://doi.org/10.3390/rs14081860
Submission received: 22 February 2022 / Revised: 24 March 2022 / Accepted: 10 April 2022 / Published: 12 April 2022

Abstract

:
Inland water resources are facing increasing quantitative and qualitative pressures, deriving from anthropogenic causes and the ongoing climate change. The monitoring of reservoirs is essential for sustainable management and preparation against water scarcity and extreme events, such as droughts. This research, relying on the Sentinel-2 and 3 missions, attempts to demonstrate the efficiency of combining remotely sensed water level and water area estimations, in order to estimate the water storage variation of Yliki reservoir. The case study is conducted in one of the few sufficiently monitored reservoirs in Greece, enabling a direct comparison of the proposed methodology results with in situ observations. Moreover, this research work proposes a weekly time interval for pairing level and area estimations, instead of shorter time intervals. The results strongly demonstrate the efficiency of remote sensing in the production of empirical level–area–storage (L–A–S) curves. Correlation to in situ monitored storage- and satellite-derived water level, area stand for 98.81% and 99.27% respectively. Water storage variation is estimated and compared to the observed time series, resulting in an RMSE of 1.28% of the reservoir capacity and a correlation of 96.14%. The empirical L–S relationship underestimates storage, while the A–S relationship overestimates storage when compared to the existing L–A–S curve.

Graphical Abstract

1. Introduction

Lakes and manmade reservoirs are key components of the Earth’s water cycle, providing water resources to the human environment as well as significant ecosystem services [1,2,3]. They do also serve as indicators of the climate conditions and changes, with alterations to their physical, chemical, and biological characteristics [1,4]. Lakes and reservoirs regulate river flows, mitigate floods, provide water to groundwater recharge flows, and improve and stabilize water quality, as well as often serving as the main water supply sources for human use [3,5]. Moreover, lakes and reservoirs also have an important share in the global carbon cycle and contribute to methane emissions [1,3,6].
Climate change is expected to intensify the pressures and impacts on water resources, especially in the mid latitudes–Mediterranean region, resulting in alternations of their water cycle while stressing their importance on providing ecosystem services and regulating extreme flows [7,8]. Moreover, land use changes due to economic growth, increased livestock, or agricultural production, resulting frequently in deforestation, as well as increased water demand, contribute another important pressure to water resources [2,9,10].
More specifically in Greece, the country where the present case study reservoir is located, for more than two decades, land resources have been found to be intensively exploited, and significant portions of land have been transformed to artificial surfaces, intensifying the pressures on water and land resources [11]. Additionally, after the mid-20th century, more droughts have been taking place in Greece, while the projections are showing an intensification of the drought phenomena, with parallel water quantity shortages [12,13,14]. It should be noted that on 2 December 1990, during a prolonged period of droughts, the Yliki reservoir case study recorded a storage minimum of 25.7 hm3, corresponding to 4.28% of its capacity and depicting an almost empty reservoir. Hence, until the 1990s, Yliki reservoir was a primary water source for the capital of Greece, Athens, and it was a matter of weeks where the Greek capital did not face a complete water shortage [15].
Consequently, increased pressures are expected to be exerted in water resources in the near future, while they play an ever-increasingly important role in the wellbeing of the human and natural environment. An essential tool for the sustainable water resources management is considered to be their monitoring [16,17]. Water resources monitoring can be accomplished with in situ measurements, hydrological modeling, and remote sensing methods [18]. From the 1990s, remote sensing techniques towards the monitoring of inland waters have been receiving ever-growing attention from researchers. The most vital aspects of the lakes’ and reservoirs’ water cycle, water level, water area, and water storage have been attracting the highest research interest.
The Normalized Difference Water Index (NDWI) and its alternations, e.g., modified NDWI, or other approaches such as support vector machines, are used to estimate from satellite data the water area of inland waters [5,18,19,20,21,22]. Regarding the water level detection, altimetry satellite missions, including ICESat-1 and ICESat-2, SARAL, Sentinel-3, etc., are utilized either with ready-to-use products or with sophisticated procedures, regarding the correction of atmospheric, geoid, and instrument parameters of satellite measurements [2,17,18,23,24,25,26]. Water level and water area can effectively be combined in order to estimate the water volume change (variation) of a lake or the water storage of a reservoir. Moreover, additional approaches have been developed to monitor the bathymetry of lakes and reservoirs but cannot yet be sufficiently applied in all types of lakes and reservoirs, especially deeper ones [27,28,29,30]. Regarding the abovementioned approaches of the remote sensing of inland water, the majority applied are specific case studies. Nonetheless, there have been attempts towards the creation of datasets encompassing various lake and reservoir types, sizes, and latitudes, such as the DAHITI database [17].
Despite the broad range of studies, depicting the applicability and efficiency of remote sensing methods to capture the inland water cycle, in Greece there have been several applications of remote sensing techniques over inland waters but none aiming to the observation of water level, area, or storage variation of a lake or reservoir [31,32,33,34,35,36,37,38].
Thus, this research proposes an easy-to-implement methodology, which enables the quantitative monitoring of inland water lakes and reservoirs. The proposed methodology is validated in the Yliki reservoir, which is monitored with in situ observations by its operator (EYDAP SA). The reservoir water area is estimated with the broadly applied NDWI derived from Sentinel-2 imagery, while water level is estimated with altimetry data obtained from the Sentinel-3 mission. Water storage variation of the reservoir is calculated with the combination of water level and area measurements. This research aims to derive the most out of the selected datasets, and it consequently discusses the temporal interval of combining the quasi-synchronous water level and area measurements. Furthermore, we propose level–storage and area–storage equations based on the analyzed remotely sensed data and compare our results with an existing water level–area–storage relationship in the Yliki.

2. Materials and Methods
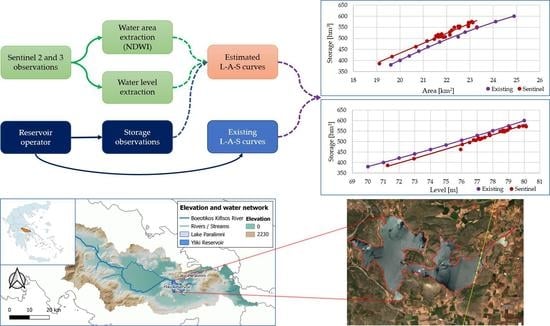
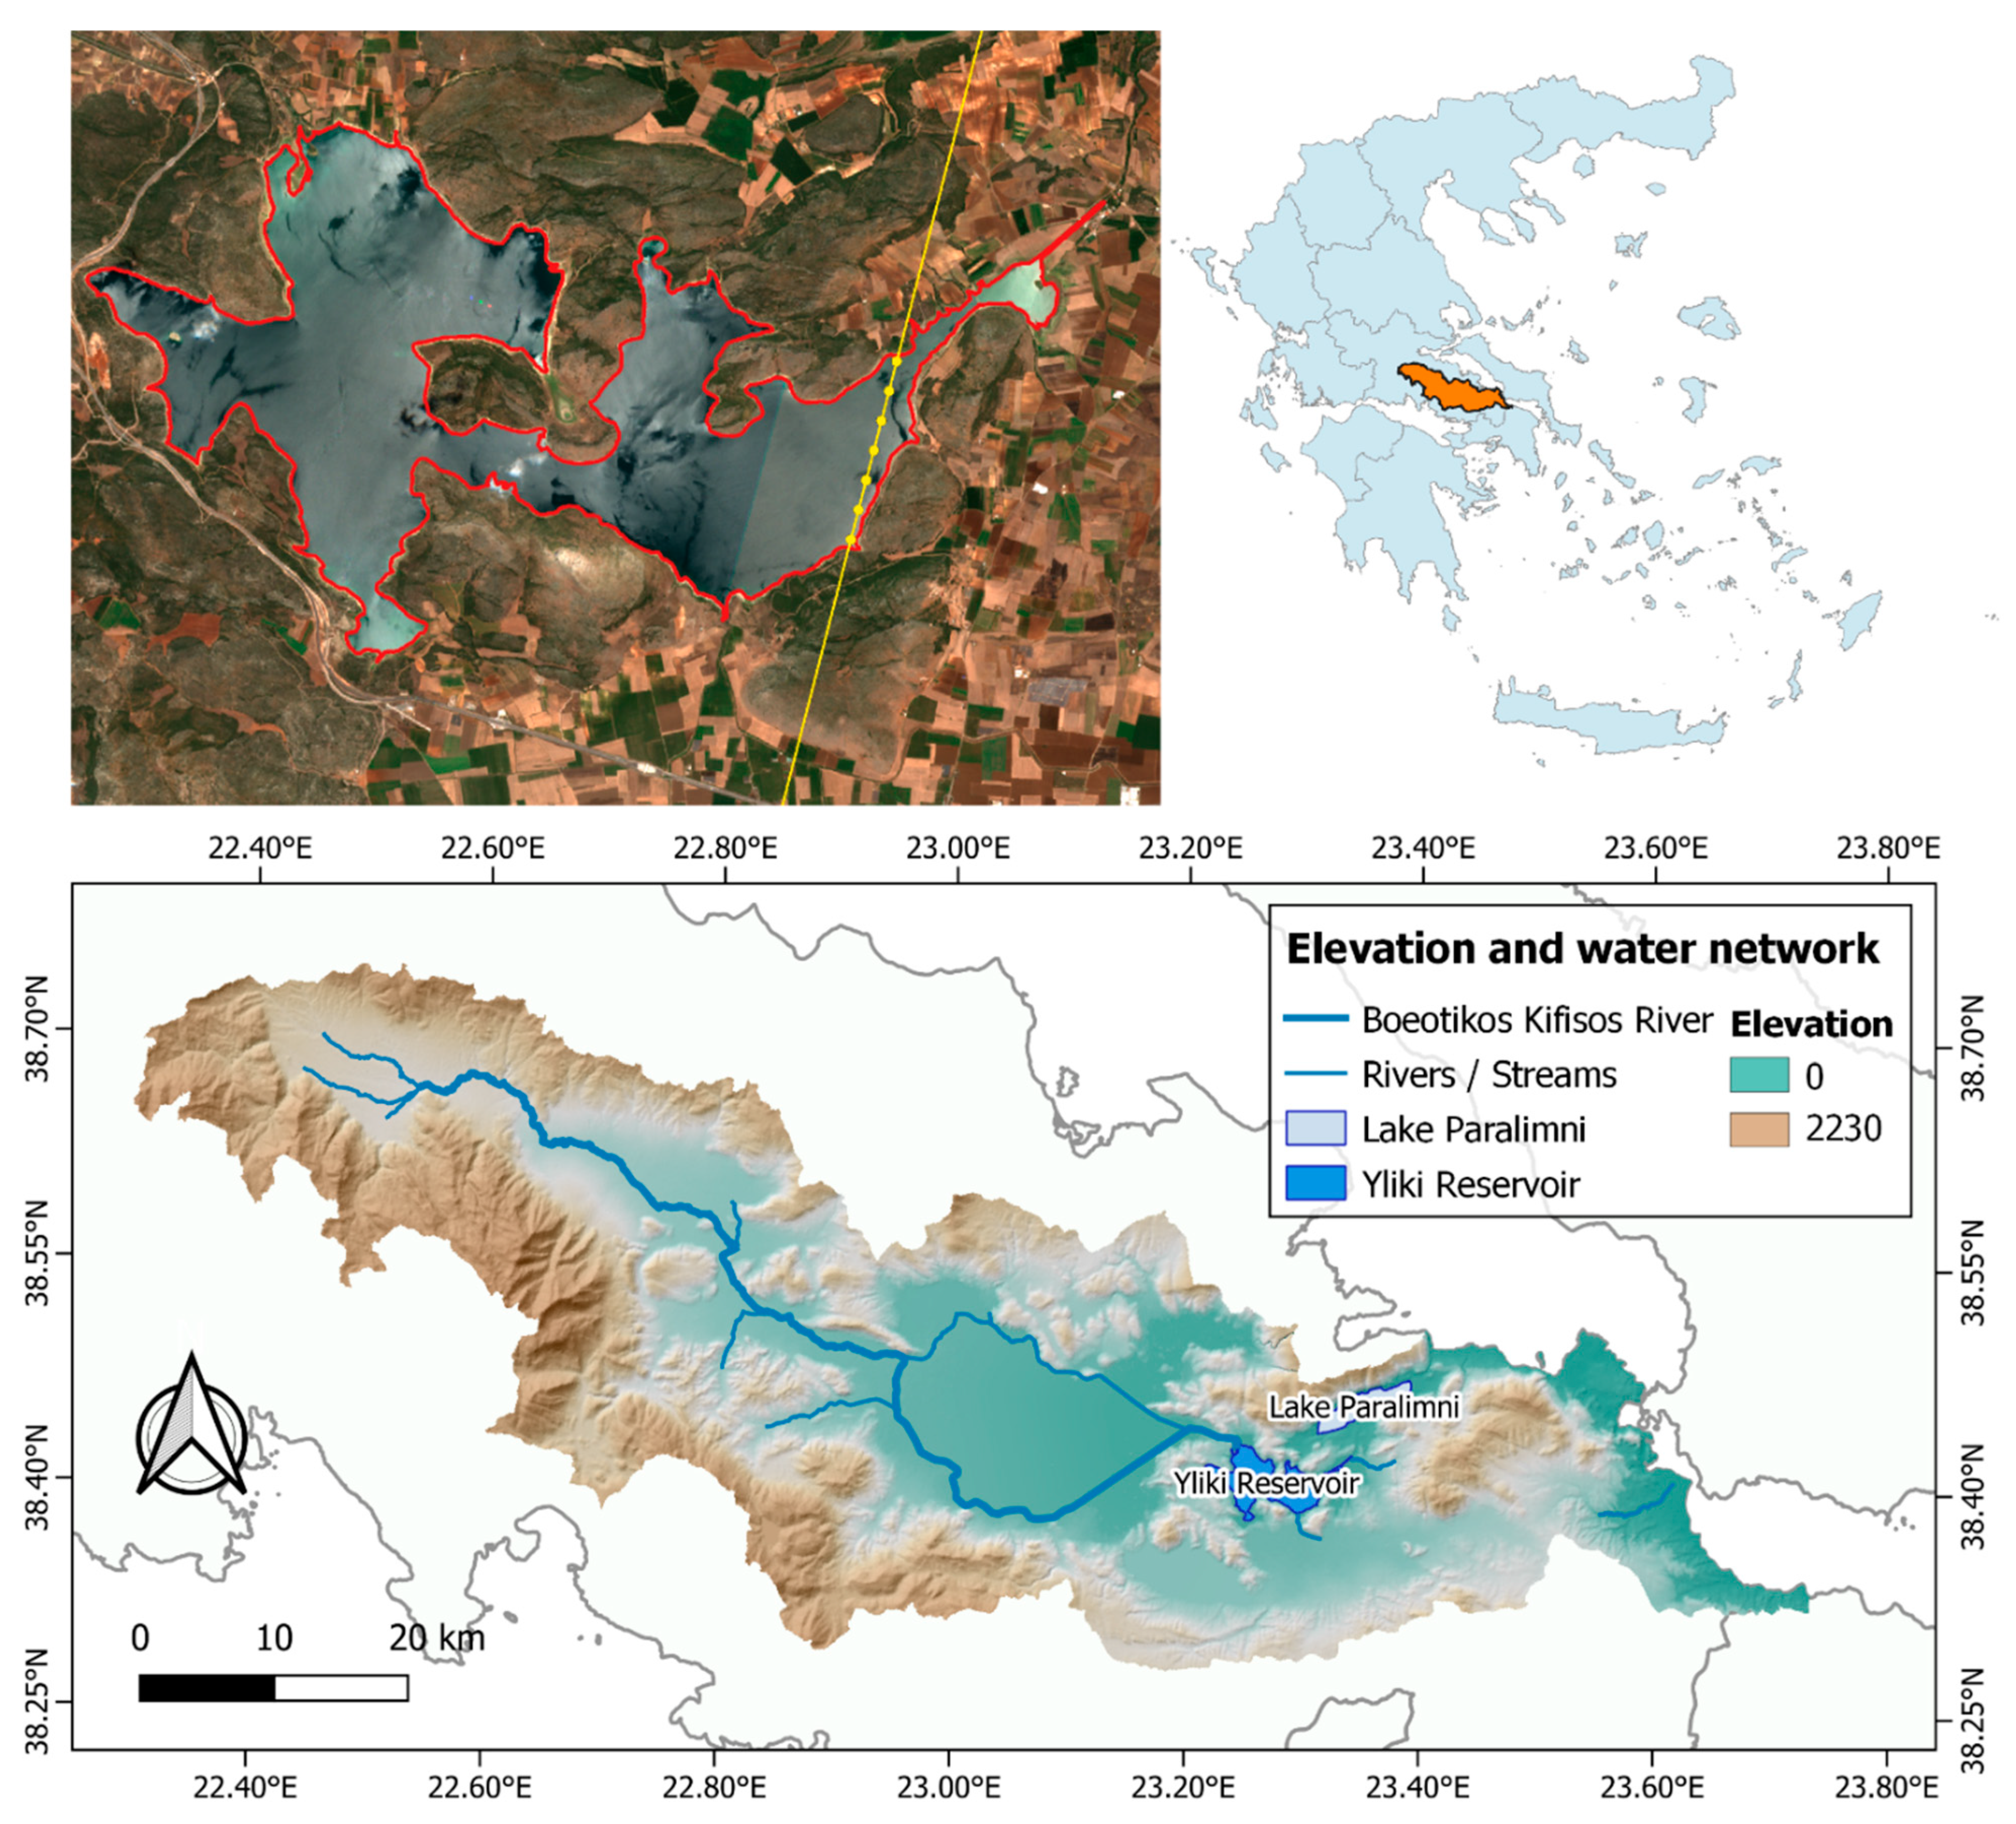
2.1. Study Area

Yliki reservoir is a heavily modified natural lake, serving as a backup reservoir for the water supply system of the Athens metropolitan area. It is located in the prefecture of Boeotia and is 90 km north of Athens. Yliki reservoir is part of the Boeotikos Kifissos River Basin District (EL0723), draining approximately 1850 km2. The annual average discharge of the Boeotikos Kifissos River basin (BKRB) is estimated around 387 hm3 [39]. Yliki reservoir has a capacity of 600 hm3, corresponding to a maximum area of 24.5 km2. The excess water is transferred with an open channel to the neighboring Lake Paralimni. Moreover, Yliki reservoir features a technically varied weir, which can increase its natural upper water level by 1.7 m [40]. Figure 1 presents the location of Yliki reservoir and the BKRB District. Mountainous areas are located in the northern and western parts of the BKRB, supplying the river network, which drains towards the southeastern part of the basin, mainly in Yliki reservoir.
BKRB receives averagely 602.4 mm of total annual precipitation and has an average temperature of 16.94 °C [41]. Coming to the nearest precipitation monitoring stations of Yliki reservoir, an average annual precipitation of 603.5 mm is recorded during the 1965–2000 period. For the next fifteen years, 2001–2015, another nearby station recorded a lower average annual precipitation of 562.1 mm. Additionally, the average actual evaporation of Yliki reservoir is calculated at 1345.0 mm for the years 1977–1997. Moreover, the primary source of inflows to the reservoir is a monitored channel, where average annual inflows of 368.7 hm3 have been calculated from hydrologic year 1907–1908 until hydrologic year 2018–2019 [42].

In Situ Observations

As already noted, Yliki reservoir is monitored by its operator. The operator publicly provides daily observations of storage starting from 1 January 1985 and can be obtained from the operator’s website [43]. It should be stated that no other data are available from the operator, such as observed water level or area measurements.

2.2. Remote Sensing Data

The Sentinel-2 mission consists of a pair of polar-orbiting satellites following a common orbit that have high spatial coverage (290 km swath) and provide data regarding land cover/change classification, atmospheric correction, and cloud/snow separation [44].
The Sentinel-3 mission consists of an optical instrument providing measurements of solar radiation reflected by Earth at a resolution of 300 m (OLCI), a dual-view scanning temperature radiometer (SLSTR), and a dual-frequency synthetic aperture radar (SAR) radar altimeter (SRAL) instrument [45,46].
For the purposes of the present study, the lake level was estimated based on the Ku band, as the difference between the elevation derived from OCOG retracking (“elevation_ocog_20_ku”) and the mean sea surface (“mean_sea_surface_sol1_ku”). The main scope of retracking consists of determining the tracker offset from the telemetered radar echoes and the estimation of the range to the closest point on the surface [47,48].
Regarding Sentinel-2 measurements, the R10 granule was used, which contains raster bands of 10 × 10 m2 resolution. The obtained multispectral images were selected in a manner to avoid cloud coverage over the Yliki reservoir. The average time step of the consecutive images used is one image per month. Level-2A images are orthoimages and corrected for top and bottom atmospheric effects. For each image, the same-day storage observation of the Yliki reservoir is paired. Storage observations during the whole period examined were manually downloaded from the water supply operator’s website [43].
Regarding Sentinel-3 SRAL measurements over Yliki reservoir, thirty-six (36) passes were acquired from the Copernicus Open Access Hub, ranging from November 2018 to September 2021. The abovementioned Level-2 data, along the Sentinel’s-3 track, mean values were used in order to obtain one reservoir’s water level measurement corresponding to the day of measurement. The average time step of consecutive measurements is approximately one per month. For each measurement, the same-day storage observation of the Yliki reservoir is paired, in the same manner as that of Sentinel-2 images.

2.3. Methodology

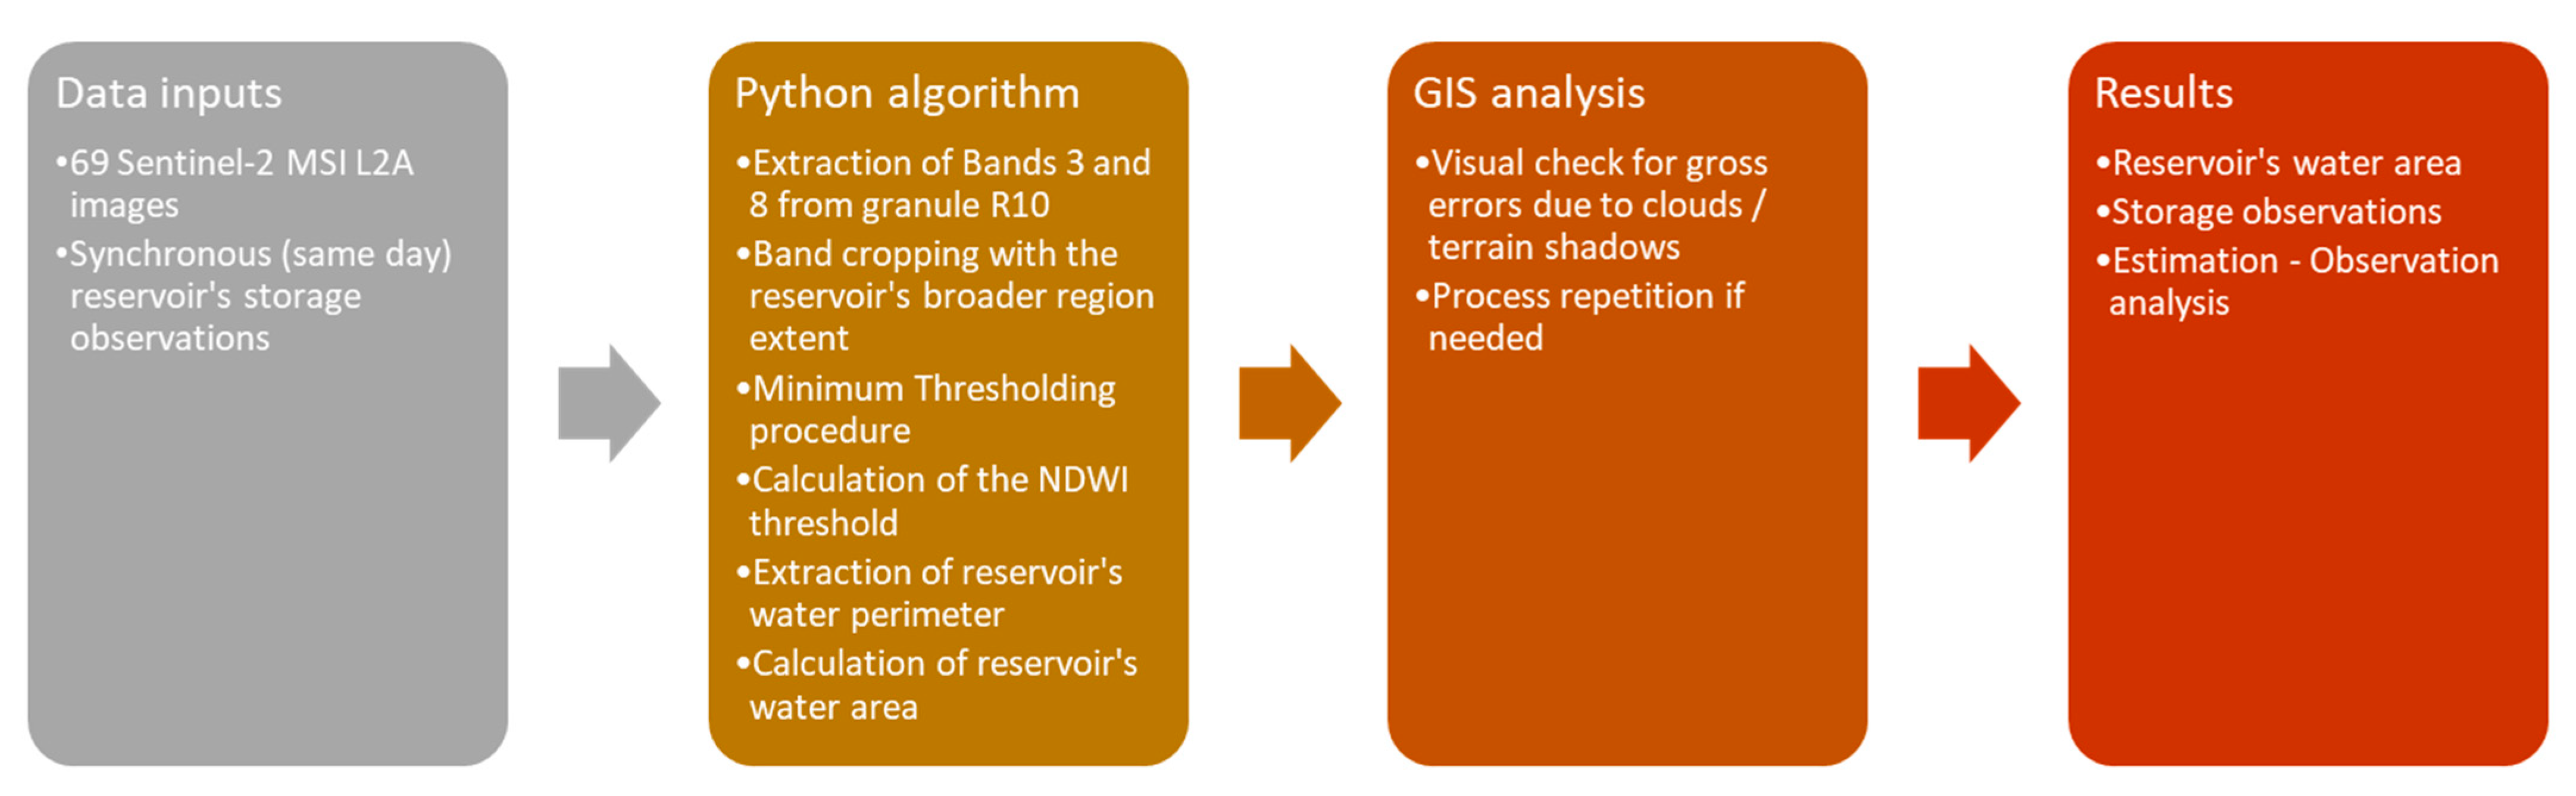
2.3.1. Extracting Reservoir’s Water Area from Sentinel-2 Images

As Level-2 MSI images do not require preprocessing, Bands 3 (560 mm, green) and 8 (842 mm, NIR) are used for the calculation of the NDWI, as shown in Equation (1), resulting in an NDWI spatial resolution of 10 m. NDWI is considered the most common water index, able to efficiently distinguish water and non-water pixels [49,50].
N D W I = B a n d   3 B a n d   8 B a n d   3 + B a n d   8
An automatic procedure was developed with Python programming language, as shown in Figure 2, where the two bands are imported for each measurement date, following relevant studies [51,52]. The raster files are then cropped based on the extents of a layer consisting of the broader Yliki area; therefore, the NDWI is calculated. Sekertekin [52] concluded that the threshold value of 0 is not the optimum threshold for the extraction of water pixels with the NDWI. Instead, the minimum thresholding method of Prewitt and Mendelsohn [53] was found to be the most efficient [54]. The image’s histogram is smoothened until it has two local maxima and the optimal threshold is identified as the minimum value between them. Thus, the minimum threshold is calculated for every date’s NDWI and afterwards is applied to distinct water and non-water pixels. The reservoir’s water perimeter is transformed into a polygon enclosing the water pixels and its area is calculated. Furthermore, the polygon used for the reservoir’s water area calculation of each date is extracted in a shapefile, as a vector layer. Water area variation, presented in Section 3.1.1, is calculated as the difference between two temporally consecutive area estimations.
A visual check of the RGB image for each of the measurement dates is conducted to exclude errors related to cloud and terrain shadows. In case an image fails, a different measurement date from the same month is selected. If there are not any images available with low cloud coverage percentage in the study area, or all images have gross errors within a month, then no measurement is documented and taken into account for the specific month. Seven images were found to be influenced by terrain shadows during the winter months, as steep slope areas overshadowed water areas, disallowing the proper calculation of the reservoir area. In those cases, an image of another date of the same month was acquired. There were three months (January of 2019 and 2021 and May 2018) where acquiring such an image had failed, as all other images were cloud-covered. Afterwards, the correlation between the Sentinel-2 estimated water area with the same-day reservoir’s storage observations is examined.

2.3.2. Extracting Reservoir’s Water Level from Sentinel-3 Measurements

For the extraction of the reservoir’s water level as height above mean sea level, the downloaded Sentinel-3 SRAL measurements for each date are imported in GIS software. The point measurements are cropped with the reservoir’s broader area extent and compared with the most temporally close water perimeter estimated from the Sentinel-2 procedure (see Section 2.3.1). The point measurements that are definitely inside the water area are extracted. Specifically, the temporally closest reservoir’s perimeter, derived from Sentinel-2, is used as the water area boundary. The reservoir’s water level is calculated as the difference of each measurement’s “elevation_ocog_20_ku” and “mean_surface_sol1_20_ku” fields. The OCOG retracker, based on Ice-1 retracker, presents a bias calculated at 285 ± 20 mm, which is higher than other retrackers [54], but nonetheless is provided as a ready-to-use product in Sentinel-3 data from Copernicus Assess Hub. The reservoir’s water level for each measurement date is calculated as the arithmetic mean of the abovementioned values. Water level variation, presented in Section 3.2.1, is calculated as the difference between two temporally consecutive level estimations.

2.3.3. Combination of Sentinel-2 and Sentinel-3 Measurements

Combining quasi-synchronous satellite-derived water level and water area measurements requires the definition of a time interval. If the water level and water area measurement dates difference is smaller than the selected time interval, the measurements can be combined. For the abovementioned combination of the quasi-synchronous Sentinel-2 and Sentinel-3 measurements, Yliki reservoir’s storage variation variability was examined for several time steps. Taking into account that for small lakes (A < 1 km2), Baup et al. [18] suggested a time lag below five days and the fact that Yliki reservoir is of greater area (Amax = 24.5 km2), this research examined time lags of two to ten days, in order to conclude to the most suitable time lag. The optimal time lag provides low levels of storage variation variability and sufficient measurements pairs for the storage variation estimator described below (see Section 2.3.4).

2.3.4. Estimating Reservoir’s Storage Variation from Satellite Data

Subsequently, concluding to the suitable time lag of satellite-imagery-derived water area and satellite-altimetry-derived water level, four proposed methodologies of estimating reservoir water storage variation are examined.
T. Busker et al. [2] suggested an estimator of lake water volume based on a linear hypsometric relationship between water level and area, as shown in Equation (2). The following Equation (2) and its accompanying methodology was applied in lakes of variable extent, from a few square kilometers (maximum area) to lakes of maximum area of thousands of square kilometers, e.g., Lake Baikal with a maximum area of 31,572.61 km2.
h i = a A i + b + ε i  
where Ai and hi correspond to the lake area and water level, respectively, a and b to the slope and intercept parameters, and εi to the error term for time step i. The parameters a and b are computed by minimizing the residual sum of squares ( ε i 2 ), with an ordinary least squares regression technique. Supposing that b is the water level where A = 0 (lake bottom), the expected water volume is calculated using h or A only (Equation (3)). Thus, water storage variation is calculated as the difference between E[Vi] and E[Vi−1].
E [ V i ] = ( h i b ) 2 2 a = a A i 2 2
F. Baup et al. [18] combined quasi-synchronous water level and area measurements to estimate lake volume variation, modeling small lakes (A < 1 km2) as a simple geometric shape. Thus, the water volume variation between two dates (t1 and t2) is computed with the following Equation (4):
Δ V = A ( t 1 ) | Δ H | + s g n ( Δ H ) | Δ A | | Δ H | 2
Y. Lin et al. [20] estimated the water volume variation in Lake Victoria, with an area of 68,870 km2, applying a derived water level–area–volume (L–A–V) variation relationship. Lake volume corresponds to reservoir storage, and Yliki is a manmade reservoir, hence the described analysis examines the level–area–storage (L–A–S) relationship. Area is expressed as a function of water level (H) and with a regression analysis, the ΔV–ΔH relationship is derived from the integration of the relationship between area and water level (Equation (5)). Respectively, for Yliki reservoir, ΔS–ΔH relationship is derived by replacing volume with storage.
V = A d H = f ( H ) d H
Crétaux et al. [55] estimate the water volume variation in the lakes of the Tibetan Plateau applying a proposed pyramidal lake shape estimator derived from Heron [56]. The volume variation between two measurement dates, Ti and Ti+1, is calculated based on the following Equation (6), where H stands for water level and A stands for water area.
Δ V = ( ( H i + 1 H i ) × ( A i + 1 + A i × A i + 1 × A i ) ) 3  
The abovementioned approaches of estimating volume variation are tested in Yliki reservoir for the selected time lag water level and water area pairs. The four generated time series are compared with regard to their correlation as well as their RMSE to the observed storage variation. Moreover, logical faults are counted, whenever each approach shows a different sign than the observed one, e.g., an approach calculates a positive storage variation (reservoir filling), while the observed time series depicts a negative storage variation (reservoir emptying).

2.3.5. Comparing Remotely Sensed Reservoir Characteristics with a Known L–A–S Relationship

An Yliki reservoir’s L–A–S relationship is presented by Efstratiadis and Tsoukalas [42]. The aforementioned relationship is compared with the Sentinel-3 water level measurements and the Sentinel-2 water area measurements and the corresponding in situ storage observations in order to identify the potential of the above-described ready-to-use remote sensing data from the Sentinel missions.

3. Results

3.1. Sentinel-2 Time Series

From the extraction of the reservoir’s water area, spanning from March 2016 until September 2021, 69 areal measurements were paired with same-day reservoir’s storage observations, as shown in Figure 3. The maximum area observed was 23.14 km2, corresponding to a storage of 568.93 hm3, whilst minimum area observed was 18.21 km2, corresponding to a storage of 344.47 hm3. The average water area of Yliki reservoir during the observed period was found to be 20.94 km2, corresponding to an average water storage of 469.39 hm3. Overall, the correlation coefficient between the NDWI water area estimations and the same-day storage observations is equal to 99.27%. Thus, it is evident that the reservoir’s area can be efficiently monitored by the NDWI, taking advantage of the optical imagery satellite missions.
Figure 4 illustrates two true color images of the reservoir, one with a relatively low area and corresponding observed storage and one with an almost maximum area and observed storage close to the reservoir capacity.

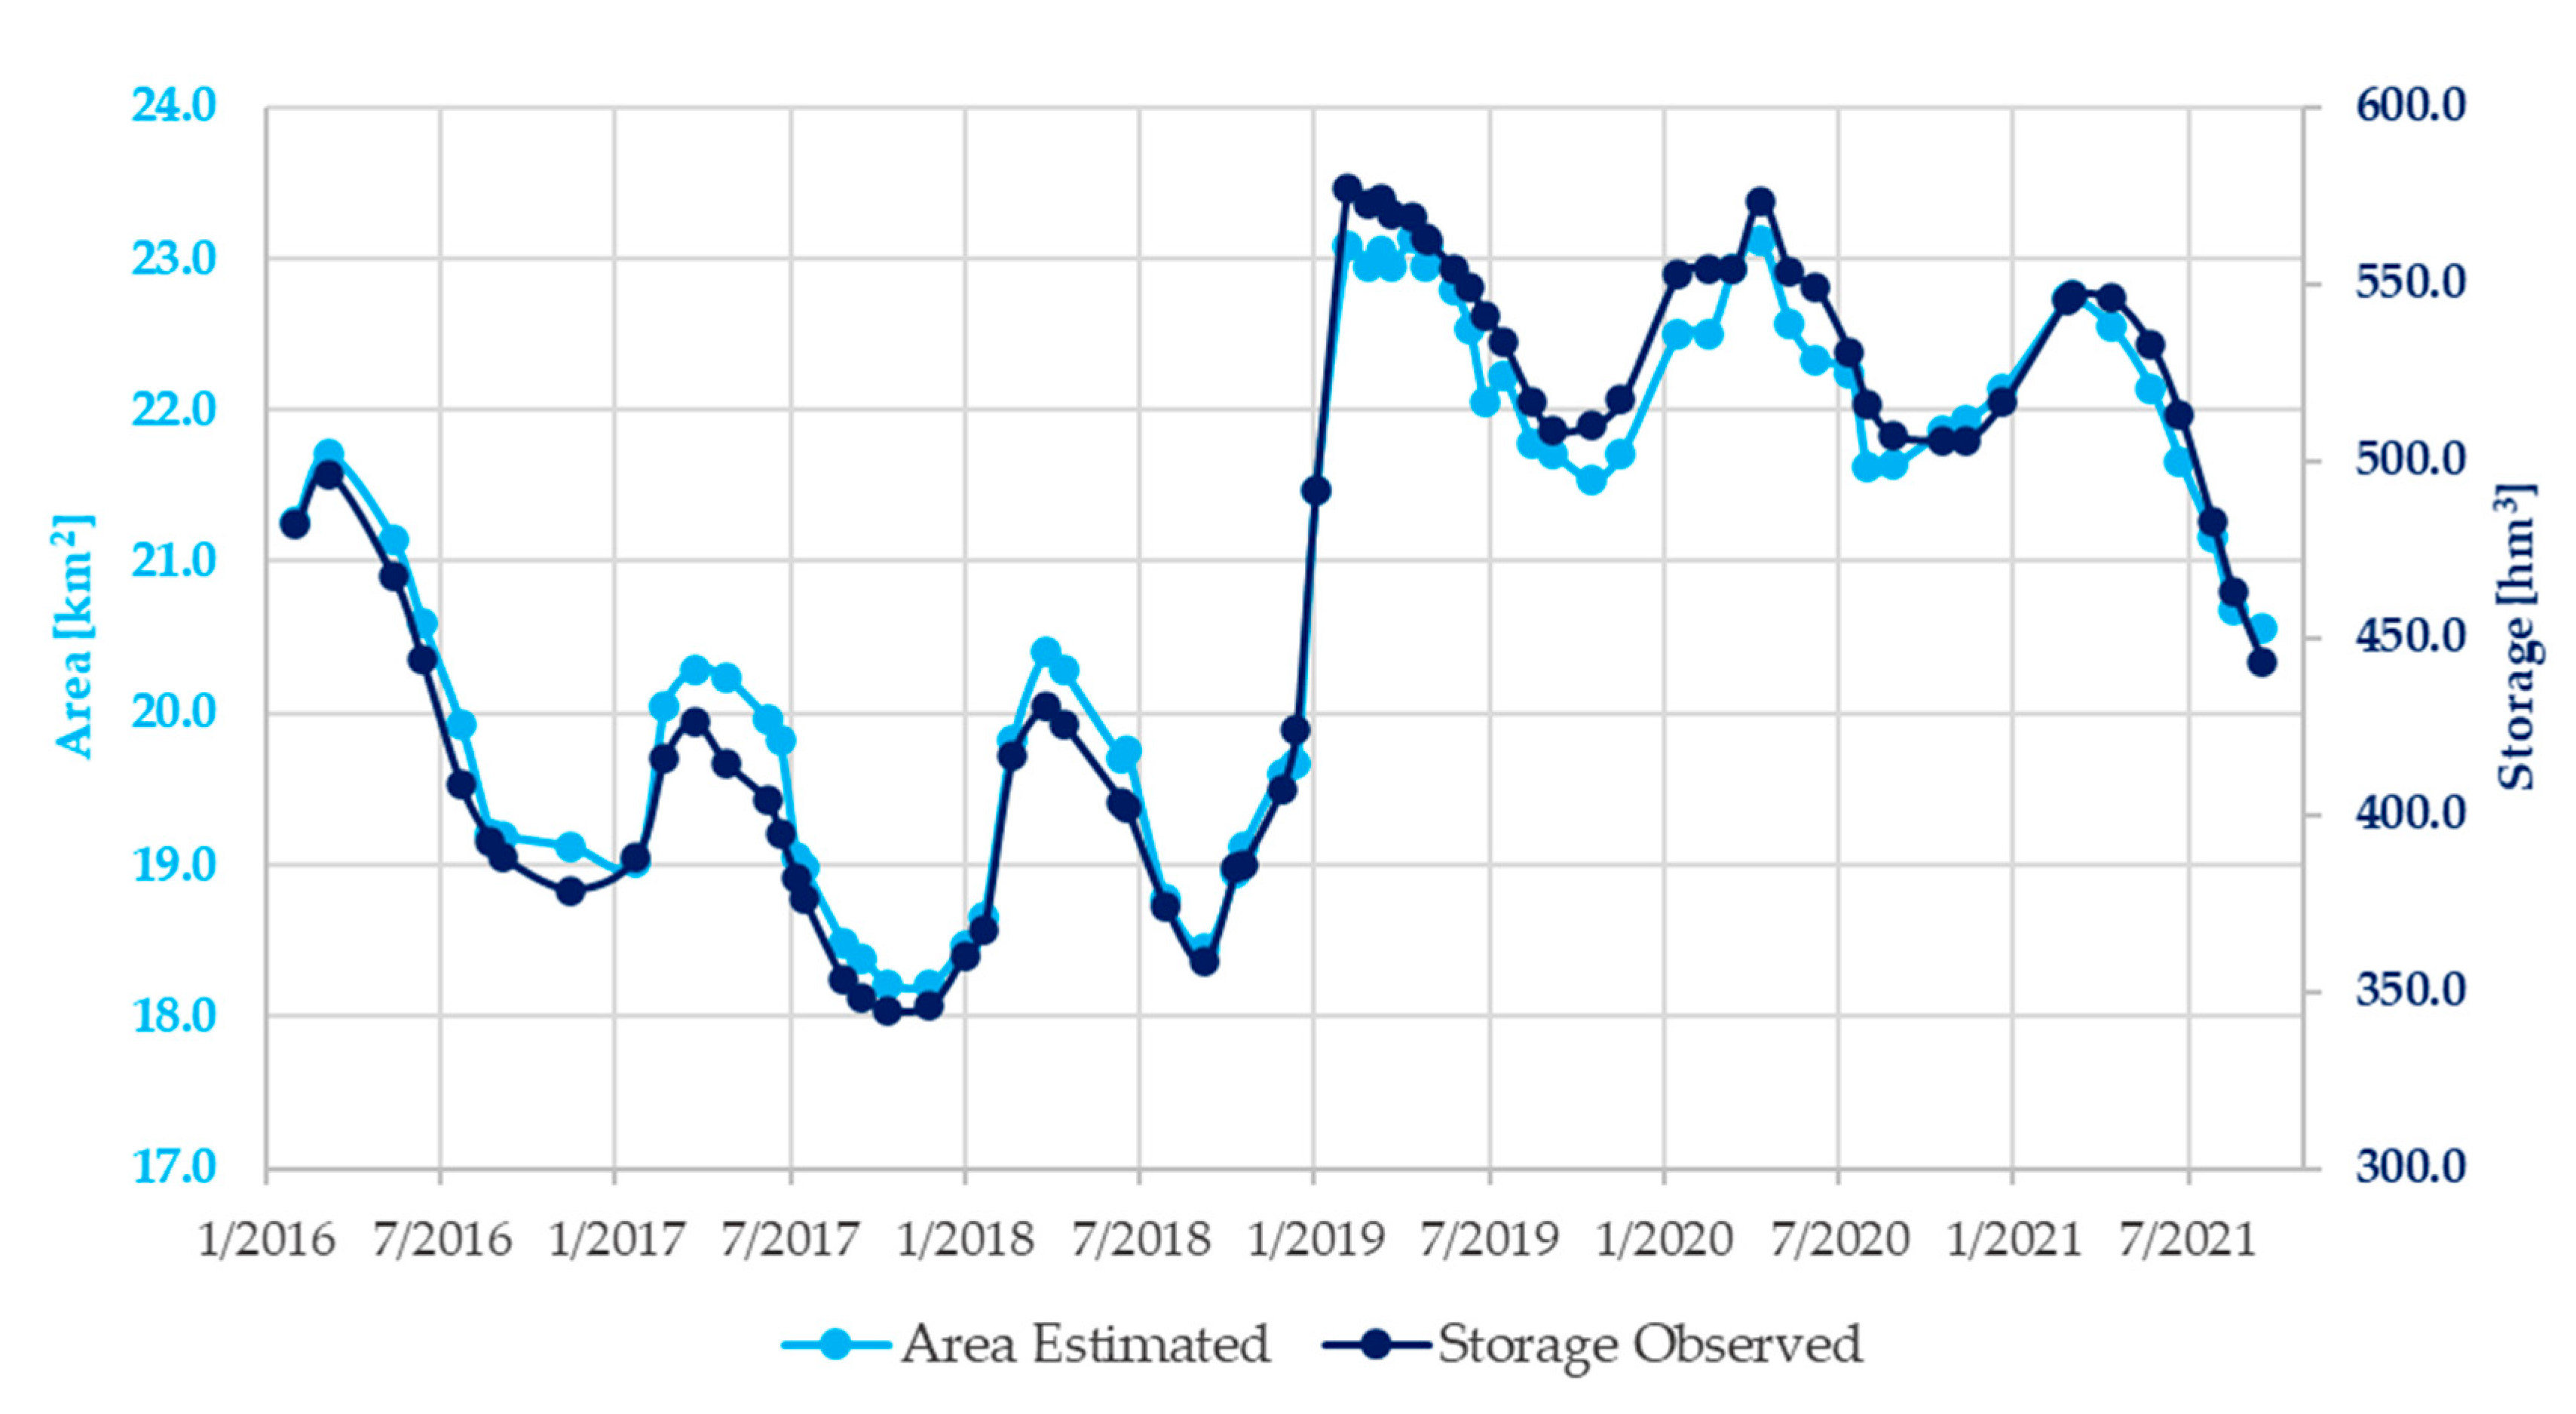
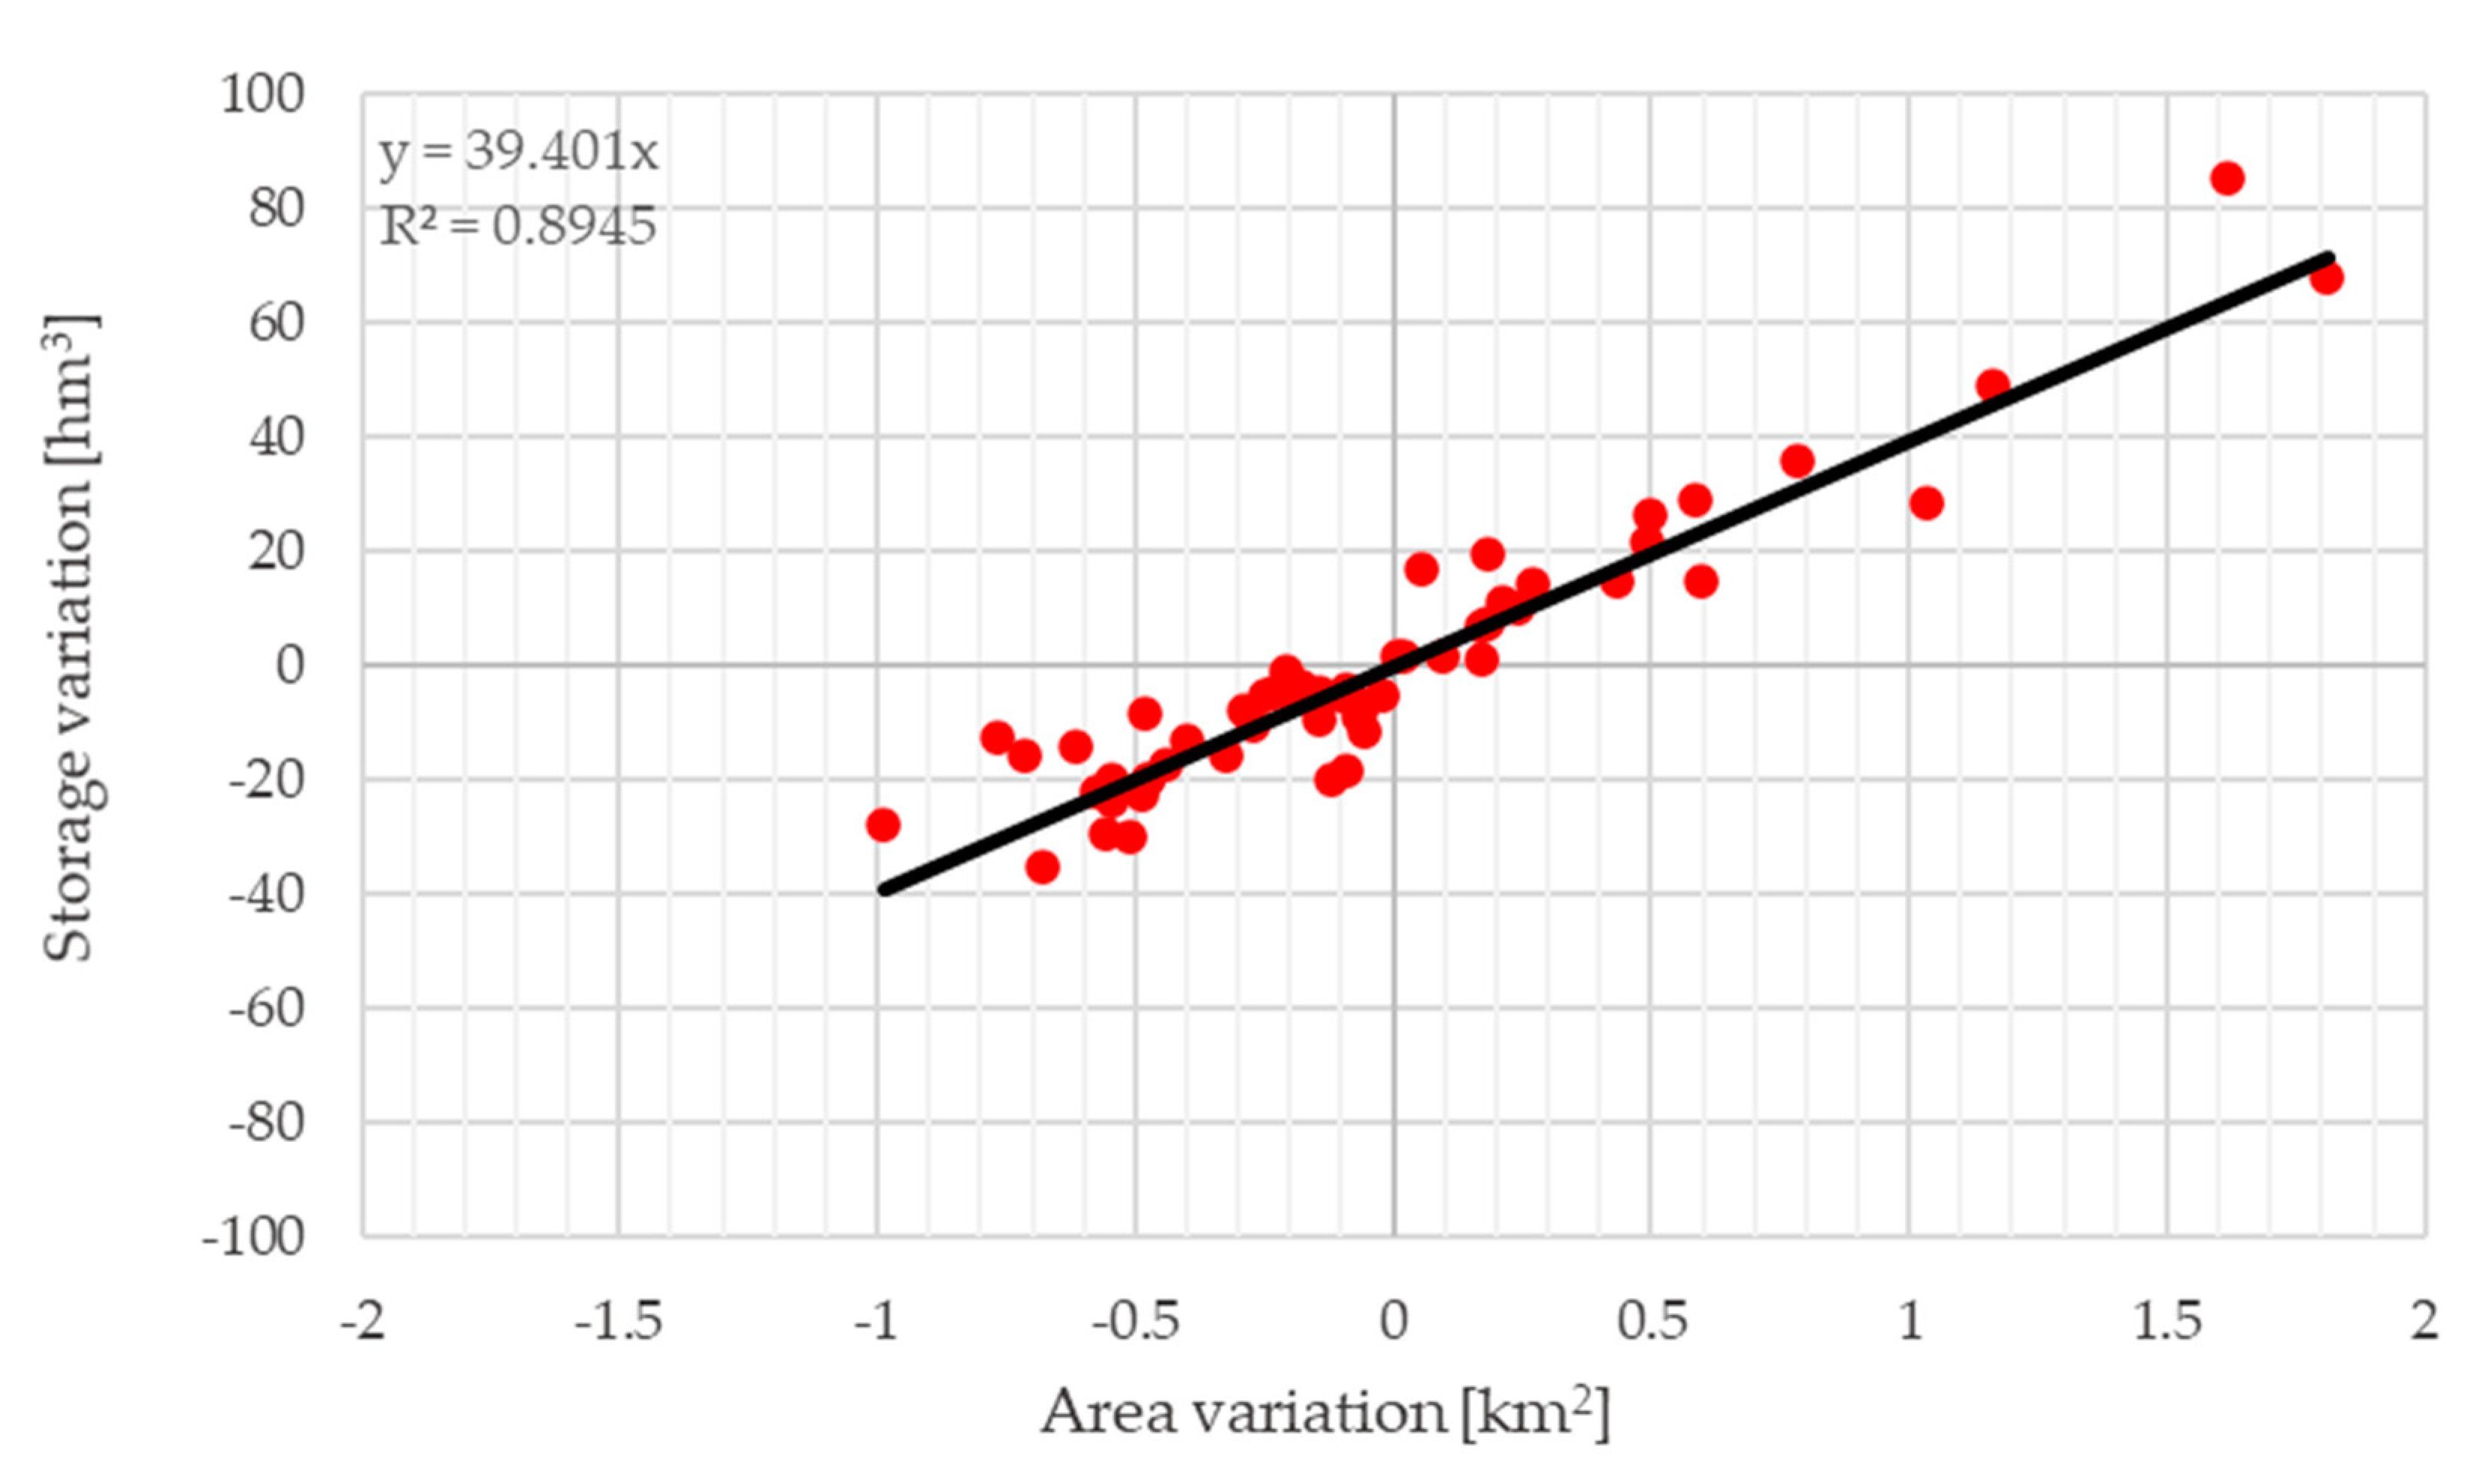
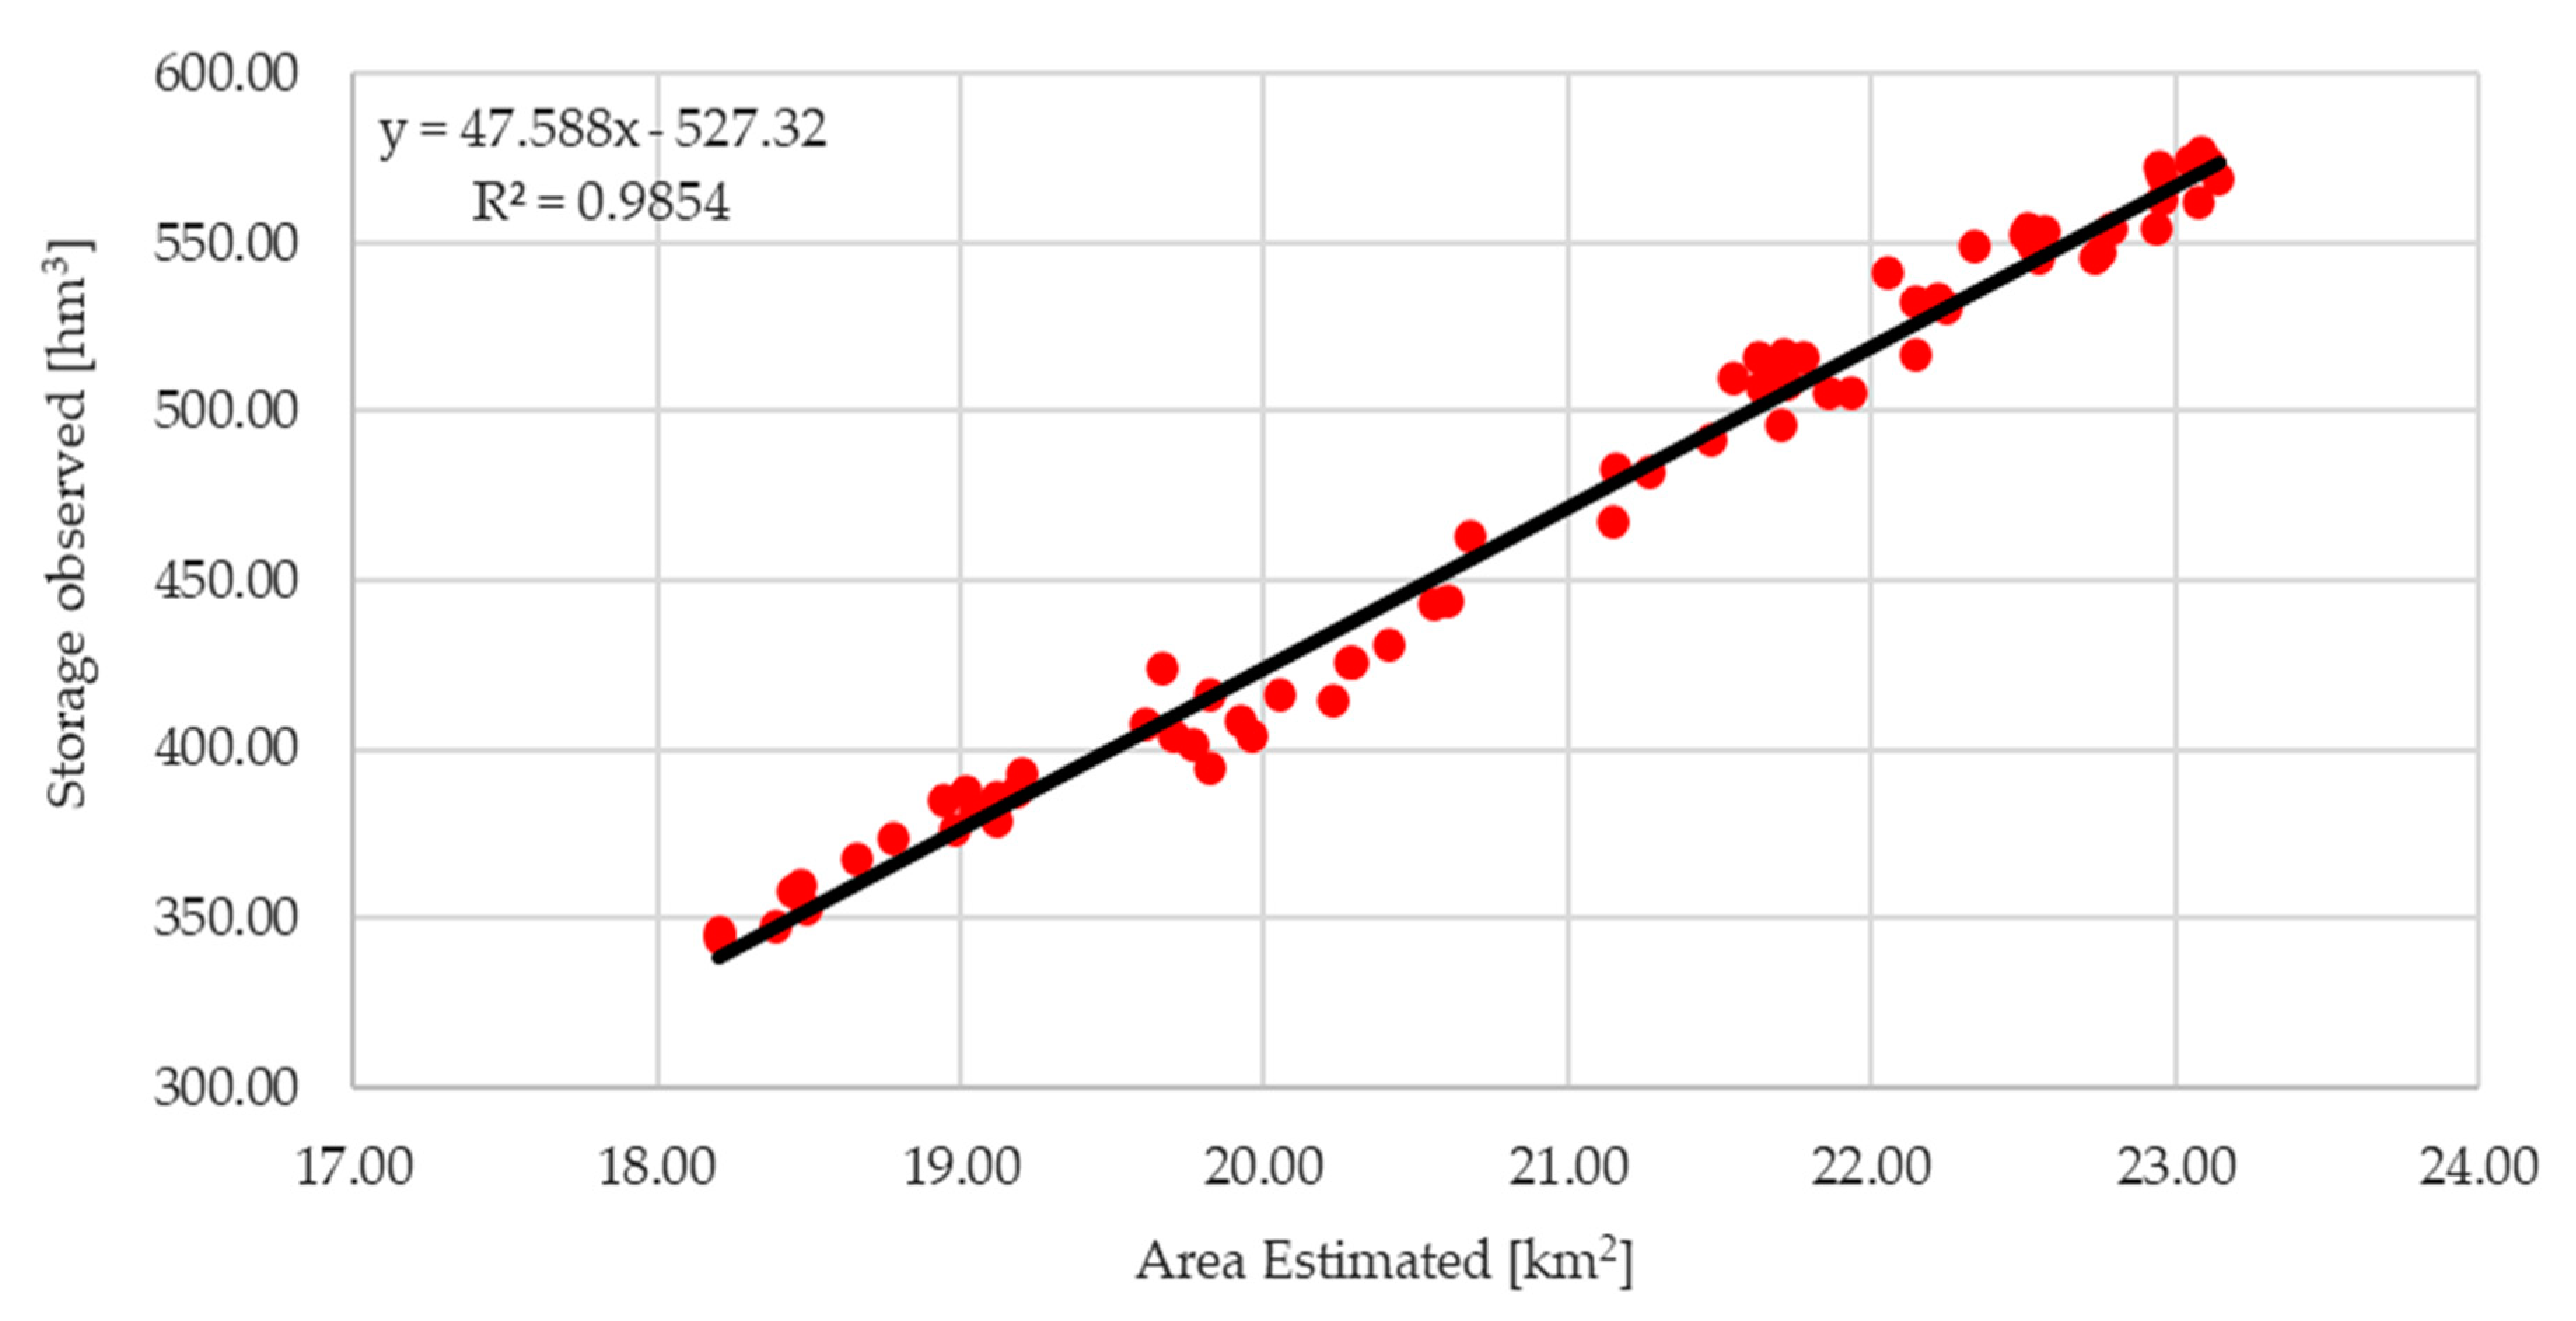
3.1.1. Sentinel-2-Derived Water Area—Storage Relationship and Reservoir Water Cycle

Regarding the reservoir’s water area and storage relationship, a linear expression was found to be fitting and is shown in Figure 5. The reservoir’s annual water cycle was also examined. For the time period examined, four reservoir emptying and five reservoir filling periods were identified. The highest filling period was found to be during the hydrologic year 2019 (from September 2018 to February 2019, “Wet 2019” in Figure 6), and the highest emptying was found to be during the hydrologic year 2021 (from March 2021 to September 2021). During the abovementioned filling period, a storage increase of 218.53 hm3 was observed, corresponding to a water area increase of 4.64 km2 and to an average filling rate of 1.477 hm3/d and of 0.031 km2/d. During the abovementioned emptying period, a storage decrease of 104.04 hm3 was observed, corresponding to a water area decrease of 2.19 km2 and an average emptying rate of 0.534 hm3/d and of 0.012 km2/d, respectively. Figure 6 presents the water area–storage variation pairs between consecutive measurement dates.
Regarding consecutive measurements-derived filling and emptying maximum rates, the following were identified. From December 2018 and January 2019, Yliki stored 67.6 hm3 and the reservoir area was increased by 1.81 km2, resulting in a filling rate of 3.38 hm3/d and 0.091 km2/d. The highest emptying rate was identified between July and August 2021, when Yliki outpoured 19.99 hm3 and water area was decreased by 0.47 km2, corresponding to an emptying rate of 0.91 hm3/d and 0.022 km2/d. The above rates can be identified as the steepest slopes between two consecutive points in Figure 3.

3.2. Sentinel-3 Time Series

From the extraction of the reservoir’s water level, spanning from November 2018 until September 2021, 37 water level estimations were paired with same-day reservoir storage observations, resulting in Figure 7. The maximum water level observed was 80.1 m, corresponding to a storage of 571.5 hm3, whilst minimum water level observed was 71.3 m, corresponding to a storage of 385.9 hm3. The average water level of Yliki reservoir during the observed time period was found to be 77.4 m, corresponding to an average water storage of 518.7 hm3. Overall, the correlation between the Sentinel-3 water level measurements and the same-day storage observations is equal to 98.81%. Thus, it is evident that the reservoir’s water level can be efficiently monitored by the satellite instruments, such as Sentinel’s-3 SRAL. Regarding the statistical analysis of the 37 water level estimations, they averagely consisted of 7.3 point measurements within the reservoir water content, ranging from 2 to 12 point measurements. Additionally, the average standard deviation between the point measurements of each date’s water level estimation was calculated at 291 mm, in strong agreement with the bias, referenced in Section 2.3.2, of the OCOG retracker.

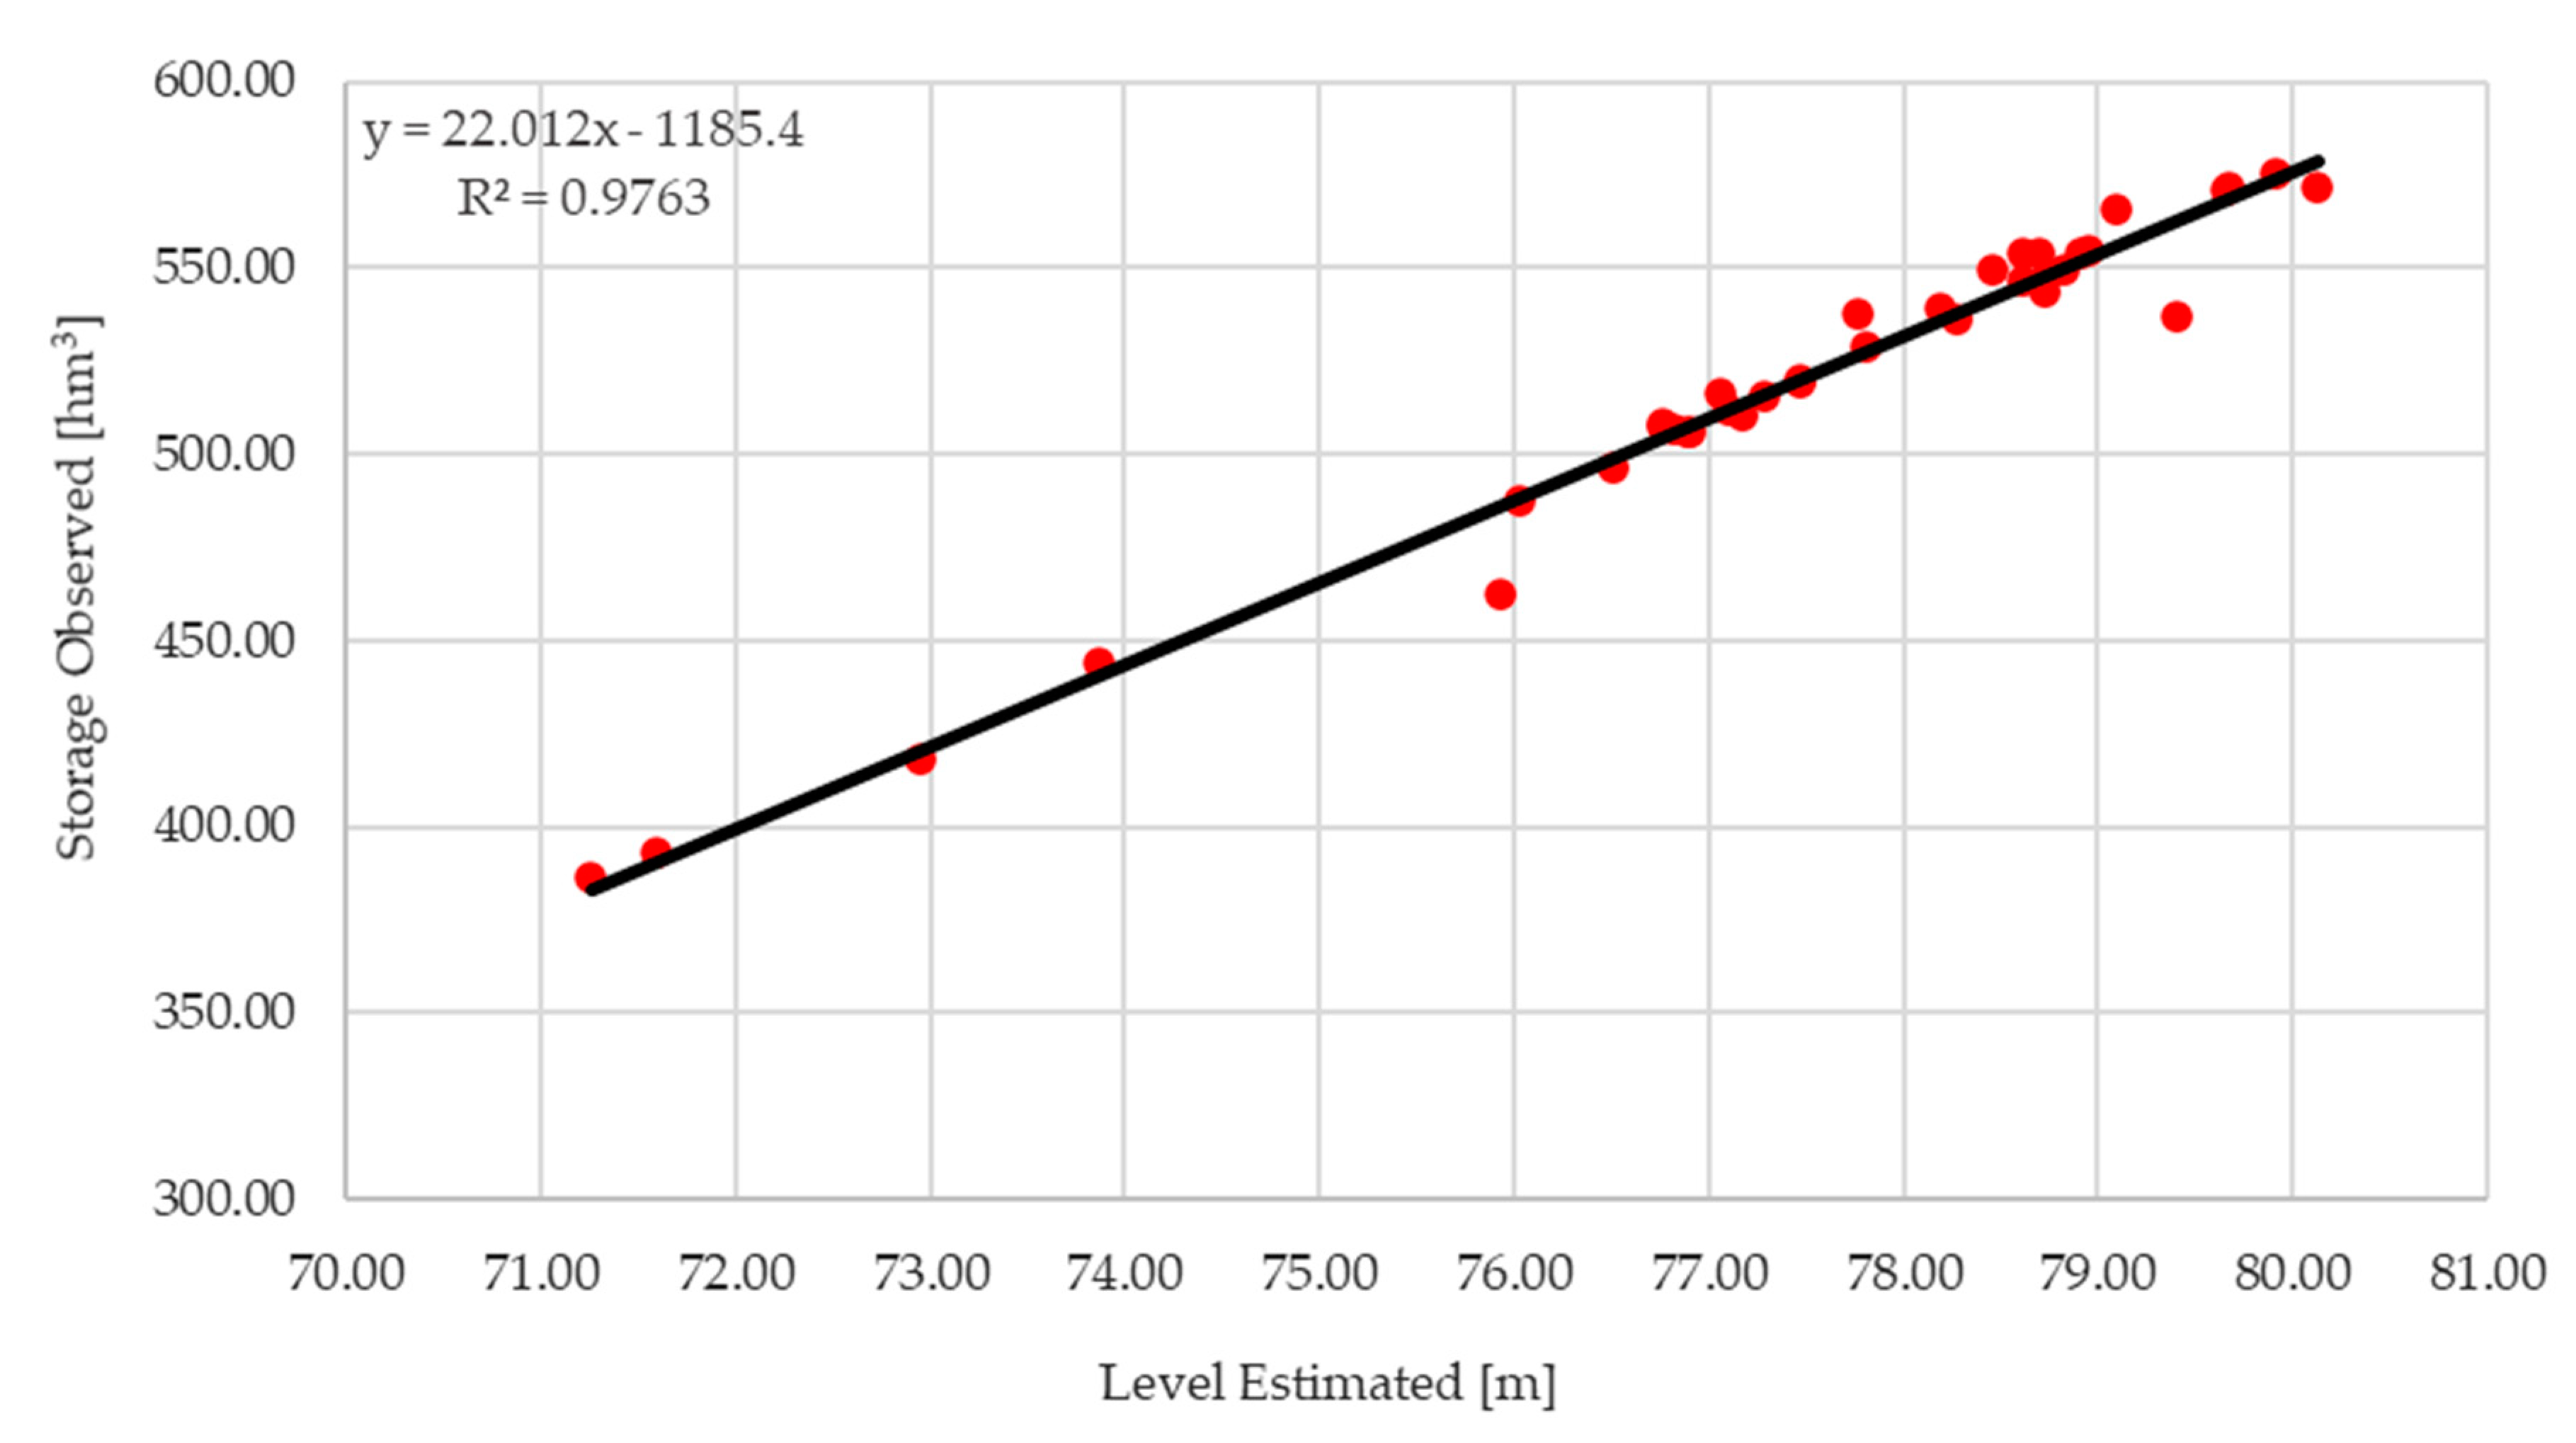
3.2.1. Sentinel-3-Derived Water Level–Storage Relationship and Reservoir Water Cycle

Regarding the reservoir’s water level and storage relationship, the linear expression was found to be the most fitting one and it is shown in Figure 8. The reservoir’s annual water cycle was also examined. For the time period examined, three reservoir emptying and two reservoir filling periods were identified. The highest filling period was found to be during the hydrologic year 2020 (from September 2019 to April 2019), and the highest emptying was found to be during the hydrologic year 2021 (from March 2021 to September 2021). During the abovementioned filling period, a storage increase of 63.3 hm3 was observed, corresponding to a water level increase of 3.4 m and to an average filling rate of 0.293 hm3/d and of 0.016 m/d. During the abovementioned emptying period, a storage decrease of 105.5 hm3 was observed, corresponding to a water area decrease of 5.0 m and an average emptying rate of 0.652 hm3/d and of 0.031 m/d, respectively. Figure 9 presents the water area–storage variation pairs between consecutive measurement dates.
Regarding consecutive measurements-derived filling and emptying maximum rates, the following were identified. From December 2018 to January 2019, Yliki gained 78.4 hm3 and water level was increased by 3.6 m, resulting in a filling rate of 2.904 hm3/d and 0.132 m/d. The highest emptying rate was identified between July 2021 and August 2021, when Yliki abolished 20.2 hm3 and water level was decreased by 2.3 m, corresponding to an emptying rate of 0.749 hm3/d and 0.087 m/d. The above rates can be identified as the steepest slopes between two consecutive points in Figure 7.

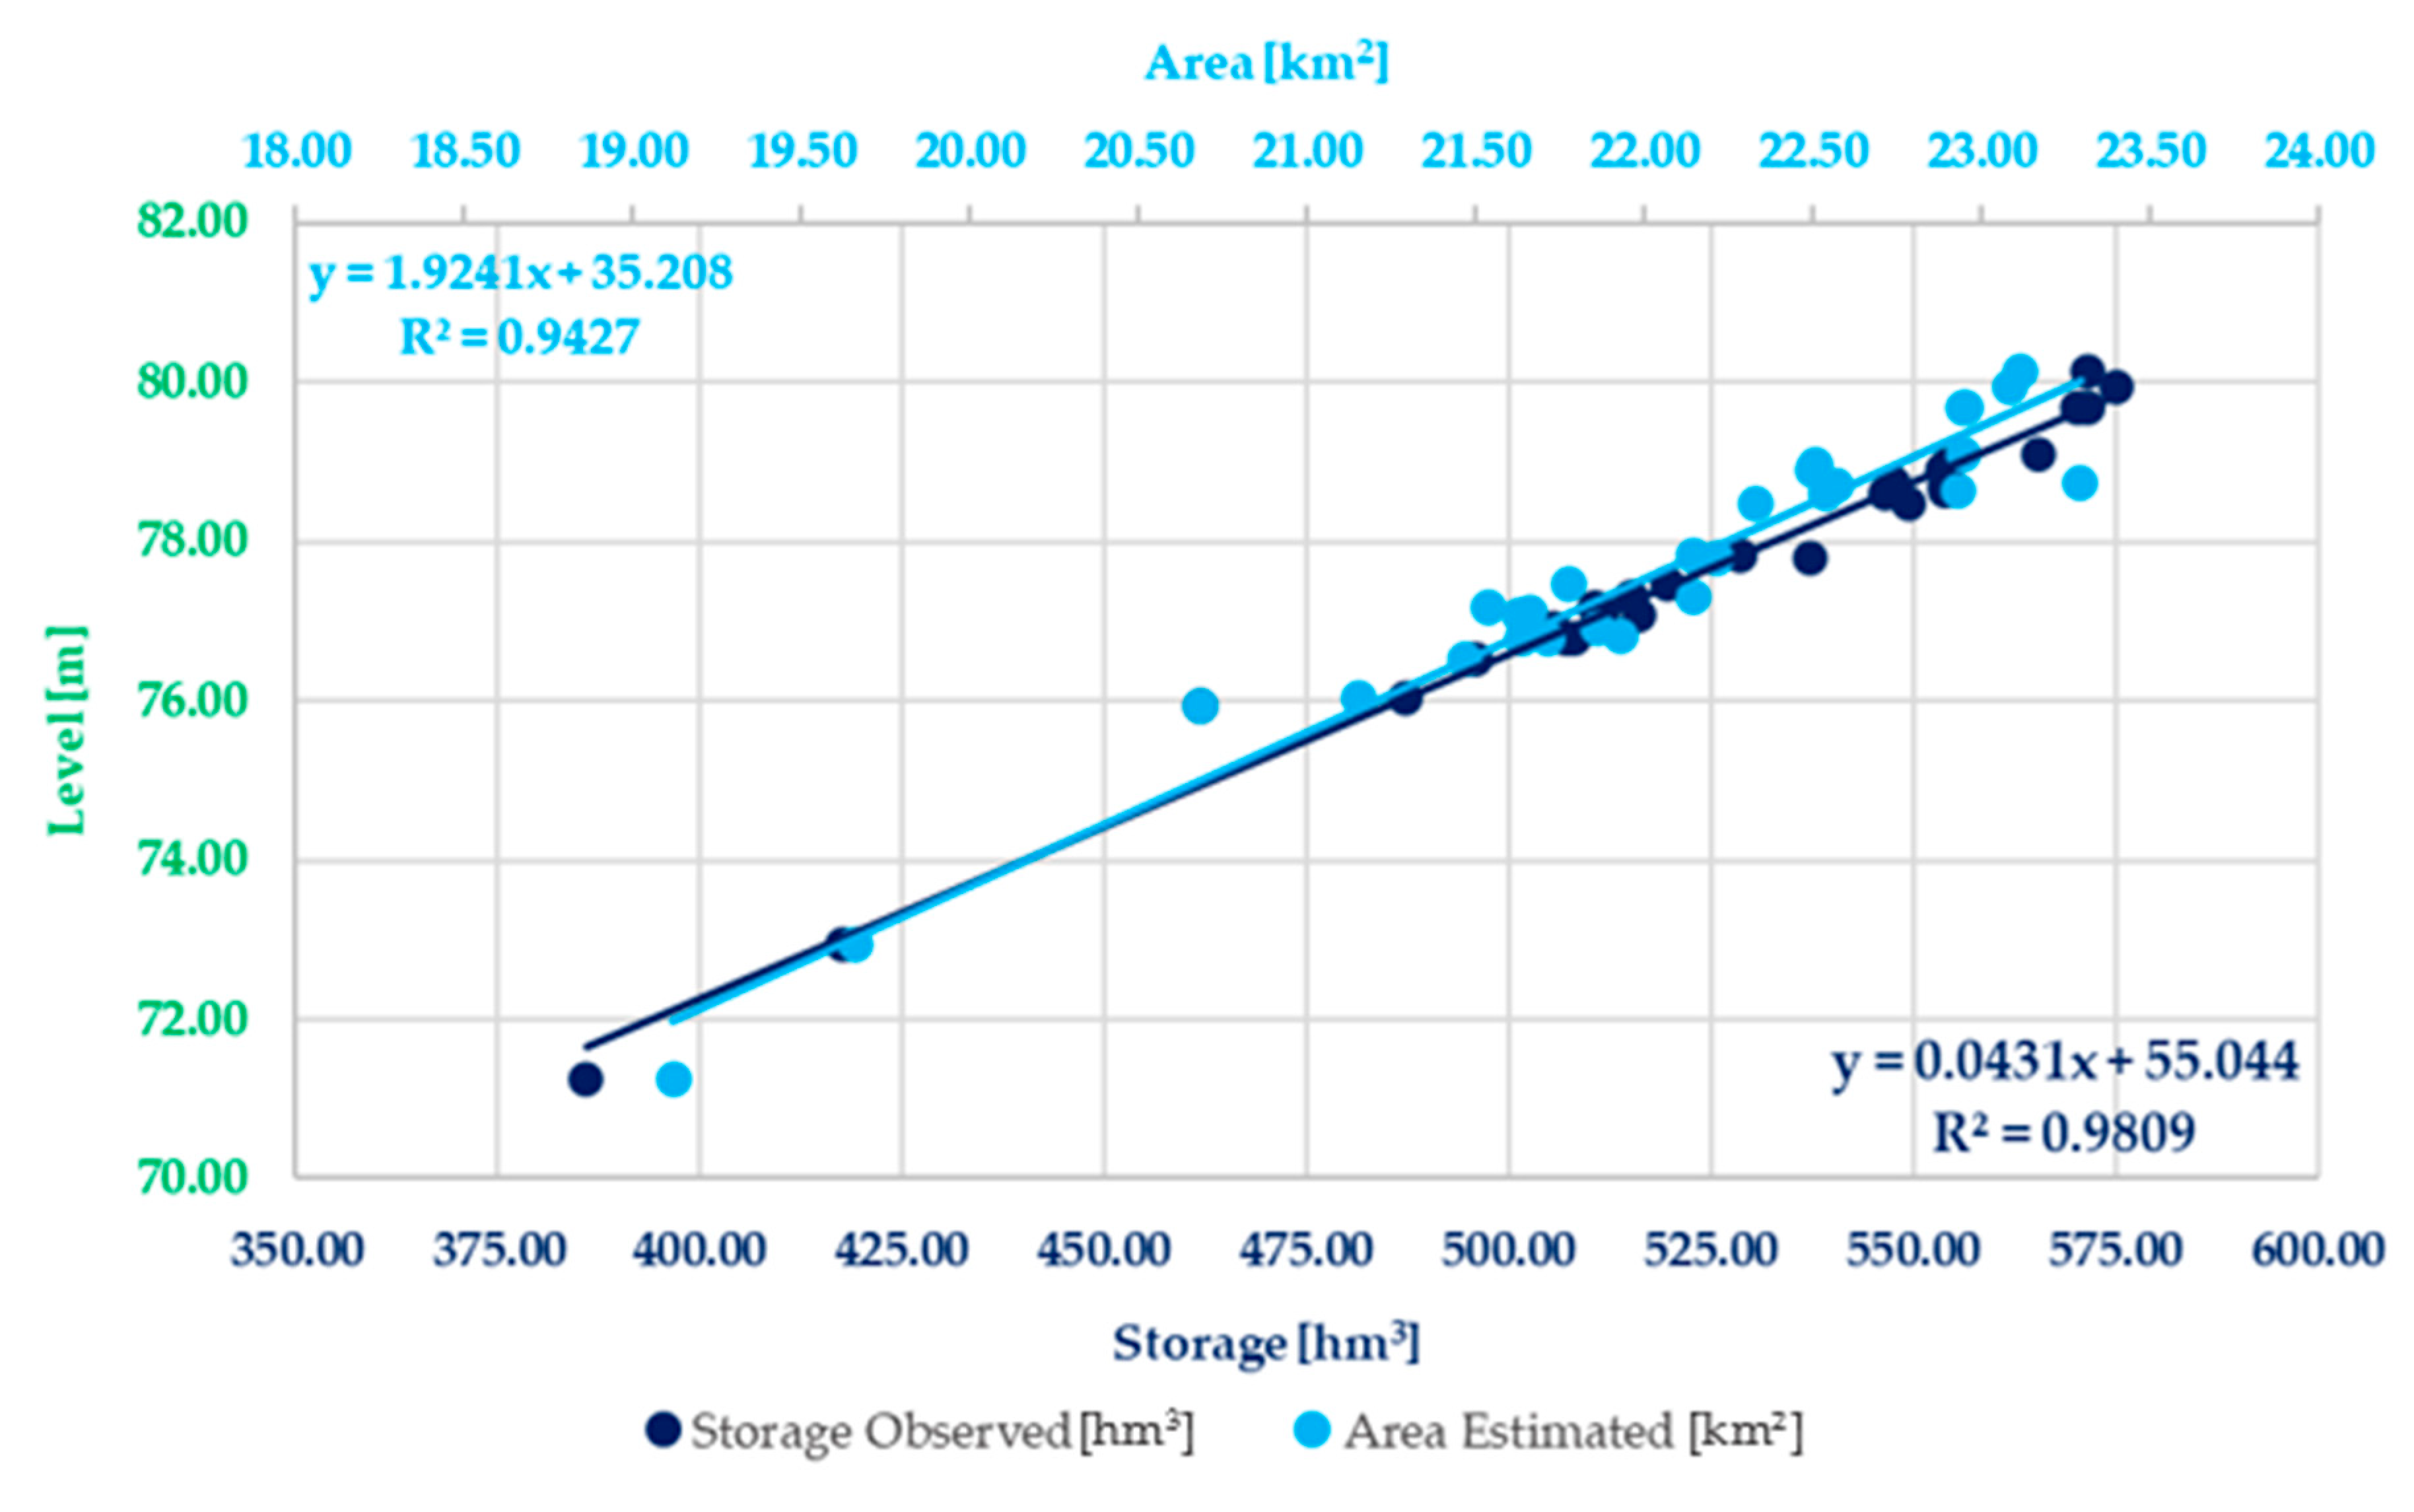
3.3. Combination of Sentinel-2 and Sentinel-3 Data

Different time lags between Sentinel-2 and 3 products were examined, ranging from 1 to 10 days, while considering the reservoir’s in situ observed storage variability. The 1-day, 5-day, and 7-day variations are depicted in Figure 10 as percentages of the reservoir’s maximum storage, along with the observed storage time series for the time period covered by both Sentinel-2 and Sentinel-3 data. Regarding daily storage variation from the end of October 2018 until the end of October 2021, an average variation of 0.10% of the reservoir’s maximum storage is calculated, with a maximum daily variation of 1.44%. The 5-day time lag, proposed by Baup et al. [18] for small lakes, results in an average 5-day variation of 0.46% of the reservoir’s maximum storage. Respectively, a maximum 5-day variation of 5.55% is observed. A weekly (7-day) time lag is also examined, and similar results to the 5-day time lag are observed. More specifically, the average weekly storage variation of Yliki reservoir is calculated at 0.64% of the reservoir’s maximum storage. Respectively, the maximum observed weekly variation is found to be 6.64% for the time period examined.
The number of quasi-synchronous water level and area pairs, derived from each time lag option, are compared. The number of pairs from the 7-day time lag is significantly greater than the daily and 5-day time lag. More explicitly, if a 7-day time lag is chosen, 28 pairs of water level and area are derived. On the contrary, the 5-day and the daily time lag produce 20 and 2 pairs, respectively. Thus, the choice of a 7-day time lag and the consequent acceptance of about 1% higher variation of storage provides 40% more measurements than the 5-day time lag, in order to validate the most suitable storage variation estimator (see Section 3.4).
As also discussed in Section 3.1 and Section 3.2, both the normalized water area and level time series are found to closely follow the normalized storage observations. The 28 paired water level and area pairs present correlation of 97.95%. Each of the two time series present correlations with the storage observations of 99.04% and 98.73%. Regarding each pair’s storage variation between the water level and area measurements dates, this stands for 0.29%.
Figure 11 presents the abovementioned 28 double pairs of water level–water area and water level–water storage. The derived empirical relationships show a strong linear behavior. It is observed that the coefficient of determination, R2, of the empirical relationship between the level estimated and the observed storage is higher than the R2 between the estimated water level and the estimated area. The above is considered reasonable; hence the latter relationship inherits the uncertainties of both Sentinel-2 and Sentinel-3 missions and the proposed methodology.

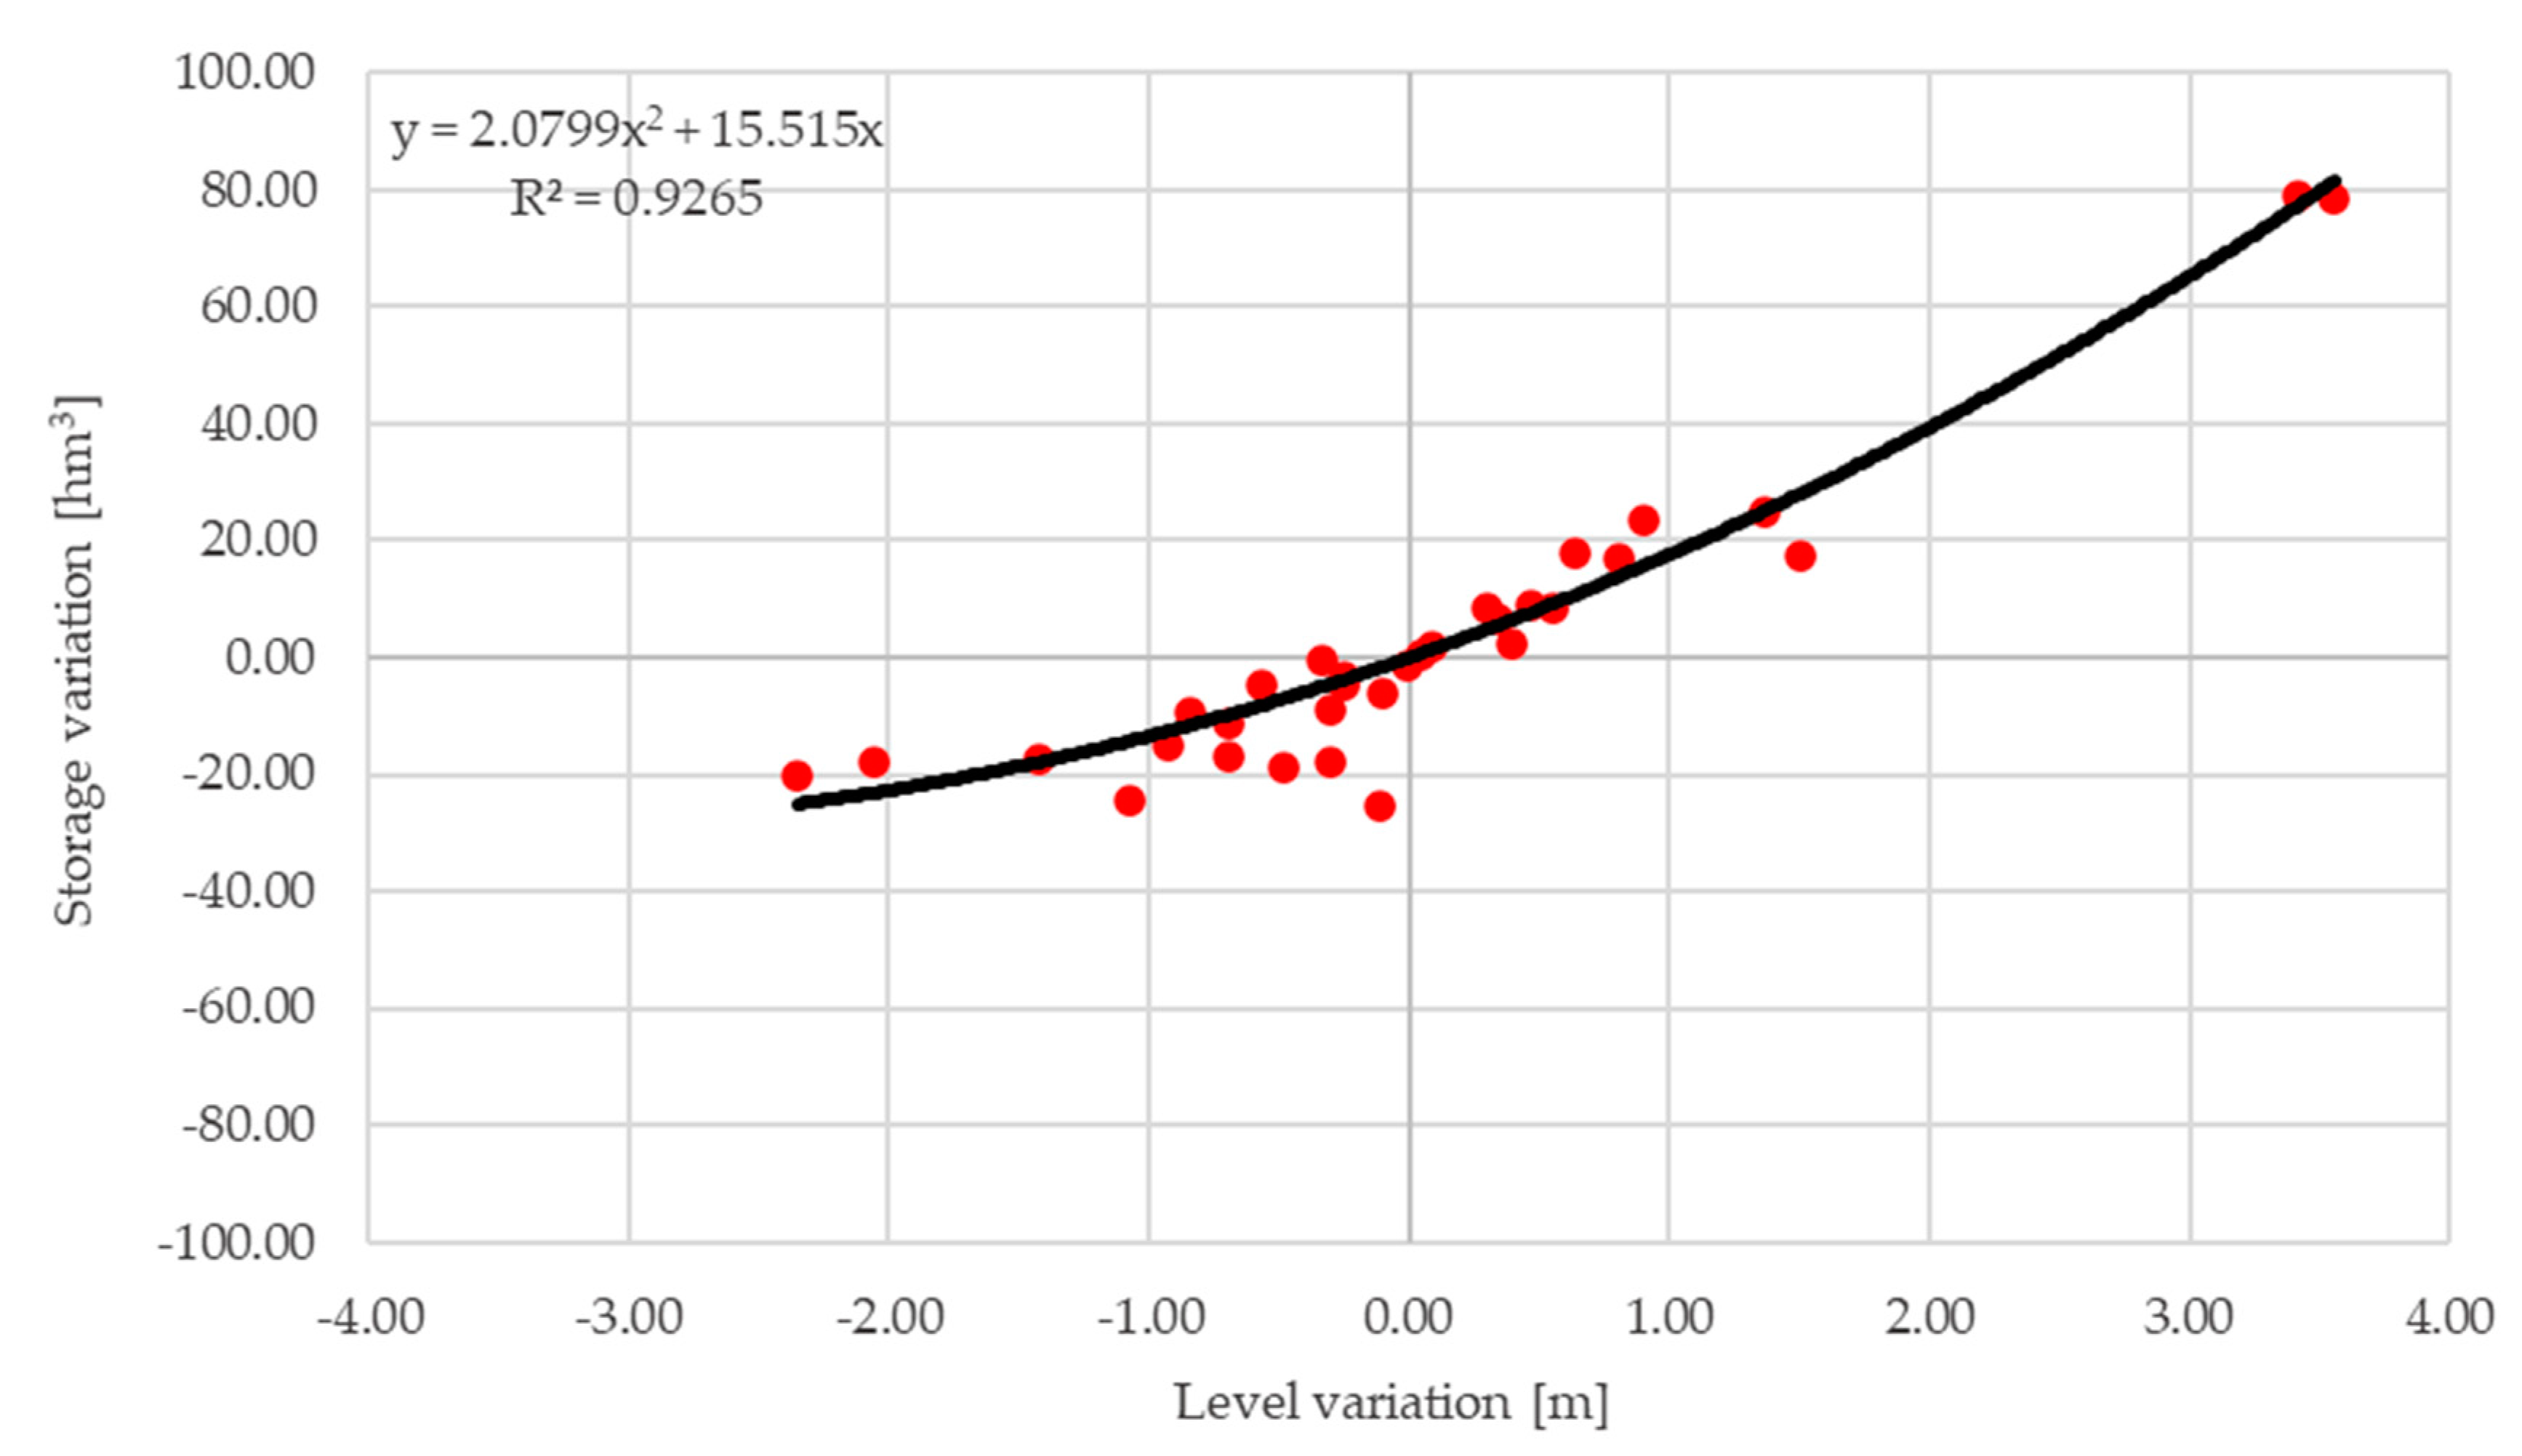
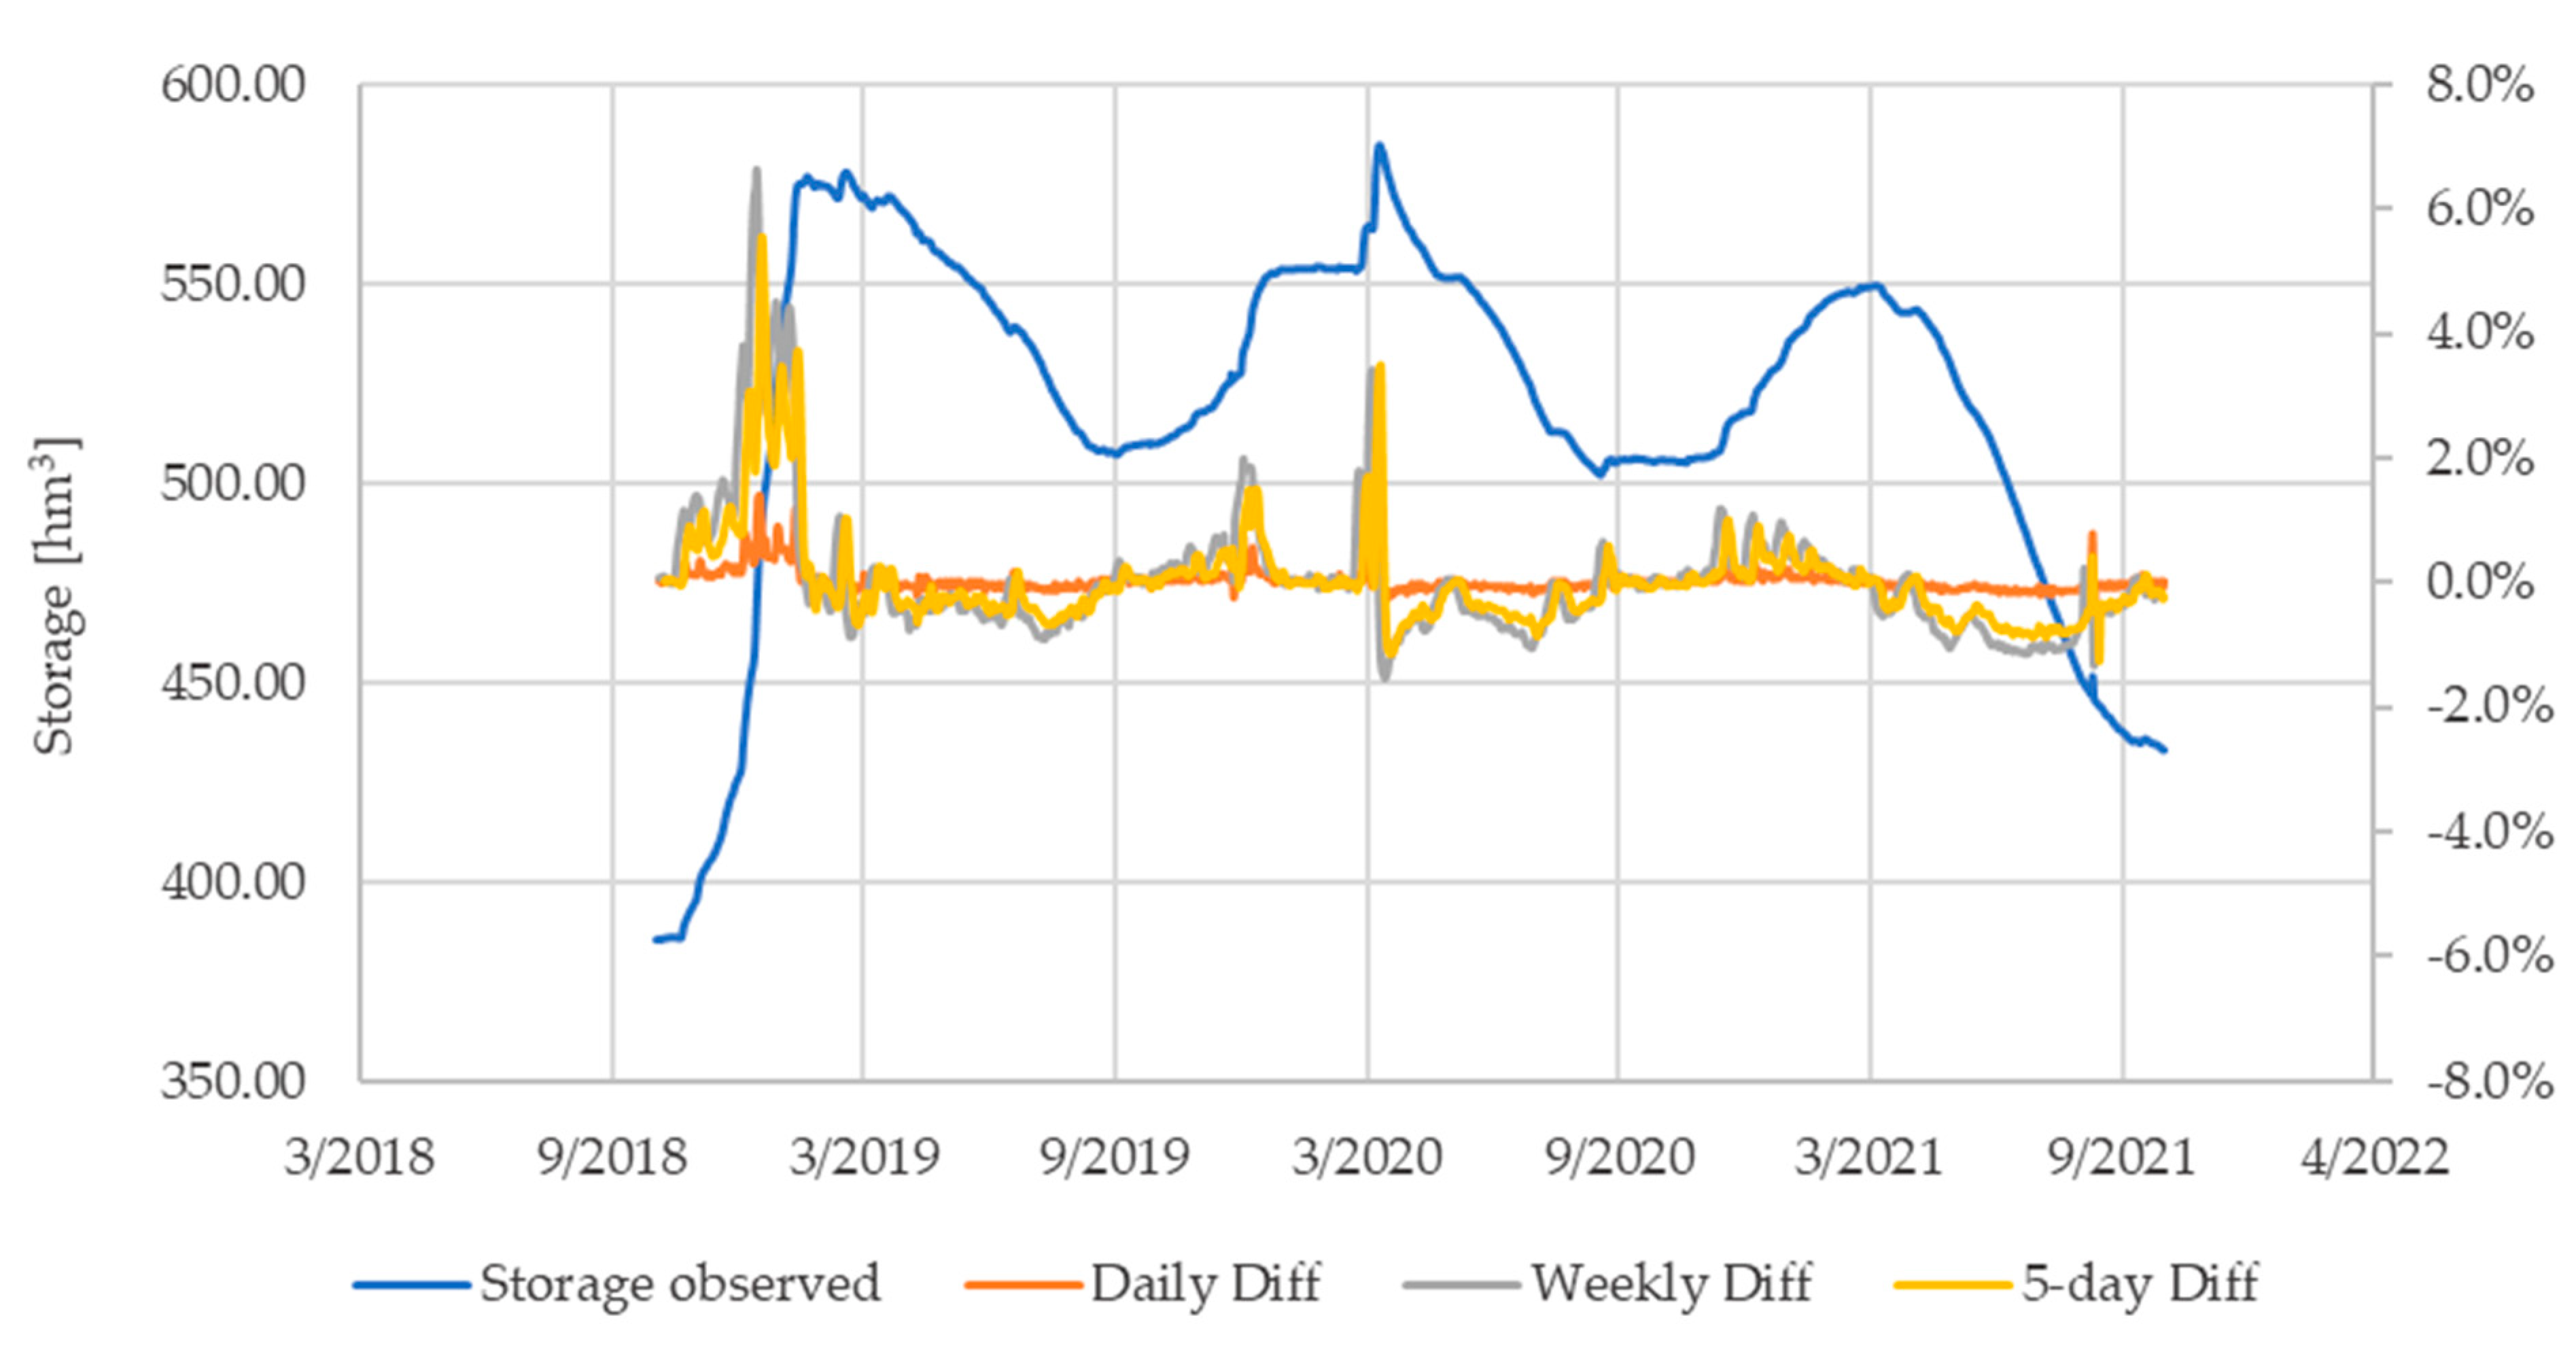
3.4. Estimating Water Storage Variation

From the above-selected 28 quasi-synchronous pairs of water level and water area, the storage variation estimator methodologies described in Section 2.3.4 are tested in comparison with the observed storage variation. The derived storage variation time series of the proposed methodologies are presented in Figure 12. Taking into account the results presented in Table 1, it is evident that the methodology proposed by T. Busker et al. [2] is the weakest for estimating storage variation from Sentinel-2 and Sentinel-3 data, compared to the observed storage variation time series, in matters of RMSE, correlation, and logical faults, where a logical fault is considered to be an estimated storage variation of different sign of the observed one. Followingly, it is found that the proposed storage variation estimation methodologies from F. Baup et al. [18], Y. Lin et al. [20], and J. Crétaux et al. [55] present similar results that are superior to the T. Busker et al. [2] methodology. In terms of RMSE and correlation, the methodology proposed by Y. Lin et al. [20] provides slightly more accurate results than the ones of F. Baup et al. [18] and J. Crétaux et al. [55]. As a result, this is considered the most suitable methodology in order to estimate the storage variation of Yliki reservoir.
In more detail, Y. Lin et al.’s [20] proposed methodology incorporates the integral as presented in Equation (5), which is solved by utilizing an empirical linear relationship deriving from the 28 quasi-synchronous pairs of water level and water area. The solution of the integral for the Yliki reservoir is presented below in Equation (7) for two consecutive measurement dates, Ti and Ti+1.
Δ V = T i T i + 1 ( 0.4899 × h 15.989 ) d h
The logical faults presented in Table 1 occurred when the satellite-estimated water level and area showed a different sign of change than the observed storage. An example is given between September 2020 and October 2020, when water level and area were estimated to increase by 0.14 m and 0.22 km2, respectively. Thus, the discussed methodologies calculate an increment of storage. On the other hand, storage observations provided by the reservoir operator depict a storage decrease of 1.59 hm3.
Comparing the observed storage variation to the selected methodology of Y. Lin et al. [20] for the 28 quasi-synchronous water level–water area pairs, the following are documented. The average observed storage variation is calculated at 2.82 hm3, while the estimated storage variation has an average of 3.48 hm3. Maximum reservoir filling between consecutive pairs observed accounts for 79.05 hm3, and the corresponding storage variation estimation accounts for 76.20 hm3. Similarly, maximum reservoir emptying observed accounts for 33.22 hm3 and the corresponding storage variation estimation accounts for 32.55 hm3.
Within the available pairs temporal range, two hydrologic years are identified and the corresponding filling and emptying periods of the reservoir are discussed. From February 2019 until mid-September 2019, Yliki reservoir lost 66.79 hm3 of water, while the decrease estimated from satellite data storage was found to be 70.49 hm3. The difference between the observed and estimated storage variation accounts for 0.62% of the reservoir’s capacity. From mid-September 2019 until mid-April 2020, Yliki’s storage was increased by 63.30 hm3, while the estimated increase was found higher, at 75.31 hm3. The corresponding difference between the estimated and the observed storage variation accounts for 2.00%. Similarly, for the proceeding emptying (mid-April 2020 to late October 2020) and filling (late October 2020 to early March 2021) periods, the difference between observed and estimated variation accounts for 1.05% and 0.08%, respectively.

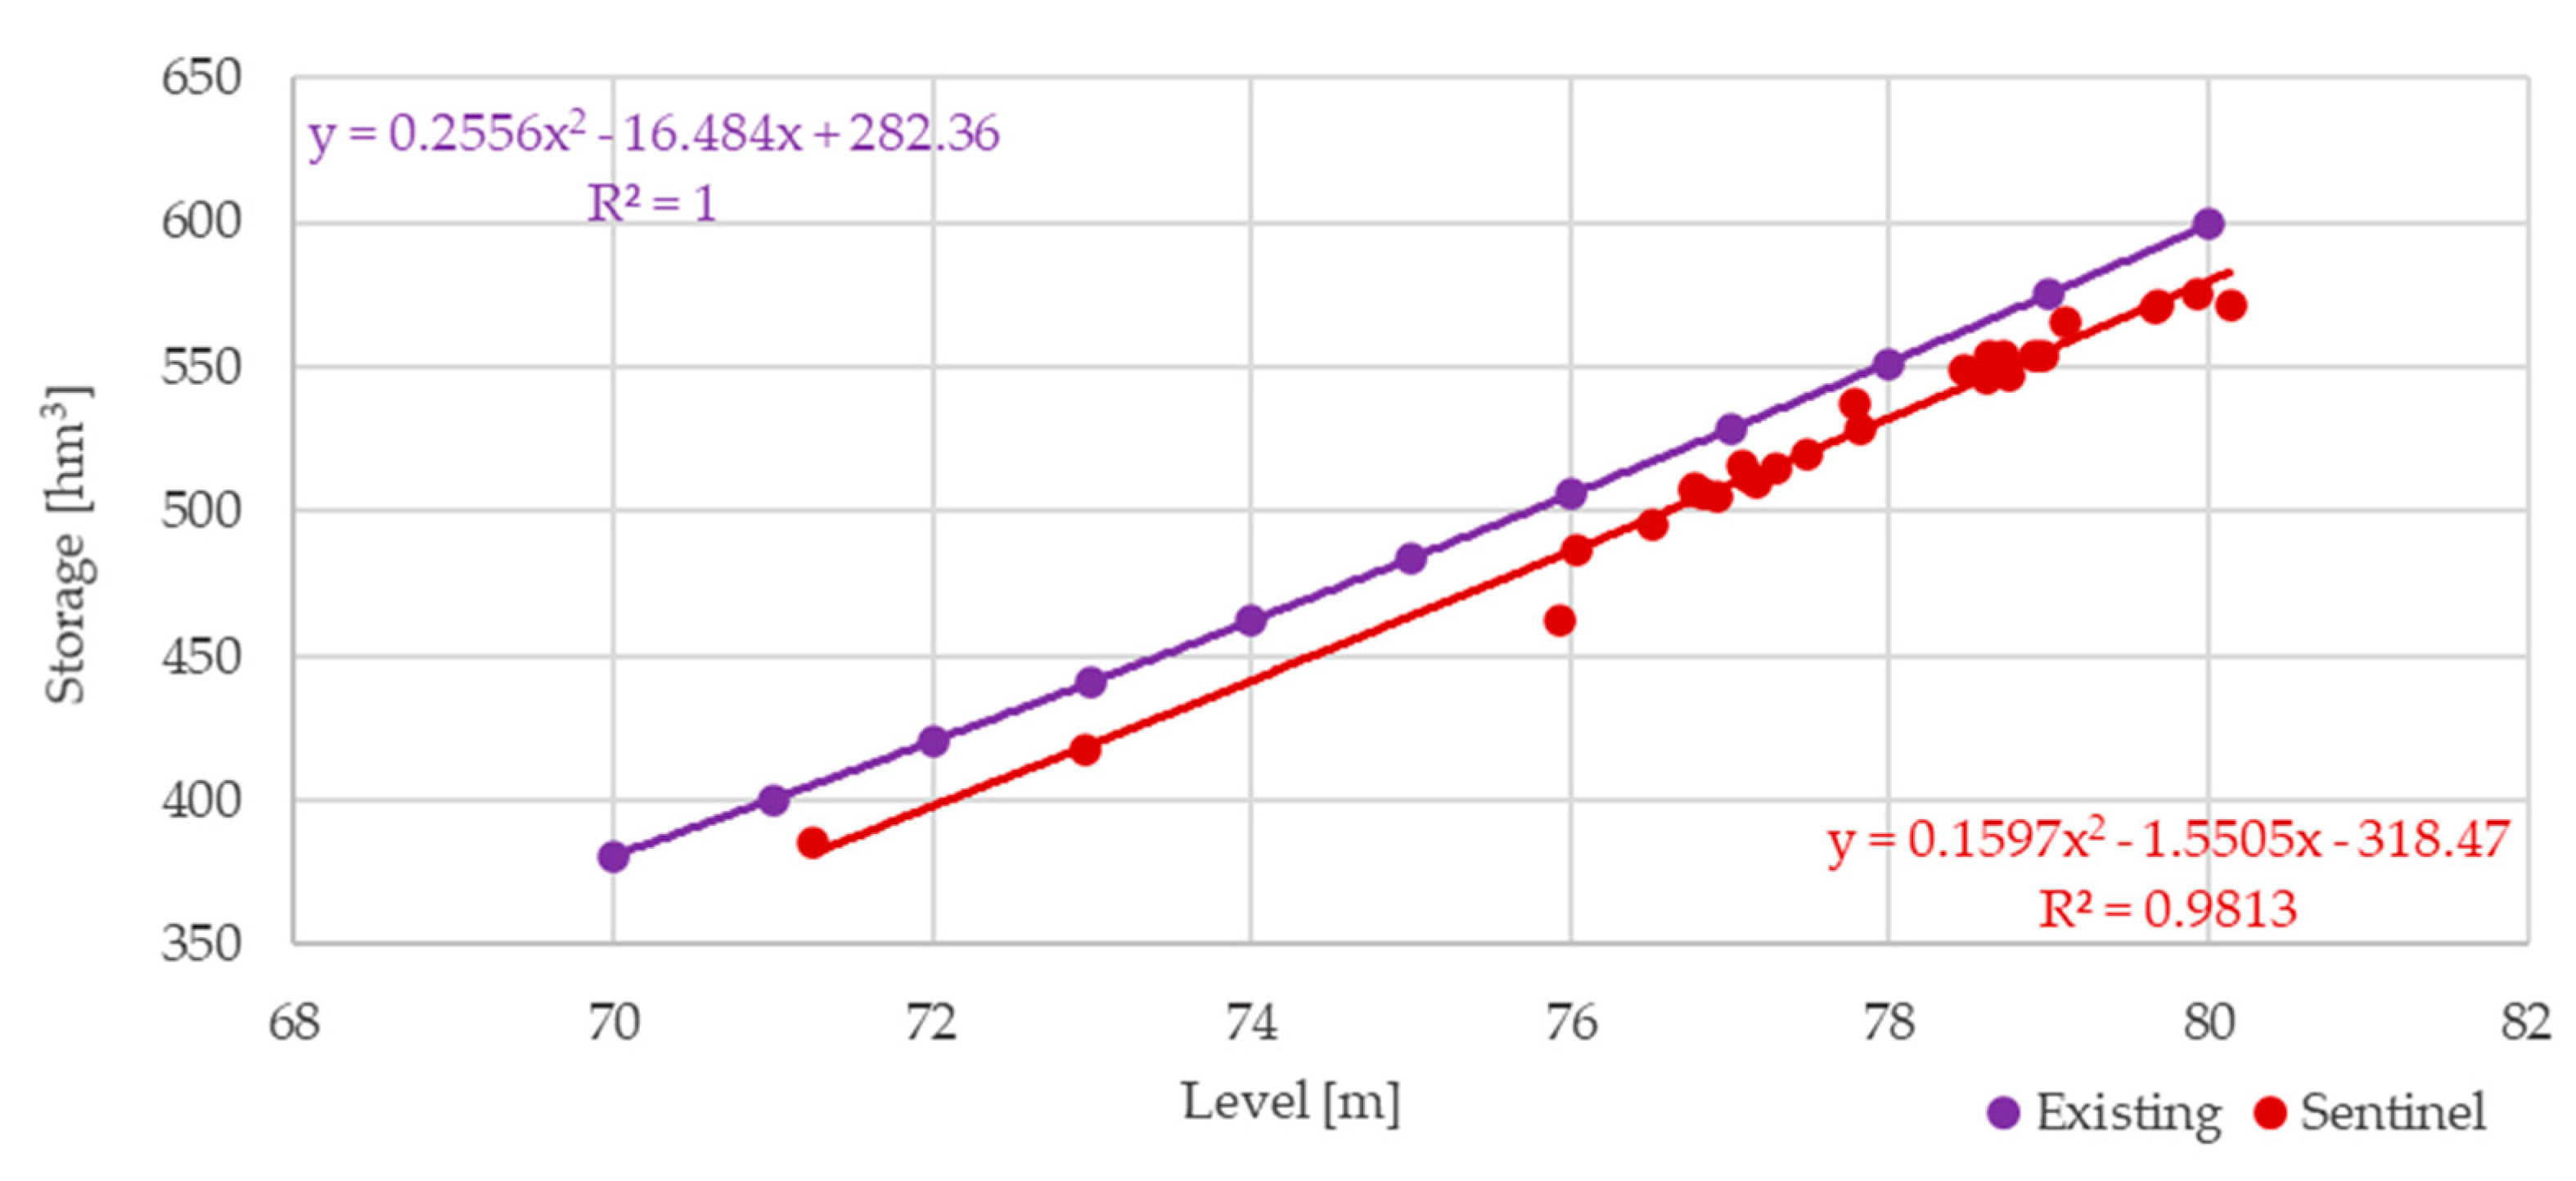
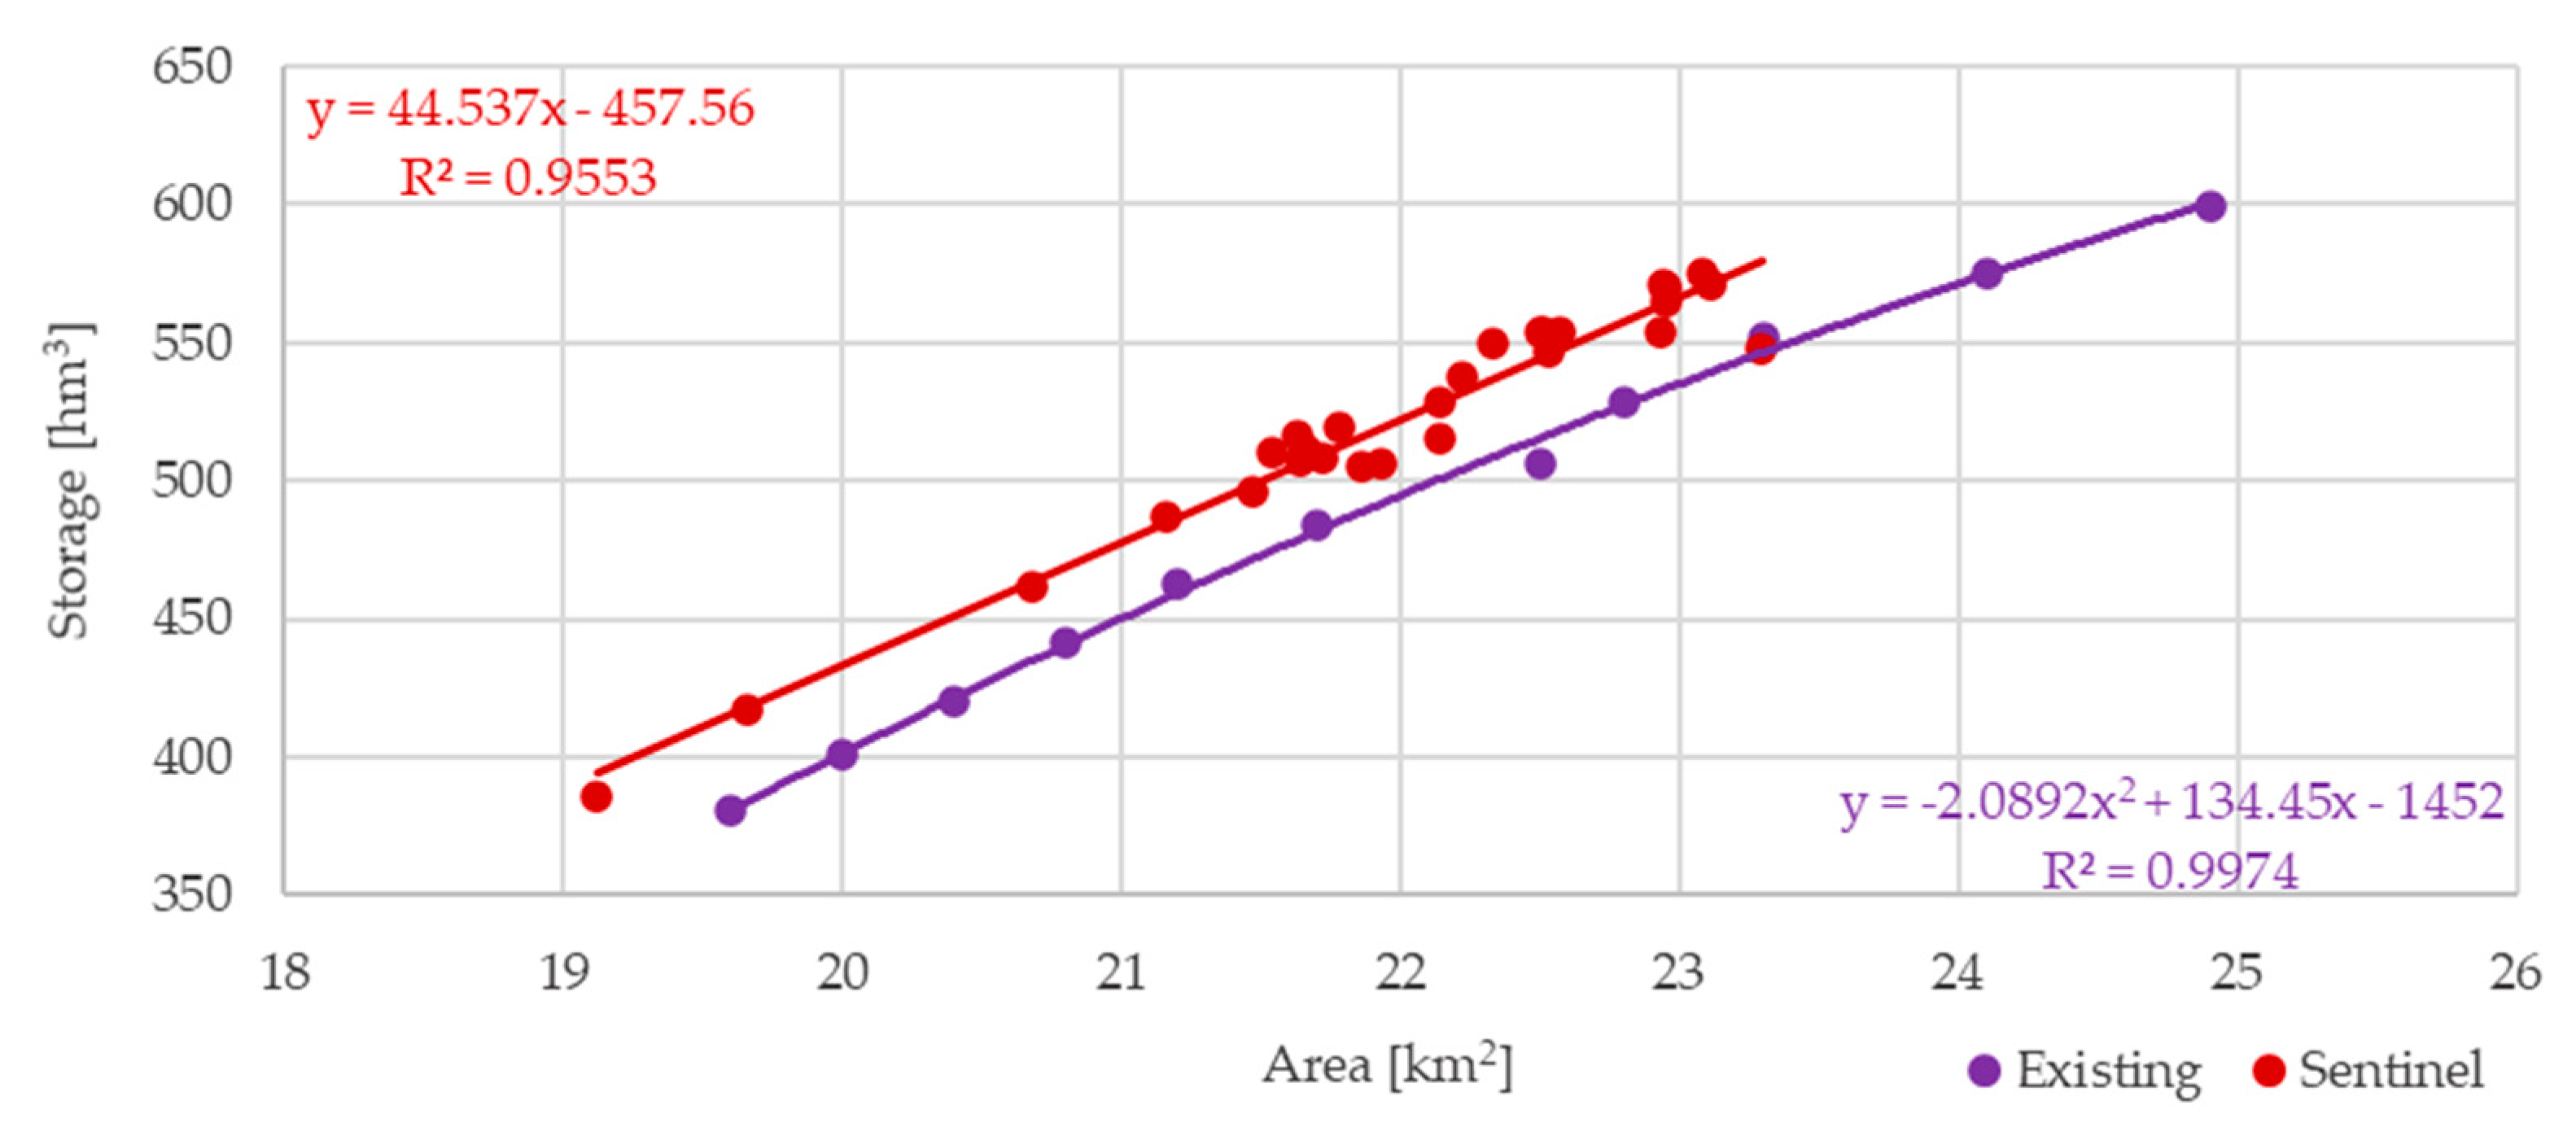
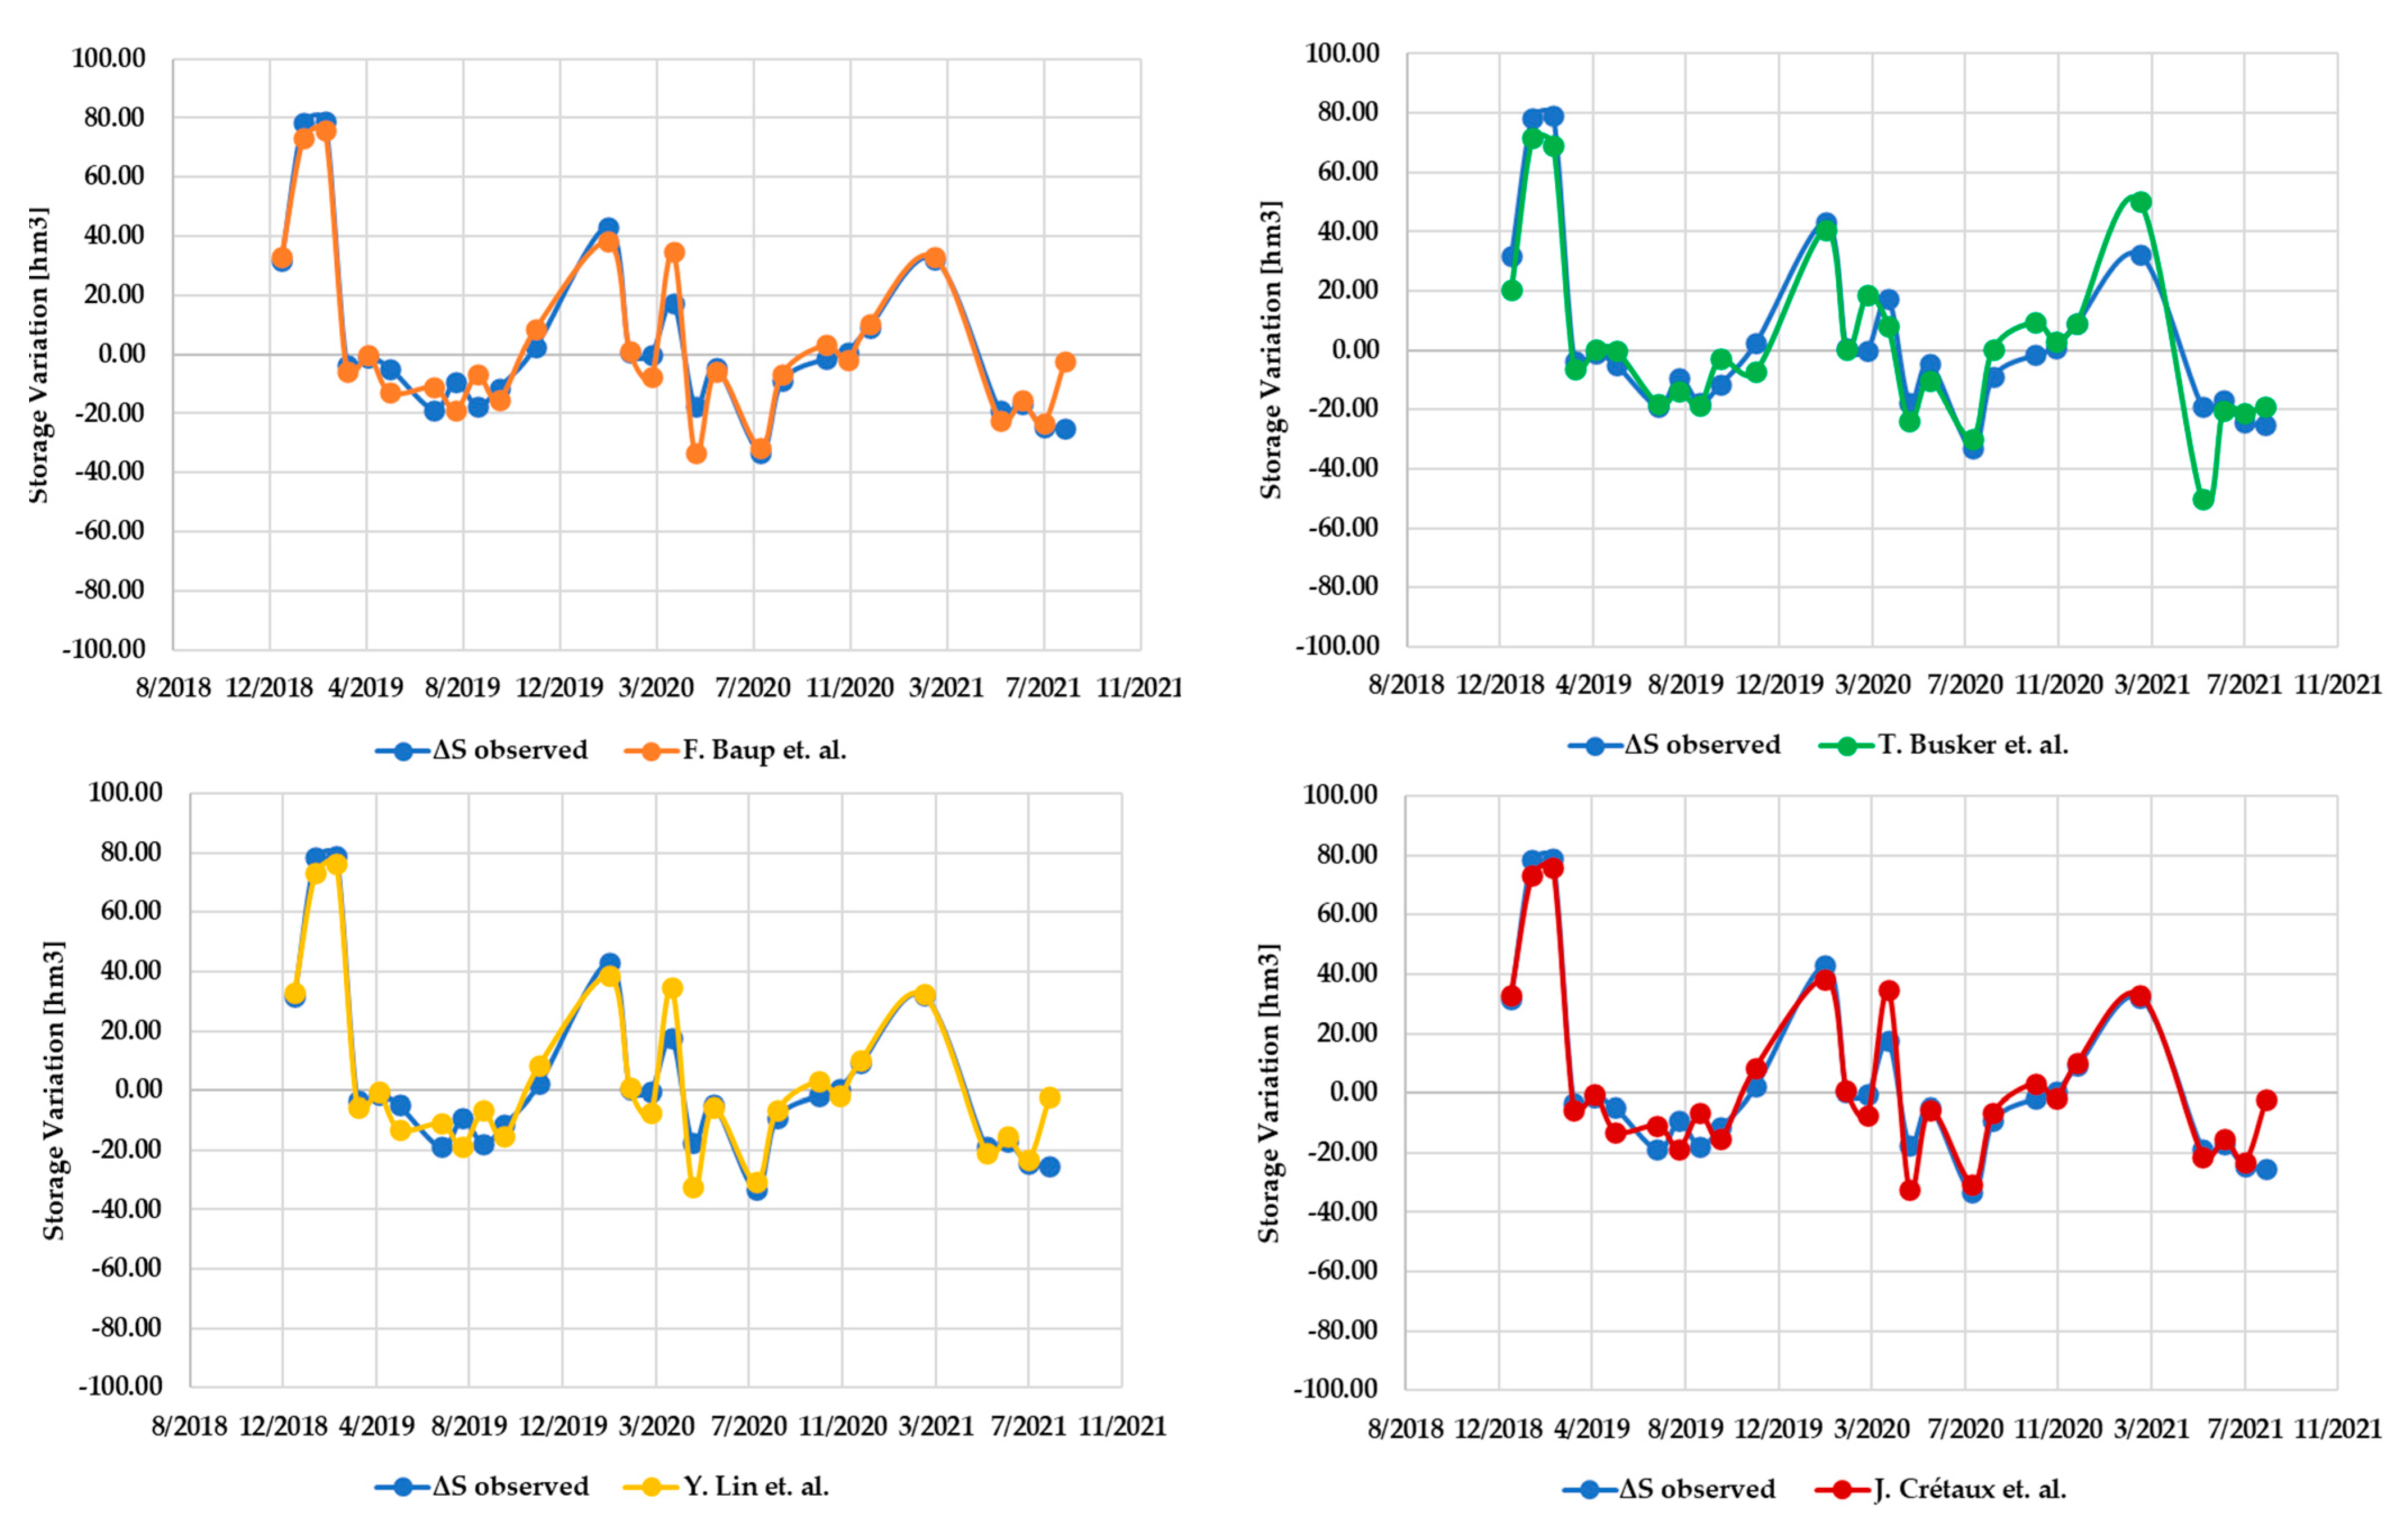
3.5. Comparison with Existing L–A–S Curve

The derived pairs of level–storage and area–storage are additionally compared with an existing level–area–storage of Yliki reservoir, presented by Efstratiadis and Tsoukalas [42]. Both Figure 13 and Figure 14 indicate a difference between the existing L–A–S curve and the Sentinel-observed L–A–S relationship. In the case of water level and storage, the present study’s L–S relationship underestimates the storage for the same water level compared to the existing. Regarding water area and storage, the derived empirical relationship estimates a smaller water area in order to store the same amount of water in comparison to the existing relationship. From the abovementioned comparison, an average difference of 5.51% of the reservoir’s capacity is identified Similarly, an average difference of 9.04% of the reservoir’s capacity is calculated.

4. Discussion

The present research attempted to develop and verify an approach with in situ observations and the applicability of remote sensing data utilization to estimate the water level, area, and storage variations of the Yliki reservoir. The efficiency of the NDWI, along with a measurement-specific threshold, is proved excellent, despite the complex terrain of the broader Yliki area. It is reaffirmed that the use of Sentinel-2 multispectral high-resolution images can provide valid estimates of a reservoir’s area in monthly and annual temporal resolutions. Hydrological cycle periods are traceable with the estimation of the reservoir’s water area.
Similarly, reservoir water level estimation from Sentinel-3 SAR data, without adopting a complex retracking or other correction procedures, shows high levels of efficiency. Thus, the application of a mean method for the SAR points towards the water level estimation is found to be feasible. Consequently, for reservoirs or lakes with similar spatial characteristics, such as Gahai Lake [19], there might not always be the development of specific algorithms necessary to sufficiently estimate the water level in monthly and annual temporal steps. As noted in Section 3.2.1, the standard deviation of each date’s measurement points was found within the calculated range of bias. The fact that the coefficient of determination between the water level estimated with the storage observations is calculated at 98.81% implies negligible implications on the present case study.
The present research results in another considerable finding regarding the time interval for combining water area and level estimations. While other researchers argue over 2 days [20] or 5 days back-and-forth interval for the combination of similar date estimations, this research proved that a 7-day interval can be applied. In that manner, accepting a slightly higher uncertainty in the case study, 1% higher than a 5-day interval, the increase of usable measurements is significant, at 40% higher than the 5-day interval in the present case study. The above should not be perceived as a solid approach to be applied universally in other lakes or reservoirs, but rather as an opportunity for further research aiming to systemize the acceptable time intervals for area and level estimations combination for storage variation tracking.
The examined Sentinel-2 and Sentinel-3 datasets provided combined information over the reservoir hydrology for a period of approximately 3 years. Thus, an opportunity arises for future research to further integrate level (ICESat-2, SARAL, etc.) and area (Sentinel-1, Landsat 8, 9, etc.) satellite observations. The aforementioned dataset enrichment will increase the available level–area pairs, providing further insights into periods when the reservoir storage was lower.
For the estimation of water storage variation, four methodologies were examined and compared to the observed water storage variation time series. The methodologies were tested for their ability and accuracy of capturing the reservoir’s storage variation. The suggested methodology by Y. Lin et al. [20] was found to be the most precise approach, characterized by an RMSE of 1.28% of the reservoir’s capacity. As the abovementioned methodology was tested by its authors on Lake Victoria successfully, the present research justifies its applicability on smaller lakes or reservoirs, such as Yliki reservoir. Moreover, the methodology proposed by Baup et al. [18] for very small lakes showed almost equally precise results. Thus, it can be argued that there is available space for the application of universal approaches towards the estimation of lake or reservoir water volume covering a broad range of lake or reservoir types at different latitudes.
Additionally, the comparison conducted of the derived L–A–S relationship to the existing one provides some important insights into the modification of the reservoir’s characteristics. As stated in Section 3.5, the difference between the derived and existing L–A–S relationships is higher than the combined inaccuracies of the followed approach. This remark reveals the potential presence of mechanisms that altered the reservoir’s characteristics, such as sediment transfer or Earth movements. As the investigation of this difference surpasses the context of the present research, a further research field is identified, targeting the tracking of a lake’s or reservoir’s L–A–S relationship characteristics and their change related to time or other phenomena.

5. Conclusions

Regarding the quantitative findings of this research, during the temporal period examined, the following are noted:
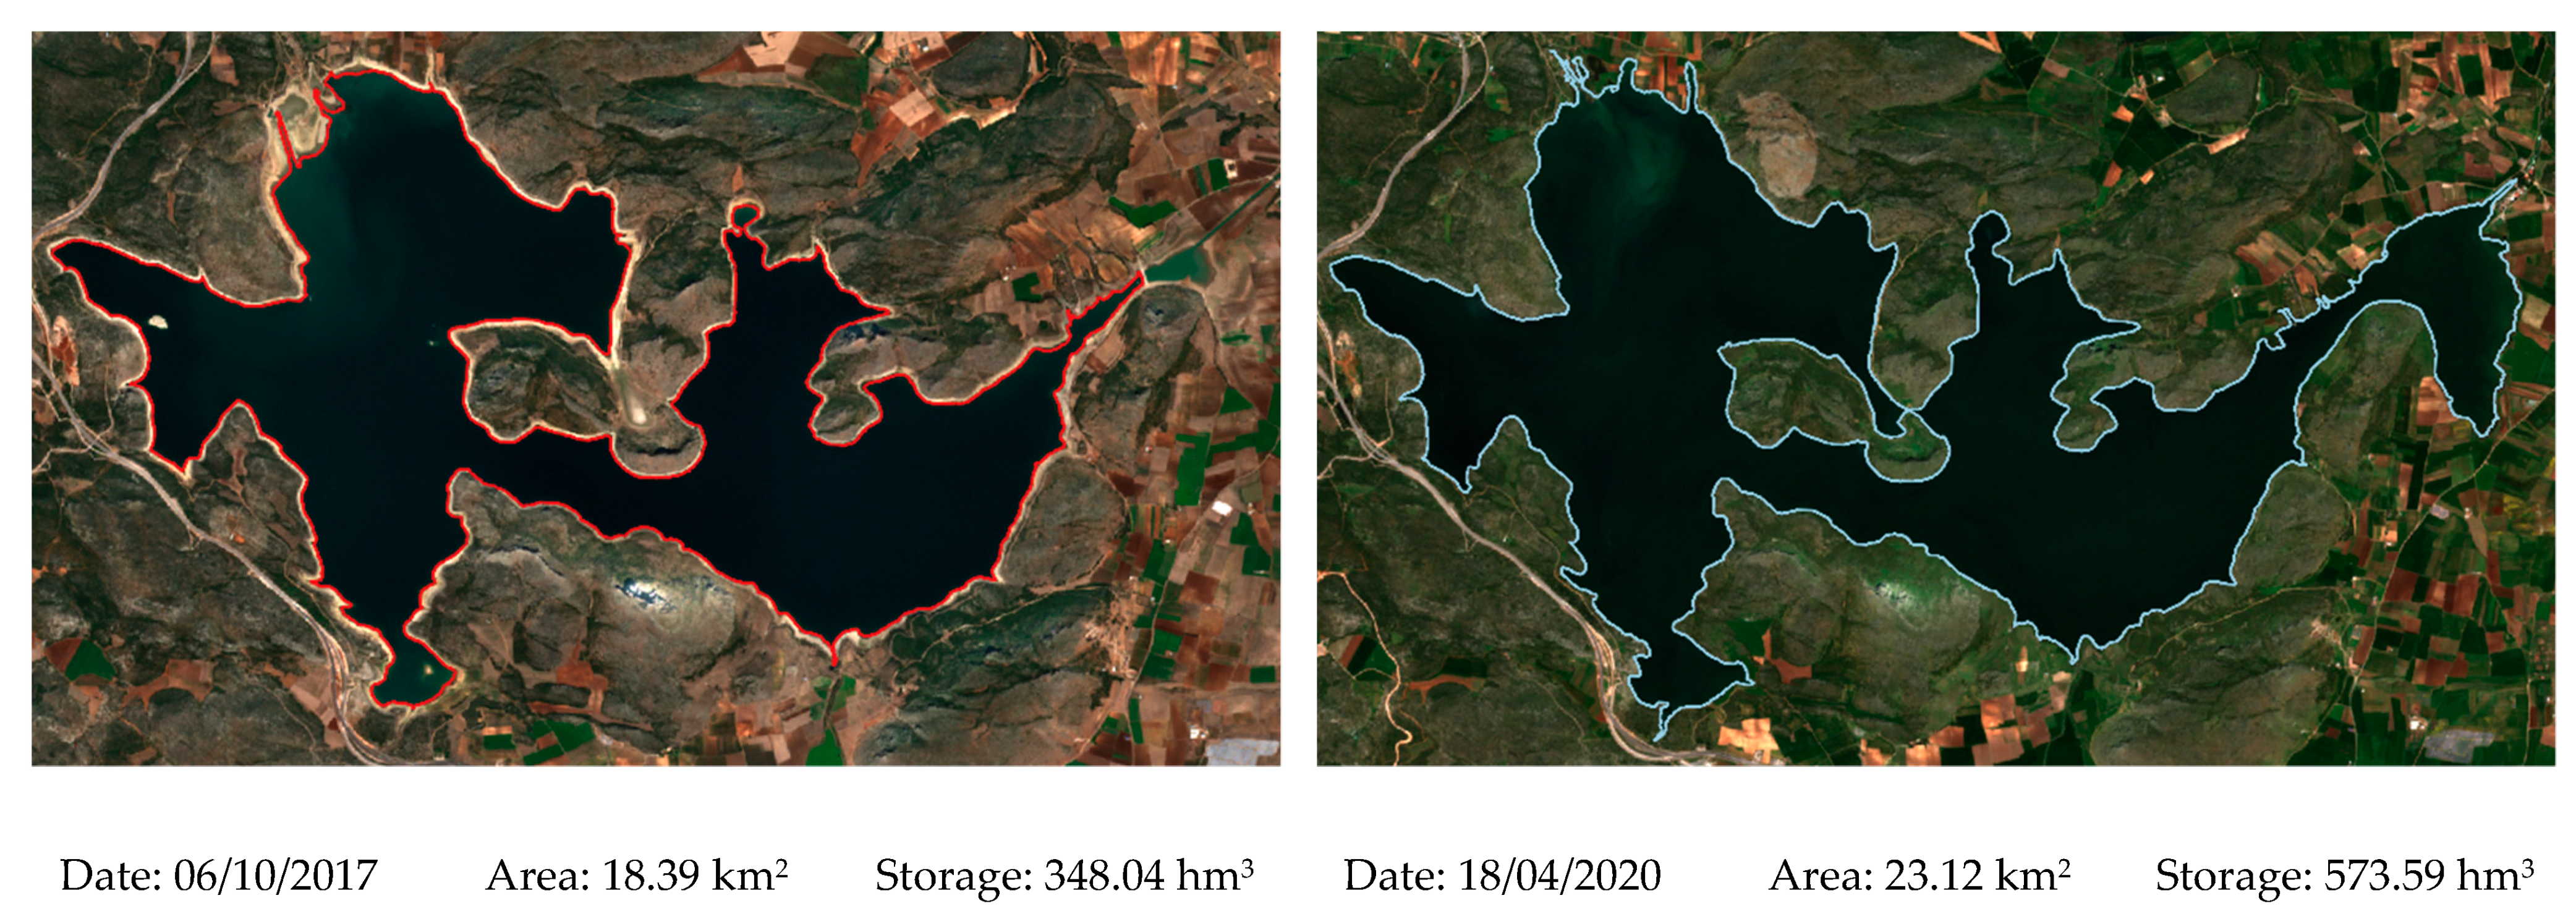
  • Between March 2016 and September 2021, maximum and minimum water area observed were 23.14 km2 and 18.21 km2, respectively.
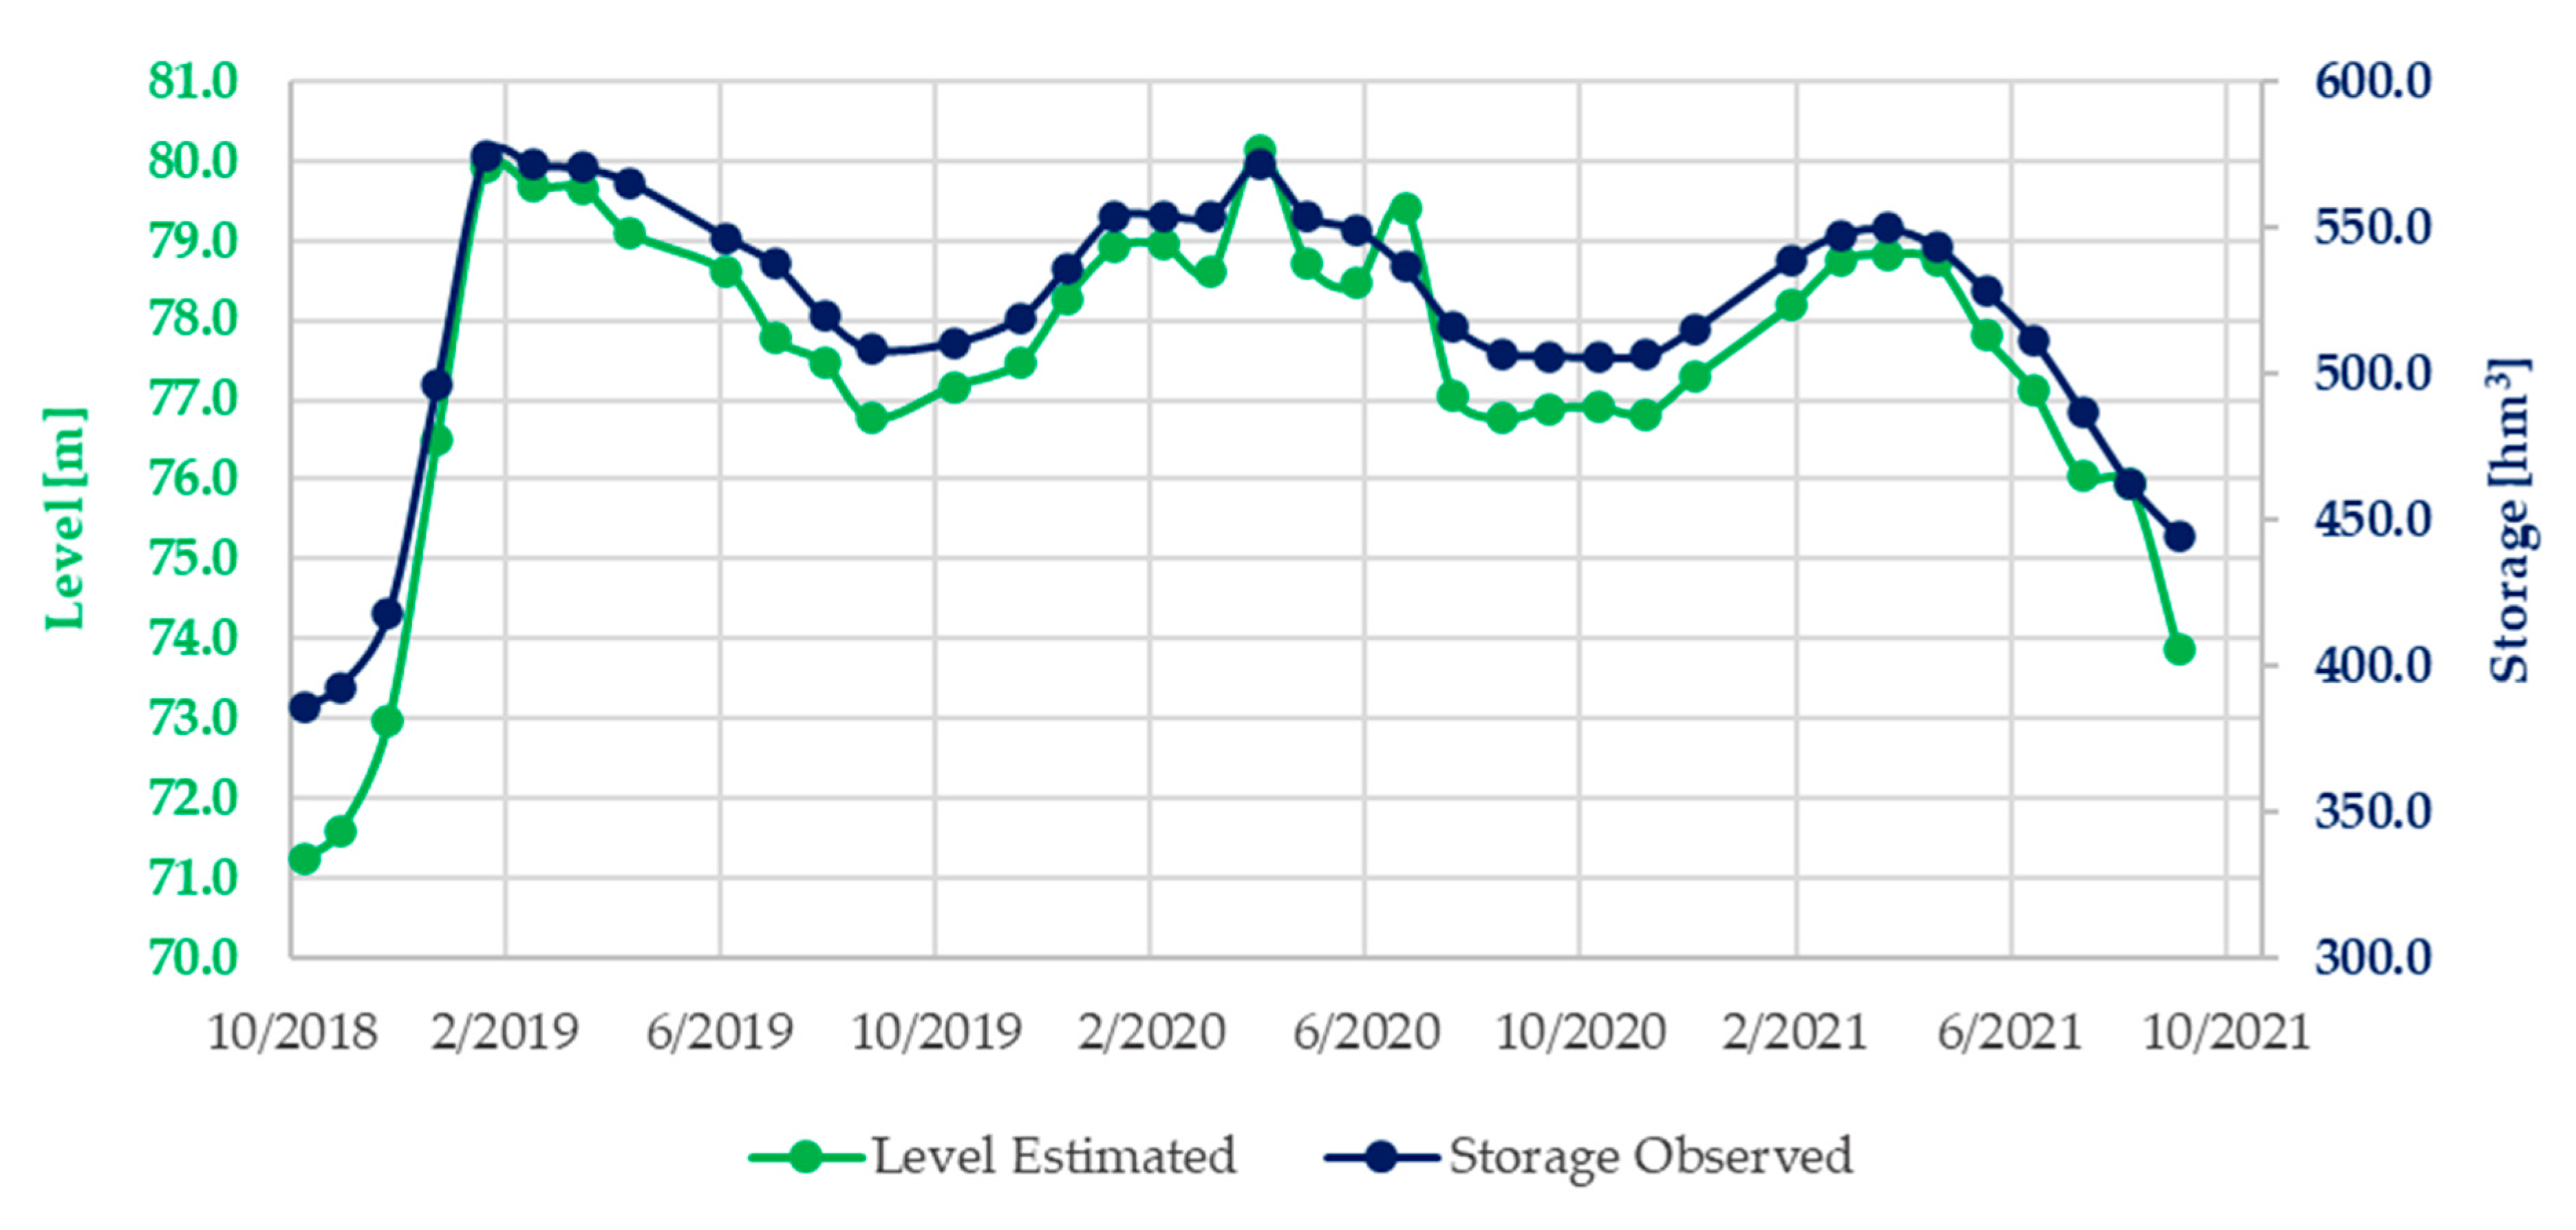
  • Between November 2018 and September 2021, maximum and minimum water level observed were 80.1 m and 71.3 m, respectively.
  • Water area short-term (monthly) maximum increase and decrease rates were calculated at 0.091 km2/d and 0.022 km2/d, respectively.
  • Water level short-term (monthly) maximum increase and decrease rates were calculated at 0.132 m/d and 0.087 m/d, respectively.
  • The estimation of storage variation for the available data range, corresponding to 64–96% of the reservoir capacity, was successful. The RMSE was found to be 7.69 hm3 (1.28% of reservoir capacity), and the correlation coefficient was 96.14%.
This research reaffirmed the applicability of remote sensing techniques for the monitoring of water level and water area of lakes and reservoirs. It is argued that remote sensing techniques can provide crucial information of the inland water cycle for monthly and annual time resolutions. Taking advantage of the fact that the case study of Yliki reservoir is also monitored, four methodologies to estimate storage variation were tested, two of them showing promising results.
Moreover, new approaches were discussed, including the temporal interval of water level and water area measurements pairing. The proposed 7-day temporal interval was found capable to increase data availability for estimating water storage variation, whilst slightly augmenting the methodology uncertainty. The methodologies tested for estimating water storage variation were based on different case studies, covering large or very small lakes. Thus, this research contributes towards the justification of approaches that may cover a wide range of lake typologies, sizes, and spatial locations. Finally, the comparison between the derived L–A–S relationship compared to the existing one indicates the usefulness of remote sensing techniques for reservoir operators to revisit and capture changes of a reservoir’s hydrologic characteristics.

Author Contributions

Conceptualization, N.G. and G.B.; methodology, N.G.; software, N.G.; validation, N.G. and G.B.; data curation, N.G.; writing—original draft preparation, N.G.; writing—review and editing, N.G. and G.B.; visualization, N.G.; supervision, E.B. and M.N.A. All authors have read and agreed to the published version of the manuscript.

Funding

This research received no external funding.

Institutional Review Board Statement

Not applicable.

Informed Consent Statement

Not applicable.

Data Availability Statement

All freely available data are mentioned in section on Data and Methods.

Conflicts of Interest

The authors declare no conflict of interest.

References

  1. Williamson, C.E.; Saros, J.E.; Vincent, W.F.; Smol, J.P. Lakes and Reservoirs as Sentinels, Integrators, and Regulators of Climate Change. Limnol. Oceanogr. 2009, 54, 2273–2282. [Google Scholar] [CrossRef]
  2. Busker, T.; de Roo, A.; Gelati, E.; Schwatke, C.; Adamovic, M.; Bisselink, B.; Pekel, J.-F.; Cottam, A. A Global Lake and Reservoir Volume Analysis Using a Surface Water Dataset and Satellite Altimetry. Hydrol. Earth Syst. Sci. Discuss. 2019, 23, 669–690. [Google Scholar] [CrossRef] [Green Version]
  3. Frappart, F.; Zeiger, P.; Betbeder, J.; Gond, V.; Bellot, R.; Baghdadi, N.; Blarel, F.; Darrozes, J.; Bourrel, L.; Seyler, F. Automatic Detec-Tion of Inland Water Bodies along Altimetry Tracks for Estimating Surface Water Storage Variations in the Congo Basin. Remote Sens. 2021, 10, 3804. [Google Scholar] [CrossRef]
  4. Kostianoy, A.G.; Lebedev, S.A.; Kostianaia, E.A.; Prokofiev, Y.A. Interannual Variability of Water Level in Two Largest Lakes of Europe. Remote Sens. 2022, 14, 659. [Google Scholar] [CrossRef]
  5. Gourgouletis, N.; Bariamis, G.; Baltas, E. Estimation of Characteristics of Surface Water Bodies Based on Sentinel-2 Images: The Case Study of Yliki Reservoir. In Proceedings of the Eighth International Conference on Environmental Management, Engineering, Planning & Economics, Thessaloniki, Greece, 20–24 July 2021; pp. 551–558. [Google Scholar]
  6. Schmitz, O.J.; Raymond, P.A.; Estes, J.A.; Kurz, W.A.; Holtgrieve, G.W.; Ritchie, M.E.; Schindler, D.E.; Spivak, A.C.; Wilson, R.W.; Bradford, M.A.; et al. Animating the Carbon Cycle. Ecosystems 2014, 17, 344–359. [Google Scholar] [CrossRef] [Green Version]
  7. Jimenez Cisneros, B.E.; Oki, T.; Arnell, N.W.; Benito, G.; Cogley, J.G.; Döll, P.; Jiang, T.; Mwakalila, S.S. Freshwater Resources. In Climate Change 2014: Impacts, Adaptation, and Vulnerability. Part A: Global and Sectoral Aspects. Contribution of Working Group II to the Fifth Assessment Report of the Intergovernmental Panel on Climate Change; Field, C.B., Barros, V.R., Dokken, D.J., Mach, K.J., Mastrandrea, M.D., Bilir, T.E., Chatterjee, M., Ebi, K.L., Estrada, Y.O., Genova, R.C., et al., Eds.; Cambridge University Press: Cambridge, UK; New York, NY, USA, 2014; pp. 1199–1265. [Google Scholar]
  8. Kovats, R.S.; Valentini, R.M.; Bouwer, L.; Georgopoulou, E.; Jacob, D.; Martin, E.; Rounsevell, M.; Soussana, J.-F. Europe. In Climate Change 2014: Impacts, Adaptation, and Vulnerability. Part B: Regional Aspects. Contribution of Working Group II to the Fifth Assessment Report of the Intergovernmental Panel on Climate Change; Field, C.B., Barros, V.R., Dokken, D.J., Mach, K.J., Mastrandrea, M.D., Bilir, T.E., Chatterjee, M., Ebi, K.L., Estrada, Y.O., Genova, R.C., et al., Eds.; Cambridge University Press: Cambridge, UK; New York, NY, USA, 2014; pp. 1267–1326. [Google Scholar]
  9. Weatherhead, E.K.; Howden, N.J.K. The Relationship between Land Use and Surface Water Resources in the UK. Land Use Policy 2009, 26, S243–S250. [Google Scholar] [CrossRef]
  10. Thornton, P.K.; Herrero, M. The Inter-Linkages between Rapid Growth in Livestock Production, Climate Change, and the Impacts on Water Resources, Land Use, and Deforestation Background Paper to the 2010 World Development Report. 2010. Available online: http://hdl.handle.net/10986/9223 (accessed on 14 December 2021).
  11. Bariamis, G.; Paschos, G.; Baltas, E. Land Accounts in the River Basin Districts of Greece. Environ. Process. 2018, 5, 213–237. [Google Scholar] [CrossRef]
  12. Water and Climate Change Adaptation; OECD Studies on Water; OECD: Paris, France, 2013; ISBN 9789264200432.
  13. Karavitis, C.A.; Chortaria, C.; Alexandris, S.; Vasilakou, C.G.; Tsesmelis, D.E. Development of the Standardised Precipitation Index for Greece. Urban Water J. 2012, 9, 401–417. [Google Scholar] [CrossRef]
  14. Livada, I.; Assimakopoulos, V.D. Spatial and Temporal Analysis of Drought in Greece Using the Standardized Precipitation Index (SPI). Theor. Appl. Climatol. 2007, 89, 143–153. [Google Scholar] [CrossRef]
  15. Terzidis, G. Water Scarcity; Causes, Forecasting Potential and Mitigation Measures in the Urban and Agricultural Development of Greece. In Proceedings of the Water Scarcity and Floods, Geotechnical Chamber of Greece, Thessaloniki, Greece, 17 March 1992; pp. 25–40. [Google Scholar]
  16. Biswas, A.K. Integrated Water Resources Management: A Reassessment. Water Int. 2004, 29, 248–256. [Google Scholar] [CrossRef]
  17. Schwatke, C.; Dettmering, D.; Bosch, W.; Seitz, F. DAHITI—An Innovative Approach for Estimating Water Level Time Series over Inland Waters Using Multi-Mission Satellite Altimetry. Hydrol. Earth Syst. Sci. 2015, 19, 4345–4364. [Google Scholar] [CrossRef] [Green Version]
  18. Baup, F.; Frappart, F.; Maubant, J. Combining High-Resolution Satellite Images and Altimetry to Estimate the Volume of Small Lakes. Hydrol. Earth Syst. Sci. 2014, 18, 2007–2020. [Google Scholar] [CrossRef] [Green Version]
  19. Zhang, C.; Lv, A.; Zhu, W.; Yao, G.; Qi, S. Using Multisource Satellite Data to Investigate Lake Area, Water Level, and Water Storage Changes of Terminal Lakes in Ungauged Regions. Remote Sens. 2021, 13, 3221. [Google Scholar] [CrossRef]
  20. Lin, Y.; Li, X.; Zhang, T.; Chao, N.; Yu, J.; Cai, J.; Sneeuw, N. Water Volume Variations Estimation and Analysis Using Multisource Satellite Data: A Case Study of Lake Victoria. Remote Sens. 2020, 12, 3052. [Google Scholar] [CrossRef]
  21. Du, Y.; Zhang, Y.; Ling, F.; Wang, Q.; Li, W.; Li, X. Water Bodies’ Mapping from Sentinel-2 Imagery with Modified Normalized Difference Water Index at 10-m Spatial Resolution Produced by Sharpening the Swir Band. Remote Sens. 2016, 8, 354. [Google Scholar] [CrossRef] [Green Version]
  22. Schmitt, M. Potential of Large-Scale Inland Water Body Mapping from Sentinel-1/2 Data on the Example of Bavaria’s Lakes and Rivers. PFG—J. Photogramm. Remote Sens. Geoinf. Sci. 2020, 88, 271–289. [Google Scholar] [CrossRef]
  23. Carabajal, C.C.; Boy, J.P. Lake and Reservoir Volume Variations in South America from Radar Altimetry, ICESat Laser Altimetry, and GRACE Time-Variable Gravity. Adv. Space Res. 2021, 68, 652–671. [Google Scholar] [CrossRef]
  24. Duan, Z.; Bastiaanssen, W.G.M. Estimating Water Volume Variations in Lakes and Reservoirs from Four Operational Satellite Altimetry Databases and Satellite Imagery Data. Remote Sens. Environ. 2013, 134, 403–416. [Google Scholar] [CrossRef]
  25. Song, C.; Huang, B.; Ke, L. Inter-Annual Changes of Alpine Inland Lake Water Storage on the Tibetan Plateau: Detection and Analysis by Integrating Satellite Altimetry and Optical Imagery. Hydrol. Processes 2014, 28, 2411–2418. [Google Scholar] [CrossRef]
  26. Kittel, C.M.M.; Jiang, L.; Tøttrup, C.; Bauer-Gottwein, P. Sentinel-3 Radar Altimetry for River Monitoring—A Catchment-Scale Evaluation of Satellite Water Surface Elevation from Sentinel-3A and Sentinel-3B. Hydrol. Earth Syst. Sci. 2021, 25, 333–357. [Google Scholar] [CrossRef]
  27. Arsen, A.; Crétaux, J.F.; Berge-Nguyen, M.; del Rio, R.A. Remote Sensing-Derived Bathymetry of Lake Poopó. Remote Sens. 2013, 6, 407–420. [Google Scholar] [CrossRef] [Green Version]
  28. Elsahabi, M.; Makboul, O.; Negm, A.M. Lake Nubia Bathymetry Detection by Satellite Remote Sensing. Int. Water Technol. J. IWTJ 2018, 8, 9–17. [Google Scholar]
  29. Forfinski-Sarkozi, N.A.; Parrish, C.E. Analysis of MABEL Bathymetry in Keweenaw Bay and Implications for ICESat-2 ATLAS. Remote Sens. 2016, 8, 772. [Google Scholar] [CrossRef] [Green Version]
  30. Getirana, A.; Jung, H.C.; Tseng, K.H. Deriving Three Dimensional Reservoir Bathymetry from Multi-Satellite Datasets. Remote Sens. Environ. 2018, 217, 366–374. [Google Scholar] [CrossRef]
  31. Markogianni, V.; Kalivas, D.; Petropoulos, G.P.; Dimitriou, E. Modelling of Greek Lakes Water Quality Using Earth Observation in the Framework of the Water Framework Directive (WFD). Remote Sens. 2022, 14, 739. [Google Scholar] [CrossRef]
  32. Peppa, M.; Vasilakos, C.; Kavroudakis, D. Eutrophication Monitoring for Lake Pamvotis, Greece, Using Sentinel-2 Data. ISPRS Int. J. Geo-Inf. 2020, 9, 143. [Google Scholar] [CrossRef] [Green Version]
  33. Alexandridis, T.K.; Takavakoglou, V.; Crisman, T.L.; Zalidis, G.C. Remote Sensing and GIS Techniques for Selecting a Sustainable Scenario for Lake Koronia, Greece. Environ. Manag. 2007, 39, 278–290. [Google Scholar] [CrossRef]
  34. Papastergiadou, E.S.; Retalis, A.; Apostolakis, A.; Georgiadis, T. Environmental Monitoring of Spatio-Temporal Changes Using Remote Sensing and GIS in a Mediterranean Wetland of Northern Greece. Water Resour. Manag. 2008, 22, 579–594. [Google Scholar] [CrossRef]
  35. Psomiadis, E.; Soulis, K.X.; Zoka, M.; Dercas, N. Synergistic Approach of Remote Sensing and Gis Techniques for Flash-Flood Monitoring and Damage Assessment in Thessaly Plain Area, Greece. Water 2019, 11, 448. [Google Scholar] [CrossRef] [Green Version]
  36. Capolongo, D.; Refice, A.; Bocchiola, D.; D’Addabbo, A.; Vouvalidis, K.; Soncini, A.; Zingaro, M.; Bovenga, F.; Stamatopoulos, L. Coupling Multitemporal Remote Sensing with Geomorphology and Hydrological Modeling for Post Flood Recovery in the Strymonas Dammed River Basin (Greece). Sci. Total Environ. 2019, 651, 1958–1968. [Google Scholar] [CrossRef]
  37. Kontopoulou, E.; Kolokoussis, P.; Karantzalos, K. Water Quality Estimation in Greek Lakes from Landsat 8 Multispectral Satellite Data. Eur. Water 2017, 58, 191–196. [Google Scholar]
  38. Elhag, M.; Yilmaz, N. Insights of Remote Sensing Data to Surmount Rainfall/Runoff Data Limitations of the Downstream Catchment of Pineios River, Greece. Environ. Earth Sci. 2021, 80, 35. [Google Scholar] [CrossRef]
  39. Special Secreteriat for Water. 1st Revision of the Management Plan of the River Basin District of Eastern Central Greece. Athens. 2017. Available online: http://wfdver.ypeka.gr/el/management-plans-gr/1revision-approved-management-plans-gr/approved-1revision-el07-gr/ (accessed on 6 January 2022).
  40. EYDAP. Water Supply Resources. Available online: https://www.eydap.gr/en/TheCompany/Water/WaterSources/ (accessed on 6 January 2022).
  41. Special Secreteriat for Water. Strategic Environmental Impact Assessment of the 1st Revision of the River Basin District Management Plan of Eastern Central Greece (EL07). Athens. 2017. Available online: http://wfdver.ypeka.gr/el/project/consultation-el07-18-1revision-smpe-gr/ (accessed on 6 January 2022).
  42. Efstratiadis, A.; Tsoukalas, I. Revision of the Yliki and Paralimni Water Balance and Evaluation of the Overflow Risk during Current Hydrologic Year. Athens. 2019. Available online: http://www.itia.ntua.gr/el/docinfo/2014/ (accessed on 14 December 2021).
  43. EYDAP. Raw Water Reserves. Available online: https://www.eydap.gr/en/TheCompany/Water/Savings/ (accessed on 14 December 2021).
  44. SUHET. SENTINEL-2 User Handbook. 2015. Available online: https://sentinels.copernicus.eu/web/sentinel/user-guides/document-library/-/asset_publisher/xlslt4309D5h/content/sentinel-2-user-handbook (accessed on 21 October 2021).
  45. European Space Agency. Sentinel-3 Altimetry Technical Guide. Available online: https://sentinel.esa.int/web/sentinel/technical-guides/sentinel-3-altimetry/ (accessed on 21 October 2021).
  46. European Space Agency. Sentinel-3 Atlimetry Overview. Available online: https://sentinel.esa.int/web/sentinel/user-guides/sentinel-3-altimetry/overview (accessed on 10 October 2021).
  47. EUMETSAT. Past Processing Baselines. Available online: https://www.eumetsat.int/past-processing-baselines (accessed on 23 October 2021).
  48. European Space Agency; French Space Agency. Radar Altimetry Tutorial & Toolbox. Available online: http://www.altimetry.info/radar-altimetry-tutorial/data-flow/data-processing/retracking/ (accessed on 27 October 2021).
  49. Yang, X.; Zhao, S.; Qin, X.; Zhao, N.; Liang, L. Mapping of Urban Surface Water Bodies from Sentinel-2 MSI Imagery at 10 m Resolution via NDWI-Based Image Sharpening. Remote Sens. 2017, 9, 596. [Google Scholar] [CrossRef] [Green Version]
  50. Cavallo, C.; Papa, M.N.; Gargiulo, M.; Palau-Salvador, G.; Vezza, P.; Ruello, G. Continuous Monitoring of the Flooding Dynamics in the Albufera Wetland (Spain) by Landsat-8 and Sentinel-2 Datasets. Remote Sens. 2021, 13, 3525. [Google Scholar] [CrossRef]
  51. McFeeters, S.K. The Use of the Normalized Difference Water Index (NDWI) in the Delineation of Open Water Features. Int. J. Remote Sens. 1996, 17, 1425–1432. [Google Scholar] [CrossRef]
  52. Sekertekin, A. A Survey on Global Thresholding Methods for Mapping Open Water Body Using Sentinel-2 Satellite Imagery and Normalized Difference Water Index. Arch. Comput. Methods Eng. 2021, 28, 1335–1347. [Google Scholar] [CrossRef]
  53. Prewitt, J.M.S.; Mendelsohn, M.L. The Analysis of Cell Images. Ann. N. Y. Acad. Sci. 2006, 128, 1035–1053. [Google Scholar] [CrossRef]
  54. Crétaux, J.F.; Bergé-Nguyen, M.; Calmant, S.; Jamangulova, N.; Satylkanov, R.; Lyard, F.; Perosanz, F.; Verron, J.; Montazem, A.S.; Le Guilcher, G.; et al. Absolute Calibration or Validation of the Altimeters on the Sentinel-3A and the Jason-3 over Lake Issykkul (Kyrgyzstan). Remote Sens. 2018, 10, 1679. [Google Scholar] [CrossRef] [Green Version]
  55. Crétaux, J.F.; Abarca-del-Río, R.; Bergé-Nguyen, M.; Arsen, A.; Drolon, V.; Clos, G.; Maisongrande, P. Lake Volume Monitoring from Space. Surv. Geophys. 2016, 37, 269–305. [Google Scholar] [CrossRef] [Green Version]
  56. Vignudelli, S.; Scozzari, A.; Abileah, R.; Scozzari, A. A Completely Remote Sensing Approach To Monitoring Reservoirs Water Volume. Int. Water Technol. J. 2011, 1, 63–77. [Google Scholar]
Figure 1. (Upper left): Yliki reservoir; true color image from Sentinel-2, captured on 13 July 2018. Red line: reservoir’s water perimeter derived from the applied methodology; yellow dots: SRAL point measurements from Sentinel-3 on 13 July 2018; yellow line: relative Sentinel-3 path, 10th cycle, 221th relative orbit. (Upper right): Boeotikos Kifissos River Basin District (EL0723) location over Greece. (Lower): Boeotikos Kifissos River Basin District river network, Yliki reservoir, and Lake Paralimni with a digital elevation model background.
Remotesensing 14 01860 g001
Figure 2. Flowchart of the extraction of water area from Sentinel-2 images and pairing with same-day observations.
Remotesensing 14 01860 g002
Figure 3. Sentinel-2-derived Yliki reservoir water area and observed storage time series.
Remotesensing 14 01860 g003
Figure 4. Indicative reservoir snapshots with water perimeter noted with red and cyan color on left and right image, respectively.
Remotesensing 14 01860 g004
Figure 5. Yliki reservoir water area and storage linear relationship.
Remotesensing 14 01860 g005
Figure 6. Scatter plot of area–storage variation pairs.
Remotesensing 14 01860 g006
Figure 7. Sentinel-3-derived Yliki reservoir water level and observed storage time series.
Remotesensing 14 01860 g007
Figure 8. Yliki reservoir water level and storage linear relationship.
Remotesensing 14 01860 g008
Figure 9. Scatter plot of level–storage variation pairs.
Remotesensing 14 01860 g009
Figure 10. Yliki reservoir water storage variation and percentage of reservoir’s maximum storage for daily, weekly, and 5-day time lags between Sentinel-2 and Sentinel-3 paired measurements.
Remotesensing 14 01860 g010
Figure 11. Yliki reservoir water level and area estimated 28 pairs relationship with observed storage.
Remotesensing 14 01860 g011
Figure 12. Comparison of observed storage variation with the estimation methodologies.
Remotesensing 14 01860 g012
Figure 13. Estimated level and observed storage relationship compared to an existing relationship [42].
Remotesensing 14 01860 g013
Figure 14. Estimated area and observed storage relationship compared to an existing relationship [42].
Remotesensing 14 01860 g014
Table 1. Comparison of the applied methodologies for the estimation of Yliki reservoir storage variation.
MethodologyRMSE [hm3]CorrelationLogical Faults
T. Busker et al. [2]9.8393.82%5
F. Baup et al. [18]7.7896.05%2
Y. Lin et al. [20]7.6996.14%2
J. Crétaux et al. [55]7.7396.10%2
Publisher’s Note: MDPI stays neutral with regard to jurisdictional claims in published maps and institutional affiliations.

