Abstract
Fugitive dust arising from mining operations in the Arctic can be a concern to surrounding communities. The Mary River Mine operation on northwest Baffin Island in the Qikiqtani region, Nunavut, is one example. Yet, the short and long-term impacts of fugitive dust remain poorly understood. Dust lowers snow albedo which can contribute to early snowmelt. This influences the spring snowmelt freshet period, significant to the land-atmosphere interactions, hydrology, ecology, and socioeconomic activities in the Arctic. Here, we map dust extents indicated by snow discoloration and examine for areas of early snowmelt using a 21-year MODIS time series snow cover product in 2000–2020. We found an episode of dust plume extended far beyond the reference dust sampler sites from where Nil dustfall is detected. A snow albedo decrease of 0.014 was seen more than 60 km away from the mine site. Incidents of early snowmelt existed extensively and progressively prior to the Mary River Mine operations; however, localized and even earlier snowmelt also appear around Mine’s operations; we estimated that the snow-off date was advanced by one week and three weeks for the background, and areas around the Mine facilities, respectively, during the 21-year period. Furthermore, the area increase in early snowmelt around the Mine facilities correlates to ore production growth. This study demonstrates rapid changes in early snowmelt beyond observed regional trends when additional drivers are introduced.
1. Introduction
Baffinland Iron Mines Corporation’s Mary River Mine (the Mine, hereafter) is located on northwest Baffin Island in the Qikiqtani region, Nunavut, Canada (approximately 175 km southwest of Pond Inlet) [https://www.baffinland.com/ (accessed on 1 December, 2021)]. The Mine is one of the northernmost open pit iron mines in the world; it sits within Inuit-owned land where traditional hunting and trapping supports the cultural identity and provides sustenance, food and clothing to the indigenous peoples of the region. The Mine has been operating since 2014 and started shipment in 2015. Since its operations and ore transportation, local communities have raised concerns about the distribution of fugitive dust arising from the Mine and how the expansion of the Mine could affect this distribution. Fugitive dust arises from different sources; in this study, fugitive dust is limited to the dust released due to mining operations and entering the environment. The Qikiqtani Inuit Association has reported that the spread of dust from the mine site is larger than predicted and is impacting drinking water quality, wildlife and sea ice in the surrounding area [1]. However, there remains a limited understanding of the dustfall extents and the impacts of fugitive dust on the local environment, including the potential cumulative effects of this dust. In this study, we examine the dust extent from satellite and choose to examine early snowmelt, as it is one potential indicator of the impact of fugitive dust for the following reasons:
(1) the physical mechanism of snowmelt is straightforward. Both thermal conduction and solar radiation drive the spring snowmelt during freshet (spring thaw resulting from snow and ice melt in rivers located in upper North America) [2]. Therefore, early snowmelt can be led by above-normal air temperature, an increase in absorbed solar radiation caused by lowered snow albedo due to dust, or both. The darkening of snow by light-absorbing particles—dust, black carbon, or microbial growth—can trigger albedo feedback and accelerate snowmelt [3,4,5,6,7,8]. Dusty snow, often referred to as “dirty snow” in social media, has been identified as a contributor to the warming Arctic, in some cases at a level equivalent to greenhouse gases [6,9]. Another study located in the Colorado river basin determined that the dust on snow, rather than the increased air temperature, can exert the primary force during snowmelt [10].
(2) snow cover and its inter-annual changes can be reliably observed from coarse and medium spatial resolution satellite sensors for a large region [11,12,13,14]. A reduction in Pan-Arctic snow cover has been observed and is projected along with global warming [15,16].
(3) significant consequences of early snowmelt on climate, hydrology, ecology, and social activities have been reported. The snow cover duration affects the growing season length, freshet, permafrost thawing, fire risk and wildlife.
Early snowmelt promotes positive feedback between soil-vegetation-atmosphere interactions [17]. For example, changes in snow event timing, snow onset and melt days can lead to the deepening of the permafrost active layers [18]. Combined with increased temperature this is expected to lead to more greenhouse gases (carbon dioxide and methane) being released into the atmosphere. Earlier spring snowmelt in northern Alaska has been identified as an indicator of climate change [19].
Advancing snowmelt may lead to summer drought and reduce biodiversity in the Arctic. Future plant communities in the Arctic are projected to be occupied by taller plants with larger leaves and faster resource acquisition strategies under the decreasing snow cover and warming temperature [20]. For example, Happonen, et al. [21] found that snow is the most influential abiotic variable affecting functional composition and tundra landscape in Kilpisjärvi, Finland; Mooney, et al. [22] found that early loss of snow reduces aphid abundance by creating water-stressed host plants and altering interactions with ants. Francon, et al. [23] found that earlier snow melt-out can either promote or reduce alpine shrub growth depending on the elevation. A decline in the boreal willow grouse [24] and other subalpine plant communities [25] is found with early snowmelt. However, snow cover is still an overlooked driver of Arctic biodiversity loss [20].
Changes in snowmelt onset time also impact caribou habitat. Dust promotes the forming of an ice crust on the snow surface. Similar to rain-on-snow events, the ice crust over snow causes difficulty for caribou to access reindeer lichen, their main food in the winter. It is believed that the Peary caribou population of the Queen Elizabeth Islands (a cluster of islands located in the north of Baffin Island) decreased with the increased occurrence of rain-on-snow and icing events [26]; extreme winter weather events have been tied to increased mortality in Arctic islands caribou populations [27]. Snowmelt also drives spring green-up [28] with regional and inter-annual variations in snowmelt time and the subsequent green-up timing causing difficulty for migrant caribous to synchronize their migration timing with resource phenology [29].
Given the critical role of snow cover, changes in snow melt-out time can be used to help assess the impacts on drivers. In this study, we target to inform the following questions: (1) is the dust, of concern, arising from the mine’s facilities? (2) what is the extent of the dust plume and did the extent of dust exceed the projections? and (3) what is the impact of dust on the snow-off date?
2. Materials and Methods
2.1. Study Area
Our study area is within Baffin Island in the Canadian territory of Nunavut. Baffin Island is the largest island in Canada, with an area of more than 507 thousand km2 [30]. Baffin Island is within the Canadian Arctic Archipelago lying to the north of the Canadian continental mainland. The Baffin Mountains run along the northeastern coast of the island, while the southwestern part of the island is relatively low in elevation.
On the north side of Baffin Island, Mary River Mine (71°19′24″N, 079°12′38″W) consists of an open-pit mine, two work camps, a port infrastructure at the Milne Inlet and a tote road connecting the mine site to Milne Inlet [31]. We selected a rectangular region (Longitude: ~84°W–75°W; Latitude: ~70.3°N–72.3°N) around the main Mine facility for the assessment of snow cover changes as shown in Figure 1a–d. In Figure 1c, the two small blue boxes show the location of the Mine facilities (lower) and the Milne Inlet Port (upper) where the ore is stockpiled for shipment.
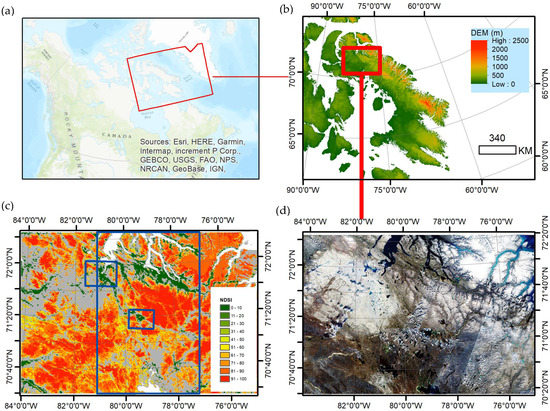
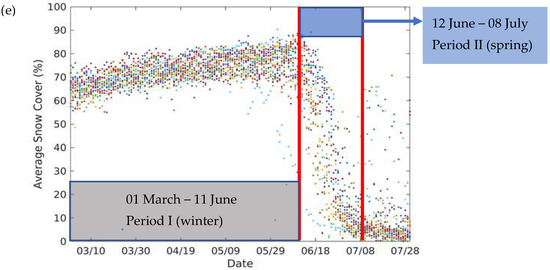
Figure 1.
Overview of the study area and the MODIS NDSI snow cover product. (a) the location of Baffin Island; (b) the digital elevation model of Baffin Island; (c) an example of the MODIS NDSI snow cover product overlaid with the location of Mary River Mine site (lower small blue box) and the Milne Inlet port (upper small blue box); (d) the RGB composite image from the Sentinel-2 satellite; the image is composited using the best available cloud-free Sentinel-2 data in July 2019 and (e) the time series of daily average NDSI snow cover for the study region within the big blue box in (c).
Iron ore is transported from the Mine to the Port via ultra-large haul trucks along a 100 km tote road. Snow colored by ore dust as observed around the Mine site, tote road and stockpile has been identified as a concern by local communities [32]. Another concern related to the Mine operations and ore shipment is the black carbon emission (soot) from burning Heavy Fuel Oil [33]. Black carbon can distribute over a wide area (wider than airborne fugitive dust) and is known to speed snow and ice melting where it deposits [34].
2.2. Data
For the selected study region, we downloaded the MODIS snow cover product (MOD10A1.006 Terra Snow Cover Daily Global 500 m) for 2000–2020 from Google Earth Engine (GEE), instead of specific tiles from the NASA National Snow and Ice Data Center (NSIDC). This snow product was in MODIS sinusoidal projection and was re-projected into UTM when the products were exported from GEE. This dataset was originally developed and produced at NASA Goddard Space Flight Center [35] and distributed by NSIDC [36]. In MOD10A1.006, the data layer “NDSI_Snow_Cover” represents the “Normalized Difference Snow Index” and is calculated as NDSI = (band4 − band6)/(band4 + band6), where band4 is a visual band (545–565 nm) and band6 is a Shortwave Infrared band (1628–1652 nm). NDSI is used to detect snow cover [37]. The NDSI ranges from −1 to 1. A pixel with NDSI > 0.0 is considered to have some snow present; a pixel with NDSI ≤ 0.0 is snow-free land surface. Pixels detected as having snow cover with 0.0 < NDSI < 0.10 are reversed to no snow in order to alleviate commission errors. The valid NDSI range (0–1) as an indicator of having snow is scaled to 0–100 in the NDSI_Snow_Cover layer of the MOD10A1.006 product; values between 200 and 255 are used for flags. The fractional snow cover (FSC) can be related to NDSI [37]; for Terra or Aqua MODIS data, FSC = −0.01 + (1.45 × NDSI)) × 100 for 0.0 ≤ NDSI ≤ 1 [38]. Since a linear relationship between NDSI and FSC is suggested, and the slope (−0.01) is very small, the NDSI_Snow_Cover layer is directly used in the following analysis unless otherwise specified.
Figure 1c shows an example of MODIS NDSI_Snow_Cover on 6 June 2020. In this study, we choose the MODIS snow cover product because of the long time series available (21 years), the short revisit time for Arctic regions, and its spatial resolution of 500 m is best available for our regional assessment purpose. The MODIS revisit time is usually 1–2 days, but the revisit increases to a few times per day in the Arctic area due to its polar orbit and thus the impact of cloud is significantly reduced. According to the MODIS snow cover product User Guide, the reported accuracy is in the range of 88% to 93% [39].
To aid the analysis of snow cover change, we also used the 2015 Canadian land cover product [40], the Canadian Digital Elevation Model [41] (Figure 1 and Figure S1), and the air temperature at 2 m above the surface from the North American Land Data Assimilation System Forcing Fields–version 2 [42]. High-resolution WorldView (WV) data (0.5 m), middle-resolution Landsat (30 m) and Sentinel-2 (the 10 m visual bands) data were used to confirm the existence of mine dust and extent.
2.3. Methodology
To address the first question, WV data are used to confirm if the snow discoloration should be attributed to mining operations. We hypothesize that the snow discoloration should be in a decreasing gradient with increasing distance from the mine; such discoloration did not appear before the mine’s operation and the snow discoloration should re-develop after the episodes of snow events. The WV data also confirm if the Sentinel-2 and/or Landsat are reliable in indicating snow discoloration. As dust is admittedly emitted from the crushing processing and regularly monitored at the ground, we assert a quick development of snow discoloration as seen from satellite imagery is related to fugitive dust.
Bands 2, 3 and 4 of Sentinel-2′s high spatial resolution of 10 m, are used to derive snow albedo at the visual broadband (albedo_vis) [43]. Albedo_vis is calculated as:
albedo_vis = B02 × 0.8421 + B03 × 0.1487 + B04 × 0.0088 − 0.0052.
Although albedo_vis does not represent the full broadband albedo, it is believed to be more robust than using a single band to derive dust extent.
To address the second question, the change in snow albedo is then used to indicate the extent of the dust plume. The change is derived as the difference between a pixel’s albedo_vis and a reference albedo that is free of dust contamination. The reference albedo is an average albedo calculated from lake surfaces that are far away from the mine site. Since the change in sun-observation geometry is small within a Sentinel-2 scene, we assume that the dust and dust-induced albedo decay is the primary cause of snow albedo change in addition to terrain shadowing. The Li et al., 2018 [43] algorithm did not consider terrain effects; therefore, the apparent snow albedo will be higher on the sunlit-side of ridges and be lower on the shaded-side; such changes in snow albedo do not represent the intrinsic snow albedo and should be excluded. In this study, we examine the snow albedo changes over lakes at different distances from the mine site. Lake areas are chosen because their water is frozen and surface undulations are minimized and so the intrinsic snow albedo can be reliably derived.
To address if fugitive dust from mining operations has led to earlier snowmelt, the impact of global warming needs to be separated, as global warming can also lead to early snowmelt. We used the non-parametric Mann–Kendall test (M-K test) to detect monotonic trends in a MODIS snow cover time series for the study area [44]. An open-source code written in Matlab was used [45]. We hypothesize that there will be even earlier snowmelt around the mine’s facilities due to dust after the background warming signal is excluded. In the M-K test, Sen’s slope (β) is used to indicate an upward trend (β > 0) or a downward trend (β < 0) during a period. Two approaches were used in our analysis. In approach I, the average snow cover during a period (less prone to noise) is used as an indicator.
First, the daily average of snow cover for the study region is produced (Figure 1e). We then separate the snow cover data into two periods, one for the winter season (period I) and one for the snowmelt season (period II, or spring season); this enables us to conduct trend analysis for the two periods separately in order to maximize the signal during the snowmelt season.
Second, a pixel-wise M-K test is applied to the average snow cover during winter and snowmelt seasons, respectively. For the pixel-wise M-K test, we repeat the test for different periods (all starting from 2000 but ending in different years) in order to identify the year that a significant trend appears. We limit the ending year from 2013 to 2020; this ensures that the length of the period for the M-K test is long and the M-K test covers a few years before the Mine’s operation.
Third, we convert the snow cover trend data into the days that snowmelt time advanced. We also examine the trend data against digital elevation model, land cover and air temperature in order to identify the drivers of early snowmelt in the whole study area.
In approach II, the first snow-off (or melt-out) date in March to July is used in the trend analysis [46]. The first snow-off date is defined as the first date the snow is completely melted (or 0% snow cover) in the spring or summer season. The actual first snow-off date could be a few days earlier than the detected date if there is prolonged cloud cover; it does not indicate an incident of new snowfall after this date. We choose the first snow-off date instead of the last snow-off date because the first snow-off date from the cumulated snow-mass in a season is more reliable than the last snow-off date, as the last snow-off date is easily biased by a transient snow event, e.g., snowing and melting in a same day could not differentiate the impact from dust in a daily time-series and thus contaminate the result. In Section 3, we present the result derived from approach I; the result from approach II is used as a support to our findings and shown in the supplementary materials.
3. Results
3.1. Dust Plume Observed from WV Data
WV data were examined at three locations, the mine pit site, the tote road, and the stockpile at Milne Inlet (Figure 2 and Figures S2–S4). A clear dust plume was observed to be extended from the mine pit on 23 April 2017. The gradient suggested that the dust originated from the pit. Landsat data acquired on 25 April 2017 also showed the same pattern. Dust was also seen along the tote road and roadside, especially in lower elevations, although this was not as evident in the coarser resolution Landsat imagery (21 March 2021 vs. 24 March 2021). The WV data on 7 May 2018 captured the snow discoloration on the sea ice diffused from the ore stockpile; such a dust plume is also visible in the Landsat image on 12 May 2018 and in the Sentinel-2 image on 24 May 2018 (Figure S5). These observed discolorations from satellite images were consistent with the ground-based dust monitoring. The snow discoloration is not apparent in satellite imagery before the start of mining operations in 2014 (Figures S2–S4).
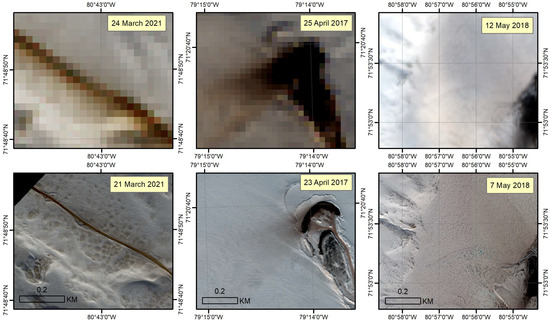
Figure 2.
Dust plumes observed from Landsat and WorldView images, in the top and bottom panels, respectively, in RGB color composites around Mine’s facilities. The left panels show dustfall around the tote road; the middle panels show dust plume around the mine pit and the right panels show dust deposition over the sea ice and snow beside the ore stockpiles in Milne Inlet.
3.2. Dust Extent Derived from Sentinel-2 Image
Snow albedo was derived for a Sentinel-2 image acquired on 25 May 2022. Three lakes (points A, B and C) far away from the mine site were chosen as reference sites (Figure 3). The snow albedo values at the three lakes are 0.772 ± 0.07, 0.771 ± 0.006 and 0.771 ± 0.006, respectively. We could rule out the possibility that the snow on the lake ice was carried away by the wind because we found that (1) the snow albedo over these lakes is the highest over the flat surfaces in the study area, and (2) lake ice usually has a much lower albedo than snow.
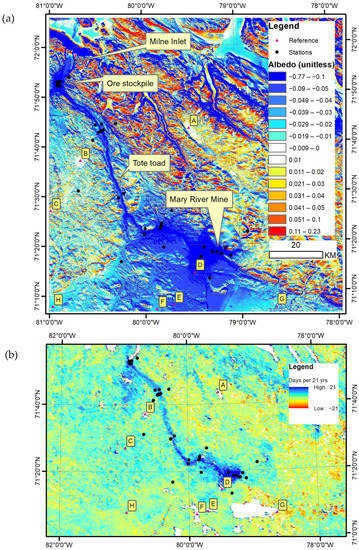
Figure 3.
Impacts of fugitive dust on snow cover and snowmelt. Top (a): dust-induced snow albedo decreases on 25 May 2022 (tile: T17WNV); rolling landscapes can also cause apparent changes to snow albedo and these areas should be excluded from interpretation. Black dots indicate the locations of the dust sampling sites. Snow albedo values were assumed no changes over lakes at A, B and C. Snow albedoe decreases are examined at five lakes indicated by letters D–E. Bottom (b): advanced snow-off days in 21 years derived using MODIS snow-cover time series.
Figure 3 shows the albedo difference compared to the three lakes. The rolling pattern of blue and red colors indicates the influence of terrain on retrieving snow albedo; the effect is rougher in the North-East part of the image; this region of the image is not a predominately north-facing slope (Figure 4). To exclude this influence of surface undulation, five lakes (points D, E, F, G and H) were chosen to detect the dust extent. We found that the snow albedo values were decreased by 0.11, 0.059, 0.036, 0.031 and 0.014 at the distances of 11.4 km, 25.6 km, 31.1, 30 km, and 65.4 km for points D, E, F, G and H, respectively; the magnitude of albedo decrease reduces with increasing distance from the mine site following an exponential trend (Figure S6). The detected dust extent was far more than 9 km from where the sampling station usually reported Nil dust (or below the detection threshold) at this distance.
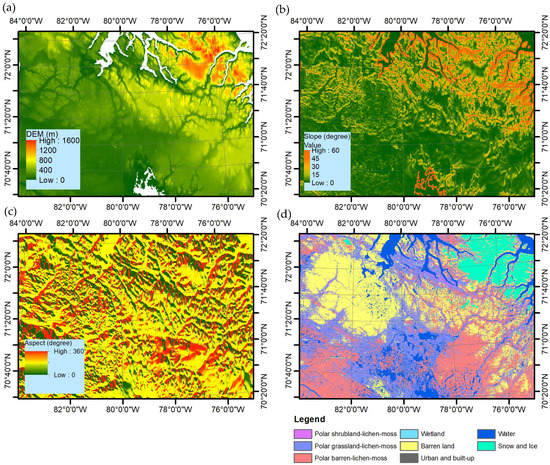
Figure 4.
The elevation (a), slope (b), aspect (c), and land cover (d) for the study area.
3.3. Changes in Snow Cover Based on the Whole Study Region
Figure 1e shows the daily average snow cover for the core study region (big blue box in Figure 1c) over the 21-year period; here, the daily average snow cover is calculated as the mean values of all the valid (no-cloud) pixels for a specific day, the resulting 21 data points are for each date of the year. There are no data prior to 1 March for this northern Arctic area. Three periods can be separated: the winter period (1 March to 11 June) when the snow cover is stable, the quick snow melting period (12 June to 8 July), and the post-melting period (days after 8 July). Transient snow cover events were noted in the post-melting period but the snow does not remain long as both air and ground surface temperatures are already relatively high. There are increasing trends of snow cover from 1 March to 11 June in the winter period; the increasing trends are likely caused by the accumulated snow that gradually covers relatively high areas, e.g., tall grasses, shrubs, and rocks. As these trends are consistent and stable and we are comparing snow covers among different years, we believe that the data can still be used for trend analysis when we separate the time series into winter and melting periods. This can be confirmed by Figure 5a as the trend of snow cover in winter has remained fairly uniform during the last 21 years; the lower snow cover in 2019 was due to the unusual warming in the Arctic as 2019 was the second-hottest year recorded since 1900. In contrast to the winter period, the snow cover in the snow-melting period (spring time; Period II; Figure 5b) has a significant decreasing trend of −0.72% in NDSI snow cover (p < 0.05). Our result is in line with the finding in northern Finland based on snow measuring stations that the decreasing trend of snow depth was most evident in spring, but no change occurred during winter months [47]. Similar trends of snow cover are also found for the Mine site and the Milne Inlet Port in Figure 5c–f as indicated in the small blue boxes in Figure 1c.
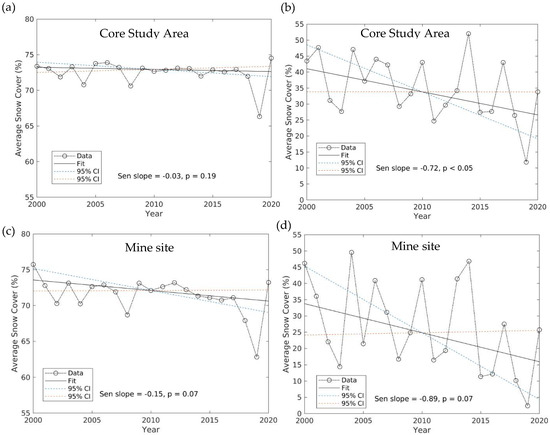
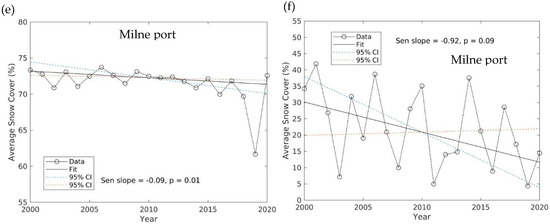
Figure 5.
Interannual changes of snow cover for the core study region ((a,b), for the large blue rectangle in Figure 1c), the Mine sites ((c,d), for the blue rectangle in the middle in Figure 1c), and the Milne port sites ((e,f), for the blue rectangle in left in Figure 1c), respectively, for the winter season (Period I; (left) column) and the snowmelt season (Period II; (right) column). The y limit in the left column is smaller than that in the right column in order to make the smaller winter variations more apparent. The “Fit” in the subplots was determined by Sen-slope. Panels (a,c,e) indicate the snow cover trends are relatively stable in the winter period; while panels (b,d,f) indicate decreasing trends in the spring period.
3.4. Pixel-Wise Analysis of Snowmelt Trend
Figures S7 and S8 demonstrate how the snow cover trend is detected for the period of 2000–2020. Sen’s slope is calculated for each pixel; however, statistically significant trends, i.e., p < 0.05, appear only for a small portion of these pixels (i.e., 6% for the winter period and 21% for the spring period). By separating the negative trend (earlier days of snowmelt) from the positive trend (later days of snowmelt) for pixels with p < 0.05, there are comparable areas of negative and positive trends in the winter season; however, only a few pixels show positive trends in the snow melting season.
Figure 6 shows the first year a negative trend is detected for each pixel (but not the intensity of the trend). For the spring season (Figure 6a), extensive negative trends already appeared before 2015, especially in the low-altitude areas (Figure S1); since 2016, negative trends around the Mine site started to appear. For the winter season (Figure 6b), most negative trends start after 2017; the location of the Mine, port and tote road is clearly revealed, and these negative trends appear to align with the mining operations. Other areas are also noted to demonstrate a negative trend in snow cover.
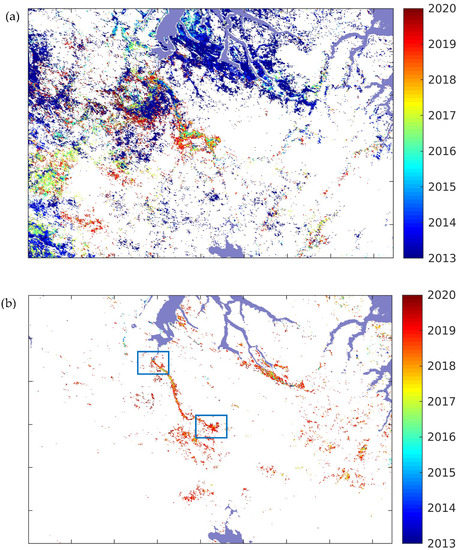
Figure 6.
The first year that a significant decreasing trend (p < 0.05) in snow cover is detected by the M-K test (a) for the snowmelt season (Period II) and (b) for the winter season (Period I).
Figure S9 shows two subsets typical of the tote road in order to estimate the distance of the negative trend snowmelt that could be detected by satellite during the spring period. We estimate the crossroad distance is up to 2 km on each side of the tote road. This result is similar to another Canadian Arctic study (at the Ekati Diamond Mine, NT), where fugitive dust was observed up to 2 km from the mining road using both in situ and satellite imagery (spectral unmixing) techniques [48,49].
The negative trends mostly happened in the low elevation area, i.e., 93.7% of the detected area is below 400 m elevation for the spring season, and 76.0% of the detected area is below 400 m for the winter season (Figure S10). This is in contrast with the elevation distribution within the whole study area, suggesting that the early snowmelt mostly appears in lowlands. Most negative trends appear in areas with a small slope; no tendency of appearance is found in south facing aspect (Figure S11). The negative trends mostly appear in “Land cover 12: sub-polar or polar grassland-lichen-moss” and “Land cover 16: barren lands” from the 2015 Canada land cover map (Figure 4d and Figures S12–S13).
3.5. Snow Cover Changes in Response to Global Warming and the Mine Activities
The annual total areas with negative trends in snow cover, ranging from one thousand km2 to eight thousand km2, are compared to the corresponding average air temperature at 2 m [42] from March to July in the whole study area (Figures S14 and S15). According to public reports, the ore productions from the Mine in 2015–2019 are 1.3 Mt, 3.3 Mt, 4.6 Mt, 5.4 Mt, and 5.7 Mt, respectively, and are projected to be 5.7–6.3 Mt for 2020 [50,51,52,53]. In the snowmelt period, the air temperature explained 35% of the variance in area, more than the ‘ore production’ could explain (14.2%). This suggests that the Arctic warming rather than the increasing Mine activity is a more significant driver of the detected snow cover changes in the spring (Figure S14). The decreasing snow cover trends are in line with the decreasing water equivalent thickness retrieved from GRACE for the same area and period (Figure S16) [54].
In the winter time, the detected area with negative trends ranges from 0 to 1600 km2. Significant negative trends may indicate that the snow is melt-out before the spring for areas very close to the mine site. Contrary to the finding for the spring season, we find that the ore production explains 73% of the variance in area, far more than the temperature can explain (48.3%) if the unusual warming year 2019 is excluded, suggesting that increasing anthropogenic activities may be a significant driver of winter period snowmelt (Figure S15). With the year 2019 included, the explained variance is 0.43, suggesting that incidents of extreme regional warming complicate the attribution.
Based on the springtime snow melting data (Figure 1e), it takes ~30 days for the NDSI snow cover to reduce from 75% to 0% for the study region; we use this snow melting speed to estimate how the snow-off date is advanced; in other words, for an area with −2.5%/per year trend, that means the snow melting is advanced by one day per year during the study period, so total advanced days is sen_slope/2.5% × 21 years (Figure 3; bottom panel). Figure 7 shows the days that the snow-off is advanced during the last twenty-one years for the two seasons, respectively. For the spring season, the snow melt-out is advanced by 10.6 ± 3.2 days on average and up to 25 days for these areas where significant trends are detected, especially around the Mine facilities and on the southwest side of the Milne Inlet port. According to the snow cover trend in the winter season, the snow-off date would be advanced by 1.5 ± 1.1 days, with large values (5 or more days) inclusively appearing around the Mine facilities.
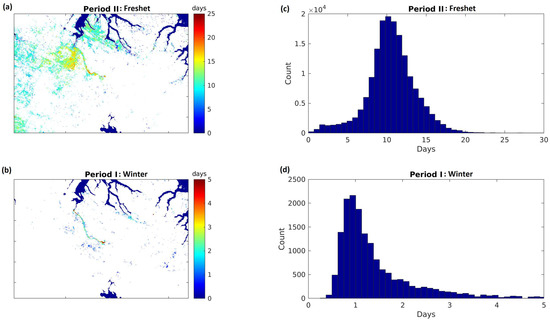
Figure 7.
Advanced snow-off days since 2000 as estimated from snow cover changes (a) for the snowmelt season and (b) for the winter season; the histograms for (a,b) are shown in (c,d), respectively. Areas of coastal water are masked in (a,b) using deep blue color.
Approach II, which uses the first date of snow-off (or 0% snow cover) as the indicator, also gives a similar pattern in the snowmelt advancing days (Figures S17 and S18), supporting the result derived from approach I. While the climate variability only led to one week in advancing snowmelt for the lowland areas (e.g., the western part of the Mine and tote road which is of similar elevation to the Mine’s facilities), the advanced snowmelt date is more than 3 weeks for the area around the Mine’s facilities.
4. Discussion
Inconsistency in dust distribution exists between dustfall samplers (canisters, 2 m above the ground level) and these indicated by the snow cover and albedo from this study. Dustfall is regularly monitored around the mine site during the summer; dustfall samplers are usually located very close to the mine site, i.e., within 5 km from the mine’s facilities, as suggested by the dispersion model predictions; dustfall deposition rates at reference locations (9 km or 14 km away) were often below detection (<0.10 mg/dm2/day) in the summer and were not examined in the winter because helicopter access was unavailable; dust transportation is expected to be further in dry winter with drifting snow and gusty wind [55]. In contrast, our satellite data indicate that fugitive dust was dispersed over 60 km in the winter, using an albedo difference of 0.014 as a threshold. A snow albedo difference of 0.014 may not be discernible by the naked eye; the threshold of 0.014 was selected as [56] found that a decrease of snow albedo by 0.013 could produce a midday mean radiative forcing of 4.5 W m−2 during the ablation season (April-July) in the Sierra Nevada. Optical remote sensing analysis pursued in this study is limited in monitoring dustfall as (1) it only works well in the seasons when snow exists; (2) it is only sensitive to the very top of the snow, while potentially the dust is mixed into the deeper layers and (3) Sentinel-2 and Landsat have a long revisit time, e.g., 10 days and 16 days, respectively and their data are often contaminated by cloud covers. The long-distance transfer of dust is not a surprise as it was found that dust from the Sahara Desert can be transferred to the Amazon Forests, more than three thousand kilometers across the Atlantic Ocean. We allude that it is up to the local First Nations to consider a threshold of dustfall that addresses their concerns.
Previous studies have used albedo or snow-off date to indicate changes in the cryosphere. For example, Di Mauro et al. (2022) found that the ablation season length of 19% of a glacier in the European Alps increased by 18 days/decade on average using albedo as an indicator [4]. Reveillet et al. (2022) show that dust and black carbon deposition advanced snowmelt by 17 ± 6 days on average in the French Alps and the Pyrenees over the 1979–2018 period [8]. McKenzie Skiles (2012) found that the dust radiative forcing shortens snow cover duration by 21 to 51 days in the Colorado River Basin [57]. Wang et al. (2013) suggest significant trends of 2–3 days/decade in earlier snowmelt onset dates over the Eurasian land sector of the Arctic [12]. Dust also dominates high-altitude snow darkening and melting over high mountains in Asia [6]. While all these studies point to the impacts of global warming and/or dust deposition on earlier snowmelt, our study is unique in separating the impact of dust from background warming: here, we identified that the intensified earlier snowmelt is more found around the Mine’s facilities; we also looked at a scenario where the dust source is from the local area (including dust drifting along with dry snow) rather than transported from far away via atmosphere; this is especially important to an Arctic area (e.g., Baffinland) where the extent and magnitude of dust impact is of debate.
Our study suffers uncertainties inherited from the MODIS NDSI snow cover products. (1) Ideally, FSC would be used in the analysis. However, NDSI values as high as 0.97 can be observed from the daily products, suggesting that the FSC can reach more than 100%. Since we primarily relied on the snow vs. non-snow information, either NDSI or FSC will lead to the same results in terms of snow-off date as the interception is very small in the NDSI vs. FSC linear relationship. (2) Data gaps due to cloud cover can be an issue in the analysis [58,59]. We did not use any interpolation for gap-filling. In the high arctic area, the MODIS revisits are increased, so the data gaps due to clouds are expected to be reduced. In reality, the “observed snow-off date” from MODIS may be behind the actual date in the ground if persistent cloud covers exist. In this study, two approaches were tested; “Approach II” strived to derive a snow-off date given the MODIS daily time series despite the possible data gaps; while “Approach I” made use of average snow covers during two periods (winter vs spring) to mitigate the data gaps. Both approaches have led to the same conclusion. During the development of this study, a new Level-3 MODIS data set (MOD10A1F) is developed; a separate parameter is provided to track the number of days in each cell since the last clear-sky observation [58]; we believe that the robustness of our methodology and results can be further strengthened if MOD10A1F is used. (3) The MODIS snow cover product is designed to map clean snow. Albedos for snow mixed with dust (so-called “dirty snow”) may be systematically underestimated. While this may result in the detection of early snowmelt being overestimated, it does not significantly impact the spatial extent of where early snowmelt is detected; (4) surface relieves can cause a shadow in the ground and lead to uncertainties in snow cover; in this study, the dust is mostly seen in the southwestern side of mine where the slopes are usually less than 15 degrees; we expect that the impact of surface relief is not significant.
In addition, there could be a limitation in the analysis from the M-K test: while the M-K test is not significantly impacted by noisy data points in a time series, the last data point with a starting trend may be treated as noise; therefore, our detection of the first year of a significant trend may be one year later than the actual starting year, and our result should be interpreted as the minimum temporal effects detected.
5. Conclusions
Natural resource development in the Arctic is of concern to the environment and local communities. Fugitive dust arising from the Mine’s open-pit site, iron ore transportation on the tote road, and stockpile at the Port have been noted and concern over this distribution has been expressed by local communities. In this study, we examined the dust source, an indicator of its extent, and one aspect that could be applied to evaluate the impacts on the environment from the Mine’s operation. We chose snow cover as an indicator to evaluate any changes that were led by existing drivers, e.g., global warming, and/or recent anthropogenic activities. A Mann–Kendall test has been used to detect snow cover changes, specifically early snowmelt, in a 21-year time series of satellite-derived snow cover products. The following conclusions have been reached:
- (1)
- Fugitive dust originated from the crushing processing, transportation, and stockpiles and the dustfall is regularly monitored by dust samples. How far the dust can be transported and what threshold should be of concern, is of debate. Using snow discoloration as an indicator, we found that the dust plume extended beyond the ranges of the reference sites for dust samples, from where the dustfall is below the detection threshold in the summer. The difference between remote sensing detection in the winter and ground measurements in the summer is worthy of more investigation.
- (2)
- Early snowmelt trends in this study region have existed prior to the Mine’s operation, with Arctic warming as the most likely driver. The early snowmelt trend occurred mostly in lowland areas; the early snowmelt in this study region is in line with the similar changes found in other Pan-Arctic areas.
- (3)
- The Mine’s operation is correlated with strong and localized early snowmelt trends, and the impacted area has been increasing in the last few years, especially in the winter season. Fugitive dust has been reported around the Milne Inlet port, e.g., on sea ice and the tote road, and future studies could evaluate the relationship between fugitive dust and soot from mining activities and the noted earlier snowmelt. The early snowmelt areas are indicated in a zone up to two kilometers away from the road.
Besides the findings above, our study strived to derive information from noisy time series with data gaps. The M-K test was applied to “average snow cover” within a period or snow-off date and enabled us to separate dust impacts from background warming. As global warming is projected to continue, and more mining activities for critical minerals to be used in clear energy transitions are on the way in the Arctic and Subarctic areas, the methodology from this study is expected to be useful for mining companies to manage dust mitigations in similar settings.
Supplementary Materials
The following supporting information can be downloaded at: https://www.mdpi.com/article/10.3390/rs15020313/s1.
Author Contributions
Conceptualization and methodology, L.H., H.P.W. and W.C.; formal analysis, data curation, and writing—original draft preparation, L.H.; writing—review and editing, L.H., H.P.W. and W.C.; funding acquisition, H.P.W. All authors have read and agreed to the published version of the manuscript.
Funding
This study is funded as a part of the Government of Canada’s initiative for monitoring and assessing regional cumulative effects, a recently added requirement to the new Impact Assessment Act (2019).
Data Availability Statement
The MODIS snow cover data were produced by National Snow and Ice Data Center, USA (https://nsidc.org/data/MOD10A1/versions/6; accessed on 1 May 2020), and are available through Google Earth Engine (GEE) (https://developers.google.com/earth-engine/datasets/catalog/MODIS_006_MOD10A1; accessed on 1 May 2020). The Canadian Land Cover and DEM data were produced by Natural Resources Canada and are available through Open Canada (https://open.canada.ca/data/en/dataset/4e615eae-b90c-420b-adee-2ca35896caf6; accessed on 1 May 2020) and GEE (https://developers.google.com/earth-engine/datasets/catalog/NRCan_CDEM; accessed on 2 May 2020), respectively. The NLDAS-2 data are available through GEE (https://developers.google.com/earth-engine/datasets/catalog/NASA_NLDAS_FORA0125_H002; accessed on 1 June 2020). The Landsat and Sentinel-2 data were downloaded from USGS (https://earthexplorer.usgs.gov/; accessed on 1 June 2022).
Acknowledgments
The authors thank S. G. Leblanc for an internal review (NRCan contribution number: 20210037). The authors also thank two anonymous reviewers whose constructive comments and suggestions have helped us to improve the clarity and prevision of our manuscript.
Conflicts of Interest
The authors declare no conflict of interest.
References
- Nunatsiaq News. Available online: https://nunatsiaq.com/stories/article/baffinland-exceeded-dust-impact-projections-for-3-straight-years-qia/ (accessed on 9 December 2022).
- Mioduszewski, J.R.; Rennermalm, A.K.; Robinson, D.A.; Mote, T.L. Attribution of snowmelt onset in Northern Canada. J. Geophys. Res. Atmos. 2014, 119, 9638–9653. [Google Scholar] [CrossRef]
- Skiles, S.M.K.; Flanner, M.; Cook, J.M.; Dumont, M.; Painter, T.H. Radiative forcing by light-absorbing particles in snow. Nat. Clim. Change 2018, 8, 964–971. [Google Scholar] [CrossRef]
- Di Mauro, B.; Fugazza, D. Pan-Alpine glacier phenology reveals lowering albedo and increase in ablation season length. Remote Sens. Environ. 2022, 279, 113119. [Google Scholar] [CrossRef]
- Di Mauro, B. A darker cryosphere in a warming world. Nat. Clim. Change 2020, 10, 979–980. [Google Scholar] [CrossRef]
- Sarangi, C.; Qian, Y.; Rittger, K.; Ruby Leung, L.; Chand, D.; Bormann, K.J.; Painter, T.H. Dust dominates high-altitude snow darkening and melt over high-mountain Asia. Nat. Clim. Change 2020, 10, 1045–1051. [Google Scholar] [CrossRef]
- Oerlemans, J.; Giesen, R.H.; Van Den Broeke, M.R. Retreating alpine glaciers: Increased melt rates due to accumulation of dust (Vadret da Morteratsch, Switzerland). J. Glaciol. 2009, 55, 729–736. [Google Scholar] [CrossRef]
- Réveillet, M.; Dumont, M.; Gascoin, S.; Lafaysse, M.; Nabat, P.; Ribes, A.; Nheili, R.; Tuzet, F.; Ménégoz, M.; Morin, S.; et al. Black carbon and dust alter the response of mountain snow cover under climate change. Nat. Commun. 2022, 13, 5279. [Google Scholar] [CrossRef]
- Flanner, M.G.; Zender, C.S.; Randerson, J.T.; Rasch, P.J. Present-day climate forcing and response from black carbon in snow. J. Geophys. Res. Atmos. 2007, 112, D11202. [Google Scholar] [CrossRef]
- Painter, T.H.; Skiles, S.M.; Deems, J.S.; Brandt, W.T.; Dozier, J. Variation in Rising Limb of Colorado River Snowmelt Runoff Hydrograph Controlled by Dust Radiative Forcing in Snow. Geophys. Res. Lett. 2018, 45, 797–808. [Google Scholar] [CrossRef]
- Frei, A.; Tedesco, M.; Lee, S.; Foster, J.; Hall, D.K.; Kelly, R.; Robinson, D.A. A review of global satellite-derived snow products. Adv. Space Res. 2012, 50, 1007–1029. [Google Scholar] [CrossRef]
- Wang, L.; Derksen, C.; Brown, R.; Markus, T. Recent changes in pan-Arctic melt onset from satellite passive microwave measurements. Geophys. Res. Lett. 2013, 40, 522–528. [Google Scholar] [CrossRef]
- Derksen, C.; Brown, R. Spring snow cover extent reductions in the 2008–2012 period exceeding climate model projections. Geophys. Res. Lett. 2012, 39, 19504. [Google Scholar] [CrossRef]
- Trishchenko, A.P.; Leblanc, S.G.; Wang, S.; Li, J.; Ungureanu, C.; Luo, Y.; Khlopenkov, K.V.; Fontana, F. Variations of Annual Minimum Snow and Ice Extent over Canada and Neighboring Landmass Derived from MODIS 250-m Imagery for 2000–2014. Can. J. Remote Sens. 2016, 42, 214–242. [Google Scholar] [CrossRef]
- Rizzi, J.; Nilsen, I.B.; Stagge, J.H.; Gisnås, K.; Tallaksen, L.M. Five decades of warming: Impacts on snow cover in Norway. Hydrol. Res. 2018, 49, 670–688. [Google Scholar] [CrossRef]
- Callaghan, T.V.; Johansson, M.; Brown, R.D.; Groisman, P.Y.; Labba, N.; Radionov, V.; Barry, R.G.; Bulygina, O.N.; Essery, R.L.H.; Frolov, D.M.; et al. The Changing Face of Arctic Snow Cover: A Synthesis of Observed and Projected Changes. AMBIO 2011, 40, 17–31. [Google Scholar] [CrossRef]
- Thiebault, K.; Young, S. Snow cover change and its relationship with land surface temperature and vegetation in northeastern North America from 2000 to 2017. Int. J. Remote Sens. 2020, 41, 8453–8474. [Google Scholar] [CrossRef]
- Jan, A.; Painter, S.L. Permafrost thermal conditions are sensitive to shifts in snow timing. Environ. Res. Lett. 2020, 15, 084026. [Google Scholar] [CrossRef]
- Stone, R.S.; Dutton, E.G.; Harris, J.M.; Longenecker, D. Earlier spring snowmelt in northern Alaska as an indicator of climate change. J. Geophys. Res. Atmos. 2002, 107, ACL 10-1–ACL 10-13. [Google Scholar] [CrossRef]
- Niittynen, P.; Heikkinen, R.K.; Luoto, M. Snow cover is a neglected driver of Arctic biodiversity loss. Nat. Clim. Change 2018, 8, 997–1001. [Google Scholar] [CrossRef]
- Happonen, K.; Aalto, J.; Kemppinen, J.; Niittynen, P.; Virkkala, A.M.; Luoto, M. Snow is an important control of plant community functional composition in oroarctic tundra. Oecologia 2019, 191, 601–608. [Google Scholar] [CrossRef]
- Mooney, E.; Mullins, M.; Den Uyl, J.; Trail, S.; Nguyen, P.; Owens, J.; Godtfredsen, E.; Heschel, S. Early snowmelt reduces aphid abundance (Aphis asclepiadis) by creating water-stressed host plants (Ligusticum porteri) and altering interactions with ants. Arthropod-Plant Interact. 2021, 15, 33–46. [Google Scholar] [CrossRef]
- Francon, L.; Corona, C.; Till-Bottraud, I.; Choler, P.; Carlson, B.Z.; Charrier, G.; Améglio, T.; Morin, S.; Eckert, N.; Roussel, E.; et al. Assessing the effects of earlier snow melt-out on alpine shrub growth: The sooner the better? Ecol. Indic. 2020, 115, 106455. [Google Scholar] [CrossRef]
- Melin, M.; Mehtätalo, L.; Helle, P.; Ikonen, K.; Packalen, T. Decline of the boreal willow grouse (Lagopus lagopus) has been accelerated by more frequent snow-free springs. Sci. Rep. 2020, 10, 6987. [Google Scholar] [CrossRef] [PubMed]
- Campbell, D.R. Early snowmelt projected to cause population decline in a subalpine plant. Proc. Natl. Acad. Sci. USA 2019, 116, 12901–12906. [Google Scholar] [CrossRef] [PubMed]
- Langlois, A.; Johnson, C.A.; Montpetit, B.; Royer, A.; Blukacz-Richards, E.A.; Neave, E.; Dolant, C.; Roy, A.; Arhonditsis, G.; Kim, D.K.; et al. Detection of rain-on-snow (ROS) events and ice layer formation using passive microwave radiometry: A context for Peary caribou habitat in the Canadian Arctic. Remote Sens. Environ. 2017, 189, 84–95. [Google Scholar] [CrossRef]
- CBC News Report. Available online: https://www.cbc.ca/news/canada/north/mystery-caribou-deaths-arctic-island-1.3962747 (accessed on 2 February 2017).
- Assmann, J.J.; Myers-Smith, I.H.; Phillimore, A.B.; Bjorkman, A.D.; Ennos, R.E.; Prevéy, J.S.; Henry, G.H.R.; Schmidt, N.M.; Hollister, R.D. Local snow melt and temperature—But not regional sea ice—Explain variation in spring phenology in coastal Arctic tundra. Glob. Chang. Biol. 2019, 25, 2258–2274. [Google Scholar] [CrossRef]
- John, C.; Miller, D.; Post, E. Regional variation in green-up timing along a caribou migratory corridor: Spatial associations with snowmelt and temperature. Arct. Antarct. Alp. Res. 2020, 52, 416–423. [Google Scholar] [CrossRef]
- Baffin Island. Available online: https://en.wikipedia.org/wiki/Baffin_Island (accessed on 29 December 2022).
- Mary River Mine. Available online: https://en.wikipedia.org/wiki/Mary_River_Mine (accessed on 29 December 2022).
- Mcgee, N. Indigenous Opposition to Arctic Mine Expansion Could Halt Development. Available online: https://www.theglobeandmail.com/business/article-baffinland-iron-ore-expansion-plans-in-arctic-raise-concerns-for-inuit/#:~:text=Indigenous%20opposition%20to%20Arctic%20mine%20expansion%20could%20halt%20development,-Niall%20McGee%20Mining&text=Mary%20River%20iron%20ore%20on%20Baffin%20Island%2C%20Nunavut.&text=Baffinland%20says%20the%20expansion%20is,on%20buoyant%20iron%20ore%20prices (accessed on 5 February 2022).
- Spring, R. Inuit Speak Out against Expansion of Arctic Iron Mine, Community Concerned over Wildlife Impacts. Available online: https://wwf.ca/stories/inuit-speak-out-against-expansion-of-arctic-iron-mine/ (accessed on 2 February 2022).
- Tigue, K. On Baffin Island in the Fragile Canadian Arctic, an Iron Ore Mine Spews Black Carbon. Available online: https://insideclimatenews.org/news/02042020/baffin-island-canada-arctic-iron-ore-mine-black-carbon/. (accessed on 8 December 2022).
- Hall, D.K.; Riggs, G.A. Accuracy assessment of the MODIS snow products. Hydrol. Process. 2007, 21, 1534–1547. [Google Scholar] [CrossRef]
- Hall, D.K.; Riggs, G.A. MODIS/Terra Snow Cover Daily L3 Global 500 m SIN Grid, Version 6; NASA National Snow and Ice Data Center Distributed Active Archive Center: Boulder, CO, USA, 2016. [Google Scholar] [CrossRef]
- Salomonson, V.V.; Appel, I. Estimating fractional snow cover from MODIS using the normalized difference snow index. Remote Sens. Environ. 2004, 89, 351–360. [Google Scholar] [CrossRef]
- Riggs, G.A.; Hall, D.K. MODIS Snow Products Collection 6 User Guide; 2016. Available online: https://modis-snow-ice.gsfc.nasa.gov/uploads/C6_MODIS_Snow_User_Guide.pdf (accessed on 1 December 2022).
- Riggs, G.A.; Hall, D.K.; Román, M.O. MODIS/Terra Snow Cover 8-Day L3 Global 500 m SIN Grid, Version 6. Available online: https://nsidc.org/data/MOD10A2/versions/6/print (accessed on 5 February 2022).
- Latifovic, R.; Pouliot, D.; Olthof, I. Circa 2010 Land Cover of Canada: Local Optimization Methodology and Product Development. Remote Sens. 2017, 9, 1098. [Google Scholar] [CrossRef]
- CDEM. Canadian Digital Elevation Model, 1945-2011; Natural Resources Canada: Ottawa, ON, Canada. Available online: https://open.canada.ca/data/en/dataset/7f245e4d-76c2-4caa-951a-45d1d2051333 (accessed on 1 December 2021).
- NLDAS-2. NLDAS-2: North American Land Data Assimilation System Forcing Fields; NASA/GSFC; NASA Goddard Earth Sciences Data and Information Services Center (GES DISC): Greenbelt, MD, USA, 2020. Available online: https://ldas.gsfc.nasa.gov/nldas/v2/forcing (accessed on 1 January 2021).
- Li, Z.; Erb, A.; Sun, Q.; Liu, Y.; Shuai, Y.; Wang, Z.; Boucher, P.; Schaaf, C. Preliminary assessment of 20-m surface albedo retrievals from sentinel-2A surface reflectance and MODIS/VIIRS surface anisotropy measures. Remote Sens. Environ. 2018, 217, 352–365. [Google Scholar] [CrossRef]
- Wang, F.; Shao, W.; Yu, H.; Kan, G.; He, X.; Zhang, D.; Ren, M.; Wang, G. Re-evaluation of the Power of the Mann-Kendall Test for Detecting Monotonic Trends in Hydrometeorological Time Series. Front. Earth Sci. 2020, 8, 14. [Google Scholar] [CrossRef]
- Fatichi, S. Mann-Kendall Test, MATLAB Central File Exchange. Available online: https://www.mathworks.com/matlabcentral/fileexchange/25531-mann-kendall-test (accessed on 29 December 2022).
- O’Leary Iii, D.; Hall, D.K.; Medler, M.; Matthews, R.; Flower, A. Snowmelt Timing Maps Derived from MODIS for North America, Version 2, 2001–2018; ORNL Distributed Active Archive Center: Oak Ridge, TN, USA, 2020. [Google Scholar] [CrossRef]
- Luomaranta, A.; Aalto, J.; Jylhä, K. Snow cover trends in Finland over 1961–2014 based on gridded snow depth observations. Int. J. Climatol. 2019, 39, 3147–3159. [Google Scholar] [CrossRef]
- Chen, W.; Leblanc, S.G.; White, H.P.; Prevost, C.; Milakovic, B.; Rock, C.; Sharam, G.; O’Keefe, H.; Corey, L.; Croft, B.; et al. Does Dust from Arctic Mines Affect Caribou Forage? J. Environ. Prot. 2017, 8, 258–276. [Google Scholar] [CrossRef]
- White, H.P.; Chen, W.; Leblanc, S.G.; Croft, B.; Adamczewski, J.; Patenaude, A.; Clark, K.; Pellissey, J.S.; Corey, L.; Hume, J.; et al. Satellite Observations for Detection of Dust from Mining Activities in a Caribou Habitat. In Proceedings of the 17th North American Caribou Workshop, Ottawa, ON, USA, 29 October–2 November 2018. [Google Scholar]
- MDO. Ore Produciton in Mary River Mine. Available online: https://miningdataonline.com/property/57/Mary-River-Mine.aspx#Production (accessed on 8 February 2022).
- Mine. Baffinland Iron Mines Sets 5 Million Tonne Shipping Record. Available online: http://www.mining.com/baffinland-iron-mines-sets-5-million-tonne-shipping-record/ (accessed on 8 December 2022).
- NunatsiaqNews. Moodys Credit Report Update on Baffinland June 2020. Available online: https://www.scribd.com/document/479477728/Moodys-Credit-Report-Update-on-Baffinland-June-2020 (accessed on 8 December 2021).
- CanadianMiningJournal. Transportation: Solution from Volga-Dnepr Boosts Mary River Production Target. Available online: http://www.canadianminingjournal.com/news/transportation-solution-volga-dnepr-boosts-may-river-production-target/ (accessed on 8 December 2021).
- JPL; NASA. GRACE Data Analysis Tool (2.0). Available online: https://grace.jpl.nasa.gov/data-analysis-tool/ (accessed on 8 December 2022).
- Mary River Project Terrestrial Environment 2020 Annual Monitoring Report; Project No.: 20Y0019; EDI Environmental Dynamics Inc.: Whitehore, YT, Canada, 2021; Available online: https://baffinland.com/_resources/document_portal/2020-Terrestrial-Environment-Annual-Monitoring-Report.pdf (accessed on 8 December 2022).
- Huang, H.; Qian, Y.; He, C.; Bair, E.H.; Rittger, K. Snow Albedo Feedbacks Enhance Snow Impurity-Induced Radiative Forcing in the Sierra Nevada. Geophys. Res. Lett. 2022, 49, e2022GL098102. [Google Scholar] [CrossRef]
- Skiles, S.M.; Painter, T.H.; Deems, J.S.; Bryant, A.C.; Landry, C.C. Dust radiative forcing in snow of the Upper Colorado River Basin: 2. Interannual variability in radiative forcing and snowmelt rates. Water Resour. Res. 2012, 48, W07522. [Google Scholar] [CrossRef]
- Hall, D.K.; Riggs, G.A.; DiGirolamo, N.E.; Román, M.O. Evaluation of MODIS and VIIRS cloud-gap-filled snow-cover products for production of an Earth science data record. Hydrol. Earth Syst. Sci. 2019, 23, 5227–5241. [Google Scholar] [CrossRef]
- Shen, X.; Liu, B.; Jiang, M.; Lu, X. Marshland Loss Warms Local Land Surface Temperature in China. Geophys. Res. Lett. 2020, 47, e2020GL087648. [Google Scholar] [CrossRef]


Disclaimer/Publisher’s Note: The statements, opinions and data contained in all publications are solely those of the individual author(s) and contributor(s) and not of MDPI and/or the editor(s). MDPI and/or the editor(s) disclaim responsibility for any injury to people or property resulting from any ideas, methods, instructions or products referred to in the content. |
© 2023 by the authors. Licensee MDPI, Basel, Switzerland. This article is an open access article distributed under the terms and conditions of the Creative Commons Attribution (CC BY) license (https://creativecommons.org/licenses/by/4.0/).