Article

Lightweight SAR: A Two-Bit Strategy

1
College of Electronic and Information Engineering, Shenzhen University, Shenzhen 518060, China
2
School of Electrical Engineering, Southwest Jiaotong University, Chengdu 611756, China
3
State Key Laboratory of Millimeter Waves, Southeast University, Nanjing 210096, China
4
China Aerospace Science and Technology Corporation, Beijing 100048, China
5
Peng Cheng Laboratory, Shenzhen 518000, China
*
Author to whom correspondence should be addressed.
Remote Sens. 2023, 15(2), 310; https://doi.org/10.3390/rs15020310
Submission received: 31 October 2022 / Revised: 29 November 2022 / Accepted: 6 December 2022 / Published: 5 January 2023
(This article belongs to the Special Issue Advances in SAR: Sensors, Methodologies, and Applications II)

Abstract

:
By benefiting from one-bit sampling, the system deployment of synthetic aperture radar (SAR) can be greatly simplified. However, it usually requires a high oversampling rate to avoid the apparent degradation in imagery, which counteracts the storage-saving advantages. In this paper, a two-bit lightweight SAR imaging strategy is proposed to take the advantage of one-bit quantization in simplification but get rid of the requirement of sampling at a high rate. Specifically, based on one-bit quantization, an extra bit after an appropriate phase shifting is introduced to suppress the harmonics resulting from the nonlinear effect of quantization. In this way, the awkward nonlinearity in conventional one-bit schemes can be tackled by the nonlinearity generated with the newly introduced bit. Hence, this improves the imaging quality. In addition, the proposed method does not rely on fast sampling. The harmonic suppression effect is retained under low-sampling-rate conditions. Therefore, the amount of data acquired will decrease dramatically. This will benefit the whole process of imaging and, consequently, lighten the system burden and cost. The theoretical analysis and experimental results showcase the superiority of the proposed method.

1. Introduction

Synthetic aperture radar (SAR) has an excellent remote sensing ability. It can be used in a large variety of imaging environments and provides long-distance and high-resolution sensing performance [1]. This facilitates its wide range of applications in various civilian and military fields, such as battlefield reconnaissance, regional monitoring, ground quality exploration, disaster rescue, etc. [2]. Along with the development of the ever-growing requirements in various applications, the pursuit of high resolutions and wide swathes has become a tendency. This has drawn forth new technology for acquiring better imaging performance. An ultra-wideband circularly polarized crossed-dipole antenna was used to improve the imaging quality for near-field SAR [3]. Millimeter-wave radars are being increasingly integrated into commercial vehicles to support advanced driver-assistance system features [4]. In addition, the multiple-input and multiple-output SAR (MIMO-SAR) imaging technique applies coherent SAR principles to vehicular MIMO radar to improve the side-view (angular) resolution [5]. However, at the same time, the pursuit of high performance inevitably produces considerably high data volumes for SAR systems, which causes a great burden on data acquirement, storage, transmission, and processing. This raises the cost and the burden of the SAR system [6].
Over the last decades, as the acquirement of large amounts data has become a bottleneck in SAR systems, much attention has been attracted for the development of strategies for alleviating the requirements in data acquirement. For the last few years, compressive sensing (CS) has been introduced to the area of SAR imaging and has demonstrated tremendous possibility due to the ability to provide high-resolution imaging performance with few echo data [7,8,9,10,11,12,13,14,15,16,17]. In a CS framework, the signal being reconstructed should have the characteristic of sparsity; thereby, it can be recovered with highly incomplete sampling, even with much fewer measurements than the Nyquist theory requires. The authors of [8] applied a CS framework to moving ground target imaging to obtain target images with single-channel SAR. A CS-based multi-channel SAR imaging technique was proposed in [9] for moving ocean targets. Ref. [10] proposed a compressive sensing SAR imaging algorithm for a linear frequency-modulated continuous-wave (LFMCW) SAR system. In addition, Refs. [11,12,13,14,15] employed CS frameworks to simultaneously reconstruct true and false targets for single-channel SAR that encountered deceptive jamming. However, there is a strong constraint in that the targets should be sparsely distributed in the observation scene. This is the precondition of implementing the CS technique, and it limits its application. When imaging in non-sparse scenes, this approach will be negated.
Aside from the above studies, another line of work has resorted to curtailing the quantized bit depth (the number of quantization bits) of analog-to-digital converters (ADCs) to reduce the amount of echo data acquired [18]. It is well known that the power consumption of ADC devices increases exponentially with the bit depth of quantization [19]. On this basis, the system hardware cost (including ADCs, data storage, and transmission) and power consumption can be alleviated, and real-time implementation can be simplified by restricting the bit depth [20]. Attracted by the advantage of low cost and low complexity, many works have paid attention to the ultra case, i.e., one-bit quantization, with a comparator-based sampling strategy. It was proved that, by choosing the quantization thresholds, when the number of measurements increased linearly, the reconstruction error would decrease exponentially [21,22]. In [23], it was stated that SAR imagery can be achieved with acceptable quality degradation when the echo is quantized into one-bit data. Recently, a single-frequency signal was employed to act as the threshold in one-bit quantization, and it was able to alleviate the harmonic problem [24,25]. A model of one-bit SAR signal processing was described in [26] to decline the hardware cost. However, as pointed out in [27], to avoid the image degradation resulting from the harmonics in one-bit quantization, either an intermediate frequency is required or a high oversampling rate is needed. The increase in the sampling rate will lead straightaway to an increase in data volume. In this case, the advantage of storage savings resulting from one-bit quantization is counteracted [28].
In view of the above discussion, it is necessary to devise an approach that does not suffer from these shortcomings and can recover imagery without the requirement of a high sampling rate. However, this poses a big challenge. In this paper, a lightweight SAR imaging strategy with two-bit quantization is proposed to cut down the cost of an SAR system. Specifically, a two-bit quantization approach is first devised to suppress serious quantization noise, and it can be implemented with a low sampling rate. Then, an efficient SAR imaging scheme is designed corresponding to the proposed low-bit quantization strategy. Theoretical analysis and numerical results demonstrate that the quantization error can be considerably reduced by taking into account an extra quantization bit with an appropriate phase shift. In addition, while substantially decreasing the computational cost in terms of both memory and time, the devised lightweight SAR system results in higher efficiency.
The contributions of the work in this paper can be summarized as follows.
(i)
High quality of imaging: On the basis of one-bit quantization, an extra bit is introduced to suppress the harmonics resulting from the nonlinear effect of quantization, which will lead to unwished contaminations in imagery. This ensures the quality of imaging.
(ii)
Low sampling rate requirement (low ADC cost): The nonlinear effect is employed to suppress the nonlinear effect in conventional one-bit quantization. Specifically, the newly introduced one-bit data also experience a nonlinear effect and also contain harmonics. The difference is that the newly introduced harmonics are used to eliminate the harmonics resulting from conventional one-bit quantization. It is worth noting that, unlike in existing methods, there is no need for a high sampling rate to reserve space for harmonics in the frequency domain. That is to say, the quantization noise can be eliminated under either a high sampling rate or a low sampling rate. This feature is very valuable because the low requirement for the sampling rate decreases the cost in the ADC.
(iii)
Low data amount: In SAR systems, a wideband frequency signal is usually used to achieve a high resolution. In one-bit sampling, a high oversampling rate is required to alleviate the effect of quantization noise. This will add a burden on the sampling rate and dramatically increase the amount of data acquired. In contrast, the designed two-bit SAR imaging system can be implemented with only two-bit quantization under a low sampling rate. This will directly reduce the amount of the echo data acquired, which will benefit the whole process of imaging, including data acquisition, storage, transmission, and processing.
(iv)
Low computational complexity: Unlike other multi-bit strategies relying on complex numeric calculations, the proposed two-bit approach can be implemented based on logical calculations, which are very efficient.
To concisely reveal its low-bit and low-sampling-rate characteristics, this is named two-bit lightweight SAR.
The rest of this paper is organized as follows. In Section 2, the nonlinear effect of one-bit quantization is analyzed in detail. Section 3 is devoted to developing the two-bit quantization strategy. Numerical examples that corroborate the theory are discussed in Section 4. Finally, the conclusion is provided in Section 5.

2. Nonlinear Effect in One-Bit Quantization

In an SAR system, the resolution in the range domain is inversely proportional to the band of the transmitted signal. Thus, in order to reap a high resolution, a wide-band signal is required. In this case, a linear frequency modulation (LFM) signal is usually employed in the transmitter, which can be given as
s ( t r ) = rect t r T r exp j 2 π f 0 t r + j π K r t r 2 ,
where rect ( · ) is the rectangular function, t r is the fast time in the range domain, T r denotes the pulse duration, f 0 represents the carrier frequency, and K r is the chirp rate.
After being reflected by a scatterer, the echo will contain information on the scatterer’s range and the scattering coefficient. After the process of removing the carrier frequency, the signal can be expressed as
s n ( t r , t a ) = ρ n a a 2 ( t a τ n ) rect t r 2 R n ( t a τ n ) / c T r × exp j π K r t r 2 R n ( t a τ n ) c 2 × exp j 4 π λ R n t a τ n + w n ,
where t a is the slow time, λ is the wavelength, ρ n is the scattering coefficient, τ n is the time delay of the scatterer in azimuth, R n ( · ) is the instantaneous slant range history varying with the slow time, a a ( · ) is the azimuth beam pattern of the SAR antenna, and w n is the additive complex Gaussian noise with a mean of zero and variance of 2 σ 2 .
In a conventional SAR system, the received echo signal is sampled, quantized, and then implemented with a pulse-compressing process to obtain the imagery of the target of interest. In the receiver of SAR, the amount of the data for imaging is in direct proportion to the pulse repetition frequency (PRF), to the sampling rate for each received pulse, and to the number of quantization bits for each sample [1]. Firstly, limited by the space on a mobile platform, the antenna size is limited; then, a high PRF is required to avoid ambiguity in the azimuth dimension. Secondly, a high resolution in the range dimension is usually obtained based on a high bandwidth, which requires a high sampling rate to satisfy the Nyquist theory. Thirdly, if a higher precision is needed in data acquirement, more quantization bits are required in the ADC. These factors bring the SAR system a great amount of data. When the SAR system is deployed on an unmanned aerial vehicle (UAV) or space-borne platform, the resources for data storage, transmission, and processing become very precious. Therefore, it is of great importance to restrict the amount of data.
In general, the amount of the data being processed can be reduced according to the three aforementioned aspects (i.e., reducing the PRF, sampling rate, and quantization bits). However, the system performance will degrade in different ways. Firstly, the decrease in the PRF will introduce azimuth ambiguity. Although this problem can be tackled by using a longer antenna in the azimuth dimension, the azimuth resolution will be degraded accordingly. Secondly, according to the Nyquist sampling theorem, the decrease in the sampling rate will restrict the bandwidth that the SAR system can achieve. This will directly decrease the range resolution. Thirdly, the decrease in the quantization bits will increase the quantization noise and reduce the signal-to-noise ratio (SNR) of the SAR imagery.
In order to limit the volume of the data being manufactured and guarantee the quality of the SAR imagery, this paper is concentrated on the reduction of the quantization bits. The most serious problem brought by low quantization length is its nonlinear effect, which causes quantization noise, namely, harmonics. The limiting case of low-bit-length quantization is to code the signals at only one bit so that only the information about the signs of the signal is retained. The mechanism and the harmonic problem brought about are analyzed in what follows.
For the sake of brevity and readability, let
ϕ = π K r t r 2 R n ( t a τ n ) / c 2 4 π R n t a τ n / λ ,
and we define the one-bit quantization process of a complex-valued number as
csign ( · ) sign ( { · } ) + j ( sign ( { · } ) ) ,
where { · } and { · } denote the real and imaginary parts of its variables, respectively, and sign ( · ) is the sign function returning the sign of the number. Then, the one-bit quantization of the received echo can be given as
s 1 n ( t r , t a ) = csign ( s n ( t r , t a ) ) = sign ( ρ n cos ϕ + w n R ) + j sign ( ρ n sin ϕ + w n I ) .
where w n R = { w n } and w n I = { w n } , which are independently and identically distributed (IID) Gaussian random variables with a mean of zero and variance of σ 2 . Their probability density function can be given as
p ( w n R ) = 1 2 π σ 2 exp w n R 2 2 σ 2 ,
and
p ( w n I ) = 1 2 π σ 2 exp w n I 2 2 σ 2 .
To analyze the harmonics of the one-bit echo in detail, it is necessary to derive the integral expression of the sign function, which is
sign ( t ) = j π exp ( j ω t ) ω d ω .
For clarification, the formulation is given in Appendix A.
Then, by substituting (8) into (5), the real part of (5) can be formulated as [29]
{ s 1 n ( t r , t a ) } = sign ( ρ n cos ϕ + w n R ) = j π exp j ω ( ρ n cos ϕ + w n R ) ω d ω = m = 0 ε m j m + 1 π A m cos ( m ϕ ) ,
where J m ( · ) is the m-th order Bessel function,
ε m = 1 , m = 0 2 , m 1 ,
and
A m = J m ( ρ n ω ) exp ( j ω w n R ) ω d ω .
Based on the distribution of w n R , the mean of A m can be derived as
A ¯ m = A m p ( w n R ) d w n R = J m ( ρ n ω ) exp ( j ω w n R ) ω × exp ( w n R 2 / 2 σ 2 ) 2 π σ 2 d ω d w n R = J m ( ρ n ω ) exp ( σ 2 ω 2 2 ) ω d ω .
Recall that the Bessel function has the following odevity:
J m ( ω ) = J m ( ω ) , m = 2 k J m ( ω ) , m = 2 k + 1 .
When m is even, the integrand function in (12) is an odd function. By combining the symmetry of the integral interval, the value of A ¯ m will be 0. For an odd m, the integrand function in (12) is an even function, and the value of A ¯ m will be
A ¯ m = Γ ( m 2 ) Γ ( m + 1 ) ρ n 2 σ 1 m F 1 m 2 , m + 1 , ρ n 2 2 σ 2 ,
where Γ ( · ) is the Gamma function and 1 F 1 ( · ) is the confluent hyper-geometric function.
In the same way, the imaginary part of (5) can be derived as
{ s 1 n ( t r , t a ) } = sign ( ρ n sin ϕ + w n I ) = j π exp j ω ( ρ n sin ϕ + w n I ) ω d ω = m = 1 ε m j m + 1 π A m cos ( m ϕ m 2 π ) = m = 1 ε m j m + 1 π A m sin ( m ϕ ) j m 1 .
By substituting (9) and (15) into (5), the one-bit quantization can be formulated as
s 1 n ( t r , t a ) = m = 1 ε m j m + 1 π A m cos ( m ϕ ) + j m = 1 ε m j m + 1 π A m sin ( m ϕ ) j m 1 = m = 1 ε m j m + 1 π A m cos ( m ϕ ) + j sin ( m ϕ ) j m 1 = m = 1 ε m j m + 1 π A m cos ( 1 ) m 1 2 m ϕ + j sin ( 1 ) m 1 2 m ϕ = m = 1 ε m j m + 1 π A m exp j ( 1 ) m 1 2 m ϕ = m = 1 ε 2 m 1 ( 1 ) m π A 2 m 1 exp j ( 1 ) m 1 ( 2 m 1 ) ϕ .
From (16), it can be seen that, because of the nonlinear effect, after the one-bit quantization, in addition to the original frequency component, harmonics are generated. It is worth noting that only odd harmonics arise. In the data-processing procedure, the frequency component with m = 1 is the desired signal in accordance with the original signal, while the rest is harmful, and this is commonly known as quantization noise. In an SAR imaging system, the harmonics will not only degrade the SNR, but will also generate false targets in the imagery—especially the lower-order harmonics, whose power is higher than that of higher-order harmonics, e.g., 3rd and 5th harmonics (detailed and intuitive experimental results and analyses are shown in Section 4). Therefore, it is essential to suppress the harmonics to achieve high-quality SAR imagery.

3. Two-Bit Strategy

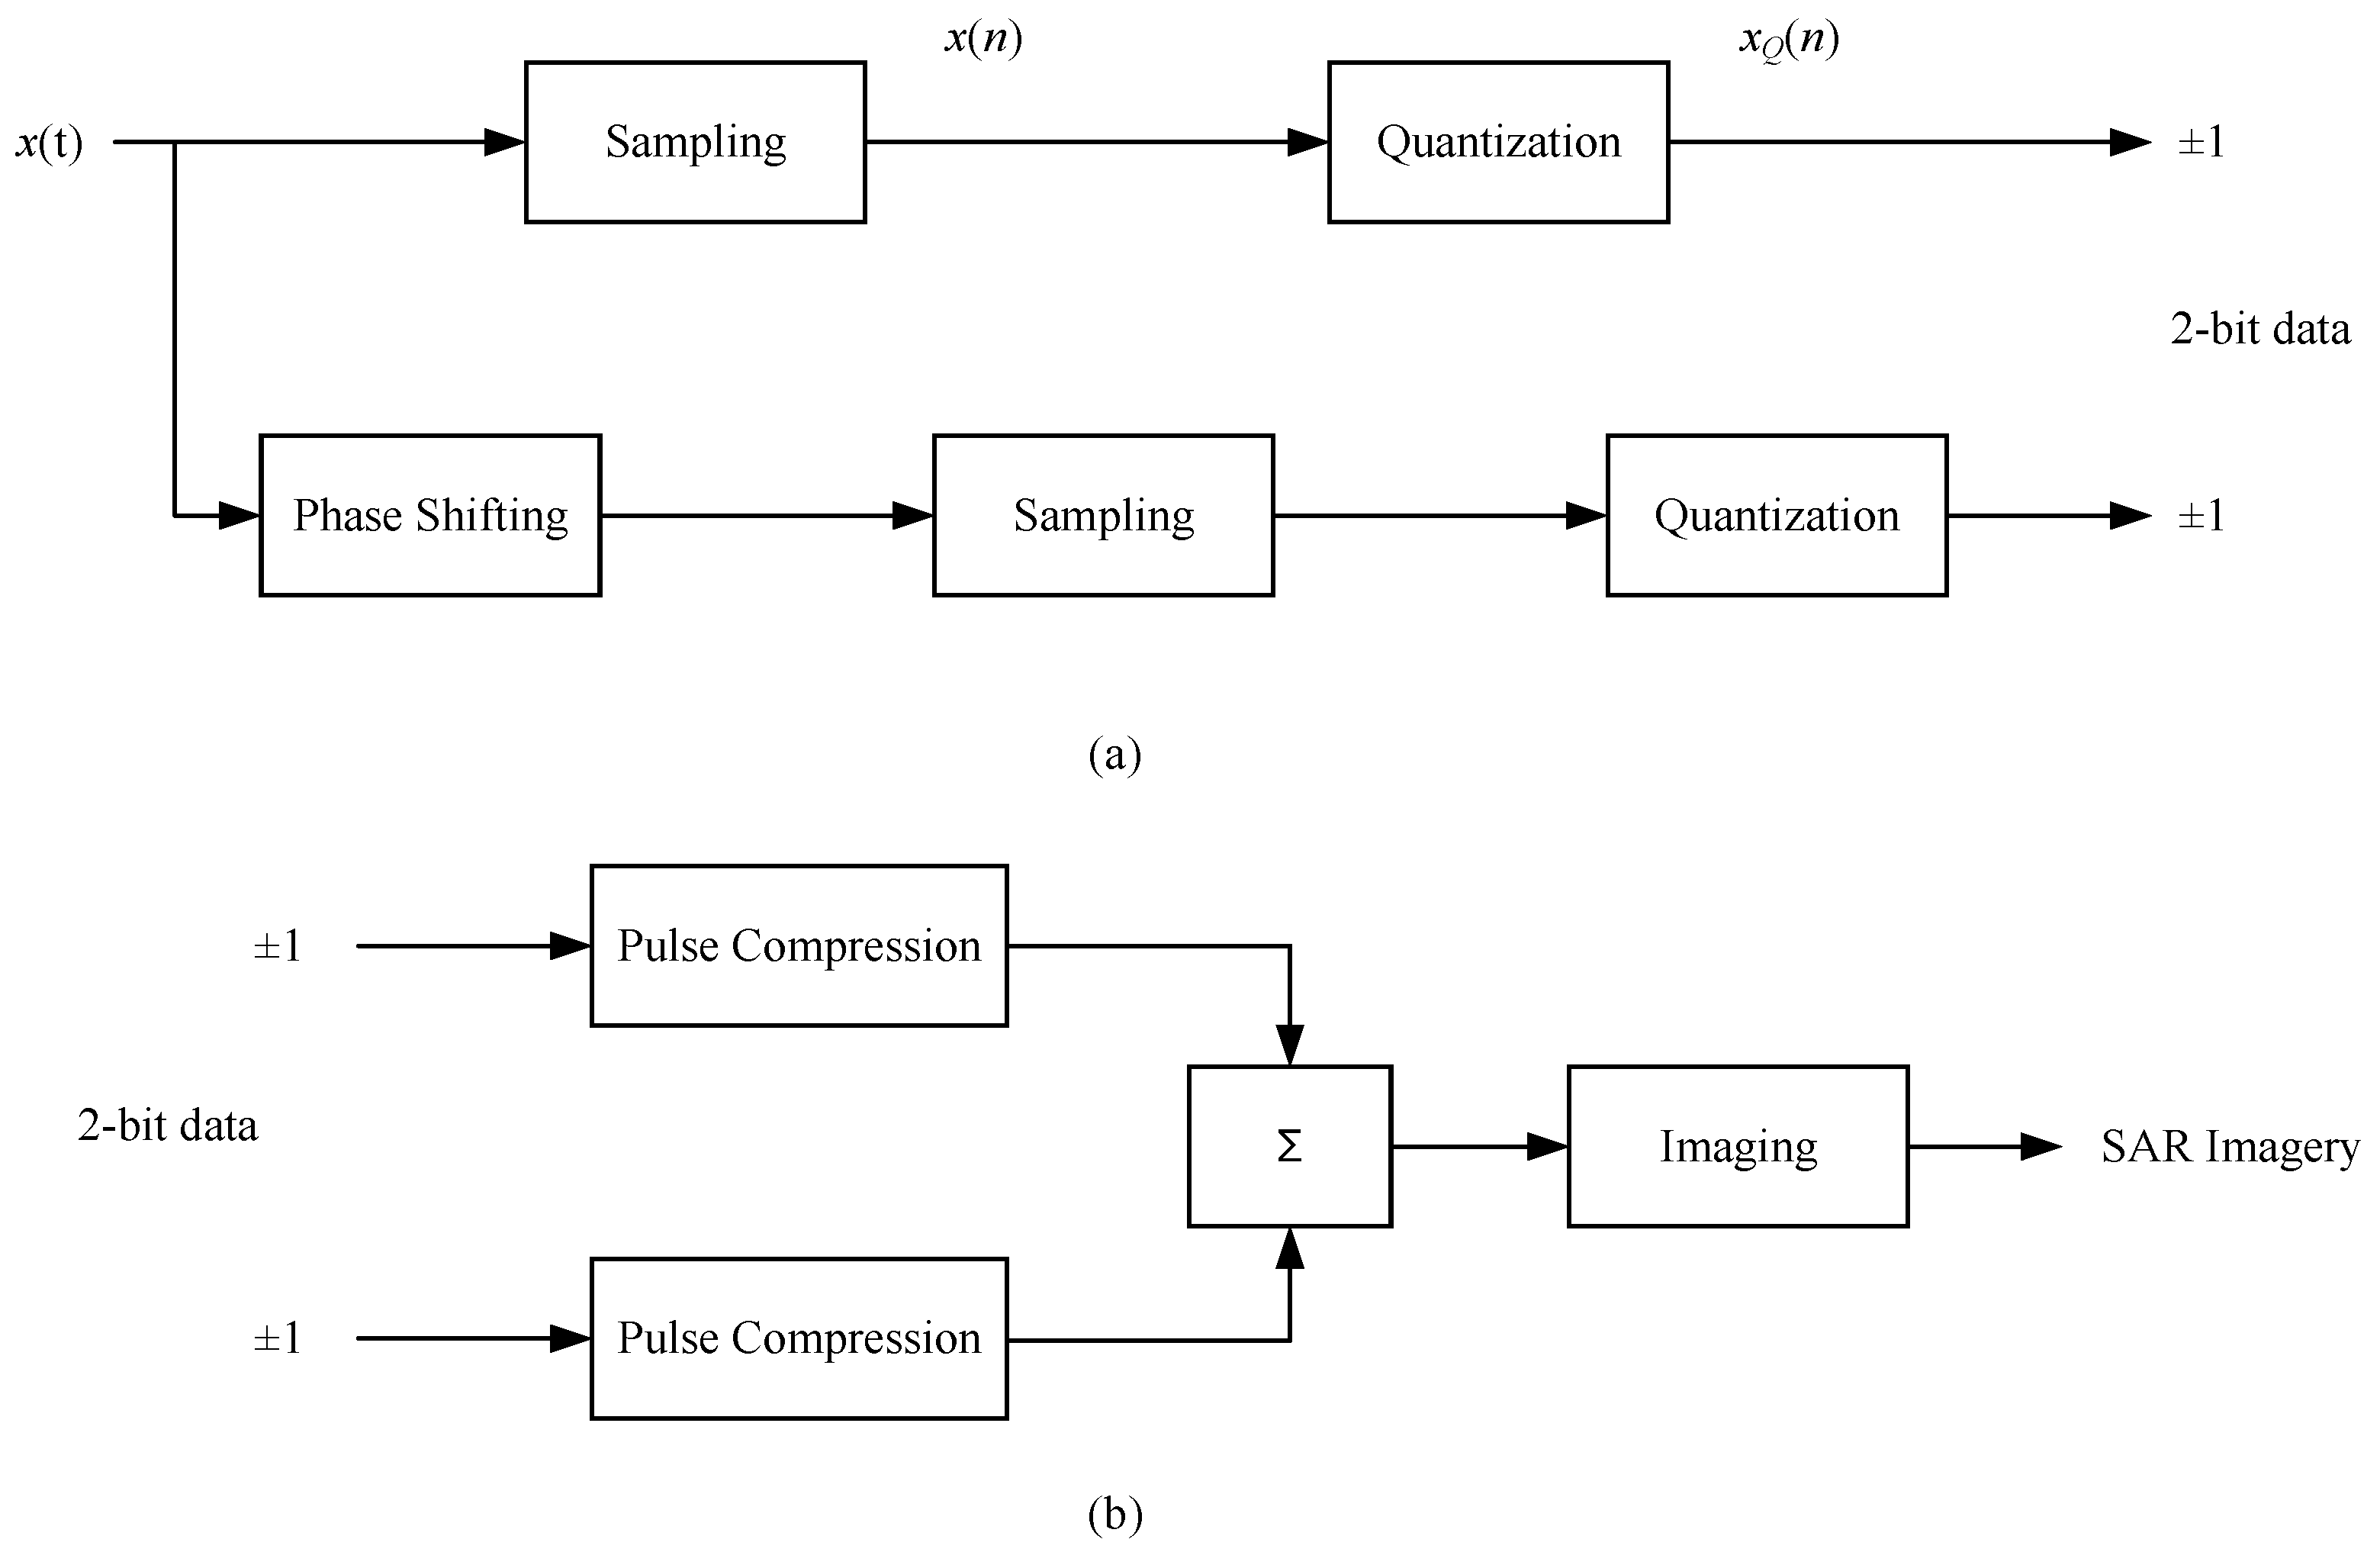
In this section, a lightweight two-bit strategy is proposed to suppress the harmonics to ensure the SAR imagery quality. The block diagrams of the proposed two-bit strategy, including two-bit data acquisition and two-bit imaging, are depicted in Figure 1.
In the procedure of two-bit data acquisition, aside from the one-bit datum acquired with the common procedure, another one-bit datum is obtained with a phase shift on the original signal.
In the procedure of two-bit imaging, the two-bit signal is first separately processed with pulse compression. Then, the results are summed up to achieve the SAR imagery. Note that the advantage of this architecture will be analyzed in Section 3.4.
The key to this proposed two-bit imaging strategy lies in how the amount of phase shift is designed. The aim is to retain the original frequency component and suppress the harmful harmonics. In the following, two examples of the suppression of the 3rd harmonic and the 5th harmonic are introduced. Then, the optimal designation is illustrated.

3.1. Third-Harmonic Suppression

According to the analysis in Section 2, when a signal with the form A exp ( j ( 2 π f t + ψ ) ) is processed with one-bit quantization, the nonlinear effect of the quantization will generate harmonics, which are listed as
A 2 m 1 exp j ( 1 ) m 1 ( 2 m 1 ) ( 2 π f t + ψ ) .
Among them, the third-order harmonic is
A 3 exp j ( 2 π · 3 f t + 3 ψ ) .
When the phase of the signal is shifted with θ , the signal will become A exp j ( 2 π f t + ψ + θ ) . After the one-bit quantization processing, the harmonics will be
A 2 m 1 exp j ( 1 ) m 1 ( 2 m 1 ) ( 2 π f t + ψ + θ ) .
If θ is set to π / 3 , the third-order harmonic component can be derived as
A 3 exp j ( 2 π · 3 f t + 3 ψ + 3 θ ) = A 3 exp j ( 2 π · 3 f t + 3 ψ + π ) = A 3 exp j ( 2 π · 3 f t + 3 ψ ) ,
which has exactly the same expression as that of the third-order component in (18), but with an opposite sign. This is very meaningful because, after the imaging process, the false targets resulting from the two third-order harmonic components will have opposite signs. After the sum-up operation in Figure 1b, the two false targets resulting from the two one-bit quantization operations will be canceled in the SAR imagery.
At the same time, it is worth noting that, when θ is set to π / 3 , the false targets resulting from the 9th, 15th, and other 3 ( 2 m 1 ) -th order harmonic components will also have the same expressions but opposite signs with respect to the corresponding counterparts resulting from the other block of one-bit data. In the final imaging result, these false targets will be simultaneously suppressed.

3.2. Fifth-Harmonic Suppression

According to (17), when the signal is processed with one-bit quantization, the fifth-order harmonic resulting from the nonlinear effect of quantization is
A 5 exp j ( 2 π · 5 f t + 5 ψ ) .
Similarly to Section 3.1, if θ is set to π / 5 , the fifth-order harmonic component in (19) can be derived as
A 5 exp j ( 2 π · 5 f t + 5 ψ + 5 θ ) = A 5 exp j ( 2 π · 5 f t + 5 ψ + π ) = A 5 exp j ( 2 π · 5 f t + 5 ψ ) ,
which has the same expression as that of the fifth-order component in (21), but with the opposite sign. After the sum-up operation in Figure 1b, the two false targets will be canceled in the SAR imagery. This feature can be used to suppress the false targets resulting from the 5th, 15th, 25th, and other 5 ( 2 m 1 ) -th order harmonic components.

3.3. Shifting Phase Designation Analysis

In this subsection, a more general shifting phase θ is analyzed to reveal how the false targets resulting from harmonics can be suppressed. The k-th order harmonic in the proposed two-bit strategy can be expressed as
A k exp j k ( 2 π f + ψ ) + A k exp j k ( 2 π f + ψ + θ ) = A k exp j k ( 2 π f + ψ ) 1 + exp ( j k θ ) = α k A k exp j k ( 2 π f + ψ ) ,
where α k = 1 + exp ( j k θ ) . The value of | α k | can be treated as the harmonic suppression coefficient of the k-th order harmonic, which is derived as
| α k | = 2 1 + cos ( k θ ) .
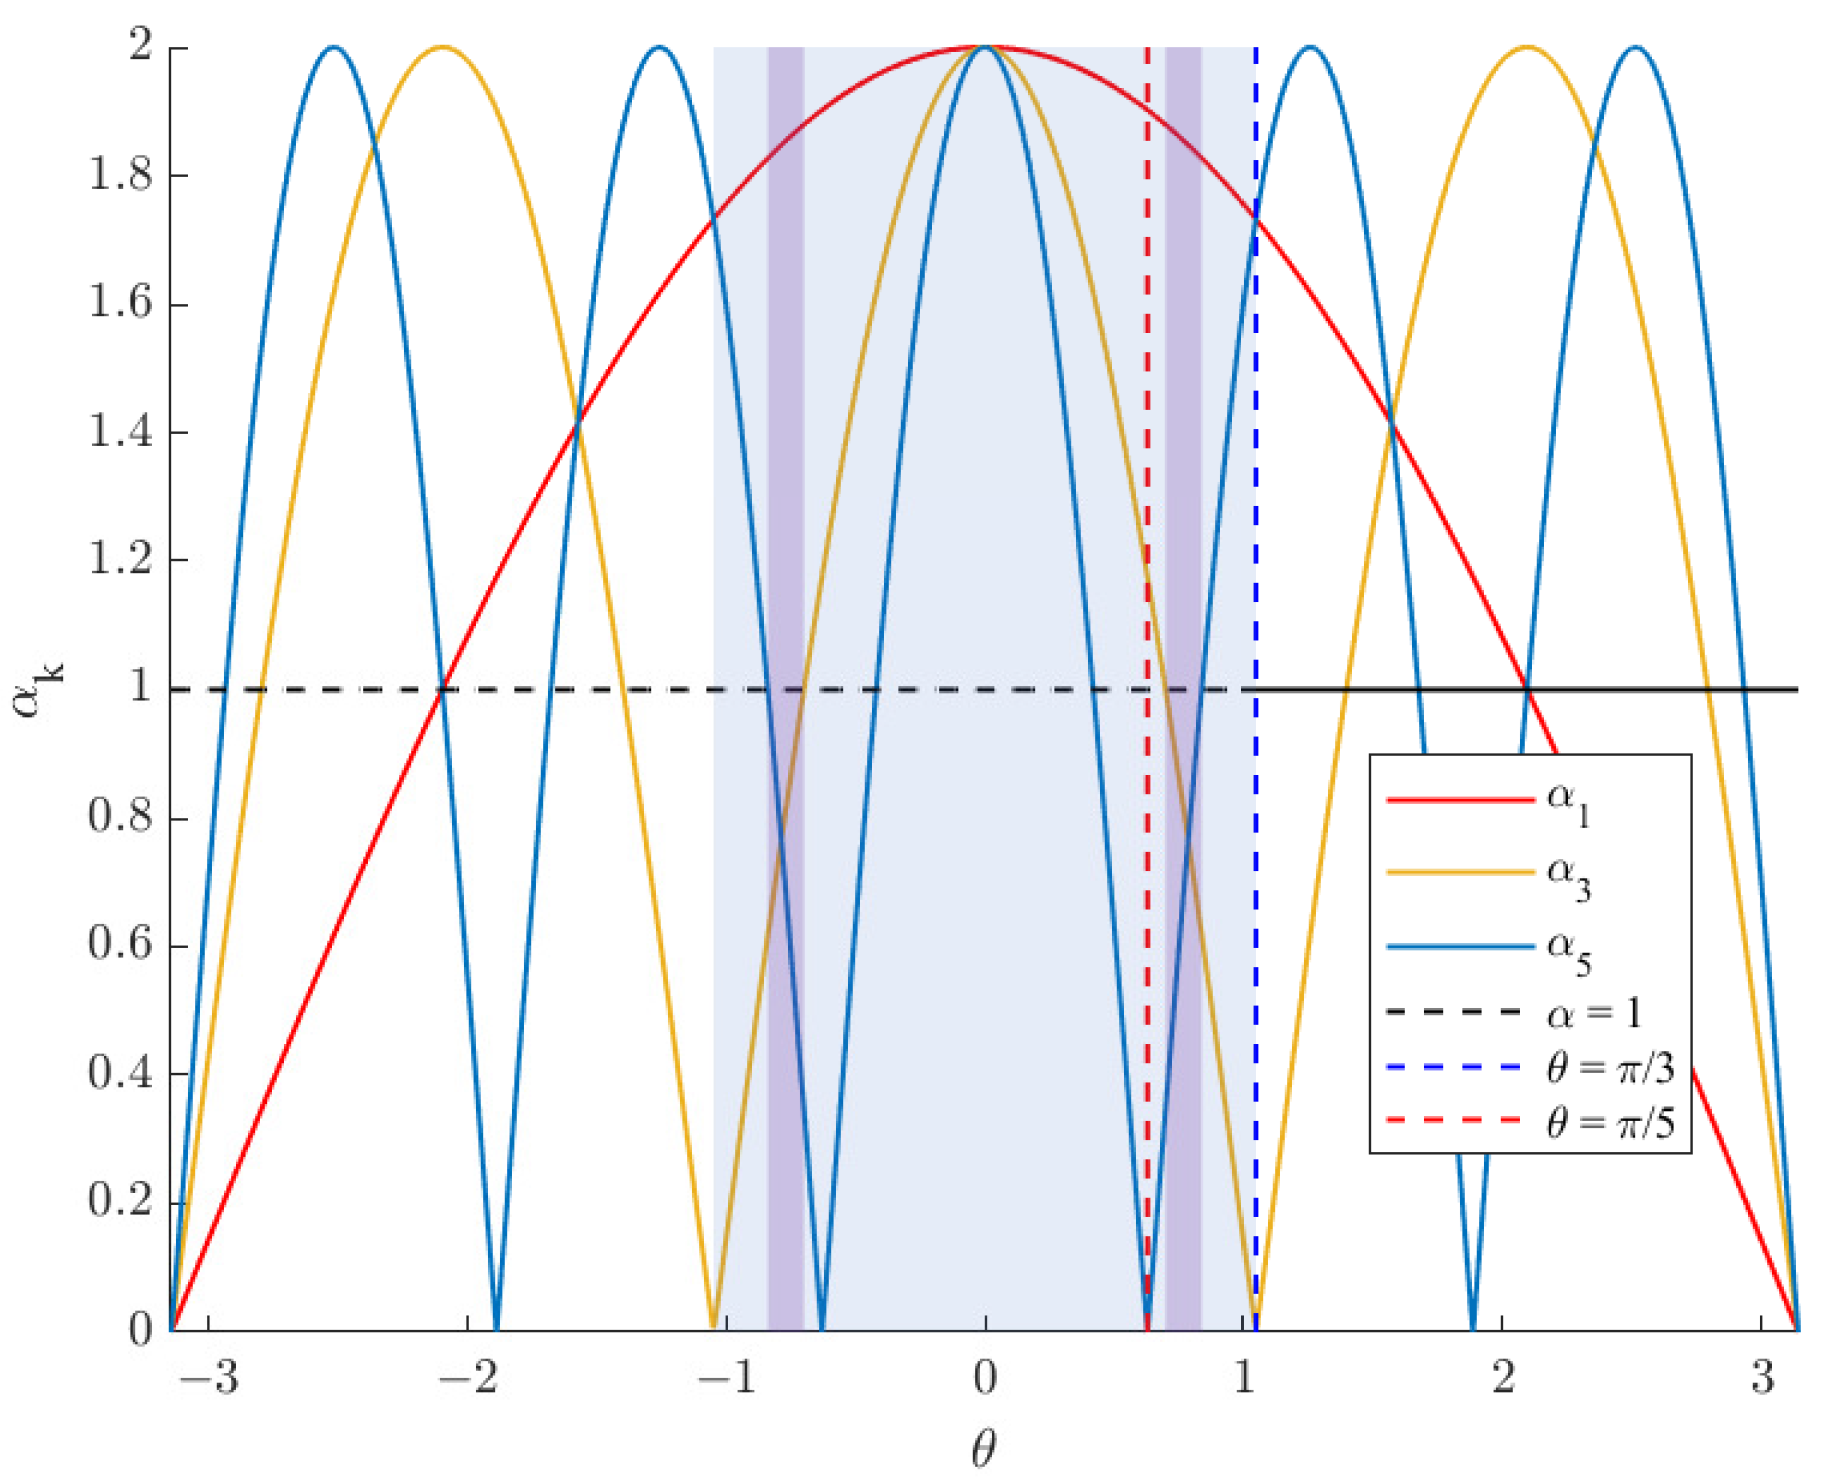
The smaller the coefficient is, the better the false target suppression effect will be. Therefore, small | α k | s are preferred for the harmonic component, while a large | α 1 | is preferred for the original frequency component. To further illustrate the impact of the introduced strategy, the harmonic suppression coefficients of the first- (original), third-, and fifth-order harmonic components are plotted in Figure 2. It is indicated that, in the light-blue region, the harmonic suppression coefficient of the first-order harmonic is larger than the coefficients of the third-order and fifth-order harmonics. θ lies between π / 3 and π / 3 . This means that when θ is selected from this region, the SNR will be improved. One can note that | α 3 | and | α 5 | will decrease to 0 when θ is set to π / 3 or π / 5 , respectively, which means that the false targets resulting from the third- and fifth-order harmonics will be totally eliminated. This is in line with the previous analysis in this section. Furthermore, when θ [ 4 π / 15 , 2 π / 9 ] [ 2 π / 9 , 4 π / 15 ] , the harmonic suppression coefficients of the third-order and fifth-order harmonics will decrease below 1, while that of the original frequency component will stay greater than 1. Under this circumstance, the harmful harmonics are suppressed. Meanwhile, the useful component is enhanced.

3.4. Complexity Analysis

To reveal the advantage of the proposed two-bit imaging strategy in system simplification, in this subsection, the computational complexity is analyzed and compared with that of the conventional two-bit approach.
In the conventional method, after echo data sampling and quantization, pulse compression is implemented directly on the acquired raw data to attain the profile of the targets. By contrast, as is depicted in Figure 1b, in the procedure of the proposed two-bit imaging, the two-bit signal is firstly separately processed with pulse compression. Then, the results are summed up to attain the SAR imagery. This difference will dramatically reduce the cost of hardware deployment.
During a pulse of width T r , the number of samples can be expressed as
N s = O s B r T r ,
where O s is the oversampling rate.
Taking the process of matched filtering as an example, pulse compression can be performed by convoluting the N s pairs of samples in the time domain. In convolution, multiplications are performed between each pair of samples; then, the products are accumulated to achieve the output value of the convolution operation. In an SAR system, the echo data are usually acquired through quadrature sampling of the echo signal. Under this circumstance, multiplication and addition operations are both performed on complex-valued data. Thus, four multipliers and two adders are required in the multiplication operations, and two adders are required in the addition operations. In this way, 4 N s multipliers and 4 N s 2 adders are involved in a convolution operation.
To quantitatively implement the comparison, the complexity can be described according to the necessary transistor number [30,31,32,33]. When an eight-bit reference signal is employed in pulse compression, for the conventional two-bit method, the multiplication between each pair of samples will take 52 transistors [25,31]. After multiplication, eight-bit product data are retained. Then, these products are accumulated to get the result of convolution. As stated in [33], an eight-bit adder usually takes 10 transistors in a hardware implementation. Therefore, the number of transistors required in the pulse compression of the traditional method can be derived as follows:
N t r a = 4 N s × 52 + ( 4 N s 2 ) × 10 = 248 N s 20 .
Unlike in the traditional method, in the proposed strategy, pulse compression is performed with each respective bit, and then the imaging result is achieved by adding them up. In this way, the advantage of the high efficiency of calculation with one-bit data is absorbed into the proposed two-bit strategy. For one-bit data, when multiplied with an eight-bit datum, the multiplier can be simplified into an exclusive OR (XOR) logical gate, which can be realized in hardware with only two transistors [30]. Hence, the number of transistors required in the pulse compression of the proposed method can be derived as follows:
N p r o = 4 N s × 2 + ( 4 N s 2 ) × 10 × 2 + 10 = 96 N s 30 .
Contradistinguishing the result in (27) with that in (26), it is intuitive that, compared to the traditional approach, the proposed two-bit strategy will save more than half of the hardware resources in imaging system deployment.

3.5. Phase-Shifting Error Analysis

In the process of phase shifting, there may exist some phase-shifting errors, which will affect the harmonic suppression effect. Therefore, the bounds of this error are analyzed here.
When aiming at the suppression of the nonlinear effect in quantization, the amplitudes of harmonics should be weakened, or the amplitude of the original component should be enhanced. According to (24) in Section 3.3, the coefficient of the original component is | α 1 | = 2 1 + cos θ , and the coefficient of the k-th order harmonic is | α k | = 2 1 + cos ( k θ ) . Then, the following requirement should be satisfied.
| α 1 | > | α k | .
When a small phase-shifting error Δ θ exists, (28) will become
2 1 + cos ( θ + Δ θ ) > 2 1 + cos [ k ( θ + Δ θ ) ] .
After some algebraic simplification manipulations,
cos ( θ + Δ θ ) cos [ k ( θ + Δ θ ) ] > 0 .
Based on the triangle transform, the left-hand side of (30) can be transformed into
cos θ cos ( Δ θ ) sin θ sin ( Δ θ )   [ cos ( k θ ) cos ( k Δ θ ) sin ( k θ ) sin ( k Δ θ ) ] .
Considering that Δ θ has a small value, the above expression can be manipulated as follows:
cos θ sin θ Δ θ [ cos ( k θ ) sin ( k θ ) k Δ θ ] .
Then, combined with (28), the requirement of the phase-shifting error can be derived as
| Δ θ | < cos θ cos ( k θ ) sin θ k sin ( k θ ) .
This means that, in order to suppress the k-th order harmonic, the phase-shifting error should be restricted to (33).

4. Experimental Results and Analysis

To verify the previous analysis, in this section, simulations based on an airborne SAR are performed to validate the effectiveness of the proposed lightweight SAR imaging method. The working mode of the SAR system employed here was assumed to be the side-looking strip-map mode. The specific values of the working parameters are shown in Table 1.
In what follows, the results with the dechirping and matched filter methods are depicted to intuitively show the effects of harmonics resulting from low-bit quantization and the superiority of the proposed two-bit strategy. Finally, imaging examples based on a real SAR scene are illustrated to show the quality of the proposed method.

4.1. Pulse Compression with Dechirping

When the dechirping method is adopted in the imaging process, the received echo is first multiplied with a reference signal in the analog domain and then quantized into a digital signal; after that, the profile is attained with a Fourier transformation. In this case, the profile corresponds to the frequency spectrum of the signal after dechirping. Figure 3 illustrates the range profiles of a point target located at 10 km with a high oversampling rate, which was set to 20 to let the high frequency be distributed without folding into the low frequency band. The result shown in Figure 3a was achieved with high-precision data. The high-precision quantization gathered the signal with few quantization errors. Therefore, there is no false target in Figure 3a. Its result is considered a benchmark for reference. However, when the signal was quantized into one-bit data, it would generate many harmonics, which would lead to false targets and ground noise. This is intuitively demonstrated in Figure 3b. Compared to the result in Figure 3a, aside from the true target, several false targets popped out in the profile, which were harmful. This was because the nonlinearity of the one-bit ADC generated harmonics, which were directly presented by the following Fourier transformation. In contrast, with the help of the proposed two-bit strategy, by setting θ to π / 3 , the false target located at –30 km, which is indicated by the red circle in Figure 3b,c, was suppressed. This is consistent with the previous analysis in Section 3.1. It reveals that the proposed two-bit imaging strategy is effective in suppressing the false targets resulting from the nonlinear effect of low-bit quantization.
Figure 4 illustrates the range profiles of a point target located at 10 km with a low oversampling rate, which was set to 3. The Nyquist sampling theorem shows that the aliasing problem can be avoided only when the sampling frequency is higher than the maximum component frequency or the bandwidth of the signal being sampled. According to the analysis in Section 2, there is little quantization noise with high precision. Hence, high-precision data are not sensitive to the sampling rate because there are few harmonics resulting from quantization. Therefore, the result in Figure 4a is similar to the result in Figure 3a. However, when the signal is quantized into low-bit data, the nonlinear effect of the quantizer will lead to harmonics. Their frequencies are higher than the frequency of the original signal. Hence, their Nyquist frequencies are higher than that of the original signal. Therefore, when the sampling frequency is higher than the Nyquist frequency of the original signal, but not high enough with respect to the frequencies of the harmonics, spectrum aliasing will happen. In this case, the spectrum of the harmonics will fold into the band of the original signal. Under the circumstance of a high sampling rate, the harmonics can be suppressed with a low-pass filter. However, under the circumstance of a low sampling rate, the spectrum of the harmonics is aliased with the original frequency component. In this case, it is impossible to solve this problem with a filtering method. Figure 4b illustrates the range profile of the point target with one-bit quantization. Differently from the result in Figure 3b, the false targets surround the true target. A low-pass filter is not effective any longer. By comparison, the false target indicated by the red circle disappears in Figure 4c, which means that the proposed two-bit approach has the ability to effectively eliminate the harmonics at a low sampling rate. This can make sense in practical applications.
In conventional low-bit methods, a high sampling rate is necessary to spread the spectrum over a wide band to alleviate the harmful effects of harmonics. However, this will inevitably lead to a large amount of data, which will certainly aggravate the burden in data acquisition, storage, transfer, and processing. Unlike in the conventional methods, in the proposed method, the lack of necessity of a high sampling rate will not only ease the burden of the ADC in sampling, but will also dramatically decrease the amount of data.

4.2. Pulse Compression with a Matched Filter

When a matched filter is employed in an SAR system, the received echo is first converted into a digital signal with an ADC and then match filtered with the reference signal in the digital domain. In an SAR system, in order to obtain a high resolution in the range domain, a wide-bandwidth LFM signal is usually adopted in the transmitter. Unlike a single-frequency signal, a wideband signal is typically distributed in a wider region of the frequency domain. When echoes are processed with one-bit quantization, because of the nonlinear effect, they will generate harmonics, and they will be distributed much more widely than the original region. Figure 5 illustrates the spectrum of an LFM signal with a high sampling rate. The result with high-precision quantized data is shown in Figure 5a as a benchmark. The result with one-bit quantized data is depicted in Figure 5b. With the help of the high sampling rate, the harmonics generated at lower orders did not fold into the low-frequency band. Therefore, some strong false components are clearly presented in Figure 5b. Meanwhile, it is shown that the sizes of the false frequency components were larger than that of the original component. By comparison, in Figure 5c, the result with the proposed two-bit strategy is different. The strongest false component indicated in the red circle disappeared, which resulted from the third-order harmonic. At the same time, the false components circled in the yellow circle disappeared too, which was due to the ninth-order harmonic. In addition, the amplitude of the ground noise was obviously degraded.
In an SAR system, the signals in the fast time dimension and slow time dimension are both LFM signals with a wide bandwidth. Their spectrum is distributed in a wide region in both dimensions. When quantized into one-bit data, harmonics will be generated in both dimensions. Figure 6 and Figure 7 show the two-dimensional and three-dimensional spectra of a wideband signal, respectively. The original true frequency component and the false components resulting from quantization errors are intuitively shown. Compared with Figure 6a and Figure 7a, there are multiple false components in Figure 6b and Figure 7b; their sizes are larger than that of the true component, and their amplitudes are weaker. In SAR imaging, these false components will degrade the imagery quality. By contrast, the false components in Figure 6c and Figure 7c are obviously suppressed. Not only did the false component resulting from the 3rd harmonic indicated by the red circle disappear in the spectrum, but the false components resulting from higher harmonics, which are indicated by yellow circles, were also suppressed.
At a low sampling rate, the harmonics resulting from the nonlinearity of the ADC will be aliased with the original frequency component. This will lead to a more complicated frequency spectrum, which, in turn, results in intricate SAR imagery. Figure 8 illustrates the spectrum of a wideband signal with a low sampling rate. The result with high-precision quantized data is shown in Figure 8a as a benchmark. The result with one-bit quantized data is depicted in Figure 8b. Unlike in the result in Figure 5b, the false components overlap with the true component. As a result, it is not easy to recognize the original component anymore, and the ground noise becomes very high. By comparison, in Figure 8c, the result with the proposed two-bit strategy is different. The amplitude of the ground noise is obviously degraded. This reveals that the proposed two-bit quantization strategy is effective at a low sampling rate.
Figure 9 and Figure 10 show the two-dimensional spectrum and the three-dimensional spectrum of a wideband signal with a low sampling rate, respectively. The original true frequency component and the false components resulting from quantization errors are intuitively shown. Compared with Figure 9a and Figure 10a, there are multiple false components in Figure 9b and Figure 10b, and their sizes are larger than that of the original true component, with weaker amplitudes. Meanwhile, differently from the results in Figure 6b and Figure 7b, the true component is surrounded and overlapped by false components, making it hard to distinguish. By contrast, the false components in Figure 9c and Figure 10c are obviously suppressed. Hence, the true frequency component becomes visible.
In order to further analyze the performance, a single scatterer was simulated, and its imaging quality indexes, such as its peak sidelobe ratio (PSLR), integrated sidelobe ratio (ISLR), and impulse response width (IRW), were evaluated. After processing different quantized signals with an accurately matched filter, the corresponding range profiles are depicted in Figure 11, including the conventional uniform quantization with 16-bit (UQ-16bit) and 2-bit (UQ-2bit) single-frequency threshold quantization [24] with the 2-bit method (SFTQ-2bit) and the proposed method. When the signal was quantized into 16-bit data, it was accurate enough and had few quantization errors. Therefore, the performance was not subtle with respect to the sampling rate. As shown by the red lines in Figure 11a–d, the range profiles were similar. When the echos were quantized with the low-bit methods, the far sidelobes obviously rose, as shown in Figure 11. The sidelobe quality of all of the schemes improved, as shown in Figure 11a–d, as the sampling rate increased. This is because a higher sampling rate will bring a wider Nyquist band and will avoid the aliasing of the harmonics with the fundamental component. As stated in [24], SFTQ schemes need a high oversampling rate. Hence, in Figure 11a, its far sidelobe was higher than that of other methods, as the green line shows. By contrast, the proposed strategy was able to suppress the harmonics at a low oversampling rate. As a result, the sidelobe of the proposed method was lower than that of the other low-bit methods, which brought out the good performance at a low sampling rate.
The PSLR, ISLR, and IRW were evaluated and are shown in Figure 12. As is demonstrated in Figure 12, the accurate data with a deep quantization depth had the same evaluation indexes. For all of the low-bit schemes, the increased sampling rate improved the performance in PSLR and ISLR, as shown in Figure 12a,b. All of the schemes were able to achieve nearly the same IRW as that of the accurate scheme, except for SFTQ, which had a slight fluctuation. One can notice that, at a low sampling rate, the proposed scheme performed better than the other low-bit schemes.

4.3. Scene Imaging Examples

In this subsection, real SAR scenes are employed to evaluate the performance of the proposed two-bit scheme. To quantitatively evaluate the quality of each experiment, the structural similarity index measure (SSIM) [34] is utilized here, whose value lies from 0 to 1. Note that the more similar the imagery to be evaluated is to the reference imagery, the closer the SSIM value will be to 1. In contrast, a value of 0 indicates that they are totally different. In the following, this index is calculated to evaluate how close the low-bit imaging result is to the accurate SAR imagery used for reference.
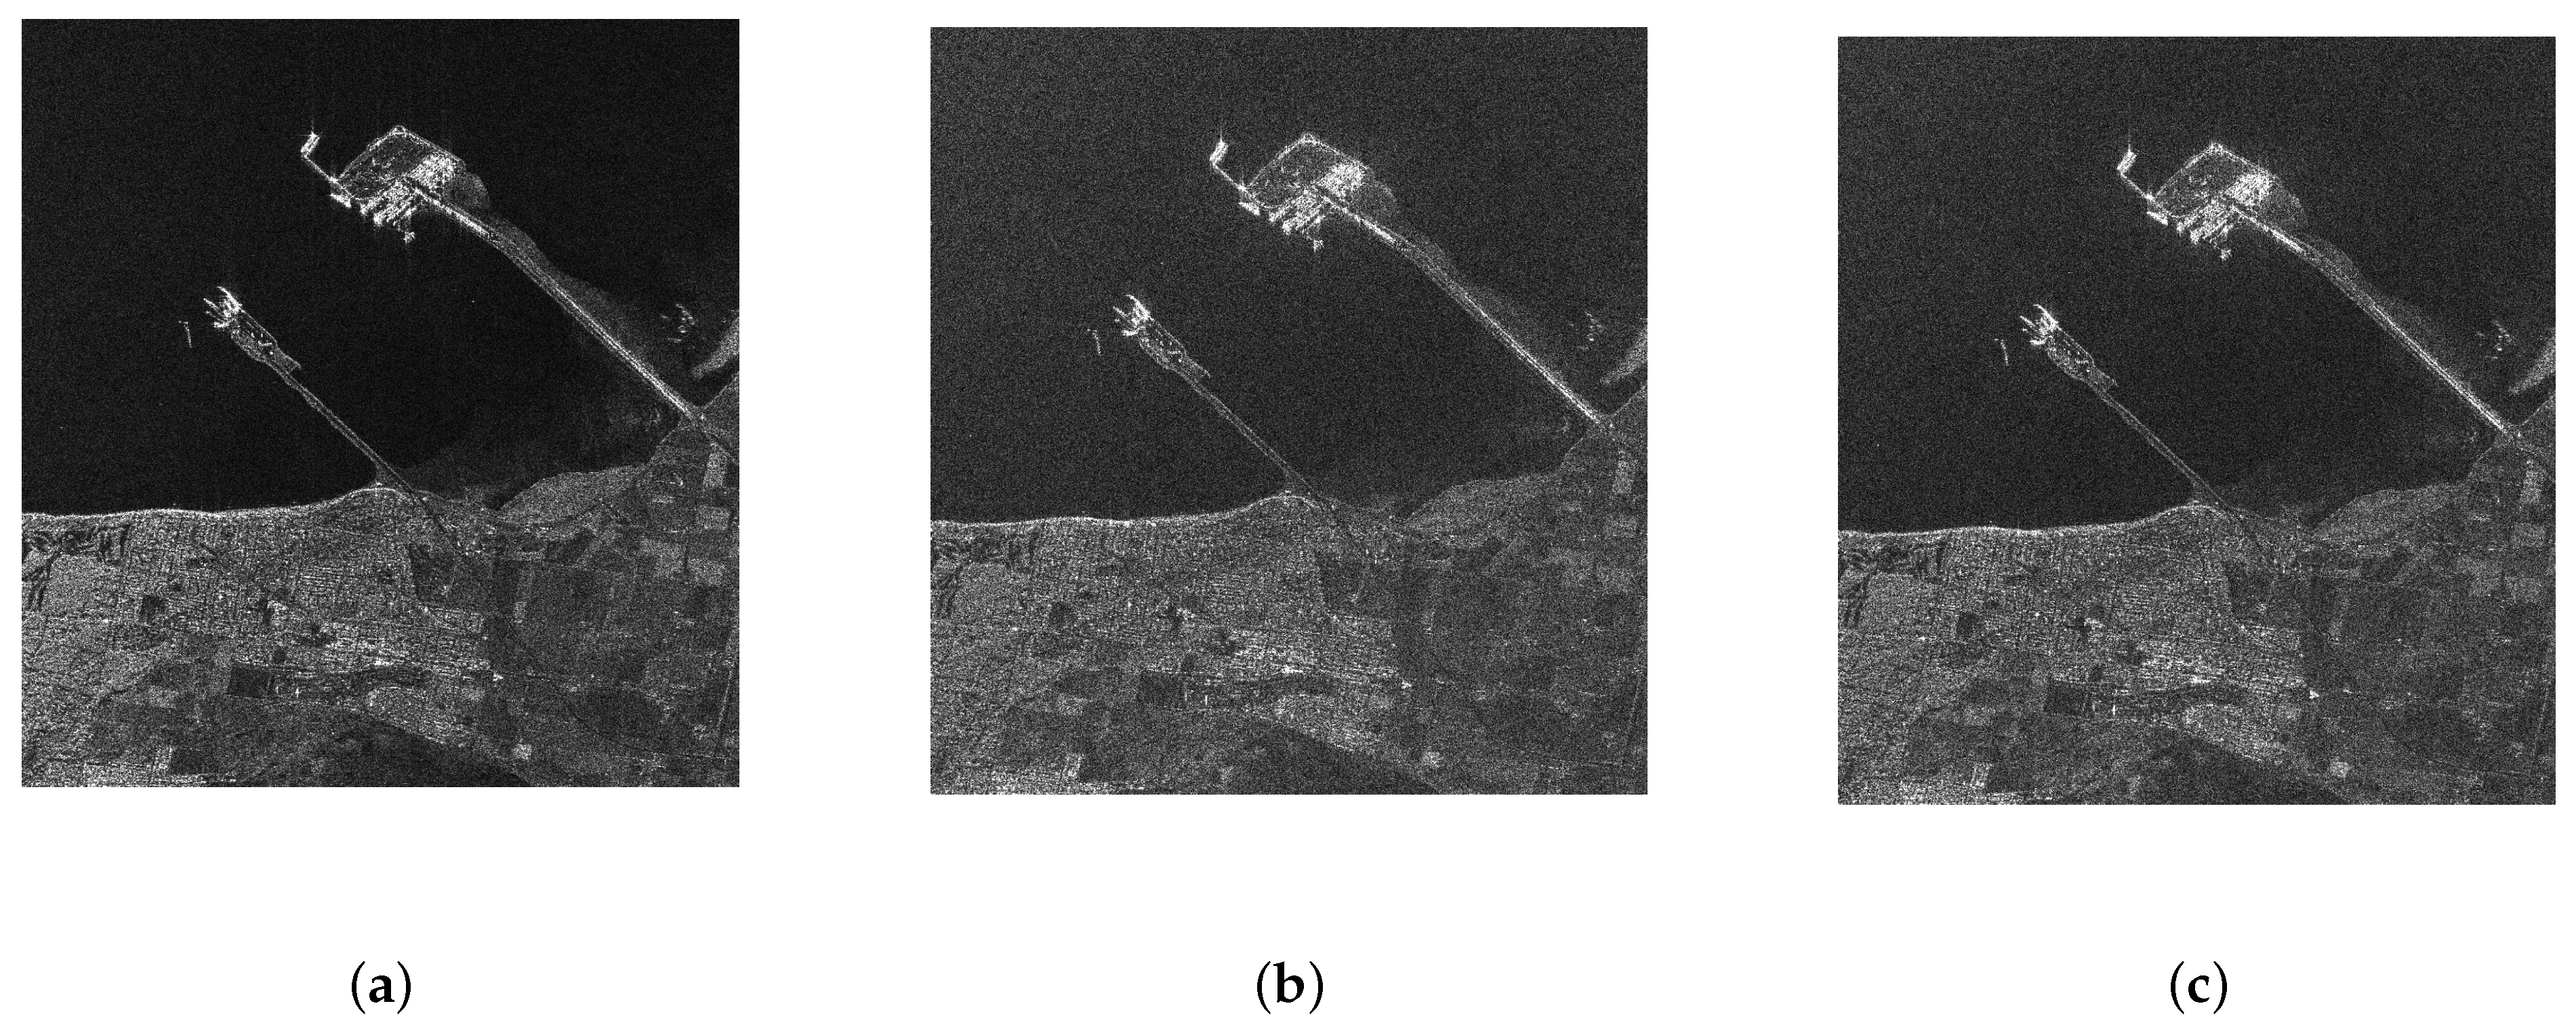
To verify the effectiveness of the proposed method, an experiment on raw RADARSAT-2 data was implemented to show the performance of different methods [35]. The illuminated scene was an area around Delta, British Columbia, Canada. As shown in Figure 13, the result in Figure 13a is clear, with little background noise. However, when the data were quantized into one-bit data, because of the nonlinear effect, much background noise was generated and distributed in the imagery, as shown in Figure 13b. Compared with that, the result in Figure 13c became clearer. This is because, with the implementation of the proposed method, the quantization noise was suppressed to a lower amount. In addition, the SSIMs of the two imageries were calculated to quantitatively evaluate the qualities, which were 0.8231 and 0.9140, respectively. This revealed that the proposed method was able to obtain a better performance.
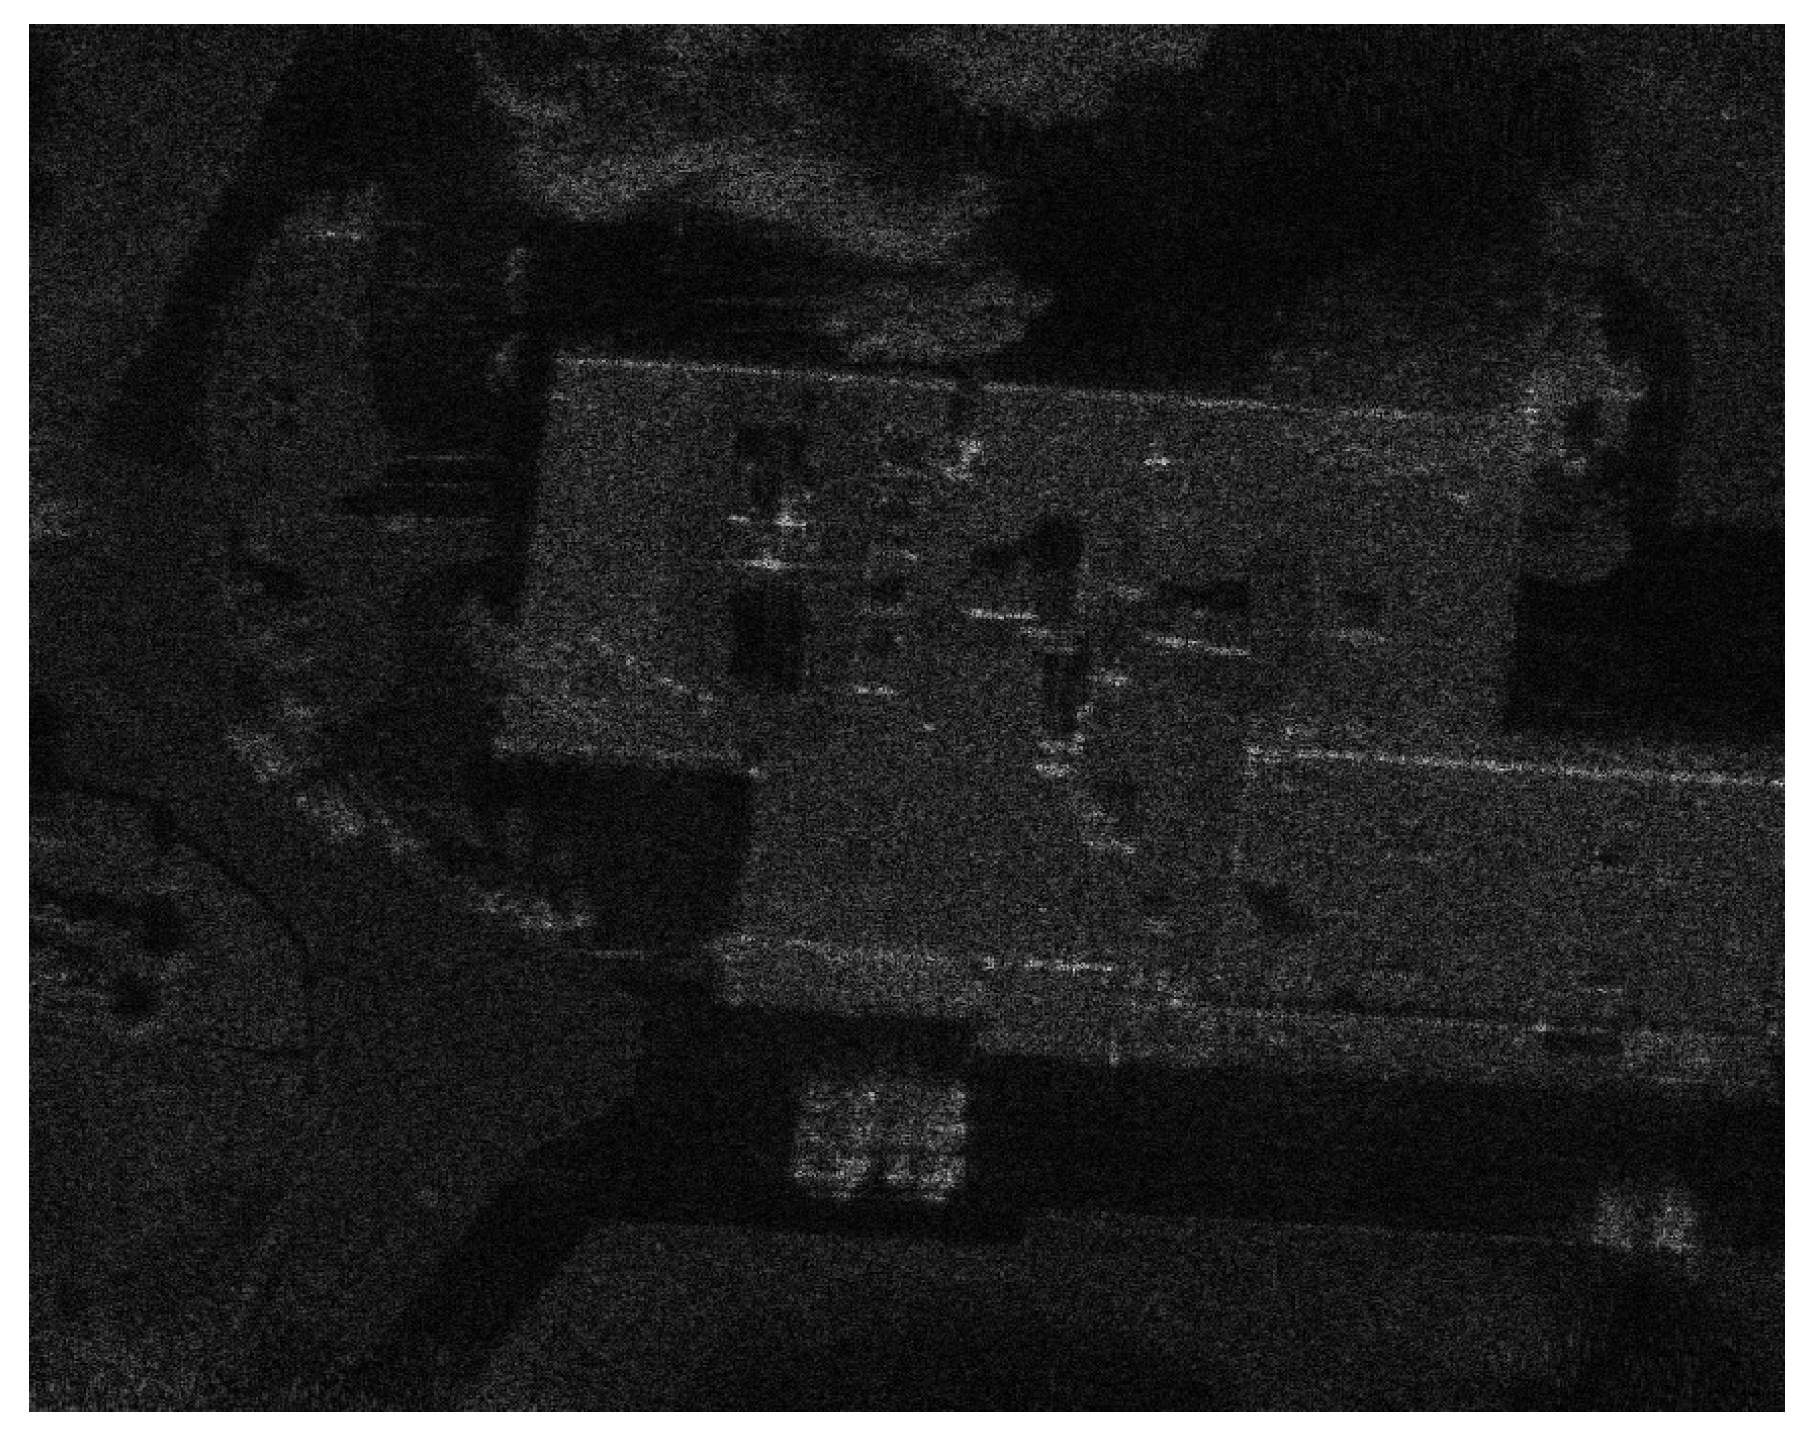
To further evaluate the performance, another dataset acquired by the Sandia-developed miniaturized SAR system was employed [36]. The imagery generated from the accurate sampled data is given in Figure 14, which is depicted as a benchmark. In Figure 15, the imaging results with different quantization schemes are illustrated, with the oversampling rate set to 1.4. The imagery with 16-bit UQ is shown in Figure 15a. It can be seen that the result is nearly the same as that in Figure 14. This is because the bit depth was deep enough. By benefitting from the elaborate quantization interval, the quantization error decreased until it was negligible. By comparison, the imagery with two-bit UQ is depicted in Figure 15b. On account of the coarser quantization interval, the quantization noise became stronger. As a result, the quality of the imagery decreased. Figure 15c illustrates the imaging result with two-bit SFTQ. With the help of the harmonic removal effect, the quantization noise in the imaging frequency band was eliminated. Hence, compared with Figure 15b, there was an improvement in imaging quality. The imaging result based on the devised approach is shown in Figure 15d. Compared to the two previous two-bit quantization results, the quality of the imagery was further improved. In addition to these analyses, to reveal the performance improvements, the corresponding SSIMs are listed in Table 2. The SSIM of the proposed method was the highest. This is consistent with the former analyses and observations.
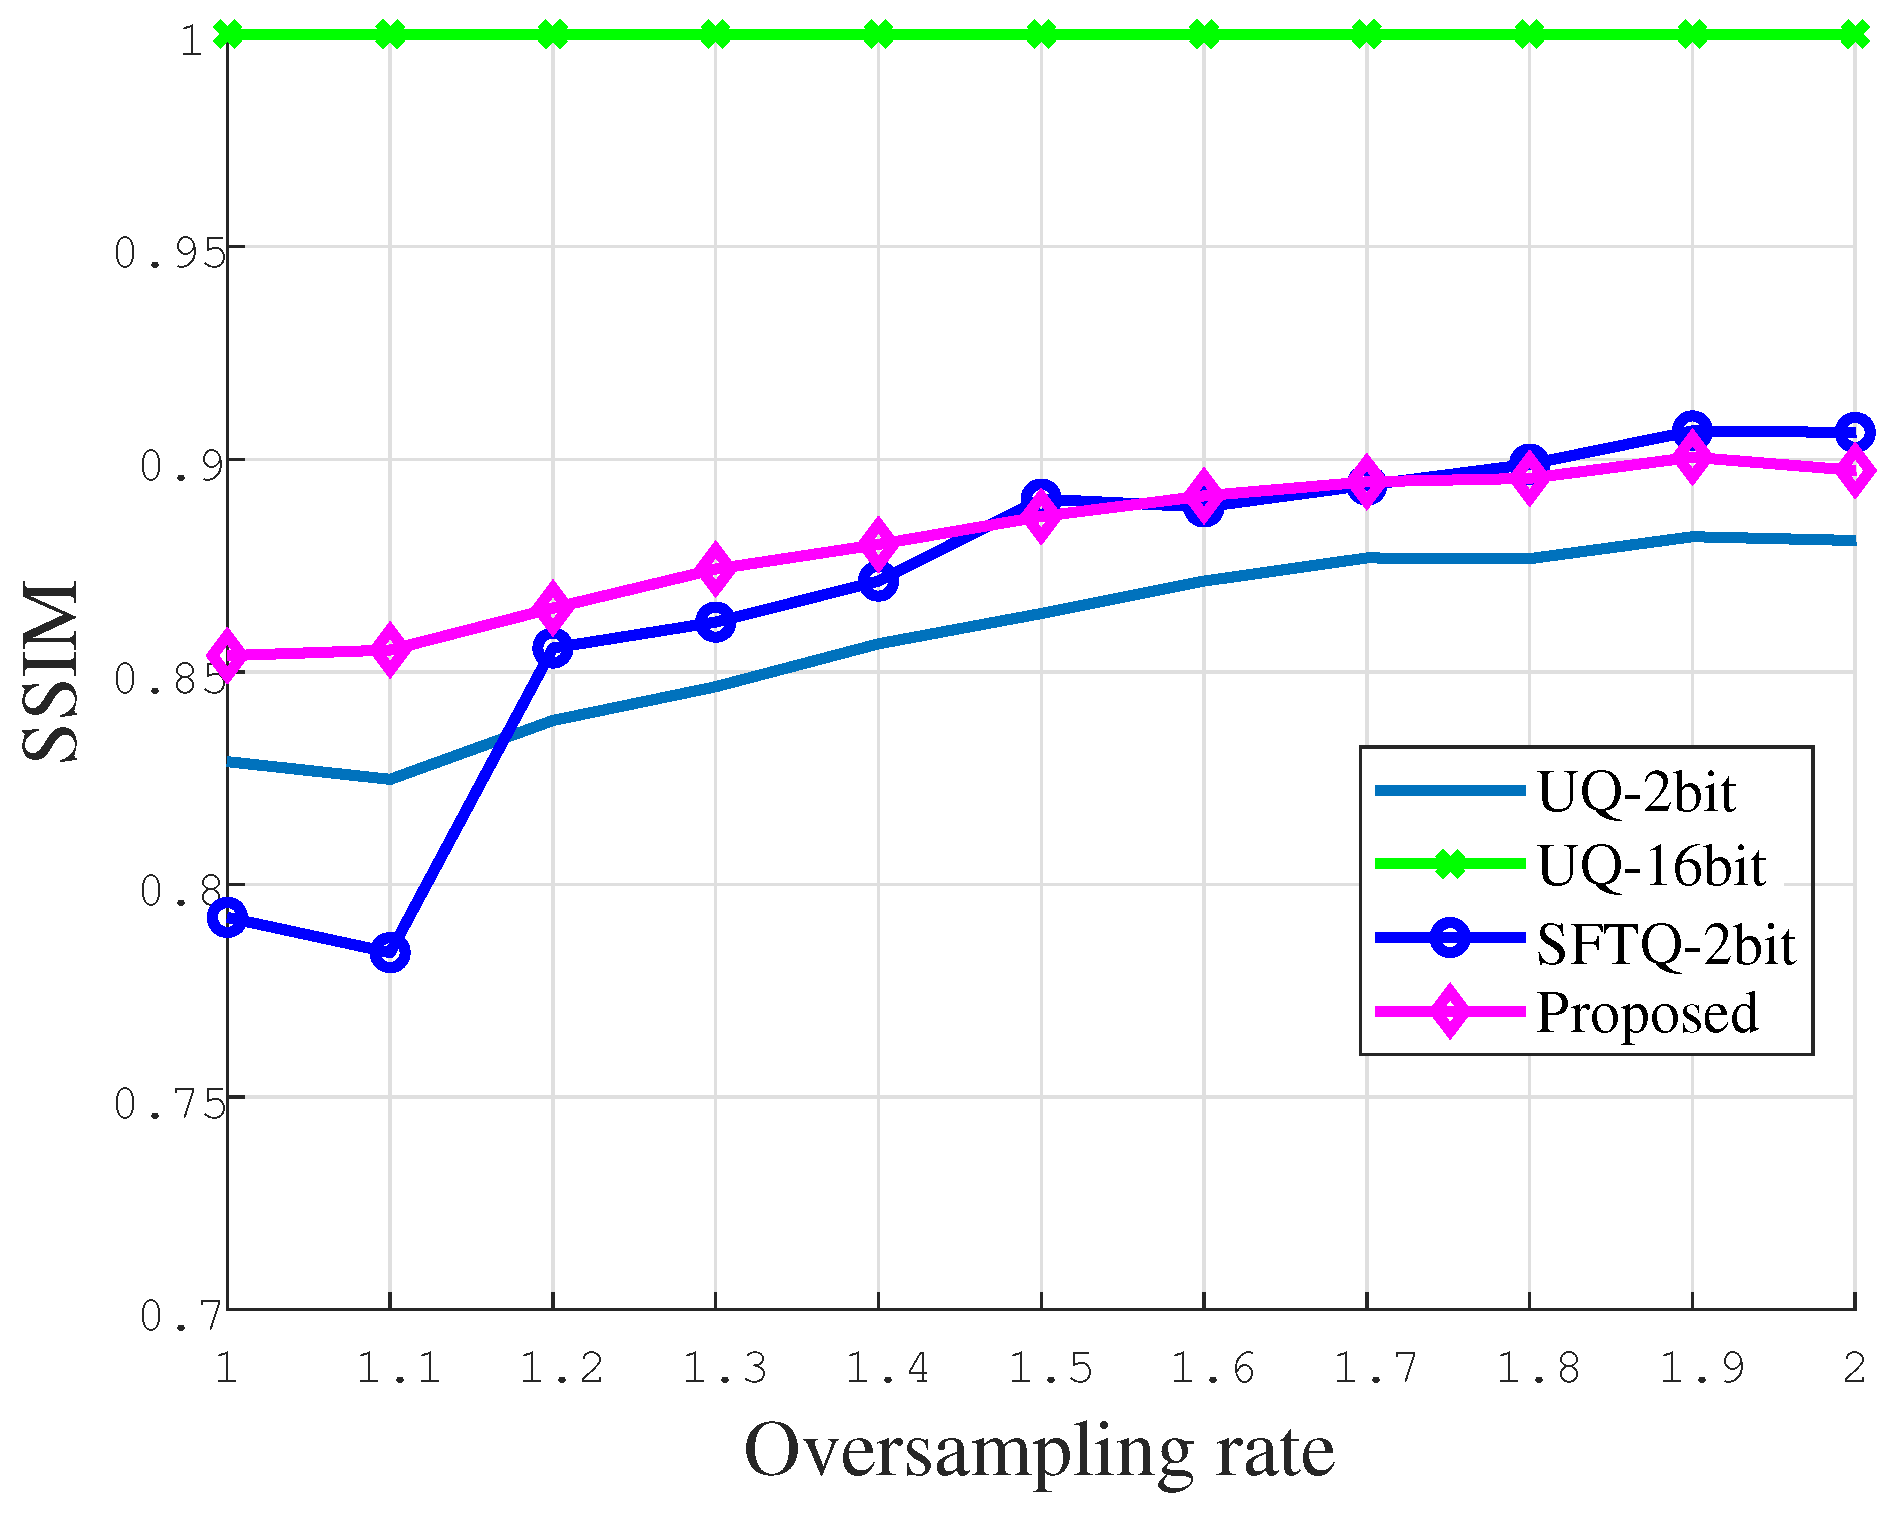
To further evaluate the performance of the different schemes, SSIMs with different oversampling rates were calculated and are depicted in Figure 16. As the oversampling rate increased, all of the imaging qualities were improved. Owing to the low quantization noise under precise quantization, the SSIM based on the 16-bit UQ approached 1. On the contrary, the SSIM curve with two-bit UQ was the lowest under all sampling rate conditions, as shown in Figure 16. The imaging quality based on SFTQ was high under a high sampling rate, but poor when the sampling rate was low. This was because there was not enough space in the frequency band to place the harmful harmonics, which would alias to the band for imaging and reasonably decrease the quality. As stated in [24], this method usually needs an oversampling rate higher than 4. On the contrary, it is worth noting that, based on the proposed two-bit strategy, compared to the other two methods, there was an obvious improvement in the SSIM not only under a high sampling rate, but also under a low sampling rate. For example, when the oversampling rate was set to 1.3, the proposed approach was able to maintain more than 87.5% of the information of the accurate SAR imagery while reducing the amount of data to less than 1/8 of that of the conventional method. This is very meaningful because the low-bit quantization with low-rate sampling dramatically lightens the system’s burden in the whole procedure, including in data acquisition, storage, transmission, and processing.

5. Conclusions

In this paper, a lightweight two-bit SAR strategy was proposed based on one-bit sampling. It uses the advantages of one-bit sampling in terms of simplification, but does not inherit the requirement of a high sampling rate. After carefully selecting the shifting phase, the harmonics generated from the extra introduced bit can be utilized to counteract the harmful harmonics generated from another quantization bit. In this way, the newly introduced nonlinearity is used to suppress the awkward nonlinearity in conventional one-bit schemes. Therefore, the imaging quality of the proposed method is improved. It is worth noting that, under a low sampling rate, the harmonics generated from the two bits will be simultaneously aliased. Hence, the harmonic suppression effect is retained under a low sampling rate. This gives rise to the two-bit lightweight SAR with low-bit and low-rate sampling. Based on this meaningful feature, the amount of data acquired will dramatically decrease, which will benefit the whole process of imaging, including data acquisition, storage, transmission, and processing. Therefore, the proposed lightweight strategy will lighten the system burden and cost, which will eventually facilitate the implementation of SAR imaging in various applications, especially when resources are limited.
Author Contributions

Conceptualization, S.L. and B.L.; methodology, S.L. and B.L.; formal analysis, S.L.; investigation, S.L.; data curation, B.Z.; writing—original draft preparation, S.L.; writing—review and editing, S.L., B.Z., B.L., L.H. and W.B.; All authors have read and agreed to the published version of the manuscript.

Funding

This work was supported in part by the National Natural Science Foundation of China under Grants 61925108, U1913203, U1713217, 61801297, 62171293, U2033213, 61971218, 61801302, 61701528, and 61601304, in part by the Natural Science Funding of Guangdong Province under Grant 2017A030313336, in part by the Guangdong Basic and Applied Basic Research Foundation under Grant 2019A1515110509, in part by Foundation of Shenzhen City under Grants JCYJ20170302142545828, JCYJ20210324095012033, and 20200809153412001, in part by the Shenzhen University under Grants 2019119 and 2016057, in part by the Natural Science Foundation of Sichuan under Grant 2022NSFSC1801, in part by the Fund of State Key Laboratory of Millimeter Waves under Grant K202235, and in part by the Sichuan Science and Technology Program under Grant 2021YFS0319.

Institutional Review Board Statement

Not applicable.

Informed Consent Statement

Not applicable.

Data Availability Statement

The data used to evaluate the proposed scheme can be downloaded at http://www.sandia.gov/radar/imagery/index.html (accessed on 25 December 2022).

Conflicts of Interest

The authors declare no conflict of interest.

Appendix A. Derivation of the Sign Function

The sign function can be defined as
sign ( t ) = 1 , t 0 1 , otherwise .
The above expression is easy to understand, but not so easy to handle in mathematical derivation. To cope with this problem, (A1) can be rewritten in an analytical expression as
sign ( t ) = 2 u ( t ) 1 ,
where u ( t ) is the unit step function, which can be given as
u ( t ) = 1 , t 0 0 , otherwise .
Performing a Fourier transformation on both sides of (A2) leads to
F { sign ( t ) } = F { 2 u ( t ) 1 } = 2 F { u ( t ) } F { 1 } = 2 1 j ω + π δ ( ω ) 2 π δ ( w ) = 2 j ω ,
where F { · } denotes the Fourier transform.
By performing an inverse Fourier transformation on both sides of (A4), the expression of the sign function can be derived as
sign ( t ) = F 1 2 j ω = 1 2 π 2 j ω exp ( j ω t ) d ω = j π exp ( j ω t ) ω d ω ,
where F 1 { · } denotes the inverse Fourier transform.

References

  1. Curlander, J.C.; Mcdonough, R.N. Synthetic Aperture Radar: Systems and Signal Processing; Wiley: Hoboken, NJ, USA, 1991. [Google Scholar]
  2. Kuai, C.; Zhao, B.; Huang, L. Multi-false-target deceptive jamming aganist SAR based on 1-bit quantization. In Proceedings of the IET International Radar Conference (IET IRC 2020), Online, 4–6 November 2020; Institution of Engineering and Technology: London, UK, 2020; pp. 335–339. [Google Scholar]
  3. Akbarpour, A.; Chamaani, S. Ultrawideband Circularly Polarized Antenna for Near-Field SAR Imaging Applications. IEEE Trans. Antennas Propag. 2020, 68, 4218–4228. [Google Scholar] [CrossRef]
  4. Bilik, I.; Longman, O.; Villeval, S.; Tabrikian, J. The Rise of Radar for Autonomous Vehicles: Signal Processing Solutions and Future Research Directions. IEEE Signal Process. Mag. 2019, 36, 20–31. [Google Scholar] [CrossRef]
  5. Gao, X.; Roy, S.; Xing, G. MIMO-SAR: A Hierarchical High-Resolution Imaging Algorithm for mmWave FMCW Radar in Autonomous Driving. IEEE Trans. Veh. Technol. 2021, 70, 7322–7334. [Google Scholar] [CrossRef]
  6. Jiang, C.; Zhang, B.; Fang, J.; Zhe, Z.; Hong, W.; Wu, Y.; Xu, Z. Efficient ℓq regularisation algorithm with range–azimuth decoupled for SAR imaging. Electron. Lett. 2014, 50, 204–205. [Google Scholar] [CrossRef]
  7. Wang, Z.; Liu, F.; Yin, Y.; Li, B.; Guo, Y. Weighted L1-Norm for One-Bit Compressed Sensing Based on Approximated Observation. In Proceedings of the 2020 IEEE MTT-S International Wireless Symposium (IWS), Shanghai, China, 20–23 September 2020; pp. 1–3. [Google Scholar] [CrossRef]
  8. Kang, M.S.; Kim, K.T. Ground Moving Target Imaging Based on Compressive Sensing Framework With Single-Channel SAR. IEEE Sens. J. 2020, 20, 1238–1250. [Google Scholar] [CrossRef]
  9. Li, S.; Mei, S.; Zhang, S.; Wan, S.; Jia, T. A Novel Compressive Sensing-Based Multichannel HRWS SAR Imaging Technique for Moving Targets. IEEE J. Sel. Top. Appl. Earth Obs. Remote Sens. 2021, 14, 690–703. [Google Scholar] [CrossRef]
  10. Hu, X.; Ma, C.; Lu, X.; Yeo, T.S. Compressive Sensing SAR Imaging Algorithm for LFMCW Systems. IEEE Trans. Geosci. Remote Sens. 2021, 59, 8486–8500. [Google Scholar] [CrossRef]
  11. Liu, S.; Li, B.; Zhao, B.; Huang, L.; Wu, Y.; Bao, W. A super resolution target separation and reconstruction approach for single channel SAR against deceptive jamming. Def. Technol. 2021. [Google Scholar] [CrossRef]
  12. Liu, S.; Zhao, B.; Huang, L.; Li, B.; Wu, Y.; Bao, W. Target Reconstruction Against Deceptive Jamming for Single-Channel SAR: An Imagery Domain Approach. IEEE Geosci. Remote Sens. Lett. 2022, 19, 1–5. [Google Scholar] [CrossRef]
  13. Zhao, B.; Huang, L.; Li, J.; Zhang, P. Target Reconstruction From Deceptively Jammed Single-Channel SAR. IEEE Trans. Geosci. Remote Sens. 2018, 56, 152–167. [Google Scholar] [CrossRef]
  14. Zhao, B.; Huang, L.; Sun, W. Target Reconstruction in Deceptively Jammed SAR via ADMM. IEEE Sens. J. 2019, 19, 4331–4339. [Google Scholar] [CrossRef]
  15. Zhao, B.; Huang, L.; Zhang, J. Single Channel SAR Deception Jamming Suppression via Dynamic Aperture Processing. IEEE Sens. J. 2017, 17, 4225–4230. [Google Scholar] [CrossRef]
  16. Tian, T.; Zhou, F.; Li, Y.; Sun, B.; Fan, W.; Gong, C.; Yang, S. Performance Evaluation of Deception Against Synthetic Aperture Radar Based on Multifeature Fusion. IEEE J. Sel. Top. Appl. Earth Obs. Remote Sens. 2021, 14, 103–115. [Google Scholar] [CrossRef]
  17. Zhou, F.; Tian, T.; Zhao, B.; Bai, X.; Fan, W. Deception Against Near-Field Synthetic Aperture Radar Using Networked Jammers. IEEE Trans. Aerosp. Electron. Syst. 2019, 55, 3365–3377. [Google Scholar] [CrossRef]
  18. Liu, S.; Li, B.; Zhao, B.; Huang, L.; Li, Q.; Huang, M.; Wu, Y.; Bao, W. Two-Bit Quantization for Harmonic Suppression. In Proceedings of the 2022 5th International Conference on Information Communication and Signal Processing (ICICSP), Shenzhen, China, 26–28 November 2022; pp. 696–699. [Google Scholar]
  19. Guo, L.B.; Tang, J.L.; Dong, Y.Y.; Dong, C.X. One-bit LFM signal recovery via random threshold strategy. Digit. Signal Process. 2021, 111, 102965. [Google Scholar] [CrossRef]
  20. Huang, X.; Liao, B. One-Bit MUSIC. IEEE Signal Process. Lett. 2019, 26, 961–965. [Google Scholar] [CrossRef] [Green Version]
  21. Fang, J.; Shen, Y.; Yang, L.; Li, H. Adaptive one-bit quantization for compressed sensing. Signal Process. 2016, 125, 145–155. [Google Scholar] [CrossRef] [Green Version]
  22. Kamilov, U.S.; Bourquard, A.; Amini, A.; Unser, M. One-Bit Measurements With Adaptive Thresholds. IEEE Signal Process. Lett. 2012, 19, 607–610. [Google Scholar] [CrossRef] [Green Version]
  23. Franceschetti, G.; Pascazio, V.; Schirinzi, G. Processing of signum coded SAR signal: Theory and experiments. IEE Proc. F-Radar Signal Process. 1991, 138, 192–198. [Google Scholar] [CrossRef]
  24. Zhao, B.; Huang, L.; Bao, W. One-Bit SAR Imaging Based on Single-Frequency Thresholds. IEEE Trans. Geosci. Remote Sens. 2019, 57, 7017–7032. [Google Scholar] [CrossRef]
  25. Zhao, B.; Huang, L.; Jin, B. Strategy for SAR Imaging Quality Improvement With Low-Precision Sampled Data. IEEE Trans. Geosci. Remote Sens. 2021, 59, 3150–3160. [Google Scholar] [CrossRef]
  26. Pan, T.; Zhao, B.; Huang, L.; Yi, C. Low-Cost Matched Filter for 1-bit SAR Singnal Processing Based on Single-Frequency Threshold. In Proceedings of the 2019 6th Asia-Pacific Conference on Synthetic Aperture Radar (APSAR), Xiamen, China, 26–29 November 2019; pp. 1–4. [Google Scholar] [CrossRef]
  27. Franceschetti, G.; Merolla, S.; Tesauro, M. Phase quantized SAR signal processing: Theory and experiments. IEEE Trans. Aerosp. Electron. Syst. 1999, 35, 201–214. [Google Scholar] [CrossRef]
  28. Dong, X.; Zhang, Y. A MAP Approach for 1-Bit Compressive Sensing in Synthetic Aperture Radar Imaging. IEEE Geosci. Remote Sens. Lett. 2015, 12, 1237–1241. [Google Scholar] [CrossRef]
  29. Abramowitz, M.; Stegun, I.A.; Miller, D. Handbook of Mathematical Functions With Formulas, Graphs and Mathematical Tables (National Bureau of Standards Applied Mathematics Series No. 55). J. Appl. Mech. 1965, 32, 239. [Google Scholar] [CrossRef] [Green Version]
  30. Kumar, K.R.; Reddy, P.M.; Sadanandam, M.; Kumar, A.S.; Raju, M. Design of 2T XOR gate based full adder using GDI technique. In Proceedings of the 2017 International Conference on Innovative Mechanisms for Industry Applications (ICIMIA), Bengaluru, India, 21–23 February 2017; pp. 10–13. [Google Scholar] [CrossRef]
  31. Shing Jie, L.; Siti Hawa, R. A 2 × 2 Bit Multiplier Using Hybrid 13T Full Adder with Vedic Mathematics Method. Int. J. Integr. Eng. 2018, 10, 20–26. [Google Scholar] [CrossRef]
  32. Mukherjee, B.; Roy, B.; Biswas, A.; Ghosal, A. Design of a low power 4 × 4 multiplier based on five transistor (5-T) half adder, eight transistor (8-T) full adder & two transistor (2-T) AND gate. In Proceedings of the 2015 Third International Conference on Computer, Communication, Control and Information Technology (C3IT), Hooghly, India, 7–8 February 2015; pp. 1–5. [Google Scholar] [CrossRef]
  33. Meti, S.S.; Bharath, C.N.; Kumar, Y.G.P.; Kariyappa, B.S. Design and implementation of 8-bit vedic multiplier using mGDI technique. In Proceedings of the 2017 International Conference on Advances in Computing, Communications and Informatics (ICACCI), Udupi, India, 13–16 September 2017; pp. 1923–1927. [Google Scholar] [CrossRef]
  34. Jiao, S.; Dong, W. SAR Image Quality Assessment Based on SSIM Using Textural Feature. In Proceedings of the 2013 Seventh International Conference on Image and Graphics, Qingdao, China, 26–28 July 2013; pp. 281–286. [Google Scholar] [CrossRef]
  35. Cumming, I.G.; Wong, F.H. Digital Processing of Synthetic Aperture Radar Data: Algorithms and Implementation; Artech House: Boston, MA, USA, 2005. [Google Scholar]
  36. MiniSAR. Synthetic Aperture Radar (SAR) Imagery. Sandia National Laboratories. 2005. Available online: http://www.sandia.gov/radar/imagery/index.html (accessed on 25 December 2022).
Figure 1. Block diagrams of the proposed two-bit imaging strategy. (a) Procedure of two-bit sampling. (b) Procedure of two-bit imaging.
Remotesensing 15 00310 g001
Figure 2. Harmonic suppression coefficients of different harmonic components.
Remotesensing 15 00310 g002
Figure 3. The range profiles of a point target located at 10 km with a high oversampling rate set to 20. (a) Results with high-precision quantization. (b) Results with one-bit quantization. (c) Results with the proposed two-bit quantization.
Remotesensing 15 00310 g003
Figure 4. The range profiles of a point target located at 10 km with a low oversampling rate set to 3. (a) Results with high-precision quantization. (b) Results with one-bit quantization. (c) Results with the proposed two-bit quantization.
Remotesensing 15 00310 g004
Figure 5. The spectrum of a wideband signal with a high oversampling rate set to 20. (a) Results with high-precision quantization. (b) Results with one-bit quantization. (c) Results with the proposed two-bit quantization.
Remotesensing 15 00310 g005
Figure 6. The three-dimensional spectrum of a wideband signal with a high oversampling rate set to 20. (a) Results with high-precision quantization. (b) Results with one-bit quantization. (c) Results with the proposed two-bit quantization.
Remotesensing 15 00310 g006
Figure 7. The two-dimensional spectrum of a wideband signal with a high oversampling rate set to 20. (a) Results with high-precision quantization. (b) Results with one-bit quantization. (c) Results with the proposed two-bit quantization.
Remotesensing 15 00310 g007
Figure 8. The spectrum of a wideband signal with a low oversampling rate set to 3. (a) Results with high-precision quantization. (b) Results with one-bit quantization. (c) Results with the proposed two-bit quantization.
Remotesensing 15 00310 g008
Figure 9. The three-dimensional spectrum of a wideband signal with the oversampling rate set to 3. (a) Results with high-precision quantization. (b) Results with one-bit quantization. (c) Results with the proposed two-bit quantization.
Remotesensing 15 00310 g009
Figure 10. The two-dimensional spectrum of a wideband signal with the oversampling rate set to 3. (a) Results with high-precision quantization. (b) Results with one-bit quantization. (c) Results with the proposed two-bit quantization.
Remotesensing 15 00310 g010
Figure 11. Range profiles of a single scatterer using different quantization schemes with different oversampling rates: (a) 1.1, (b) 1.4, (c) 1.7, and (d) 2.0.
Remotesensing 15 00310 g011
Figure 12. Evaluation indexes for a single scatter: (a) PSLR, (b) ISLR, and (c) IRW.
Remotesensing 15 00310 g012
Figure 13. Imaging results of different quantization schemes. (a) High precision. (b) One-bit quantization. (c) Proposed two-bit quantization.
Remotesensing 15 00310 g013
Figure 14. Accurate imaging results of MiniSAR.
Remotesensing 15 00310 g014
Figure 15. Imaging results of different quantization schemes. (a) Conventional 16-bit uniform quantization. (b) Conventional two-bit uniform quantization. (c) SFTQ. (d) Proposed two-bit quantization.
Remotesensing 15 00310 g015
Figure 16. SSIMs of imageries with different quantization schemes.
Remotesensing 15 00310 g016
Table 1. SAR parameters.
ParameterValue
Bandwidth300 MHz
Pulse Width10 μ s
Chirp Rate3 × 10 13 Hz/s
Wavelength0.03 m
Aperture Length1 m
Beam Width0.03 rad
Closest Range10 km
Speed150 m/s
Squint Angle
Doppler Bandwidth300 Hz
Synthetic Aperture Time2 s
Table 2. SSIMs based on different quantization schemes.
Quantization SchemeSSIM
UQ(16-bit)0.9999
UQ(2-bit)0.8411
SFTQ0.8610
Proposed0.8752
Disclaimer/Publisher’s Note: The statements, opinions and data contained in all publications are solely those of the individual author(s) and contributor(s) and not of MDPI and/or the editor(s). MDPI and/or the editor(s) disclaim responsibility for any injury to people or property resulting from any ideas, methods, instructions or products referred to in the content.