1. Introduction
The East Antarctic Precambrian shield plays an essential role in the history of global plate tectonic evolution as one of the oldest and largest cratons in the world [
1,
2,
3]. The Gamburtsev Subglacial Mountains (GSMs) are seated in the middle of the East Antarctic craton, completely buried beneath the massive ice sheet with an average thickness of ~1.6 km [
4,
5,
6]. The GSM ridges extend more than 1200 km from north to south. The average altitude of the subglacial terrain is ~1.4 km, and the maximum height reaches ~3.4 km. Its colossal scale exceeds the European Alps [
7]. The GSMs have provided a key nucleation site for the development of the East Antarctic Precambrian cratonic lithosphere. However, the crustal structure and tectonic evolution in the GSMs remain poorly understood.
The uplift mechanism of the GSMs has been widely debated. Geoscientists have suggested many views on their formation, such as: (1) collisional orogeny [
7,
8]; (2) intracratonic remote orogenic effect [
9,
10]; (3) plume activities [
11]; (4) erosion-driven uplift [
12]; (5) uplift triggered by rifting [
6]. Views on the GSMs uplift time mainly focus on Grenvillian-age (~1 Ga) and the Pan-African age (~550 Ma), while some believe that it may have undergone multi-period uplift intermittently. Due to the harsh environment in Antarctica, the main reason for these disputes is a lack of direct geological evidence and sufficient geophysical data. The study of the tectonic framework and uplift mechanism of GSMs can provide the necessary information to reveal the tectonic evolution of East Antarctica, which is an important component of the supercontinent convergence and dispersion [
7,
13].
Antarctica’s Gamburtsev Province Project (AGAP) was jointly completed during the Fourth International Polar Year (IPY4, 2007–2008). It was the first detailed aerogeophysical exploration in the Gamburtsev Province [
4,
6]. The Gamburtsev Mountains Seismic Experiment (GAMSEIS), implemented in East Antarctica, is one of the most extensive deep explorations in the interior of East Antarctica as part of AGAP, devoted to probing the crust and upper mantle structure of Antarctica [
8,
14].
Due to the thick ice sheet and harsh environment of interior Antarctica, comprehensive geophysical methods become one effective means to investigate the GSMs. Based on the GAMSEIS data, S-wave receiver functions and Rayleigh wave phase velocities have been used to estimate the crustal structure beneath the GSMs [
14]. It shows that the thickness of the crust of the GSMs ranges from ~55–58 km, with a root thickness between ~13–18 km, indicating that the GSMs are old continental features potentially associated with either Proterozoic or Paleozoic tectonic events. The average phase velocity contrast results for the GSMs are consistent with regions of ancient Archean–Paleoproterozoic crystalline basement [
8,
15]. Before the GAMSEIS program, global seismic observation data were used for tectonic research in the GSMs [
16,
17,
18]. Restricted by the observation accuracy, the research results were confined to the large-scale thick crust and the seismically fast cratonic zone of the Antarctic lithosphere. Since the sparse inland seismic observation stations in East Antarctica have no advantages in horizontal resolution, using passive seismic data still has some limitations in studying the detailed structure and evolution of the GSMs.
Based on the aerogeophysical data, a new model was proposed that the Permian and Cretaceous East Antarctic rift system triggered the uplift of the GSMs due to erosional unloading and heating of the crustal root [
6]. The old root was inferred to be reactivated during later Permian and Cretaceous rifting, possibly formed during the Proterozoic assembly of East Antarctica and preserved in the old orogens. The mountains, whose surface was lifted in the early GSM formation, were severely denuded, but the lower crust was well preserved. During the period from Permian to Cretaceous, because of strong buoyancy of the mountain roots, faults occurred in the weaker parts of the plate, forming the East Antarctic rift system. Therefore, through the investigation of gravity anomalies and bedrock topography, the uplift of the GSMs has been attributed to the isostatic rebound after erosion [
6,
12]. Based on the gravity isostasy, the crust uplifts in areas with strong denudation in response to the effect of surface unloading. Surface erosion flattening the mountains disrupted the dynamic and thermodynamic balance of the local and even regional crust, leading to the movement of material inside the crust and promoting the activation of mountains [
19]. Although the previous research results have suggested various views on the evolutionary mechanism of the GSMs, details and quantitative analysis of the physical properties of the crust are still lacking.
The GSMs have been covered by thick ice sheets for ~34 Ma, allowing for few geological samples and little geophysical data collection [
5]. The previous geological research on the GSMs are mainly derived from the analysis of surrounding rock samples assumed to be from the GSMs. In contrast, the geophysical research has been primarily based on satellite gravity and magnetic data, which has low resolution and large scale, resulting in unconvincing speculations on the detailed crustal structures and geological evolution. The ice drilling program for the GSM area is still under the demonstration stage, due to the constraints of the polar environment, logistical support, and other conditions [
20]. Here, we use the airborne gravity and aeromagnetic data from AGAP to investigate the crustal structure the GSMs by pattern analysis and inverse calculations, including Moho relief, isostatic gravity residuals, tilt derivative of aeromagnetic data and Curie depth, constrained by the subglacial topography, passive seismic results, and surrounding geological information.
2. Geological Settings
The Gondwana supercontinent was formed by the convergence of East Gondwana (dominated by East Antarctica, India, and Australia) and West Gondwana (dominated by Africa and South America), during the Late Proterozoic to Paleozoic (~600–500 Ma) through Pan-African orogeny, with the amalgamation suture probably in the interior of East Antarctica [
1,
8]. The dispersal of Gondwana started with the separation of the Indian plate from the Antarctic–Australian plate. The Indian plate drifted northwards with the expansion of the Indian Ocean at the end of Jurassic (~150 Ma).
Figure 1a shows the central position of East Antarctica within the Gondwana supercontinent at 140 Ma. Meanwhile, South America and Africa separated, the South Atlantic began to expand, and the Antarctic–Australian plate drifted southwards. During the early Eocene (~55 Ma), Antarctica separated from Australia, and the Drake Passage gradually opened up to form the current Antarctic geography [
21].
Geologically, Antarctica can be divided into East Antarctica and West Antarctica, separated by the Transantarctic Mountains. The East Antarctic interior is a mosaic of Precambrian cratons (
Figure 2b), covered by massive ice sheets, with fewer outcrops along the continental margins. Some blocks were affected by multiple geological events, mainly corresponding to the Paleoproterozoic orogeny, Neoproterozoic Grenvillian belts, and late Neoproterozoic–early Paleozoic Pan-African events, accompanied by partial accretion of the lower crust. There are primarily three Grenvillian belts with high recognition in East Antarctica: (1) Maud belt, (2) Rayner belt, and (3) Wilkes belt [
2]. Furthermore, the Pan-African belts in East Antarctica are: (1) Lüzow Holm Bay–Dronning Maud Land-Shackleton Range belt, belonging to the extension of the East African orogenic belt on the Antarctic continent and representing the suture line of East and West Gondwana that merged during the Pan-African period [
2,
22]; (2) Prydz Bay belt, representing a Pan-African orogen formed by the collision between the Indo-Antarctic and Australia–Antarctic continental blocks [
23,
24].
The GSMs were discovered by the 3rd Soviet Antarctic Expedition in 1958 [
25]. During 2004–2009, scientists explored the GSMs and found the Alpine topography was well preserved beneath the thick ice sheet [
5,
26]. The passive seismic results showed that the rugged mountain ranges were underlain by a 50–60 km thick crust and over a 200 km thick seismically fast Precambrian lithosphere, without orogenic collapse or root delamination [
6,
8]. It does not appear that East Antarctica is experiencing any current active or large-scale rifting like the West Antarctic Rift System (WARS) suffered during the Cenozoic, from the results of intraplate tectonic earthquakes detected by the AGAP/GAMSEIS seismic array in 2009 [
27]. After separating from Africa, India, and Australia, the East Antarctica plate showed no obvious geological activity occurring during the Late Phanerozoic, without the reactivation of the Lambert Rift during the Permian and Cretaceous.
Figure 1c,d show the fast cratonic lithosphere beneath the GSMs.
Figure 1.
East Antarctica in Gondwana and seismic tomography through the GSMs [
6,
28]. (
a) The central position of East Antarctica within the Gondwana supercontinent at 140 Ma. (
b) Geological map of East Antarctica. This geological map is modified from Grikurov and Leitchenkov (2019), [
29] and Kleinschmidt (2021) [
30]. The white rectangle is the study area. The orange line is the location of the seismic topography model shown in (
c). The red line is the extent of the fast cratonic lithosphere in East Antarctica at 150 km depth. Yellow lines denote the East Antarctic Rift System wrapping around the GSMs and including the Lambert Rift. Note the Gamburtsev Suture (dashed white line). The red dots are earthquakes detected by the AGAP/GAMSEIS seismic array during 2009 [
27]. The blue dashed lines denote the Trans East Antarctic Shear Zone [
31]. DML, Dronning Maud Land; EA, East Antarctica; EAR, East African Rift; EARS, East Antarctic Rift System; GMs, Grove Mountains; GS, Gamburtsev Suture; LHB, Lüzow Holm Bay; LHs, Larsemann Hills; LR, Lambert Rift; LS, Lake Sovetskaya; LV, Lake Vostok; MR, Mahanadi Rift; NC, Napier Complex; NPCMs, Northern Prince Charles Mountains; PB, Prydz Bay; PGR, Pranhita–Godavari Rift; RC, Rayner Complex; SPCMs, Southern Prince Charles Mountains; SR, Shackleton Range; TMs, Transantarctic Mountains. WA, West Antarctica; WL, Wilkes Land. (
c) Subglacial topography and ice sheet height of the regional seismic tomography model along 75 °E (present-day coordinates) through the GSMs and the Lambert Rift. Note the Prydz Pan-African belt in the northern Lambert Rift [
32]. (
d) Seismic tomography. Contour lines show percentage variations in seismic shear-wave speed (dVs) concerning the Earth reference seismic model [
17].

Orogenic belts are usually associated with active geological environments at the continental margins (e.g., Andes, Alps, Himalayas, etc.). However, the GSMs are located in a stable inland environment (
Figure 1a), with high altitudes and rugged mountains, whose uplift mechanism and tectonic evolution have always been a significant problem in earth science [
7,
28]. Situated to the north of the GSMs, the Lambert Rift System is one of the most extensive rift valleys in the world and is occupied by the Amery Ice Shelf about 1200 km long. The Lambert Rift and the southern domain of Prydz Bay belong to the tectonic depression, the triple point of the dispersal of Antarctica and Indian during the Late Paleozoic and Early Mesozoic [
33]. The partially exposed block on the northern side of the Lambert Rift is the Northern Prince Charles Mountains, occupied by the Neoproterozoic Rayner Complex with characteristics of regional granulite facies metamorphism, accompanied by charnockite and granitic magmatic intrusions (~990–980 Ma) [
34]. Charnockites are usually formed through crustal accretion, crust melting of basaltic underplating, or tectonic thickening. This domain may have been influenced by Pan-African tectonics during the Early Paleozoic (600–500 Ma) [
1]. The South Prince Charles Mountains and the Grove Mountains to the eastern side of the Lambert Rift are mainly occupied by an Archean crystalline granitic gneiss basement [
35]. Since no rock samples have been obtained from the GSMs, scholars have studied the geochemical and petrological characteristics of several nearby outcrops, such as the Prydz belt, Larsemann Hills, and Prince Charles Mountains. These studies suggest that the GSMs are possibly the inward extension of the Pan-African belt in central East Antarctica, which means the Pan-African orogeny promoted the uplift of the GSMs [
24,
36]. Based on the evolution of tectonothermal events and high-pressure granulites in the grove mountains, it is suggested that the Prydz belt is a collision orogen, which may extend southwards into the GSMs domain [
24].
The Lambert Rift splits into East and West rifts along the GSMs to the south. Due to glacial denudation and sedimentation, the East and West Rift show weak magnetism of basin-like structures. The airborne geophysical data suggest that the rifts flanking the GSMs are strongly similar to the rifts in the East African Rift System and the Godavari-Mahanadi Rifts in India [
6]. According to the GASMSEIS data, 27 intraplate tectonic earthquakes were traced in the flanking East and West rifts during 2009, most of which occurred in the shallow to middle crust, and no signs of seismic activity were found directly above the GSMs [
27]. It is believed that the GSMs are located on the stable Precambrian lithosphere, and the East–West rift may be part of an ancient continental rift system, which provides a zone of pre-existing tectonic weakness that focuses the seismicity [
27,
37]. The discovery of 4.5 mm quartzose glacial erratics from a borehole at Lake Vostok ~250 km from the GSMs, with ages of 0.8–1.2 Ga and 1.6–1.8 Ga, supported the stable Precambrian units beneath the GSMs [
38].
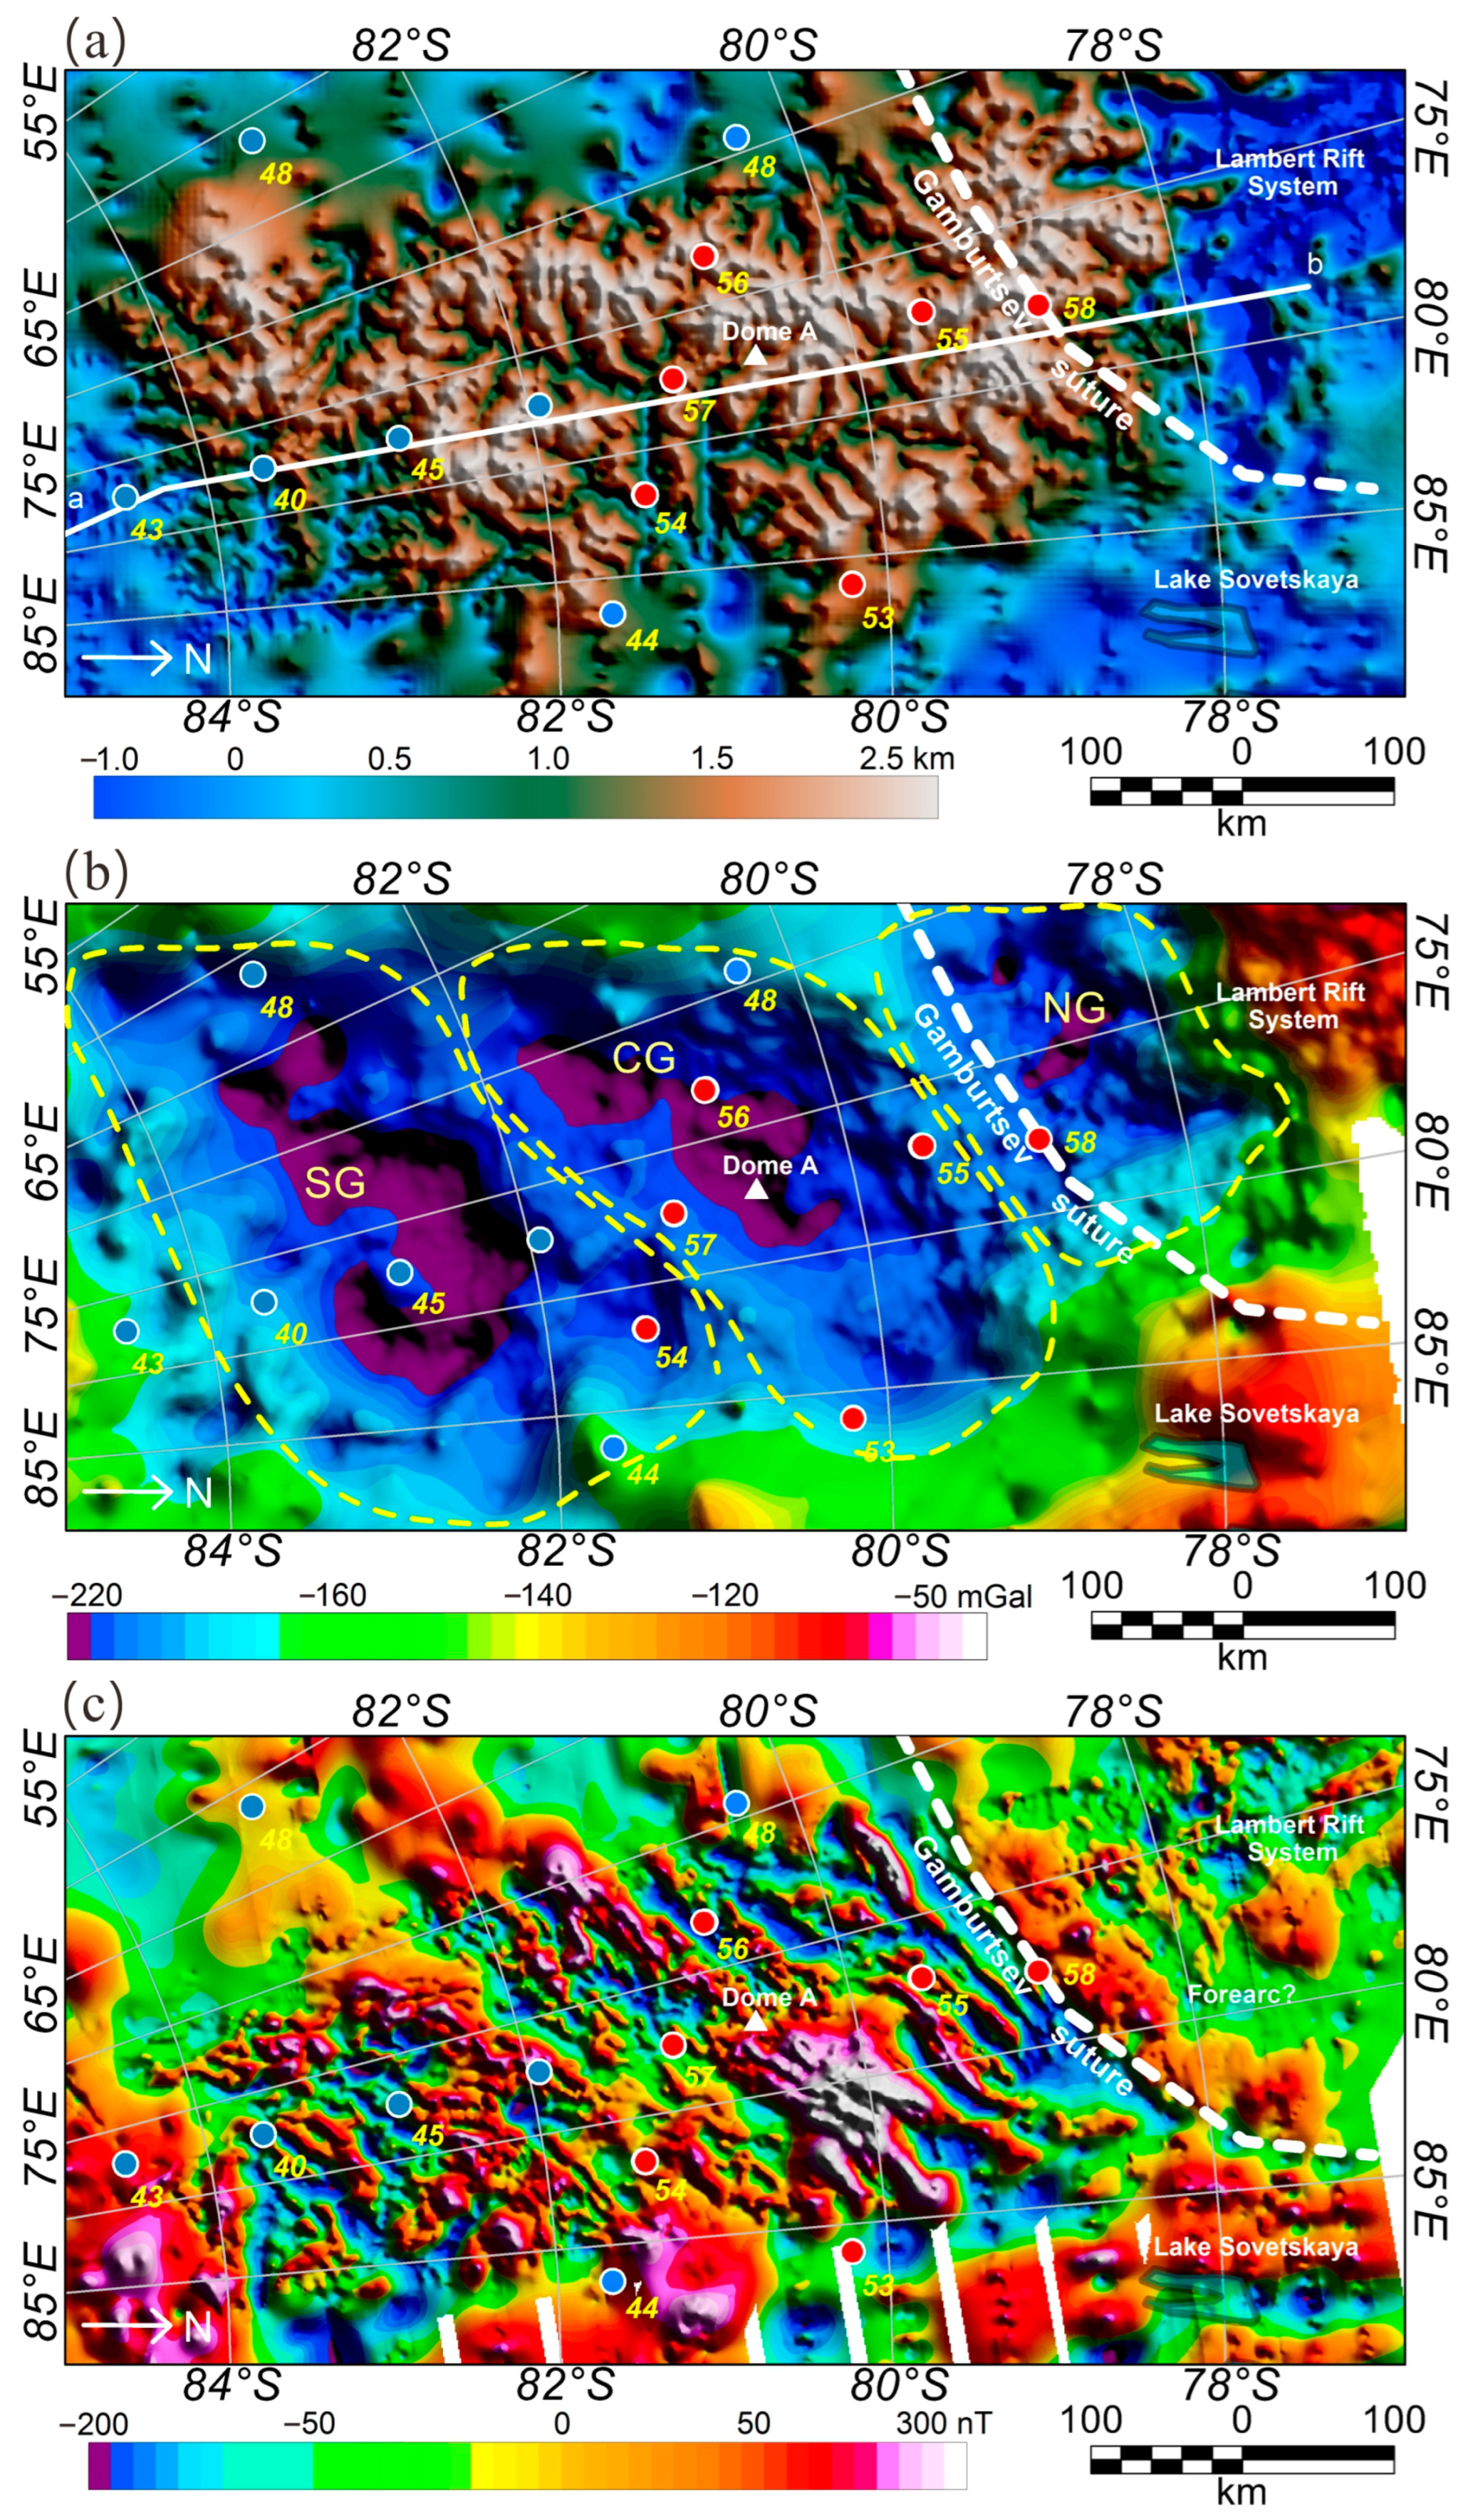
Figure 2.
Airborne geophysical data over the GSMs. (
a) Subglacial bedrock elevation of the GSMs. (
b) Bouguer Gravity map. The height of Bouguer gravity anomaly has been reduced to 4600 m above the sea-level. (
c) Aeromagnetic anomaly map. The magnetic anomaly data was draped at a height of 2500 m. The white dashed line denotes the Gamburtsev Suture [
6]. Red and blue dots with numbers show the anomalously thick crust beneath the Northern and Central GSMs and thin crust beneath the southern GSMs from passive seismic data [
8,
14,
15,
39]. The number near these dots represent the crustal thickness. Three Bouguer gravity lows are separated by linear highs over the GSMs with yellow dashed lines: Southern Gamburtsev (SG), Central Gamburtsev (CG) and Northern Gamburtsev (NG). Note the location of the 2D magnetic and gravity model across the GSMs (
a,
b).
4. Data Processing and Tectonic Interpretation
Using gravity and magnetic anomaly for inverting the physical parameters and spatial distribution of geological sources is integral to potential field data interpretation. Here, we used the Parker–Oldenburg density interface inverse algorithm [
41,
42,
43] to calculate the crust thickness in the GSMs domain, constrained by Moho depth from 12 passive seismic stations arrayed upon the GSMs. The density contrast was set to 400 g/cm
3. The average depth was set at 50 km. The pass wavelength of the bandpass filter was set between 100–1000 km.
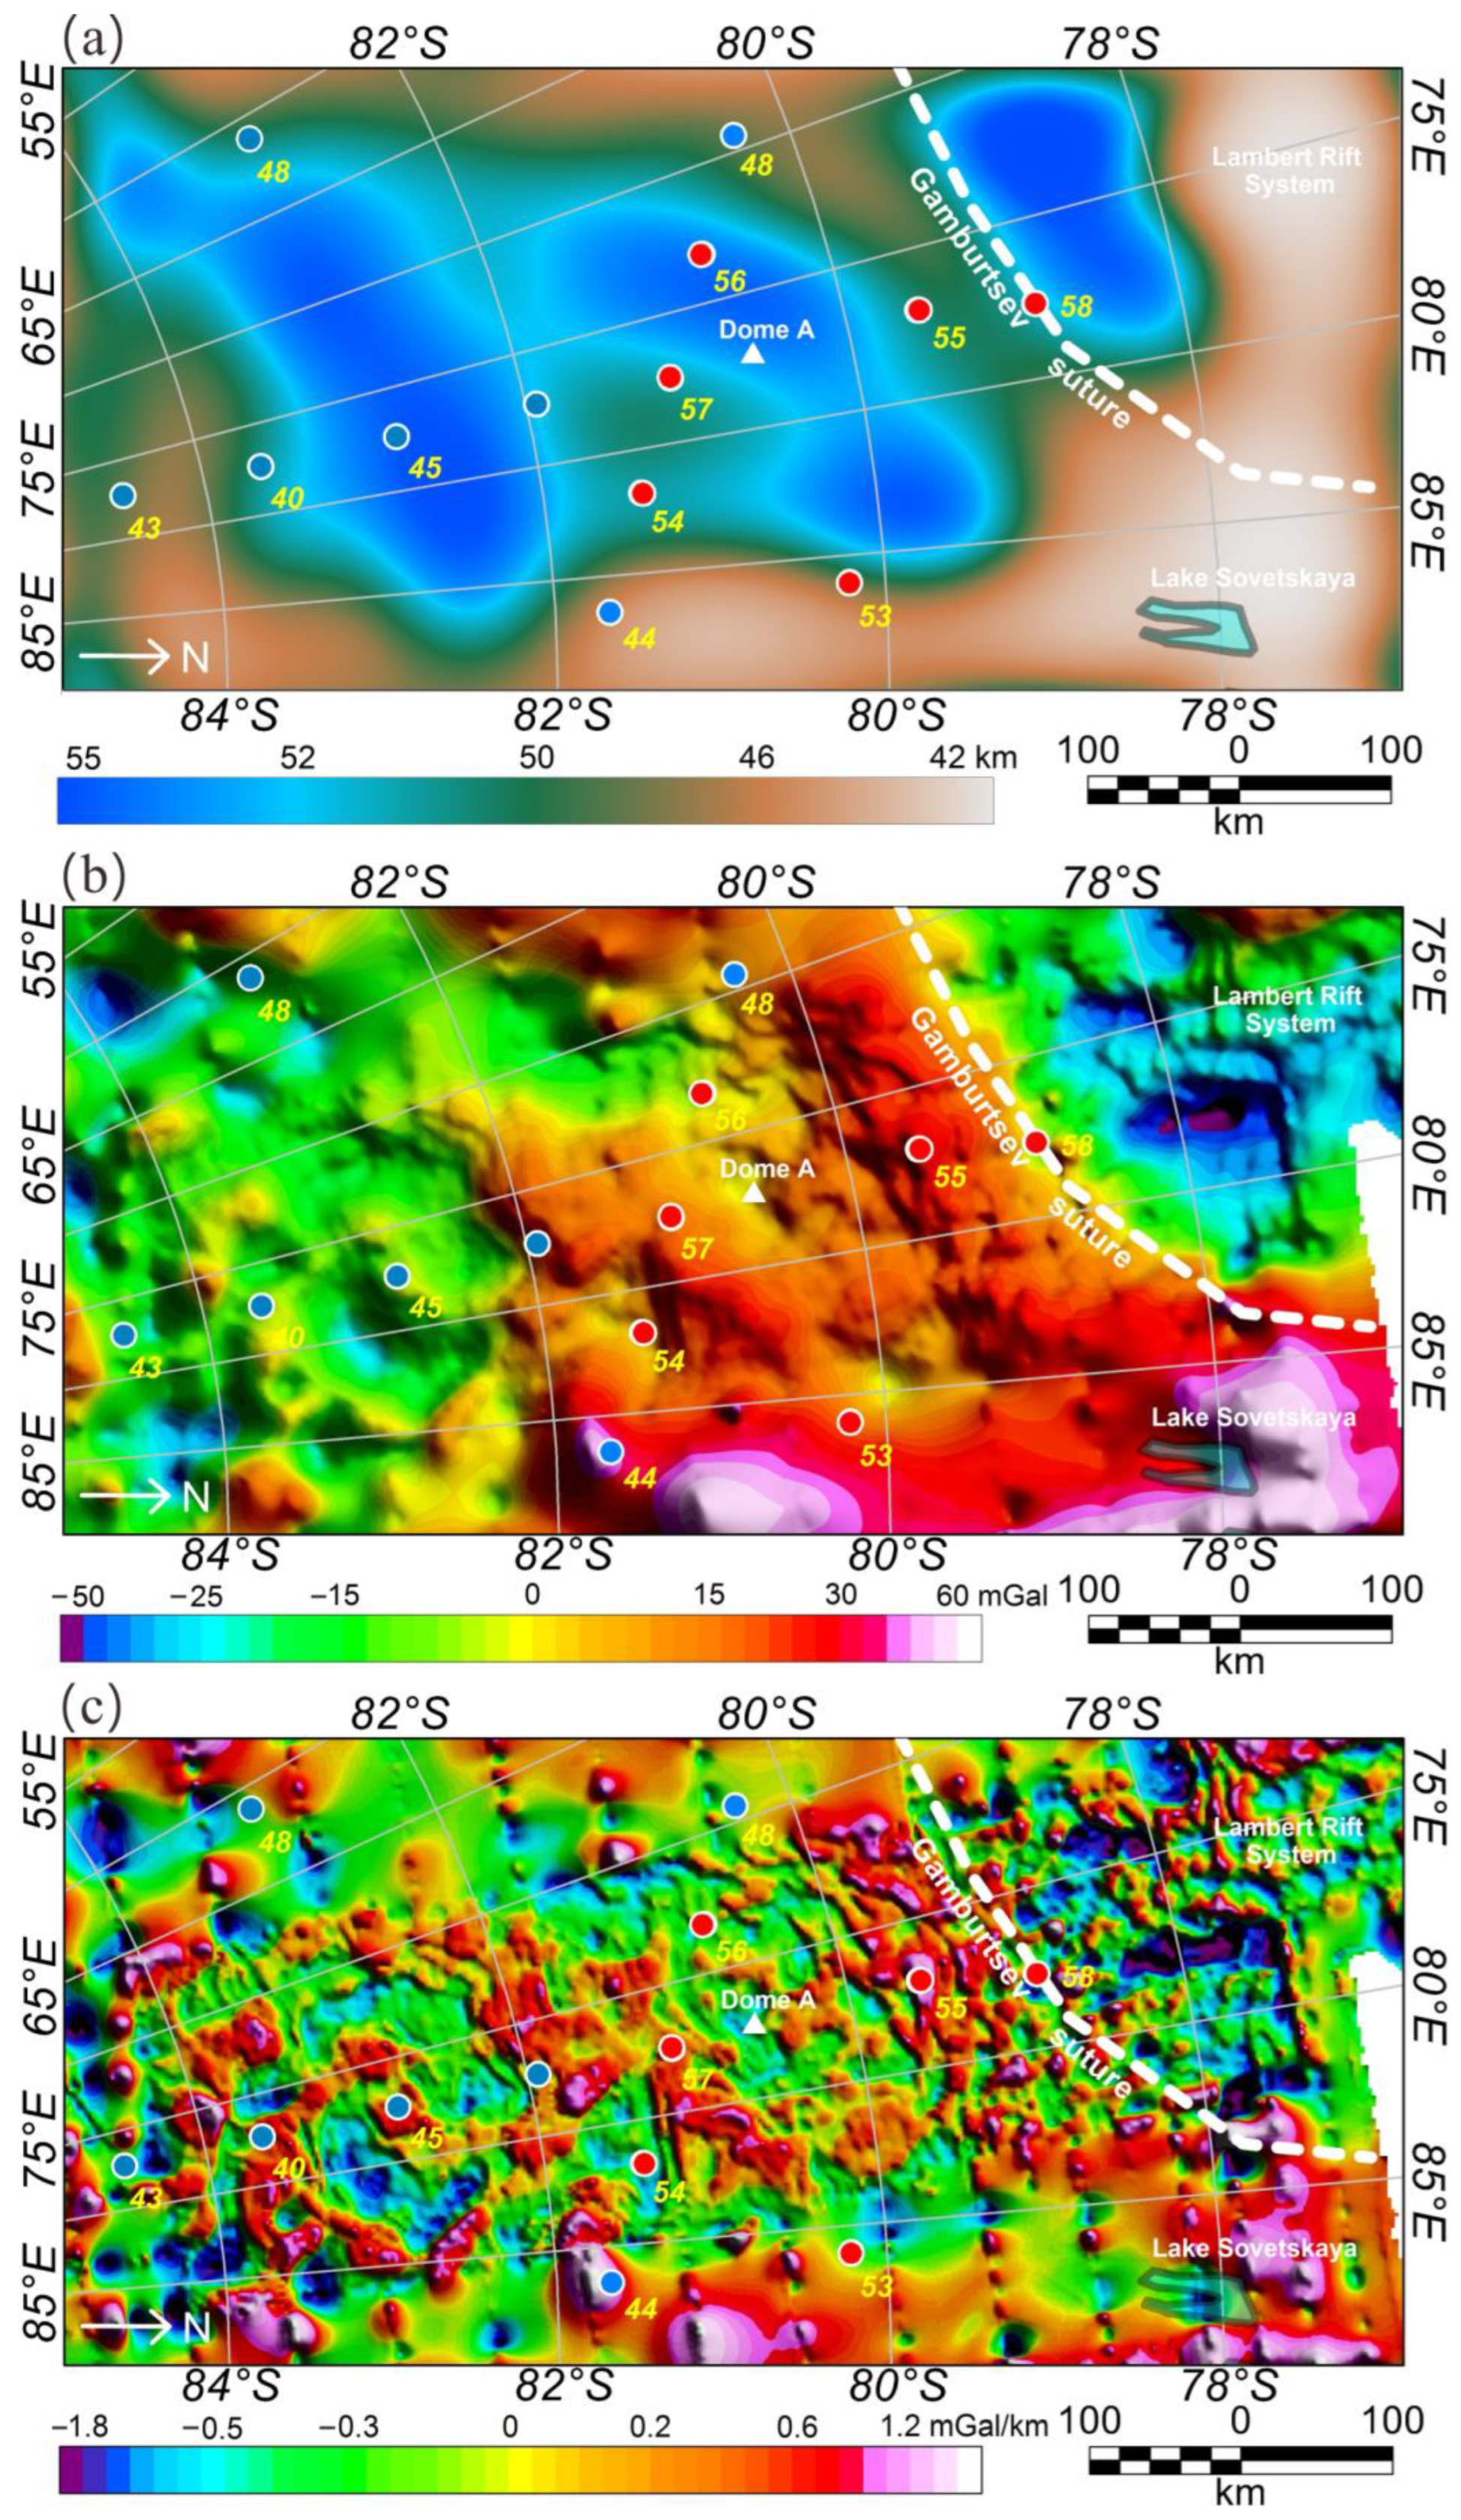
Figure 3a shows the inversion result of crustal thickness in the GSMs domain. The three distinct areas have a crustal thickness of ~53–55 km. Comparing the crustal thickness obtained by seismic arrays, it can be seen that the crustal thickness calculated from Bouguer gravity data by the Parker–Oldenburg algorithm in the middle and northern parts of the GSMs is thinner than that obtained by the passive seismic stations. The crustal density beneath the middle and northern regions of the GSMs is believed to be higher, resulting in higher Bouguer gravity over this region, indicating that a high-density crustal root possibly exists.
To obtain the crustal density structure in the GSMs, the isostatic residual gravity anomaly was calculated in the region.
Figure 3b shows the contrasting gravity isostatic signatures over the different domains within the GSMs. The CG domain and the southern NG domain feature a denser crust than the SG domain. The high values are mainly located in the northeastern GSMs, occupying most of the central GSMs in a triangular shape, and the highest values are in the Lake Sovetskaya domain and the GSMs Eastern Rift. Furthermore, the distinct residual gravity lows are over the proposed magmatic arc in the NG domain, which presents a clear boundary corresponding to the Gamburtsev Suture. The high-value area with WSW–ENE linear characteristics along the Gamburtsev Suture may be related to the high-density root formed by underplating in the lower crust during the assembly of the Antarctic and India plate, while the low-value area on the north side is inferred to be a low-density arc region. The isostatic residual gravity in the SG domain is low, consistent with that the inversed crustal thickness from Bourguer gravity being thicker than the thickness obtained from the passive seismic stations, indicating lower crustal density beneath the SG domain. The first vertical derivative of the isostatic residual has been calculated to enhance the detailed crustal architecture of the GSMs. Circular gravity anomalies may speculatively reflect dense intracrustal intrusions (e.g., gabbro) within the proposed back-arc region and linear anomalies may relate to thrust faults and sheared mafic rocks (
Figure 3c). The complicated structural characteristics of the GSMs and its surroundings reflect geological bodies with different physical properties and responses to different external stresses (e.g., magnitude and direction). These are inherited or due to the superposition of polyphase tectonothermal events (Grenville and Pan-Africa).
The linear magnetic characteristics of the WSW–ENE direction are possibly related to the thrusts in the upper crust of the GSMs. The magnetic tilt derivative was calculated to enhance the linear structure in the upper crust of the GSMs domain (
Figure 4a). The tilt anomaly features showed a new strike slip fault. This fault system has WSW–ENE direction, while the central part twists towards the N–S direction. The fault system’s shape appears similar to the Marlborough Buller fault system in the Southern Alps of New Zealand [
44]. The fault system has considerable cutting depth, a long extension, and pronounced directivity, outlining a crucial tectonic boundary in the GSMs, and controlling the development of the upper crustal structure. According to the classical model of the strike-slip fault [
45], this strike-slip fault system has the characteristics of a trailing contractional imbrication fan. It is speculated that it was mainly subjected to compression in the N–S direction and WSW–ENE direction displacement. Compared to the magnetic features on the offshore Prydz Bay, the magnetic anomaly direction in the Prydz Bay belt is mainly WSW–ENE, similar to the magnetic anomaly at the GSMs, and inferred to have formed in a similar predominantly transpressional tectonic setting. The Prydz Bay belt represents a Pan-African collisional orogenic belt formed by plate collision in East Gondwana [
32]. It is speculated that this huge stress leading to the linear magnetic features in the GSMs may be related to plate convergence of the Indian plate and the Antarctic plate during Pan-African orogenic events.
The Curie depth is a theoretical isotherm with a temperature of ~580 °C and can be considered an index of the basal depth of the magnetic source, due to the magnetization vanishing and the minerals exhibiting paramagnetic susceptibility above ~580 °C [
46]. The thermal structure of the lithosphere in East Antarctica provides essential information for studying the supercontinent accumulation/dispersal and the mechanism of global plate motions and large-scale tectonic thermal events [
47]. The dynamics of ice sheets are partly controlled by the thermal state. However, due to the large volume of ice sheets in East Antarctic, direct heat flux measurements and studies of the crustal thermal structure are difficult [
39,
48]. Previously, magnetic satellite data were used to calculate the depth of the Curie temperature isotherm in Antarctica, but this approach was limited by methodological uncertainties and the low resolution of satellite data [
49]. The defractal spectral method was used to calculate the Curie depth, which shows a Curie depth range of East Antarctica between ~22–63 km, and a heat flux range of ~45–85 mWm
−2 [
50]. The Curie depth in Gamburtsev Province is ~35–45 km, and the heat flux is 45–60 mWm
−2. Concerning the mantle thermo-elasticity properties, the three-dimensional shear wave velocity model was used to calculate the upper mantle temperature of the Antarctic continent, of which the surface heat flux in the GSMs is ~47 mWm
−2, assuming steady-state thermal conduction [
39].
In this paper, the Curie depth in the GSMs domain was calculated by using the spectral analysis method [
51], where the moving window size was 200 km × 200 km, and the moving step was 10 km.
Figure 4b shows the Curie depth map of the GSMs with a depth range from 24 to 44 km, divided into three zones: the uplift area in the north of GSMs, the central transition area with high, and the south depression area, corresponding to the three distinct zones of the Bouguer gravity anomaly. The shallow area of the Curie depth is mainly in the northwestern GSMs, near the Gamburtsev Suture and the Lambert Rift, reflecting the complex geological structure related to multiple periods of tectonic activity and forearc magmatic intrusions. The uplifting features of the Curie depth near the suture zone also indicate the high remnant thermal state in the collision zone. The ribbons in the CG domain are interpreted as strike-slip faults. The low-lying block with a depth of 35–40 km at Dome A is speculated to be related to uplifted allochthon with high susceptibility, similar to the Krakla allochthon in the Ural Mountains [
52]. The Curie depth variation in the SG domain primarily ranges between 30–40 km, consistent with those quiet blocks in a stable thermal state. It can be speculated that the SG domain is much affected by the inferred Pan-African age orogenic events than the CG and NG domains.
5. Crustal Structure Modelling
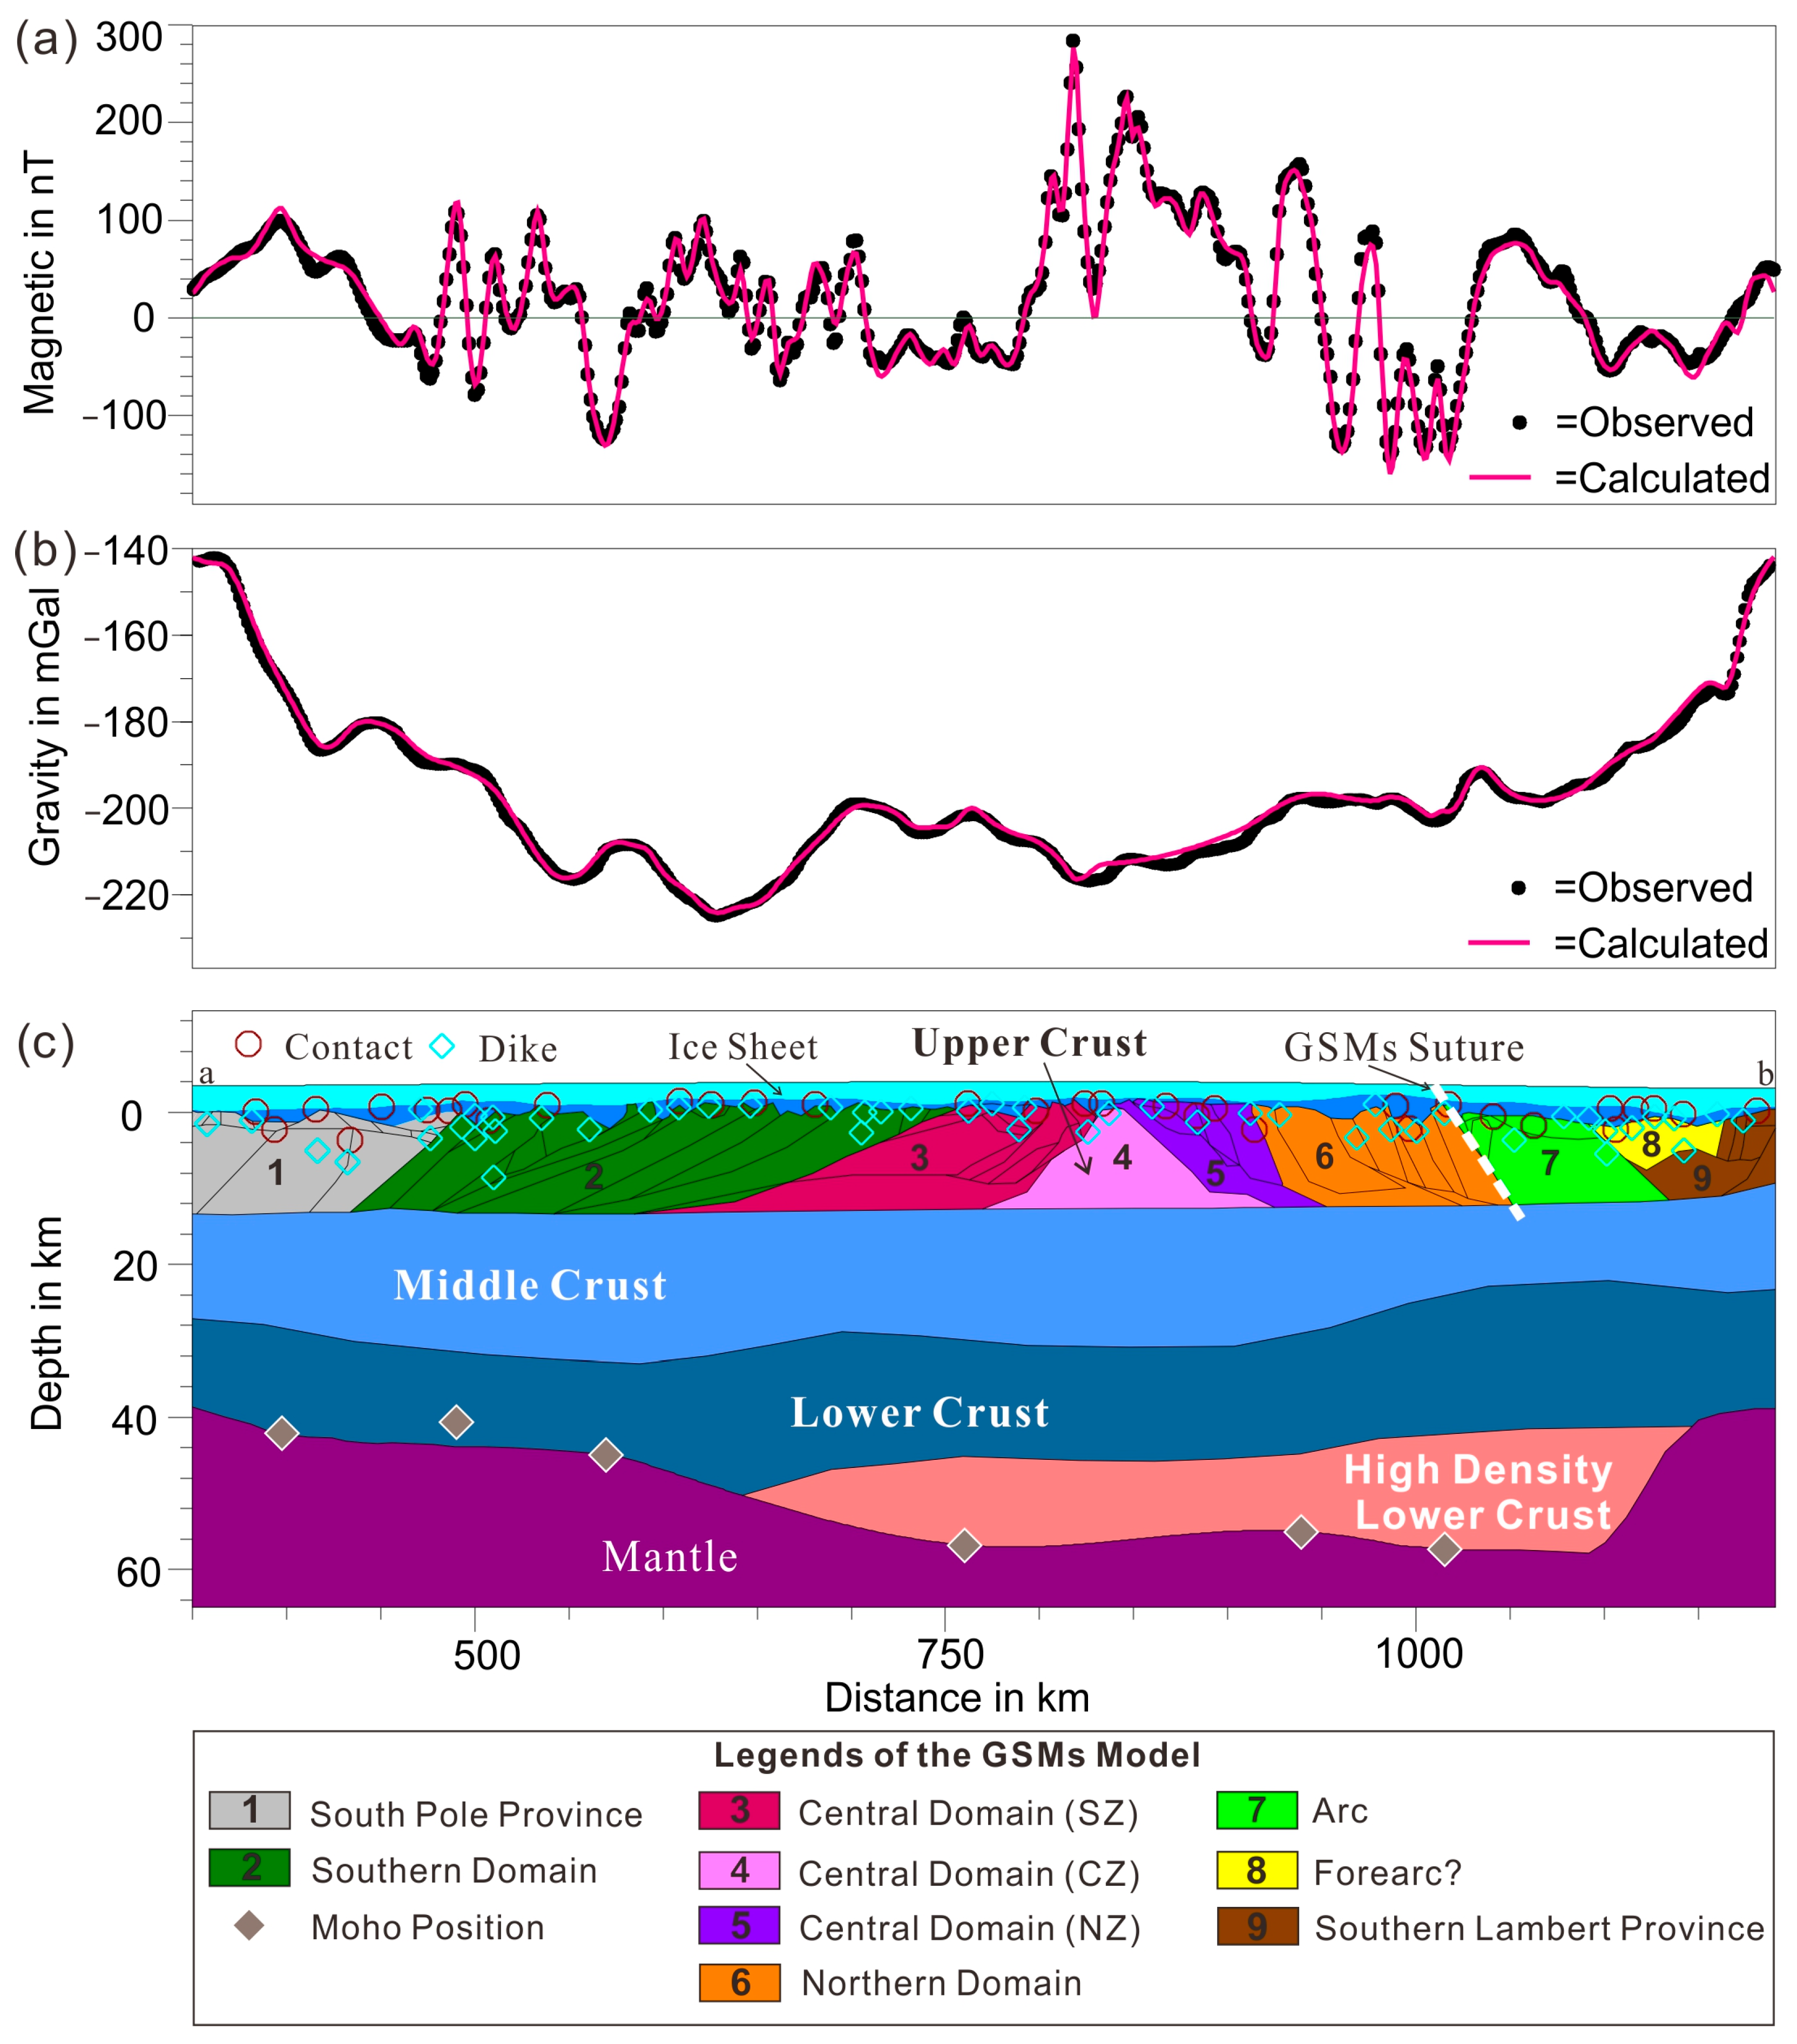
To obtain the detailed crustal structure and spatial distribution characteristics of the GSMs, a 2D gravity and magnetic model crossing the GSMs was constructed along the GAMSEIS profile (white line ab marked in
Figure 2) where several independent seismic receiver functions of crustal thickness are available [
14]. The model profile has a total length of ~850 km from the southern GSMs to the Lambert Glacier domain.
The magnetic and gravity images show three distinct geophysical domains: the Northern, Central and Southern Gamburtsev domains, sandwiched between the South Pole and the Southern Lambert provinces. According to the features of airborne gravity and magnetism, the GSMs can be divided into several distinct blocks along the profile a to b, namely the South Pole province, the Southern GSMs domain, the Central GSMs domain (with the south zone (SZ), central zone (CZ) and north zone (NZ)), the Northern GSMs domain, the arc region and the Southern Lambert Province (
Figure 5). The Gamburtsev Suture separates the Northern GSMs domain and the arc region. In this model, the density range of the upper crust was set to 2.67–2.75 g/cm
3. The densities of the middle crust, lower crust and mantle were 2.8 g/cm
3, 2.9 g/cm
3 and 3.3 g/cm
3, respectively. The high-density lower crust was set to 3.2 g/cm
3 close to the mantle density. The upper crust is usually controlled by brittle deformation, and its physical properties change obviously in the horizontal direction along faults, while the middle and lower crusts are more flexible. To constrain the tectonic boundary of the upper crust model, the Werner deconvolution algorithm [
53] was used to calculate the dike/contact depth solution of the aeromagnetic data [
28]. The parallel banded short-wavelength magnetic anomalies indicate large-scale thrusts, especially near the suture zone in the Northern GSMs domain. The thrusting leads to the tilt and reverse displacements of deep rocks and also potential fault-related demagnetisation, forming the observed positive and negative strip anomalies.
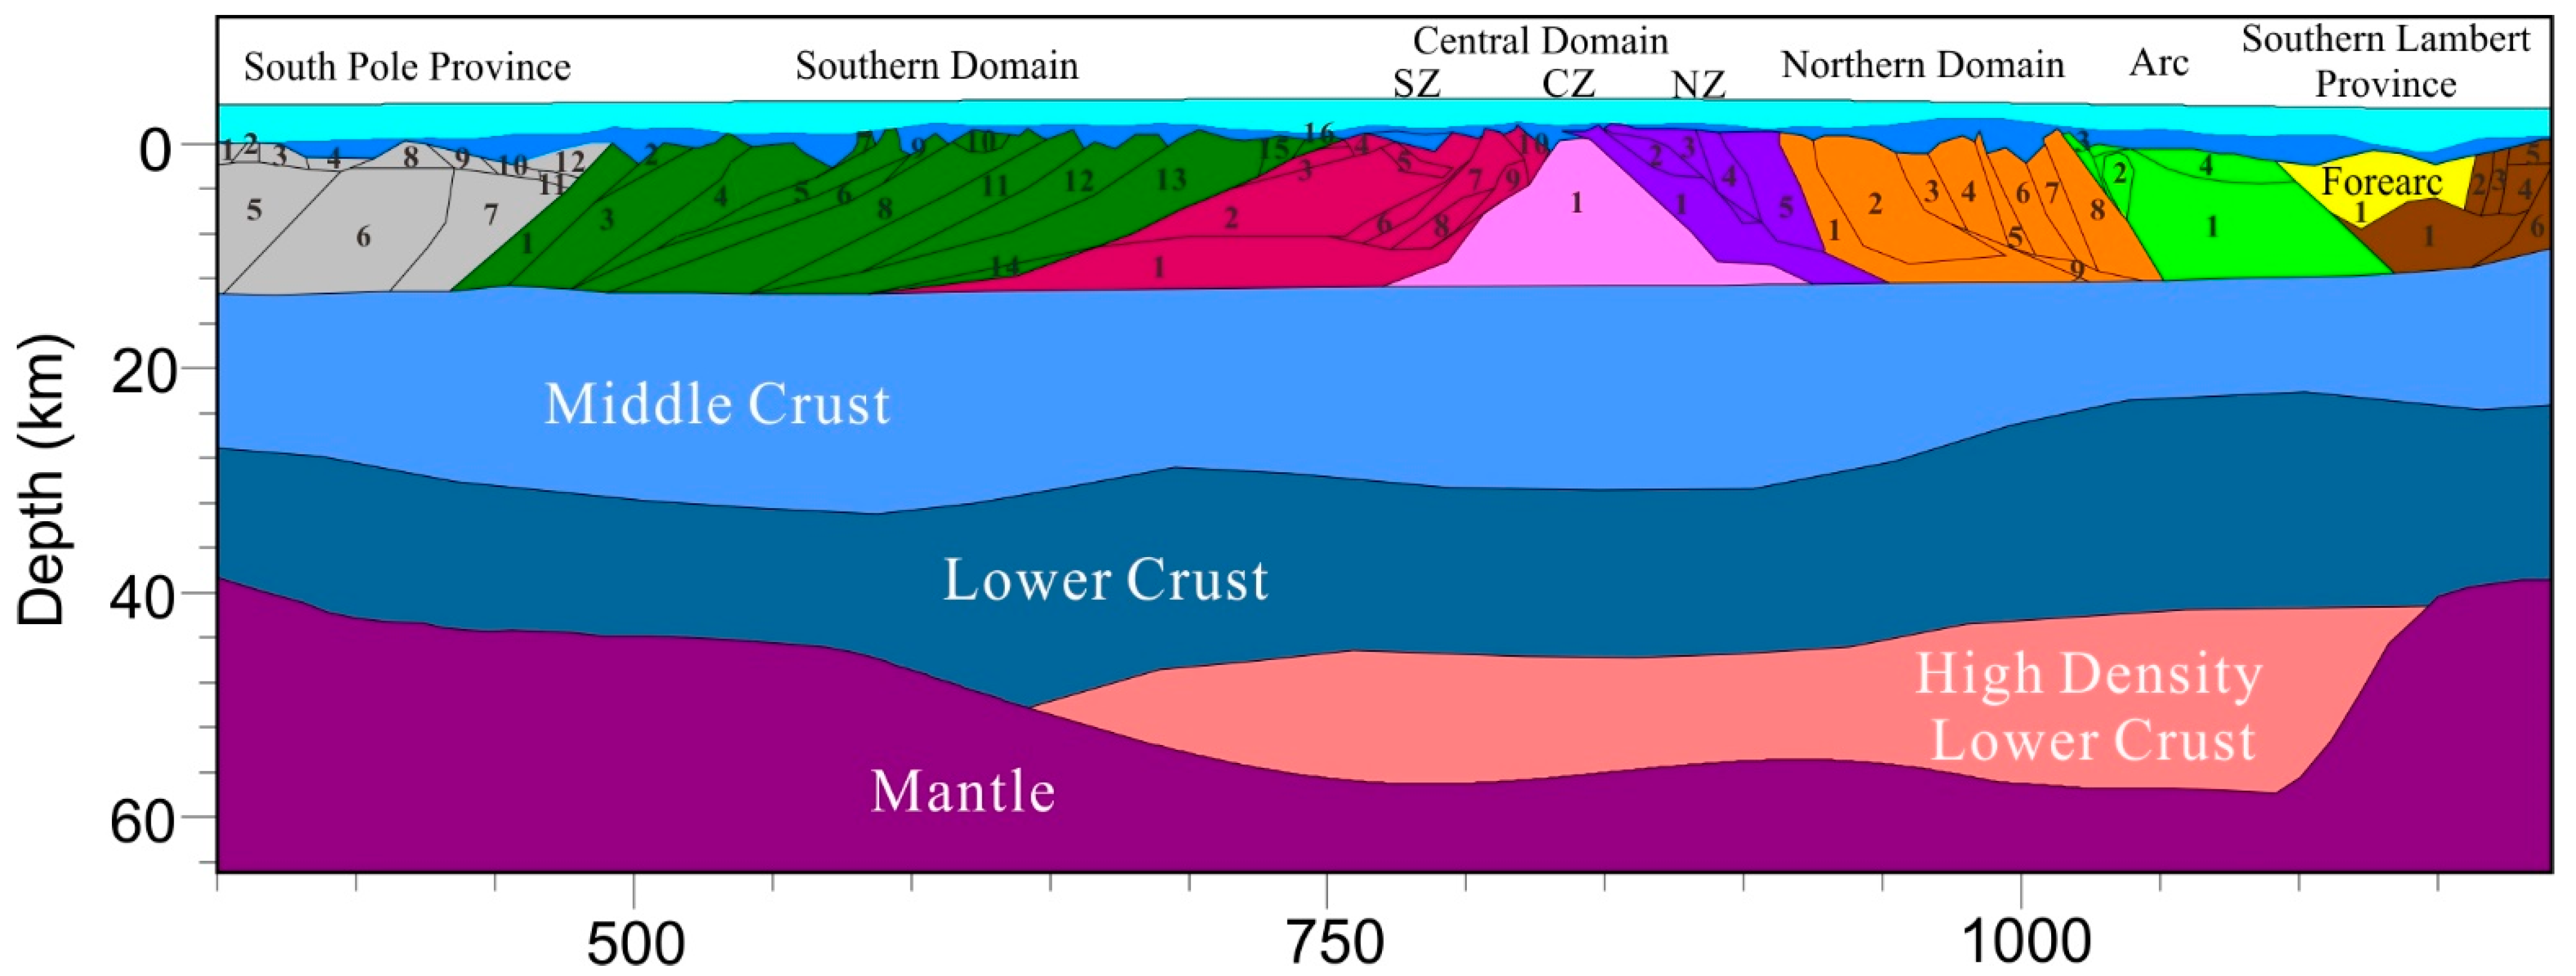
To fit the observed gravity data with the seismic Moho depth, a high-density lower crust is required beneath the thick lower-crustal layers of the NG and CG domains. It is noted that the crustal thickness obtained by passive seismic stations is greater than that calculated from Bouguer gravity inversion in the NG domain, indicating that a high-density lower block is required because the Bouguer gravity is greater than the normal gravity value. It is possible to interpret the high-density lower crust being related to mafic to ultramafic underplating linked to subduction or magmatic arc activities [
28]. Underplating is a process in which mantle-derived materials are added to the bottom of the continental crust, thus further thickening the crust in the GSMs. As an important mode of vertical growth of the crust, underplating is mainly caused by the following four tectonic settings [
54,
55]: (1) Continental collision; (2) subduction processes along active continental margins; (3) continental rifting; (4) hot spots. Combined with the surrounding geological information and airborne geophysical features of East Antarctica, here we interpret that the high-density lower crust in the GSMs domain may be related to underplating caused by continental collision, indicating that continental collision is a significant factor in the crustal thicknening observed benath the northern and central GSM domains.
6. Discussion
Sediment inclusions from ice cores of the Lake Vostok borehole reveal age ranges 0.8−1.2 Ga and 1.6−1.8 Ga, which suggests the provenance of the GSMs and Vostok Subglacial Highlands is mainly represented by Paleoproterozoic, Mesoproterozoic and Neoproterozoic crustal provinces [
38]. Based on the analysis of clastic sediments in Prydz Bay, it is proposed that the origin of GSMs is not volcanically related [
7]. According to the study of geochemical characteristics along the outcrops of Prydz Bay margin, the GSMs are thought to be a cryptic branch of a Pan-African age in the middle of East Antarctica, with the Pan-African orogeny (~600–500 Ma) a proto-Gamburtsev Mountains in the region of the younger GSMs [
23,
24,
36]. However, this speculation is also based on the assumption that the debris came from the GSMs through the Lambert Rift.
The GAMSEIS results show that the average crust and mantle density ratio in East Antarctica is much higher than that of other regions worldwide [
8,
14]. It can be speculated that the average density of the crust in this region is much higher than that of the continental crust, or the average density of the mantle is lower than that of other continental mantles, similar to the Archaean lithosphere [
8]. Compared with the phase velocity curves corresponding to specific tectonothermal ages elsewhere, the average phase velocity results for the GSMs are consistent with regions of ancient Archean–Paleoproterozoic crystalline basement [
15]. According to the An1-s model, it is suggested that the thick crust beneath the GSMs represents the collision suture zone formed between the Indian–Antarctic part of East and West Gondwana, which implies that the Pan-African collisional orogeny produced the GSMs juxtaposed and thickened older lithosphere of the colliding terrains, while the suture may be near Dome A [
8].
Tectonic compression is one of the main factors thickening the continental crust and uplifting mountain ranges globally, such as the Himalayas and the Alps, commonly dominated by thrust faults and strike-slips. Here, the GSMs airborne gravity and magnetic data present prominent compressional characteristics and a series of thrust structures and strike-slip faults possibly linked to plate collision. The evolution of the GSMs is related either to Grenvillian age or Pan-African age orogenic events [
6,
8,
56]. The Pan-African orogeny recorded the collision of the India–Australia–Africa–Antarctic cratons and stitched East Gondwana, mainly distributed in the Lüzow–Holm Bay, Dronning Maud Land, Shackleton Range and Prydz Bay belt [
23,
24]. The thrust nappe and strike-slip characteristics identified in the GSMs strongly reflect the inferred dominantly transpressional contact relationship between the old India–Antarctica block and the East Antarctica block. The massive released compressive force is possibly linked to the uplift process of the proto-GSMs. Additionally, the features of the fault trends and their distribution in the proto-GSMs are similar to those in East Antarctica which underwent the Pan-African orogenic event. It is speculated that the GSMs may also have occurred in the Pan-African age or been reactivated in the Pan-African age. However, the seismic data shows that the GSM Precambrian basement is well preserved and has no signs of large-scale collapse or delamination [
6,
8]. It has been pointed out that the Prydz belt to the north of the GSMs is a Pan-African orogenic belt developed on the Archean Greenville basement and involved in the Pan-African orogeny together with the Neoproterozoic sediment covers [
32]. Therefore, we speculate that the GSM basement and the orogenic belt are two different blocks. Based on the analysis of high-speed lithospheric characteristics and zircon data at the Lambert Glacier and Prydz Bay margins to the north of the GSMs [
1,
10,
17], the GSM basement likley includes Protereozoic and potentially older Archean rocks although their extent is ill defined at crustal scale as independent wide angle seismic data imaging is lacking.
Accretionary orogens usually occur at intra-oceanic and continental margin convergent plate boundaries, comprising the forearc from subduction, magmatic arc, and back-arc components, classified as advancing and retreating, based on their kinematic framework and resulting geological features [
57]. Advancing orogens form when the overriding plate advances towards the subducting plate, causing the crust to thicken and develop foreland folds and thrusts. The subglacial terrain and linear aeromagnetic structure beneath the NG domain show the characteristics of the forearc basin. The high-magnetic block at Dome A has the characteristics of an uplifted allochthon. There are apparent thrust nappe structures in the CG and NG domains with similar magnetic features to those in the Pan-African Prydz Bay belt. As a result, it is suggested that the GSMs are linked to the advancing accretionary orogenic belt of an inferred Pan-African age.
Figure 6 shows the tectonic evolution schematic diagram of the GSMs. During Gondwana convergence ~600–500 Ma (
Figure 6a), the GSMs already had a ~40–50 km thick crust, while the basement was well preserved without large-scale delamination or collapse. The surface may have suffered large-scale erosion during that time, resulting in the partial removal of the upper crust [
12,
58]. The present crust may be part of a thrust marginal accretionary wedge located at the converging plate boundary in the early orogenic stage. The large-scale thrust nappe structure and strike-slip faults are formed by the convergent plate force, including the long-distance removal of the large allochthon at Dome A. During ~500–300 Ma, the Antarctic and Indian plates had already converged and collided but intraplate fault reactivanion remains a plausible scenario (
Figure 6b). The GSM’s orogenic belt was affected by the continental collision, leading to the early thickening of the crust. The thickened continental crust and lithosphere possibly underwent underplating and eclogitization, which is suggested to be responsible for the high-density crustal root. The accretionary terrane was pushed to be superimposed upon the Precambrian GSM basement under the huge continental converging forces during the Pan-African event. The positive surface load from the accretionary terrane possibly links to the secondary thickening of the GSM crust. Magmatic intrusions occurred near the Gamburtsev Suture zone. Strong post-orogenic magmatic and volcanic activities and mantle-derived magmatic intrusions usually mark the end of collisional orogenesis, but the age of any such magmetism is currently unconstrained due to the lack of drilling in the GSM region.
After entering the Oligocene (~34 Ma), the ice sheet in the GSM area began to form (
Figure 6c), and the early glacial denudation formed steep peaks. In the Early Oligocene, the ice sheet in the GSMs domain began to form, and the early Alpine-style glacial denudation created sharp peaks and valleys. With the increase in the thickness of the ice sheet, glacial erosion of the GSMs is weakening, resulting in the steep glacial landform of the GSMs being preserved to this day.
Here, we propose that the upper crust in the GSMs are possibly linked to accretionary orogenesis superimposed upon the remnant mid to lower crusal Poterozoic to Archiean(?) age basement and that final accreation and collision was completed during the Pan-African age events. Our conclusion is mainly based on the analyses of airborne gravity and magnetic anomalies, which can be further constrained with the aid of the age and evolution from bedrock drilling efforts in the Gamburtsev Province [
20] and aerogeophysical exploration efforts over the regions near the GSMs, e.g., the Princess Elizabeth Land region [
59,
60], the Prydz Bay belt [
61] and the South Pole Province [
62,
63].


 ,
, 


