1. Introduction
Forest landscapes are important for regulating the energy balance of the underlying surface. They have numerous ecological functions, providing high evaporation rates and reducing excessive ground surface heating. Forests thus act as effective environment-forming regulators that mitigate climate conditions through a high amount of absorbed solar radiation resulting in evapotranspiration [
1]. The Earth’s climate is progressively warming, and the anthropogenic load in the cryolithozone is growing; thus, it is becoming increasingly urgent to provide a differentiated assessment of the ecological role of various types of forests.
Modern remote sensing technologies make it possible to quickly monitor the geophysical parameters of landscape functioning at various spatial levels. With regard to the issue considered in the study, thermal infrared remote sensing data was used to derive land surface temperature (LST) maps. Thermal imaging that uses the intensity of infrared radiation allows identifying different types of forests by their biogeophysical characteristics [
2]. Despite the development of tools related to measurements of the energy fluxes within the atmospheric surface layer, the landscape-ecological interpretation of the data obtained is just beginning to be elucidated. Examples include using thermal characteristics to study structure, dynamics, and functioning of forest landscapes. Thus, surface temperature measurements contribute to better understanding of biophysical processes taking place in landscapes and their role in the energy exchange between the main components of the Earth’s climate system [
3], which can be used to forecast the risk of forest fires [
4] and develop adaptive practices to manage thermal stress in areas with different types of land use [
5]. Using the thermal bands of the Landsat-series satellites, approaches are being developed to identify the most stable landscapes in the taiga zone, where it has been demonstrated using specific data that the thermal field measured by the satellite is determined by landscape parameters [
6]. Furthermore, thermal survey data are used to differentiate the stages of successional restoration of forest vegetation [
7], to identify abandoned mining sites in the taiga [
8], and to solve other ecological tasks. These examples support consideration of thermal survey data as the most important source of information necessary for forest landscape monitoring systems.
Comparative assessment of forest landscapes in terms of their energy and moisture exchange potential is based on analysis of the LST obtained from the thermal infrared remote sensing survey. The surface temperature is mainly determined by the surface net radiation, and the ratio of the heat of evaporation (i.e., latent heat flux) and the sensible heat flux [
9]. The forest vegetation plays an important role in regulating transpiration and interception evaporation, which is a manifestation of the climate-regulating role of forest landscapes, largely due to their transpiration potential that determines the energy and moisture exchange between land surface and the atmosphere [
1,
2,
10,
11]. Hence, this factor determines the ability of forests to regulate their own thermal regime under various weather conditions, which is especially important during prolonged dry periods [
12]. The ratio of sensible and latent heat fluxes from biogeophysically different types of the land surface of the mid latitudes has also been investigated using airborne remote sensing technique [
2,
13,
14], though such works are very expensive due to high aircraft-time and special-equipment costs. However, this approach can be used for mapping permafrost-taiga landscapes [
15,
16,
17,
18,
19,
20,
21]. This is most true for the territories of the southern part of the boreal cryolithozone [
4,
19,
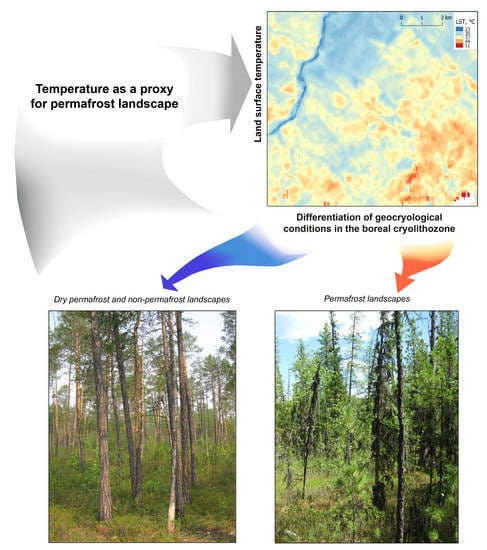
22], where differences in forest growing conditions are highest, and are expressed in the phytomass stocks of taiga landscapes and in the rate of their heat fluxes. Our study discusses the application of this approach for a low-mountain terrain of Central Siberia (
Figure 1). Thus, the pronounced contrast of natural and geographical conditions, inherent in landscape ecotones, is noticeably reflected in the geophysical features of the underlying surface. This circumstance offers broader application of remote sensing data (including thermal infrared imaging) both for mapping natural phenomena with a significant landscape-forming role, such as permafrost, and for tracking its dynamics by indirect characteristics in areas with mosaic natural conditions, for example, modeling the distribution of permafrost in the boreal regions of Alaska using satellite information and geobotanical mapping demonstrated high accuracy in the areas with sporadic permafrost development [
23]. An extensive set of satellite data was used in a model developed and successfully applied in the territory of Fennoscandia and the European north of Russia, with a total area of more than 5 million km
2 [
24]. While recognizing the merits of this model, which is worthy of further development, we are somewhat skeptical regarding its application in the territory of northern Siberia and the analogous regions of North America, with greater mosaics of both lithological and geocryological conditions. In this regard, of interest is mapping permafrost landscapes of the mountainous areas of southern Yakutia, which is based on the use of a spectrum of spatial data, including thermal infrared images [
17]. Nevertheless, considering the role of surface deposits in the preservation of permafrost conditions, there is some concern about the still insufficient degree of use by the authors of information on the historical and genetic basis of the mapped landscapes. A similar approach, but with a greater emphasis on geobotanical data was employed to map permafrost-taiga landscapes in one of the regions of northeastern Siberia [
25].
At the same time, under rapid climate change, many studies have focused on indicating changes in geocryological conditions are of particular importance. Thus, in the north of the Yenisei Siberia, a noticeable shrub expansion in tundra and forest tundra over a 32-year period was revealed, which is associated with an increase in temperature and thickness of the snow cover, and may indicate the lowering of the depth of permafrost [
26]. Trends in landscape “greening” have also been observed in typical taiga conditions in the south of the permafrost zone, where the most rapid overgrowth and increase in biological productivity have been noted in cold-exposure kurums [
27]. A methodologically interesting comparison was made of the use of data from different survey systems to assess changes in the structure of the underlying surface and vegetation cover on the northern forest border in Central Siberia [
28]. Nowadays, satellite data can be used to recognize the height of shrubs in the tundra-taiga ecotone zone [
29], which affects the thickness of the snow cover as a factor that has a thawing effect on permafrost. Important conclusions on climate-induced changes in the properties of the underlying surface were obtained in the Northwest Territories of Canada, in an area of sporadic permafrost, where a decrease in the area of coniferous forests and increase in wetland areas on thawed rocks were observed [
30]. Such changes can affect the regional climate and slow down its warming, which investigation of the development of negative feedback reactions in this respect.
This paper is structured conventionally. The section “Study Area” presents analysis of the area’s landscape and describes the role of the tiered relief in the formation of its structure and permafrost occurrence. The section “Research Methodology” consists of two parts. The first part describes the field research methods (specifically, collection of the primary field material), while the second part presents the remote sensing data processing algorithm for obtaining maps on LST. The section “Results and Discussion” contains the results of a comprehensive analysis of the field research data and of processing thermal infrared images. The section also discusses the role of forest conditions in the formation of thermal anomalies on the resulting maps. Section “Conclusion” summarizes the main results of the method used to identify permafrost-taiga landscapes and the role of the incorporated technology for predicting natural and environmental risks.
2. Study Area
The study area is situated in the north of the Yenisei Ridge, and is about of 25 km
2. It is located on the right bank of the River Chapa basin (River Chapa, River Velmo, River Podkamennaya Tunguska,
Figure 1), in the middle taiga zone in the territory of the Severo-Yenisei municipal district of the Krasnoyarsk territory. The geographical coordinates of the corners of the study area are as follows: northwestern—91°51′27″E, 60°43′09″N, northeastern—91°58′48″E, 60°43′09″N, southwestern—91°51′27″E, 60°40′15″N, and southeastern—91°58′48″E, 60°40′15″N.
This area is confined to the field of distribution of rocks of the early and late Proterozoic—mainly metamorphic shales, as well as terrigenous-carbonate rocks that have undergone weak metamorphism and are disturbed by a system of parallel northwestern striking faults. The fault zone is manifested as a morphotectonic boundary dividing the ancient planation surface into two hypsometric levels. The upper level is represented by summit surfaces with heights ranging from 480 to 560 m, and the lower level with heights from 230 to 420 m. In geocryological terms, this territory is characterized by the sporadic presence of high-temperature ice-bearing permafrost up to 25 m thick [
31]. Continuous-island permafrost (up to 50%) is typical of the most part of the studied territory, while isolated rare islands of permafrost are characteristic of the most well-drained sites of the watershed area.
The landscapes of the upper level of the planation surface include pine-birch taiga on peaty brown-taiga soils. As the thickness of loose sediments increases, the stands become more diverse. The relatively high degree of roughness of the upper level of the planation surface and underlying shallow loose rock (on average, 2–3 m) increase significantly the drainage potential of the territory. The combination of these factors inhibits development of permafrost-taiga landscapes. This is especially noticeable on flattened summits—the most elevated parts of the planation surface. At the same time, on the slopes, the thickness of surface deposits is somewhat greater and the ratio between clastic and dispersed material changes noticeably in favor of the latter, which creates more favorable conditions for the localization of permafrost islands.
The landscapes of the lower level of the planation surface are formed on loose sediments of greater thickness (on average, 3–5 m) and include dark coniferous taiga with larch and birch, often sparse, on peat, cryogenic, alluvial, hydric, permafrost, and brown-taiga soils. The natural ecosystems of this hypsometric level have a lower degree of roughness of the relief and a higher moisture supply. These conditions contribute to a wider distribution of permafrost.
The valley-bottom systems form the third hypsometric level with the lowest absolute marks. The water-line of the River Chapa within the study area varies from 207 to 220 m. Natural ecosystems there have the greatest thickness of loose sediments (on average, 5–7 m) and have varying degree of moisture supply due to differences in granulometric composition of the underlying strata. Permafrost is widespread in the waterlogged parts of the valley-bottom systems dominated by sparse spruce-larch taiga. Pine-birch taiga dominates the most drained areas.
3. Research Methodology
The field work in the study area (
Figure 1) included establishing more than a dozen transects along the adjacent relief surfaces with the most diverse morpholithogenic conditions and soil-vegetation cover. The transects covered the most typical permafrost and non-permafrost landscapes. Along the transects, test geobotanical sites (100 m
2) were established, where the compositions of forest stands and ground cover were described in detail. Tree species were counted, and tree height and diameter (at 1.5 m height) were measured and averaged. Collected data were used to calculate phytomass stocks of forest stands using the formula from [
32]:
where y is phytomass, k and b are empiric coefficients for the stemwood fraction of phytomass. An example of the structured data, as well as the calculated values, are presented in
Table 1. The most contrasting parameters of woody plants were selected to represent the data in this format. Thus, the primary data and the calculated values of the phytomass stocks of the forest stands demonstrate the obvious differences between landscapes with varying degrees of influence of cryogenesis processes. The phytomass stocks of forest stands were calculated, which were then compared with the obtained remote sensing data. The presence of permafrost was identified using visually pronounced characteristics and established methods typical of permafrost systems for the study area [
19,
22,
33,
34], some of which are shown in the pictures (Figures 6–8) presented in the sections below. The natural ecosystems along the transects were examined for the evidence and features of past fires. The thickness of the seasonally thawed layer at the observation points was estimated with both a probe, and also visually, in pits and soil cross-sections.
Remote sensing data were used to extrapolate the results of field survey at the observation sites. Image processing and profile construction were carried out employing QGIS software [
35]. We used Landsat-8 Level-2 Science Products (L2SP) satellite images (with radiometric, geometric and atmospheric correction) obtained during the active growing season (July, August) and summer periods with consistently high air temperatures in 2013, which allowed us to obtain values for LST and vegetation indices (NDVI and NDMI). Cloudless Landsat-8 scenes (
Table 2), taken around noon, were selected for the study territory, which ensured the maximum contrast of the obtained thermal data.
Landsat-8 level 2 images (Science Products, L2SP) include scenes reduced to the surface reflectance for bands 1–7 of the OLI survey system and data on the surface temperature for band 10 (10.60–11.19 µm) of the TIRS survey system. The Land Surface Reflectance Code (LaSRC) algorithm was used to obtain atmospherically corrected data from the OLI system. To obtain LST, a single channel algorithm was used, which was applied to channel 10. The adjustment process used by the USGS is described in more detail in [
36,
37].
The data on surface temperatures provided by USGS require multiplication by a scale factor and the use of an additive offset. These values were provided in the accompanying documentation and the metadata. After such manipulation, the Kelvin temperatures were converted to the temperature in Celsius. Thus, the cartographic images of LST were created, rendered in the same color scheme. The images were used to build temperature profiles, and the values of LST were derived in the points of field-descriptions. The relative accuracy of temperature measurements for Landsat 8 TIRS is 0.5 °C.
Normalized Difference Vegetation Index (NDVI) was calculated using the red (0.64–0.67 µm) and infrared spectral bands (0.85–0.88 µm) as:
This index is sensitive to the chlorophyll content in leaves and correlates with phytomass, varying in a range from −1 to 1.
Normalized Difference Moisture Index (NDMI) was calculated using the near infrared and shortwave infrared (1.57–1.65 µm) spectral bands as:
This index is sensitive to the moisture content in the land cover and correlates with the plant moisture, varies in the range from −1 to 1.
The spatial resolution of Landsat L2SP images is 30 m, Thus, the calculated values of vegetation indices (NDVI and NDMI) and LST characterize the sites with the areas of 900 m2.
A more specific analysis of the results of remote sensing data was conducted for the transects that cross the main hypsometric levels along which the detailed landscape-ecological studies were carried out. Four thermal profiles (labeled “A”, “B”, C”and “D”) were drawn on the LST map along the landscape transects crossing the main hypsometric levels (Figure 2). Along these jagged lines, LST (°C) are indicated for the points of the landscape descriptions and the adjacent areas. The thermal characteristics along each profile were compared with the calculated values of the vegetation indices (Figure 4). The field-studies information allowed us to analyze the processed remote sensing data in terms of landscape-ecology (i.e., for the identification of intercomponent interaction).
4. Results and Discussion
Use of LSTs as an indicator of forest growth conditions (including geocryological) relies on the idea that the obtained values are the crucial indicators of the homeostatic (i.e., environment sustaining) functions of the forest [
1,
4]. In the southern cryolithozone, forest environment-sustaining potential is defined to a large extent by permafrost and the level of its impact on ecosystems, which is demonstrated below with the help of analysis of remote sensing data coupled with field observations.
The map of LSTs based on the remote-sensing data is presented in
Figure 2. The calculated values of LST reflects the surface net radiation and its partitioning into sensible, latent and soil heat fluxes [
19,
38]. The brown shade marks the “warmest” natural permafrost landscapes where permafrost is close to the surface (up to 50 cm), which weakens forest ecosystems and thus inhibits their homeostatic (e.g., insulating) functions. As a result, the LSTs rise. Color saturation reflects the level of permafrost impact on forest growth conditions and on forest landscape and its structure—the higher color saturation pointing to the greater influence of permafrost.
In general, the impact of permafrost on boreal landscapes of southern cryolithozone includes increased water content of surface sediments, appreciable peat thickness, evidence of soil cryoturbation, abundance of cryogenic relief forms, distinct structure and composition of the vegetation cover (e.g., sparseness and suppression of stands, prevalence of sphagnum moss and dwarf birch in surface cover) (
Figure 3). The conceptual schematic representation in
Figure 3 illustrates the influence of permafrost on forest growth conditions. Due to the presence of permafrost acting as an aquiclude, this effect is manifested in the weakened drainage of surface sediments and soil, which contributes to the waterlogging of the territory and further loss of scarce heat resources. Consequently, an adverse hydrothermal regime is formed, which contributes to the slowdown of the biological cycle of matter and reduces the supply of soil with mineral nutrients. In addition, the elements of mineral nutrition are very poorly used by the roots of woody plants. This is explained by the fact that peat, which is very characteristic of permafrost-taiga landscapes, mineralizes slowly at low temperatures and a pronounced thermal deficit [
39]. All this limits phytomass growth. Note that these hydrothermal conditions are very characteristic of the continental types of the boreal cryolithozone, which occurs over vast geographic areas, whereas in extracontinental conditions, the biological productivity of permafrost-taiga landscapes in many cases is determined not only and not so much by thermal deficit, but by deficit of moisture [
40]. However, the extracontinental conditions are typical only of some areas of the East Siberian (Yakutian) taiga, which have no analogous landscapes in North America. This circumstance allows us to speak of a wide representation of correlations within the boreal permafrost zone, reflected in
Figure 3.
The thermal map contains four profiles (
Figure 2). The graphs in
Figure 4 reflect changes in LSTs and vegetation indices (NDVI and NDMI) which serve as the indicators of landscape bioproductivity. Analysis of this information allows assessment of interactions between these characteristics. The obtained results were verified using the field data on landscape structure and geocryological conditions.
Profiles “B” and “C” are the most diverse, whereas profiles “A” and “D” are more uniform. Thus, profile “A” mainly characterizes the forest-growth conditions of the upper planation surfaces—a relatively well drained habitats with lower values of LSTs. Pine-birch taiga dominates the most drained habitats. Profile “B” runs through varying hypsometric levels, including upper and lower planation surfaces, as well as through valley-bottom systems crossing pine-birch and predominantly dark-needle sparse forests. Profile “C” runs through more diverse forest landscapes (pine, pine-birch, sparse spruce-cedar-larch and spruce-larch, etc.), which is well reflected on the map of the distribution of LSTs (
Figure 2 and
Figure 5). Structurally and geomorphologically, the profile passes through the upper and lower planation surfaces that differ in the degree of moisture availability. Profile “D” runs through relatively similar landscapes of the valley-bottom systems and the lower planation surface with a higher degree of hydromorphism, lower phytomass, and the highest LSTs (
Figure 4). Sparse coniferous forests with thickets of dwarf birch in sphagnum bogs are the dominant ecosystems throughout this profile. In this case, it is the indicator of the widespread development of permafrost and a significant degree of its influence on the state and functioning of landscapes.
Figure 4 indicates a high level of correlation between the calculated values of the vegetation indices (NDVI and NDMI) at different periods (16 July 2013, 17 August 2013, and 25 July 2013). This proves that the bioproductivity of various forest landscapes is correctly estimated, which is important because phytomass stocks define the surface net radiation rendered as thermal fields on the maps of LSTs. The graphs also show that less diverse, in terms of landscape conditions, profiles “A” and “D” (
Figure 4a,d) have more uniform values of LSTs. Profile “A” runs mostly through non-permafrost landscapes, whereas profile “D” runs though permafrost geosystems.
Correspondingly, the Pearson correlation coefficient calculated between the values of vegetation indices and LSTs for profile “A” is very low (
Table 3) because non-permafrost landscapes have the largest phytomass stocks, which leads to some decrease of thermal characteristics of forest ecosystems (
Figure 4a). The vegetation indices along profile “D” vary significantly. Thus, the Pearson correlation coefficient between the values of vegetation indices and LSTs calculated for profile “D” is distinctly negative (
Table 3). In this case, the correlation describes the situation when increase in thermal characteristics is due to decrease in the values of vegetation indices (
Figure 4d), which is associated with close-to-surface permafrost affecting landscape productivity.
Profiles “B” and “C” (
Figure 4b,c) present more diverse cases in terms of landscape conditions. Pearson coefficients have close values (
Table 3). We discuss, therefore, only profile “C”, as it characterizes greater diversity of forest landscapes (
Figure 4c).
We should also note that each vegetation index (NDVI and NDMI) demonstrates stable correlation not only between each other but also with the LSTs (
Table 4 and
Table 5).
Figure 4 shows contrast interaction between bioproductivity of landscapes (assessed indirectly through the values of vegetation indices) and their thermal characteristics calculated for three summer dates in 2013 (16 July, 25 July, and 17 July) with little cloudiness. The close-to-surface position of permafrost is manifested in lower values of vegetation indices and higher LSTs. These geocryological conditions are also manifested in landscape features (
Figure 6).
Figure 5 presents a large-scale fragment of the temperature map for the site crossed by profile “C” and shows the character of the identified spatial changes in the thermal fields. The red shade in the table shown in
Figure 5 highlights the points with the highest values of the LSTs. These points characterize the sites with close-to-surface permafrost (50–60 cm) and the distinct structure of the vegetation cover (
Figure 6).
A forest landscape with the highest fluxes of sensible heat (drier) has the lowest potential for moisture exchange and higher surface temperature [
1,
4,
19,
38]. Therefore, it is possible to make a comparative assessment of different forest types by their moisture exchange potential using the results of thermal infrared remote sensing data supported by field measurements. In this respect, our methodology considered the position developed by M.I. Budyko [
9], which states that the heat balance of the land surface can be expressed as R = LE + H, where LE is the heat of evaporation (latent heat flux), and H is the sensible heat flux from the underlying surface. Since LE is usually closely connected with the state and type of vegetation, the correlation we have established between the characteristics of the vegetation cover during the active vegetation period and the flux of sensible heat, manifested in the LST, is acceptable. These indicators of the heat balance of the Earth’s surface are widely used to assess the relationship between changes in the flux of sensible heat and temperature depending on the type and state of the vegetation cover [
41].
Applying this position to our study, we note that the vegetation cover of permafrost landscapes is visually distinct and, accordingly, has a unique structure (
Figure 6). Analysis of the LSTs (
Figure 4) coupled with the field-research data in the study region highlights the fundamental differences between permafrost and non-permafrost landscapes, which are manifested not only in the structure of vegetation cover, but also in bioproductivity characteristics along with specific features of other natural components:
- 1.
The largest phytomass stocks of forest stands (60–70 t/ha) and the highest NDVI values (about 0.35–0.40) are characteristic of landscapes conditionally considered non-permafrost (
Figure 6). Such landscape complexes are located on summit surfaces and drained slopes. The following is typical of these landscape units formed on thawed and mostly dry permafrost: upright woody vegetation, underlying rocks are close to surface, and low thickness of relatively well drained surface deposits. Such natural systems participate in most of the moisture exchange and phytomass production. In the study territory, these are pine-birch and birch-pine taiga ecosystems (
Figure 6).
- 2.
The lowest phytomass stocks of forest stands (35–45 t/ha) and the lowest NDVI values (about 0.15–0.2) are specific characteristic of permafrost landscapes (
Figure 6 and
Figure 7) on the floodplains of small rivers and poorly drained flat surfaces under sparse spruce-cedar-larch and spruce-larch taiga. The following key characteristics are typical of these landscape units: plant species impoverishment; suppression and sparseness of the stands; wide development of dwarf birch trees (yerniks); prevalence of sphagnum mosses, sedges, and blueberries in the ground cover; cryogenic disturbances of the daylight surface and characteristic microrelief (hummocks, presence of solifluction hole-breaks); cryoturbated soil profile, and increased waterlogging of soils and surface sediments. Forests have low site-productivity characteristics (
Figure 6). The presence of permafrost is the most important factor affecting site productivity as an indicator of habitat. The permafrost aquiclude is located at a depth of 25–50 cm. The influence of this factor is manifested not only in the formation of unfavorable forest conditions (poor drainage, development of permafrost), but also in the low biological cycle of matter, which affects the availability of plant nutrients [
40].
Various studies on forest hydrology [
42] have assessed the influence of site productivity class on the “weight” of transpiration in evapotranspiration [
16]. The presence of permafrost in the sporadic cryolithozone is the most important factor that impacts the site-productivity characteristics of forest stands as an indicator of habitat. It is well known that transpiration plays a major role in evapotranspiration [
43], and depends on stocks of phytomass of the stand. Thus, the higher the biological productivity of a landscape, the greater the share of circulating moisture in the internal hydrologic cycle and in phytomass production [
44]. Such natural systems are less vulnerable to heat stress, since they most fully realize their fire-resistance potential. On the contrary, permafrost-taiga landscapes with close-to-surface permafrost (up to 50 cm) are the sources of increased fire hazard in summer periods with prolonged droughts because, apparently, they do not play the role of fire-protective barriers. This is due to their low transpiration potential and thus their low contribution to heat and moisture exchange. Within their range, we encountered abundant evidence of past and different-years fires (
Figure 7).
In the course of experimental studies, Galenko [
45] found that in sparse forests on days with low cloudiness, the flux of sensible heat is high on average and is comparable to the heat of evaporation. In prolonged periods with dry weather, such landscapes with large intercrown gaps warm up and dry up faster and, as a result, moisture availability decreases. This is precisely the reason for the high fire susceptibility of permafrost-taiga landscapes. It should be noted also that a certain role in this belongs to peaty soils, which mineralize when dry, since a decrease in the relative humidity of air by 50% increases the fire hazard due to the drying out of the available combustible materials [
46]. However, the thickness of the seasonally thawed layer, even in the driest summer seasons, does not exceed 25–30 cm, which to some extent mitigates this situation (
Figure 8). In this context it is reasonable to mention that forest scientists note a noticeable decrease in moisture content of tree tissue if forest growth conditions worsen. This situation may exacerbate fire susceptibility of permafrost taiga landscapes [
47].
Thus, the combination the factors discussed above, along with weather conditions, determines fire susceptibility of the permafrost-taiga landscapes. The stronger the effect of cryogenesis on taiga landscapes, the higher their vulnerability to fires under adverse types of weather (long dry periods). For example, in central Siberia, over the past three decades, the maximum level of fire hazard was observed in the areas with continuous permafrost [
48]. These territories are the most vulnerable to thermal stresses. Along with a noticeable effect of weather conditions on the state of permafrost-taiga landscapes, the opposite is also true, i.e., forest fires significantly influence regional weather conditions, as evidenced by the results of modeling and numerical experiments [
49].
Analysis of thermal infrared images and generalization of the results of field studies [
42] demonstrated that the distribution of the intensity of thermal radiation depends on phytomass stocks derived via NDVI. Consequently, forest conditions have an indirect effect on the temperature conditions of forests [
50]. Therefore, we can consider the surface temperature as the most important indicator of the state and structure of the vegetation cover [
7,
51]. It is important to note that the most distinct representation of the surface temperature distribution, which better reflects the biogeophysical structure, is obtained in hot-summer weather (with an average daily air temperature of about 20 °C or above). The reliability of our results is supported mainly by the similarity with the data on the forests of the European North of Russia, obtained in a different way, that required numerous initial indicators [
42]. Consequently, increase in phytomass is the most important indicator of the hydrological role of forests [
1,
6] attesting to the potency of the moisture regulating function of the landscape. Therefore, even a rough idea about moisture exchange can be the most important criterion for assessing the ecological role of forest stands in the cryolithozne.


