Abstract
The Doppler characteristics of sea surface echoes reflect the time-varying characteristics of the sea surface and can be used to retrieve ocean dynamic parameters and detect targets. On airborne, spaceborne and shipborne radar platforms, radar moves along with the platforms while illuminating the sea surface. In this case, the area of the sea surface illuminated by radar beam changes rapidly with the motion, and the coherence of the backscattered echoes at different times decreases significantly. Therefore, the Doppler characteristics of the echoes would also be affected by the radar motion. At present, the computational requirements needed to simulate the Doppler spectrum of the microwave scattering field from the sea surface based on numerical methods are huge. To overcome this problem, a new method based on the sub-scattering surface elements has been proposed to simulate the Doppler spectrum of sea echoes acquired by a moving microwave radar. A comparison with the results evaluated by the SSA demonstrate the availability and superiority of the new method proposed by us. The influences induced by radar motion, radar beamwidth, incident angle, and thermal noise on the Doppler characteristics are all considered in this new method. The simulated results demonstrate that the spectrum bandwidth of sea surface echoes acquired by radar on the dive staring motion platform becomes somewhat narrower.
1. Introduction
The Doppler characteristics of sea echoes reflect the time-varying characteristics of the sea surface, which is very important in the field of sea state parameter inversion and target recognition. In the area of ocean remote sensing, Doppler characteristics are widely used to invert sea surface wind field, sea surface current, and sea wave spectrum [1,2,3,4,5,6,7]. In recent decades, the extensive application prospect encouraged many researchers to study the Doppler characteristics of sea echoes, experimentally as well as theoretically. In 1955, Crombie [8] first discovered the Doppler characteristics of sea surface echoes of a high-frequency (HF) radar. Barrick [9] derived the spectral model of sea echoes of an HF ground wave radar using the electromagnetic scattering perturbation method. This model is still used by many scholars in the wave inversion algorithm of ground wave radar. In terms of theoretical research, based on the modified two-scale model (TSM), Zavorotny and Voronovich [10] calculated the upwind and downwind Doppler spectrum from the sea surface and compared the experimental data. However, the Bragg scattering mechanism is insufficient to describe sea surface scattering when the incident angle is less than 20°. Toporkov and Brown [11,12] studied the spectrum characteristics of linear and weakly nonlinear sea echoes based on Kirchhoff, the first-order small-slope approximation theory (SSA-1), and method of moment (MoM), respectively. In terms of experimental observation, Walker [13] observed the spectral characteristics of C-band echoes based on a wave tank experiment, and found that the Doppler shift in horizontal polarization (HH-pol) echo was larger than that of the vertical polarization (VV-pol) echo. In recent years, based on these theoretical models (TSM, SSA), Wang and Zhang [14,15,16,17,18] discussed the impacts of the tilt and hydrodynamic modulations on the Doppler spectrum of sea echoes. They pointed out that the tilt modulation of the larger-scale waves is the main reason for the difference in Doppler shift between the HH- and VV-pol echoes. Rozenberg [19,20] analyzed the Doppler shift characteristics of the echo spectrum in upwind and downwind observations through wave tank observation experiments. Corretja [21] conducted a comparative study of the Doppler characteristics of various models under different wind speeds. Lee [22] studied the wind direction dependence of the Doppler spectrum based on the measured X-band shore-based radar data. Based on airborne X-band radar data, Rosenberg [23] established a Doppler spectrum model at high grazing angles, with two components representing the slow Bragg and the fast-non-Bragg scattering.
However, most studies on the Doppler characteristics of sea echoes are based on a relative stationary platform and there is little research on the Doppler spectrum characteristics of microwave sea echoes acquired by radar on a motion platform. Xiaobo Luo [24] proposed a sea clutter simulation method for missile-borne radar. In 2017, McDonald [25] used the two-component clutter model to simulate the backscattered sea echoes acquired on an airborne platform and briefly analyzed the Doppler characteristics of sea echoes. However, the above studies are based on the use of empirical statistical models for modeling and simulation of sea echoes, and lack a physical basis. Moreover, their methods were not used to carry out detailed research on the influence mechanism of platform motion on radar sea surface echoes. Therefore, it is of great significance to model and simulate sea echo based on physical sea surface modeling combined with the character of the motion radar platform.
The common motion forms of a motion radar platform include horizontal motion and dive staring motion. The horizontal motion of the radar platforms will induce a change in the radar footprint at different times, which further causes the temporal decoherence of backscattered echoes. Therefore, this motion will not only cause a Doppler shift but also extend the spectrum bandwidth due to the rapid change in the sea surface illuminated by radar footprint. For a dive staring motion radar platform, in addition to the change in radar footprint, the change in the distance between radar and sea surface will also lead to a change in the local incident angles of each scattering element, which will affect the Doppler characteristics of sea echoes. Therefore, it is of great significance to analyze the Doppler characteristics of sea echoes based on sea surface simulation and the actual scene of the motion radar platform.
For a realistic simulation, the sea surface is a two-dimensional, electrically large target. A large amount of computation is needed to study the Doppler characteristics of sea surface echoes on stationary platforms. However, in a moving platform, more computation is required due to the rapid time-variance of the radar illumination area. To overcome this problem, a new method based on the sub-scattering surface elements is proposed to simulate the Doppler spectrum of sea echoes acquired by a moving microwave radar. In the method, the scattering field from the sea surface is represented as an appropriate superposition of the individual echoes from the separate sub-scattering surface elements. Here, the complex scattering field from each scattering surface element is reconstructed by employing the circular Gaussian hypothesis when the local normalized radar cross-section (NRCS) of the scattering surface element is obtained. At present, there are many theoretical and empirical methods for calculating the NRCS [26,27,28,29,30,31,32]. The validity of the TSM has been validated at moderate incidence angles by scatterometers and SAR data [33,34,35,36]. The tilt and the hydrodynamic modulations of large-scale waves can also be easily introduced in the TSM. Therefore, in the present work, the NRCS from each scattering surface element is calculated based on the TSM. After calculating the time series of the scattering fields, the Doppler spectrum is estimated using the periodogram method.
The remainder of this paper is organized as follows. Section 2 establishes a space–time model of the radar footprint when the radar is mounted on a dive staring motion platform or a horizontal motion platform. Section 3 uses the TSM to calculate the fully polarized microwave band’s normalized radar cross-section and evaluates the time series of the scattering field based on the circular Gaussian hypothesis and radar echo coherence. Section 4 verifies the method in this paper using the SSA results and compares the computational efficiency of the two methods. In Section 5, the Doppler characteristics of the scattering fields acquired by a radar using the dive staring motion and horizontal motion platforms under different system parameters and sea states are simulated and discussed. The conclusions and perspectives are provided in Section 6.
2. The Change in Radar Footprint with Platform Movement
When we observe a sea surface through a stationary radar, the Doppler shift and spectrum bandwidth of sea echoes are mainly caused by the sea surface movement. However, for a radar installed on the moving platform, the Doppler shift and spectrum bandwidth would also be affected by the movement of the platform. The dive staring motion (Figure 1a) and the horizontal motion (Figure 1b) are two common motion states of radar platforms. As shown in Figure 1a, for the dive staring motion platform, the radar footprint on the sea surface and the resolution unit contained in the footprint both change with the movement of the platform. In Figure 1a, the grey area represents the footprint at time , the yellow area denotes the footprint after a time lag . If the value of is large, the echoes from sea surface acquired at time and would be completely uncorrelated with each other [37]. In this work, time lag is set as the radar pulse repetition period. With the movement of the platform, in Figure 1a, we can see that the radar footprint gradually becomes smaller, and the resolution unit becomes mismatched (the shadow areas are represented by the red and green curves). In order to quantitatively describe the change in radar footprint with the movement of the platform, the relationship between the size of the footprint and the velocity of the platform is given below. In Figure 1a, the shape of the footprint can be approximated as an ellipse. The center of the ellipse is labeled by C. Assume that the initial altitude of the platform is and the flight speed of the platform is . Then, the slant range from the dive motion radar platform to the center point C at the time can be expressed as:
where is the incident angle. The widths of the radar footprint along the range and azimuth directions, i.e., and , can be expressed as:
where and denote the radar beam angles along the range and azimuth directions, respectively. For the horizontal motion radar platform, as shown in Figure 1b, the altitude of the platform is set as . Although the relative distance between radar and sea surface does not change, the spatial variation in the footprint will also have a great impact on the Doppler characteristics of sea echoes. The slant range can be expressed as:
similarly, the footprint of the horizontal motion radar platform can also be expressed as:
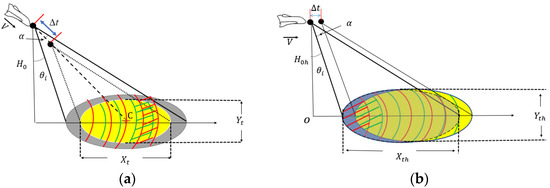
Figure 1.
The changes in the radar footprint with time: (a) the dive staring motion radar and (b) the horizontal motion radar. (The gray area denotes the footprint at the previous time, and the yellow area is the footprint at the later time. The red and greens lines represent the radar range gates at the previous and the later time, respectively).
The sea surface in the area of the radar footprint is simulated by the linear filtering method [38]. According to linear theory, the sea surface can be described as the sum of a large number of harmonics with different amplitudes, frequencies, and random phases. When using the linear filtering method for sea surface simulation, the sampling intervals and depend on the dimensions of the simulated sea surface (if the dimensions of the sea surface are and , we set and ). Therefore, in the actual simulation, a large-scale, two-dimensional sea surface is simulated first to avoid the frequency leakage effect. Then, according to the size of the footprints calculated by Equations (2), (3), (5) and (6), an ellipse is approximated in the center of the simulated sea surface as the actual irradiation area of the radar. It should be noted that, according to the sub-scattering surface facet method, the spatial scales of the surface facet, i.e., and , are much less than the range resolution of the radar. In this work, we set . Here, denotes the range resolution of the radar, is the lightspeed in vacuum, and is the bandwidth of the radar. After the sea surface simulation, as shown in Figure 2, the sea surface in the footprint is intercepted according to the actual footprint area.
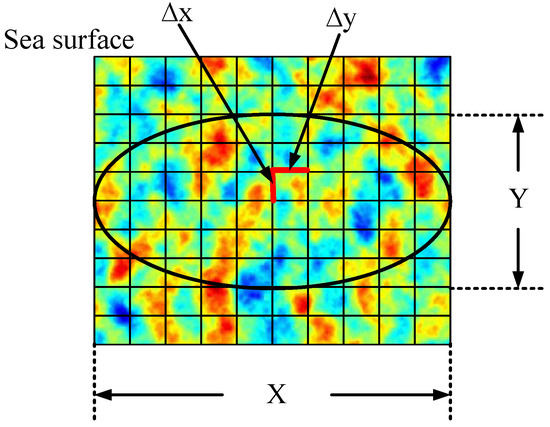
Figure 2.
Sea surface intercepted by radar footprint (The black ellipse represents radar footprint).
3. The Incoherent Scattering Field Acquired by a Moving Radar
For a moving radar platform, the change in incidence angle and the mismatch of the radar resolution with time will induce a completely incoherent scattering field, which would lead to random spectral noise in the Doppler spectrum of the scattering fields. It is assumed that the scattering field of a statical target acquired by a moving radar consists of two parts, i.e.,
where and denote a completely coherent scattering field and the completely incoherent scattering field, respectively. In this case, the complex correlation coefficient between and can be expressed as
where the symbol “” represents the complex conjugation. means ensemble average. is the mean phase difference between and ; denotes the time lag. is the imaginary unit. is the absolute value of the complex correlation coefficient and can be expressed as
From Equation (9), the intensity of the coherent scattering field and the incoherent scattering field can be obtained by
As shown in Equation (11), if the absolute value of the correlation coefficient induced by the completely incoherent scattering field is estimated, the intensity of the incoherent scattering field can be evaluated using the total scattering field. Then, the random spectral noise caused by the incoherent scattering field of the Doppler spectrum is obtained. For a moving radar, the completely incoherent scattering field is mainly induced by the change in incident angles and the mismatch of the radar resolution. If these two factors are considered, the correlation coefficient in Equations (9)–(11) can be expressed as
where and correspond to the decorrelations induced by the change in incident angle and the mismatch of the radar resolution, respectively. In the following, the values of and are analyzed individually.
3.1. The Correlation Coefficient
For the dive staring radar platform, the local-incident angle at each range resolution changes with the movement of the platform, except for the range resolution at the gaze center. The change in incidence angle has some influence on the correlation coefficient. Because the size of the range resolution is generally small, the incidence electromagnetic beam can serve as an approximate plane wave at each sub-scattering surface element. In this case, the correlation coefficient induced by the change in incidence angle can be expressed as [39]:
where , , is the wavenumber of the incident electromagnetic wave. The subscripts ‘’ and ‘’ denote ‘H (Horizontal)’ or ‘V (Vertical)’ polarizations. is the incidence angle, denotes the variation in the incidence angle. The values of in the footprint for different radar platform speeds are shown in Figure 3. Here, the central incidence angle of the radar beam is , the radar beam width is 4°, and the initial height is set to 3 km. The pulse repetition rate is 400 Hz (i.e., the time lag ). As shown in Figure 3, the value of increases with platform speed. The values of also increase with the distance from the gaze center along the range direction. Although the change in incident angle is still very small when the speed of the platform reaches 1000 m/s, its effect on the correlation coefficient cannot be neglected if the size of the range resolution and the value of the wavenumber are both large. For example, a Ku-band radar platform flying at 500 m/s has a range resolution of 50 m, in which case the correlation coefficient of the non-staring center can be reduced to 0.87.
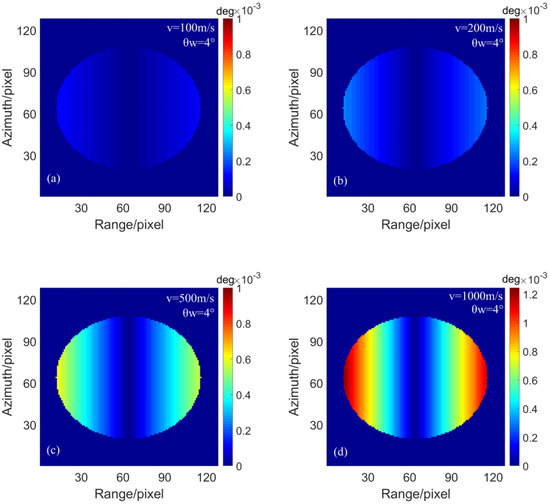
Figure 3.
The change in the incident angle of facets for different platform speeds: (a) 100 m/s, (b) 200 m/s, (c) 500 m/s, (d) 1000 m/s.
3.2. The Correlation Coefficient
Whether a dive staring motion radar platform or a horizontal motion radar platform are used, the motion of the platform will cause a mismatch of the range resolution unit. Only the scattering fields from the overlapping region of the range resolution units before and after a pulse repetition period are considered to be correlated [40]. The correlation coefficient induced by the mismatch of the range resolution unit is as follows [39]:
where is the mismatch error along the distance direction of the range resolution units before and after a pulse repetition period. Figure 4 shows the change in correlation coefficient induced by the mismatch error for the dive staring radar platform and the horizontal motion radar platform. The radar pulse repetition rate is set as 400 Hz and the incident angle is 30°. It can be seen that the influence of the mismatch error on the correlation coefficient increases with the increase in platform speed. Moreover, for the dive staring radar platform, the further away the platform is from the gaze center, the more significant the influence of the mismatch error on the correlation coefficient. From Figure 4b, we can also see that the values of the correlation coefficient induced by the mismatch decrease with the radar bandwidth (radar resolution).
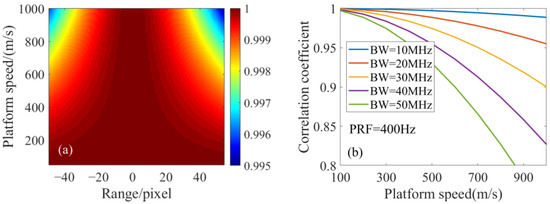
Figure 4.
Change in correlation coefficient of registration with platform speed: (a) dive staring motion radar, (b) horizontal motion radar.
3.3. The Time Series of Scattering Field from Sea Surface
At present, numerical methods (MoM, FBM) and approximation methods (KA, SSA) are often used to calculate the time series of the backscattering field from sea surface, and then the Doppler spectrum is obtained using the periodogram method. However, for a realistic simulation, the sea surface is always an electrical large-scale target, and the computational requirements to obtain the time series of the backscattering field using numerical and the approximation methods are significant. To solve this difficulty, we calculate the time series of the backscattering field by employing the circular Gaussian hypothesis and the facet-based method. In order to obtain the scattering field from each sub-scattering surface facet, the sea surface profile, the slope of the sea surface along the range direction and the line-of-sight velocity of each surface facet should be simulated first. Based on the linear filtering method [38], the sea surface profile, the slope of the sea surface along the range direction and line-of-sight velocity can be expressed as
where and denote the widths of the simulated sea surface along the x- and y-axis direction; and are the sampling points. is the velocity transfer function. is the sea wave number; and are the wavenumber components in the x-axis and y-axis directions, . represents a random phase that is uniformly distributed in . is the Fourier transform coefficient, which can be expressed as:
where is the two-dimensional wave spectrum in the Cartesian coordinate. In this paper, the two-dimensional Elfouhaily wave spectrum is employed [41]. is a random number that follows a standard normal distribution.
For the microwave scattering field of the sea surface, the hydrodynamic modulation induced by large-scale waves would modulate the intensity of the scattering field from each scattering facet. If the effect of the hydrodynamic modulation is considered, the RCS of each scattering facet can be written as
where is hydrodynamic modulation function [42], i.e.,
where is a complex vector representing feedback. is the relaxation rate that has to be determined through experiments. Unfortunately, the value of the relaxation rate is still poorly known; the values estimated by various investigators differ by almost one order of magnitude [43]. As discussed in [44], for , the maximum shortwave energy appears at the crest of the large-scale wave. However, in fact, there is a non-vanishing phase shift between the maximum energy of the shortwave spectrum and the large-scale wave crest, so the maximum energy of the short wave appears in front of the long wave. In this paper, we follow the results of [43] and set the non-vanishing phase shift to (i.e., ). Here, denotes the angle frequency of the spectral peak wave. is the RCS of each scattering facet, evaluated based on the Bragg theory:
Here, denotes the NRCS evaluated by the TSM method, which has proved useful in calculating the scattering coefficient from sea surface at moderate incidence angles. The expressions of for different polarization cases are as follows:
where the two wavenumber components of Bragg resonance waves are and ; is the local incident angle, ; and are the angles of the tilting surface in and perpendicular to the radar incidence plane, respectively. and are defined as:
where is the relative dielectric constant of seawater. In the present work, the value of is evaluated by the Debye equation [45].
According to the analysis in Section 2, the change in incidence angle and the mismatch of the resolution unit would induce random phase differences between the scattering fields obtained at different times. For the incoherent scattering field caused by the change in incidence angle and the mismatch of resolution facet, its intensity can be estimated by Equation (11). Therefore, using Equations (10), (11) and (19), the intensities of the coherent and the incoherent fields be calculated by
and
respectively. Here, is the RCS calculated by Equation (19).
After obtaining and , the initial complex scattering field from each sea surface facet can be reconstructed based on the following two hypotheses: (1) the complex scattering fields of spatially separated sea surface facets are uncorrelated with each other [46]; (2) the complex scattering fields satisfy the circular Gaussian hypothesis [47]. Then, the initial complex scattering fields from each sub-scattering surface facet can be obtained as
where and are the random numbers that satisfy a complex circular Gaussian random distribution, whose expectations are both 0, and whose variances are and .
Because the orbital velocity induced by the small scale-waves within the sub-scattering surface facet is very small, the influence of the small scale-waves on the Doppler spectrum can be neglected. Only the orbital velocity of the underlying large-scale waves is considered in the following. Then, the phase difference of the complex scattering fields from the sub-scattering surface facet acquired at an adjacent moment can be expressed as:
where denotes the change in slant distance caused by the platform movement and is the platform speed in the radar look direction. is the angle between the wind and the radar range directions. When the wind direction is along the range direction, the angle is equal to 180°, and when the wind direction is along the azimuth direction, the angle is equal to 90°. is the orbit line-of-sight velocity calculated by Equation (17). The surface drift velocity is often empirically set to . denotes the wind field at a height of 10 m above the sea surface. Bragg wave phase velocity can be expressed as:
However, for complex incoherent scattering fields , the phase difference between and can be considered as a random phase difference, which is uniformly distributed between intervals .
In addition to the variation in RCS at adjacent moments caused by the time-varying characteristics of the sea surface, for the dive staring motion radar platform, the change in the distance between the radar and the sea surface also has an influence on the radar’s received power. Based on the radar equation, the received radar power can be expressed as:
where is the radar receiving power, is the radar transmitting power, and is antenna gain. It can be seen from Equation (28) that the power of the scattering field from the scattering facet is inversely proportional to the quartic of the distance. Taking into account the effects of radar thermal noise, the scattering field at each moment can be expressed as:
where , is the azimuth length in the actual radar footprint area. is the initial oblique distance for the dive staring motion radar. For the horizontal motion radar platform, the slant range is constant when the radar parameters are determined. is radar thermal noise that does not vary with oblique distance. denotes the equivalent RCS of the thermal noise.
After calculating the time series of the radar signal, the periodogram method is used to estimate the Doppler spectrum. The Doppler spectrum calculated by the periodogram method is obtained as:
where T is the sampling time length of the scattering field.
Traditionally, the two spectral parameters are of the most interest: the Doppler shift and the spectrum bandwidth. The former is defined as a centroid frequency shift:
and the Doppler spectrum bandwidth can be defined by:
4. Validation of the Method
The SSA proposed by Voronovich [28] has been proved to be an effective approximate analytical method for evaluating the electromagnetic scattering of the sea surface [48,49]. To verify the validity of the method proposed by us in this work, the calculation results of our method were compared with those calculated by SSA-1 and SSA-2. Detailed parameter settings are shown in Table 1. Radar frequency and environmental parameters were common, while other parameters are empirically set. The radar platform has a horizontal motion; the platform speeds were 0 m/s (stationary state), 50 m/s and 200 m/s respectively. For comparison, the normalized Doppler spectrum calculated by SSA-1 and our method are given in Figure 5. The result is an average of 80 samples. When the platform velocity is 50 m/s and 200 m/s, the display result is the result of spectrum aliasing, because the Doppler display range is limited by the pulse repetition frequency. Maximum unambiguous Doppler frequency is consequently 50 Hz. The comparison shows that the results simulated by our method are in good agreement with the results of SSA in both co-polarization and cross-polarization.

Table 1.
System simulation parameters of horizontal motion radar.

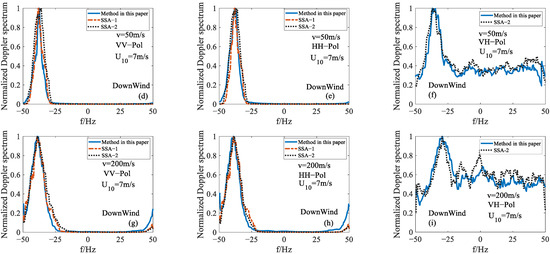
Figure 5.
The normalized Doppler spectrum calculated by SSA and our method with different polarizations in the L-band acquired on a horizontal motion radar platform: (a–c) 0 m/s, (d–f) 50 m/s, (g–i) 200 m/s.
In addition, Table 2 compares the time consumption of the proposed method and SSA under the same parameters, and the computer is configured as AMD Ryzen R5-4600H 3.0 GHz. It can be seen from the table that the computational efficiency of the method proposed in this paper is significantly improved compared with that of the SSA method.

Table 2.
Comparison of computational efficiency between the proposed method and SSA.
5. Analysis of Simulation Results
Since the radar pulse repetition frequency is finite, a spectrum aliasing effect would be caused by the platform speed. Therefore, in order to make the spectra for different platform speeds comparable, it should be noted that the influence of platform speed on Doppler shift has been neglected in the following discussions. In this section, we mainly discuss the simulation results of sea echoes acquired on a dive staring radar platform. The system parameters of the dive staring motion radar are shown in Table 3. The commonly used Ku band is selected, the bandwidth and PRF are also common, and other parameters are empirically set. Here, the two-dimensional Elfouhaily wave spectrum is used for sea surface simulation.

Table 3.
System parameters of dive staring motion radar.
Figure 6 shows the influence of platform speed on Doppler spectrum characteristics at different polarizations. The platform speeds were set as 0 m/s, 100 m/s, 500 m/s, respectively. Here, the initial height of the platform was 3 km. The radar beam width was 2°, and the incident angle was 30°. The thermal noise level was set as −40 dB. For sea surface parameters, wind direction was set as 180°, and wind speed was 7 m/s. From Figure 6, it can be seen that the Doppler spectrum bandwidth decreases with the platform speed. The first reason for the decrease in bandwidth is that the decreasing distance from the radar and sea surface results in the enhancement of scattering intensity and increases SNR. The second reason is that, as the platform gets closer to the sea surface, the area illuminated by the radar beam also gradually decreases, which will lead to a decrease in the scattering surface elements contained in the resolution unit. It can also be seen that the spectrum bandwidth of vertical polarization and horizontal polarization is much smaller than that of cross-polarization, because the small sea surface scattering coefficient of cross-polarization leads to a low SNR. For the Doppler shift , it can be seen that as the platform flight speed increases, the Doppler shifts (absolute value) for HH-polarization are somewhat larger than those corresponding to VV-polarization because the HH-polarization scattering field is more sensitive to the tilt modulation of larger-scale waves. However, the Doppler shifts for cross-polarization echoes are contaminated by background noise and their values are not credible.
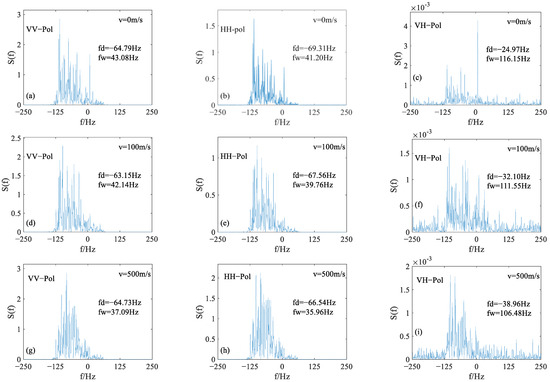
Figure 6.
The influence of platform speeds on Doppler spectrum characteristics of the scattering fields acquired by a dive staring motion radar with different polarizations: (a–c) 0 m/s, (d–f) 100 m/s, (g–i) 500 m/s.
In order to show the effect of platform height on the Doppler spectrum bandwidth, the simulated Doppler spectra for different initial platform heights are shown in Figure 7. Here, the diving speed of the platform is 100 m/s. Other parameter settings are the same as those in Figure 6. One can see that the bandwidth of the Doppler spectrum increases with the initial height of the platform.
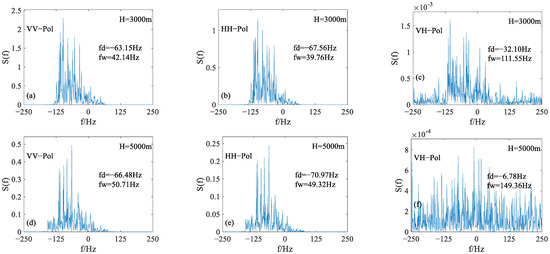
Figure 7.
The Doppler characteristics of sea surface echo at different initial heights: (a–c) 3000 m, (d–f) 5000 m.
For the dive staring motion radar platform, beam widths will also affect the Doppler characteristics. Figure 8 shows the influence of beam width on a short-time Doppler spectrum at different polarizations. The radar beam widths are set as 1°and 3°, respectively. The speed of the platform is 100 m/s. Other parameter settings are the same as those in Figure 6. It can be seen from the short-time Doppler spectrum that, with the increase in beam width, the spectrum bandwidth clearly increases. This is because the increase in beam width will increase the area of the sea surface illuminated by radar beam. In the resolution unit, the variance in the velocity of scattering elements would also increase with the beamwidth.
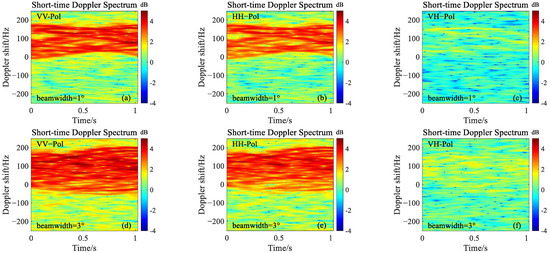
Figure 8.
The influence of beam width on short-time Doppler spectrum characteristics at different polarizations: (a–c) the beam width is 1°, (d–f) the beam width is 3°.
Figure 9 shows the Doppler characteristics of sea surface echoes at different incident angles. The incident angles are 30°and 50°, respectively. The beamwidth is 3°. The speed of the platform is 100 m/s. Other parameter settings are the same as those in Figure 6. It can be seen that the Doppler spectrum bandwidth increases with the increase in incident angle because the SNR decreases due to the decrease in RCS with the increase in incident angle.
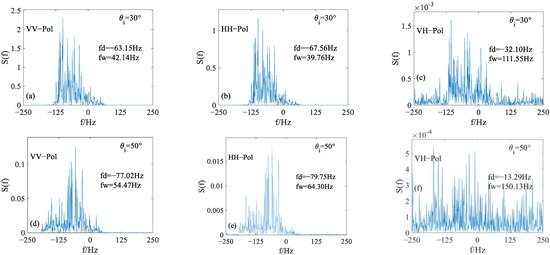
Figure 9.
The Doppler characteristics of sea echoes at different incident angles: (a–c) 30°, (d–f) 50°.
We also compare the simulation results at different incident wave frequencies. Figure 10 shows the comparison results at three microwave bands (C-band, X-band and Ku-band, respectively). The speed of the platform is 100 m/s. Other parameter settings are the same as those in Figure 6. It can be seen that the Doppler spectrum bandwidth and Doppler shift increase with the incident wave frequency, and the simulation results are in agreement with the classical Bragg theory at a moderate incident angle.
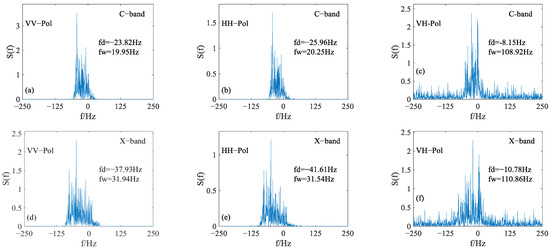

Figure 10.
The Doppler characteristics of sea surface echo at different radar frequencies: (a–c) C-band, (d–f) X-band, (g–i) Ku-band.
Radar bandwidth is also a influence factor. Figure 11 shows the simulation results at different bandwidths. The bandwidths are 100 Mhz and 50 MHz, respectively. The speed of the platform is 100 m/s. Other parameter settings are the same as those in Figure 6. As can be seen from the figure, the Doppler spectrum width decreases with the increase in bandwidth.
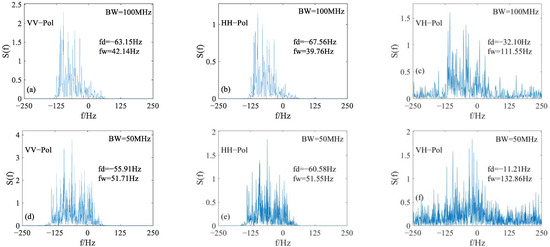
Figure 11.
The Doppler characteristics of sea surface echo at different bandwidths: (a–c) 100 MHz, (d–f) 50 MHz.
Figure 12 shows the Doppler spectrum at different wind speeds. It is not difficult to see that, regardless of polarization, the Doppler spectrum bandwidth of sea surface echoes increases with the increase in wind speed. This is because the increase in sea surface wind speed will lead to an increase in sea surface roughness. As a result, the velocity distribution of each scattering point in the resolution facet becomes more discrete, which induces the wide Doppler spectrum bandwidth. For the Doppler shift, the absolute values of the Doppler shift also increase with wind speed.

Figure 12.
The Doppler power spectrum at different wind speeds ranging from 5 m/s to 15 m/s: (a) VV-Pol, (b) HH-Pol, (c) VH-Pol.
Figure 13 shows the Doppler spectrum for different wind directions. The wind speed is 7 m/s. The positive and negative Doppler shifts correspond to upwind and downwind directions, respectively. When the radar moves along the crosswind direction, the Doppler shift is almost equal to 0 Hz. The spectral curves also demonstrate that the spectrum width for upwind or downwind directions is somewhat larger than that corresponding to the crosswind direction.

Figure 13.
The Doppler power spectrum in different wind directions of different polarizations: (a) VV-Pol, (b) HH-Pol, (c) VH-Pol.
6. Conclusions
In this paper, we proposed a new method to simulate the time series of the complex microwave scattering field from the sea surface, acquired by a moving radar. The comparisons with the results evaluated by the SSA demonstrate the availability and superiority of the new method proposed by us. In this work, we simulated the sea surface echoes under different platform speeds, incident angles, radar beamwidths, radar frequencies, bandwidths, wind speeds, and wind directions. Moreover, we analyzed the effects of these factors on the characteristics of sea echoes’ Doppler spectral. We found that the spectrum bandwidth of sea surface echoes acquired by the radar on the dive staring motion platform becomes somewhat narrower. With the increase in the height and incident angle of the radar platform, the Doppler shift and spectrum bandwidth obviously increase. In addition, the Doppler shift and spectrum bandwidth increase with wind speed. The effect of wind direction on Doppler shift is negative for downwind and positive for upwind, and the crosswind is close to 0 Hz. The conclusions obtained in this paper have reference significance, as they can further understanding of the multidimensional characteristics of sea surface echoes acquired on moving radar platforms.
Author Contributions
Conceptualization, Y.W., Y.Z. (Yushi Zhang) and X.L.; methodology, P.D. and Y.W.; formal analysis, Y.Z. (Yanmin Zhang) and J.C.; writing—original draft preparation, P.D. and Y.W.; writing—review and editing, P.D., Y.W. and Q.L. All authors have read and agreed to the published version of the manuscript.
Funding
This research was funded by the National Natural Science Foundation of China under Grant No. 41976167 and 42376176.
Data Availability Statement
Data availability is not applicable to this article as no new data were created or analyzed in this study.
Conflicts of Interest
The authors declare no conflict of interest.
References
- Chapron, B.; Collard, F.; Ardhuin, F. Direct measurements of ocean surface velocity from space: Interpretation and validation. J. Geophys. Res. Ocean. 2005, 110, 07008. [Google Scholar]
- Zamparelli, V.; De Santi, F.; De Carolis, G.; Fornaro, G. SAR Based Sea Surface Complex Wind Fields Estimation: An Analysis over the Northern Adriatic Sea. Remote Sens. 2023, 15, 2074. [Google Scholar]
- Mouche, A.A. On the Use of Doppler Shift for Sea Surface Wind Retrieval From SAR. IEEE Trans. Geosci. Remote Sens. 2012, 1, 2901–2909. [Google Scholar]
- Johnson, J.T.; Burkholder, R.J.; Toporkov, J.V.; Lyzenga, D.R.; Plant, W.J. A Numerical Study of the Retrieval of Sea Surface Height Profiles from Low Grazing Angle Radar Data. IEEE Trans. Geosci. Remote Sens. 2009, 47, 1641–1650. [Google Scholar]
- Hwang, P.A.; Sletten, M.A.; Toporkov, J.V. A note on Doppler processing of coherent radar backscatter from the water surface: With application to ocean surface wave measurements. J. Geophys. Res. 2010, 115, C03026. [Google Scholar]
- Chae, C.S.; Johnson, J.T. A Study of Sea Surface Range-Resolved Doppler Spectra Using Numerically Simulated Low-Grazing-Angle Backscatter Data. IEEE Trans. Geosci. Remote Sens. 2013, 51, 3452–3460. [Google Scholar]
- Sergievskaya, I.; Ermakov, S.; Plotnikov, L.; Kapustin, I.; Kupaev, A. On a Problem of Marine Current Velocity Estimation from Microwave Radar Data. Water 2023, 15, 1153. [Google Scholar]
- Crombie, D.D. Doppler Spectrum of Sea Echo at 13.56 Mc./s. Nature 1955, 175, 681–682. [Google Scholar]
- Barrick, D. First-order theory and analysis of MF/HF/VHF scatter from the sea. Antennas Propag. IEEE Trans. 1972, 20, 2–10. [Google Scholar]
- Zavorotny, V.U.; Voronovich, A.G. Two-scale model and ocean radar Doppler spectra at moderate- and low-grazing angles. Antennas Propag. IEEE Trans. 1998, 46, 84–92. [Google Scholar]
- Toporkov, J.V.; Brown, G.S. Numerical Simulations of Scattering from Time-Varying, Randomly Rough Surfaces. IEEE Trans. Geosci. Remote Sens. 2000, 38, 1616–1625. [Google Scholar]
- Toporkov, J.V.; Brown, G.S. Numerical study of the extended Kirchhoff approach and the lowest order small slope approximation for scattering from ocean-like surfaces: Doppler analysis. IEEE Trans. Antennas Propag. 2002, 50, 417–425. [Google Scholar]
- Walker, D. Experimentally motivated model for low grazing angle radar Doppler spectra of the sea surface. IEE Proc. Radar Sonar Navig. 2000, 147, 114–120. [Google Scholar]
- Wang, Y.; Zhang, Y. Investigation on Doppler Shift and Bandwidth of Backscattered Echoes from a Composite Sea Surface. IEEE Trans. Geosci. Remote Sens. 2011, 49, 1071–1081. [Google Scholar]
- Wang, Y. Doppler Spectra of Microwave Scattering Fields from Nonlinear Oceanic Surface at Moderate- and Low-Grazing Angles. IEEE Trans. Geosci. Remote Sens. 2012, 50, 1104–1116. [Google Scholar]
- Wang, Y.; Zhang, Y.M.; Guo, L.X. Microwave Doppler Spectra of Sea Echoes at High Incidence Angles: Influences of Large-Scale Waves. Prog. Electromagn. Res. B 2013, 48, 99–113. [Google Scholar]
- Yan-Min, Z.; Yun-Hua, W.; Chao-Fang, Z. Microwave Doppler spectra of sea return at small incidence angles: Specular point scattering contribution. Chin. Phys. B 2010, 19, 384–390. [Google Scholar]
- Zhang, Y.; Wang, Y.; Zheng, H.; Bai, Y. Doppler characteristics of electromagnetic echoes from sinusoidal water waves illuminated by plane wave/Gaussian beam. Waves Random Complex Media 2021, 1–16. [Google Scholar]
- Rozenberg, A.D.; Quigley, D.C. Laboratory study of polarized microwave scattering by surface waves at grazing incidence: The influence of long waves. IEEE Trans. Geosci. Remote Sens. 1996, 34, 1331–1342. [Google Scholar]
- Rozenberg, A.D.; Quigley, D.C.; Melville, W.K. Laboratory study of polarized scattering by surface waves at grazing incidence: I. Wind waves. IEEE Trans. Geosci. Remote Sens. 2002, 33, 1037–1046. [Google Scholar]
- Corretja, V.; Meslot, V.; Kemkemian, S.; Montigny, R. Statistical Analysis on Sea Clutter Doppler Properties in X-Band for Low Grazing Angles. In Proceedings of the 2017 IEEE Radar Conference (RadarConf17), Washington, DC, USA, 8–12 May 2017. [Google Scholar]
- Lee, P.H.Y.; Barter, J.D.; Beach, K.L.; Hindman, C.L.; Lake, B.M.; Rungaldier, H.; Shelton, J.C.; Williams, A.B.; Yee, R.; Yuen, H.C. X band microwave backscattering from ocean waves. J. Geophys. Res. Ocean. 1995, 100, 2591–2611. [Google Scholar]
- Rosenberg, L. Characterization of High Grazing Angle X-Band Sea-Clutter Doppler Spectra. IEEE Trans. Aerosp. Electron. Syst. 2013, 50, 406–417. [Google Scholar]
- Luo, X.; Liu, Z.; Lu, Z.; Fu, Q. Modeling and simulation of sea clutter for missile-borne radar. Proc. Appl. Opt. Photonics China 2011, 8191, 345–352. [Google Scholar]
- McDonald, M.; Cerutti-Maori, D. Multi-phase centre coherent radar sea clutter modelling and simulation. IET Radar Sonar Navig. 2017, 11, 1359–1366. [Google Scholar]
- Wentz, F.J.; Smith, D.K. A model function for the ocean-normalized radar cross section at 14 GHz derived from NSCAT observations. J. Geophys. Res. Ocean. 1999, 104, 11499–11514. [Google Scholar]
- Wentz, F.J.; Peteherych, S.; Thomas, L.A. A model function for ocean radar cross sections at 14.6 GHz. J. Geophys. Res. Ocean. 1984, 89, 3689–3704. [Google Scholar]
- Voronovich, A. Wave Scattering from Rough Surfaces. Rep. Prog. Phys. 1999, 17, 147–207. [Google Scholar]
- Valenzuela, G.R. Theories for the interaction of electromagnetic and oceanic waves—A review. Bound. Layer Meteorol. 1978, 13, 61–85. [Google Scholar]
- Valenzuela, G. Depolarization of EM waves by slightly rough surfaces. IEEE Trans. Antennas Propag. 1967, 15, 552–557. [Google Scholar]
- Wright, J. A new model for sea clutter. IEEE Trans. Antennas Propag. 1968, 16, 217–223. [Google Scholar]
- Plant, W.J. Bragg Scattering of Electromagnetic Waves from the Air/Sea Interface. In Surface Waves and Fluxes: Volume II—Remote Sensing; Geernaert, G.L., Plant, W.L., Eds.; Springer: Dordrecht, The Netherlands, 1990; pp. 41–108. [Google Scholar]
- Hwang, P.A.; Zhang, B.; Toporkov, J.V.; Perrie, W. Correction to “Comparison of composite Bragg theory and quad-polarization radar backscatter from RADARSAT-2: With applications to wave breaking and high wind retrieval”. J. Geophys. Res. 2010, 115, C11099. [Google Scholar]
- Wright, J. Backscattering from capillary waves with application to sea clutter. IEEE Trans. Antennas Propag. 1966, 14, 749–754. [Google Scholar]
- Plant, W.J. A stochastic, multiscale model of microwave backscatter from the ocean. J. Geophys. Res. Ocean. 2002, 107, 3–21. [Google Scholar]
- Hwang, P.A.; Plant, W.J. An analysis of the effects of swell and surface roughness spectra on microwave backscatter from the ocean. J. Geophys. Res. Ocean. 2010, 115, C04014. [Google Scholar]
- Kasilingam, D.P.; Shemdin, O.H. Theory for synthetic aperture radar imaging of the ocean surface: With application to the Tower Ocean Wave and Radar Dependence Experiment on focus, resolution, and wave height spectra. J. Geophys. Res. Ocean. 1988, 93, 13837–13848. [Google Scholar]
- Tsang, L.; Chan, C.H.; Pak, K.; Sangani, H. Monte-Carlo simulations of large-scale problems of random rough surface scattering and applications to grazing incidence with the BMIA/canonical grid method. Antennas Propag. IEEE Trans. 1995, 43, 851–859. [Google Scholar]
- Zebker, H.A.; Villasenor, J. Decorrelation in interferometric radar echoes. IEEE Trans. Geosci. Remote Sens. 1992, 30, 950–959. [Google Scholar]
- Bamler, R.; Hartl, P. Synthetic aperture radar interferometry. Inverse Probl. 1998, 14, R1. [Google Scholar]
- Elfouhaily, T.; Chapron, B.; Katsaros, K.; Vandemark, D. A unified directional spectrum for long and short wind-driven waves. J. Geophys. Res. Ocean. 1997, 102, 15781–15796. [Google Scholar]
- Hasselmann, K.; Hasselmann, S. On the nonlinear mapping of an ocean wave spectrum into a synthetic aperture radar image spectrum and its inversion. J. Geophys. Res. Ocean. 1991, 96, 10713–10729. [Google Scholar]
- Caponi, E.A.; Crawford, D.R.; Yuen, H.C.; Saffman, P.G. Modulation of radar backscatter from the ocean by a variable surface current. J. Geophys. Res. Ocean. 1988, 93, 12249–12263. [Google Scholar]
- Wang, Y.; Zhang, Y.; Li, H.; Chen, G. Doppler spectrum of microwave SAR signals from two-dimensional time-varying sea surface. J. Electromagn. Waves Appl. 2016, 30, 1265–1276. [Google Scholar]
- Apel, J.R. Principles of Ocean Physics; Academic Press: Cambridge, MA, USA, 1987. [Google Scholar]
- Boisot, O.; Nouguier, F.; Chapron, B.; Guérin, C.A. The GO4 Model in Near-Nadir Microwave Scattering from the Sea Surface. IEEE Trans. Geosci. Remote Sens. 2015, 53, 5889–5900. [Google Scholar]
- Liu, B.; He, Y. SAR Raw Data Simulation for Ocean Scenes Using Inverse Omega-K Algorithm. IEEE Trans. Geosci. Remote Sens. 2016, 54, 6151–6169. [Google Scholar]
- Soriano, G.; Saillard, M. Scattering of electromagnetic waves from two-dimensional rough surfaces with an impedance approximation. J. Opt. Soc. Am. A Opt. Image Sci. Vis. 2001, 18, 124–133. [Google Scholar] [PubMed]
- Berginc, G. Small-Slope Approximation Method: A Further Study of Vector Wave Scattering FROM Two-Dimensional Surfaces and Comparison with Experimental Data. Prog. Electromagn. Res. 2002, 27, 251–287. [Google Scholar]
Disclaimer/Publisher’s Note: The statements, opinions and data contained in all publications are solely those of the individual author(s) and contributor(s) and not of MDPI and/or the editor(s). MDPI and/or the editor(s) disclaim responsibility for any injury to people or property resulting from any ideas, methods, instructions or products referred to in the content. |
© 2023 by the authors. Licensee MDPI, Basel, Switzerland. This article is an open access article distributed under the terms and conditions of the Creative Commons Attribution (CC BY) license (https://creativecommons.org/licenses/by/4.0/).