1. Introduction
Real-time measurement of the three-dimensional (3D) structure of clouds and precipitation remains challenging in atmospheric-sounding technology. Radar remains a vital tool for obtaining macro and microstructural characteristics of clouds. Ground-based triple-frequency (X, Ka, and W bands) cloud and precipitation radars are critical components of observational systems designed for detailed cloud structure characterization. These radars provide deeper insights into microphysical processes and retrieve more cloud and precipitation parameters than single-frequency radar, thanks to measurements at multiple frequency bands. However, the triple-frequency method, a powerful technique in microphysical research, demands precise radar calibration and reliable attenuation correction [
1,
2].
Within the radar reflectivity range, frequency-dependent hydrometeor scattering and absorption properties are governed by microphysical characteristics. Numerical and observational results have indicated that the triple-frequency radar signature has the potential for retrieving morphological parameters constrained by triple-frequency radar measurements [
3,
4]. Furthermore, when combined with other remote sensors, triple-frequency radar has significantly improved retrievals for ice [
3,
5,
6] and rain [
7,
8,
9]. Due to frequency-dependent properties, different hydrometeors exhibit varying attenuation or backscattering at each band of a triple-frequency radar. For instance, snowflakes tend to produce noticeable attenuation at and above the W band [
5], although attenuation corrections at higher frequencies have been elusive in previous studies.
Distinct reflectivity signals result from differential scattering or attenuation, which are influenced by particle microphysical properties, including particle size distribution (PSD), type, density, and phase state. Numerous studies have investigated triple-frequency radar measurements with other ground-based equipment for actual snowfall observations [
3,
5,
10,
11,
12,
13,
14,
15,
16,
17]. While most of these studies rely on Rayleigh and non-Rayleigh scattering methodologies, the irregular and complex nature of most ice crystals and snowflakes can introduce errors when calculating backscattering and attenuation using the Mie or T-Matrix scattering models. Hogan proposed the SSRGA scattering model [
18,
19], providing a faster method for computing the scattering properties of aggregated ice particles and snowflakes than the Discrete Dipole Approximation (DDA). Furthermore, it offers more accurate backscattering calculations for irregular snowflakes at higher frequencies compared to the Mie solution or Rayleigh approximation.
Moreover, due to the lack of information about hydrometeor vertical distribution, it is essential to derive hydrometeor vertical profiles. In this study, we utilize ECMWF’s ERA5 hourly reanalysis data to obtain atmospheric microphysics information, focusing on continuous and relatively homogeneous stratiform clouds to calculate attenuation contributions using the SSRGA approach. This approach appears promising in representing snowflakes more accurately according to their actual habits when combined with ERA5 hourly reanalysis profile data interpolated vertically.
In reality, various attenuations caused by gas and stratiform clouds are non-negligible, especially when at least one of the frequencies is affected by attenuation [
20]. Therefore, this study utilizes triple-frequency radar observations (X, Ka, and W bands) with vertical pointing to quantify differential attenuation due to specific gases (e.g., oxygen and water vapor) and stratiform clouds using the SSRGA model in PAMTRA2 [
21]. This study aims to develop an attenuation correction method for triple-frequency radar based on the first triple-frequency (X, Ka, and W bands) radar observations collected during winter in Zhangshanying, Yanqing, Beijing.
In past attenuation studies, there was no information about vertical hydrometeor and cloud distribution; the only information was path-integrated attenuation in snowstorms from actual observations. This technique provides bin-by-bin vertical distribution information to calculate the attenuation due to gases and stratiform clouds with snowfall microphysical properties. The influence of neglecting the effect of attenuation produced by different stratiform layers is vital for triple-frequency radar and needs to be assessed. The methodology combines PAMTRA2 with the SSRGA model and ECMWF reanalysis data for vertical profiles of gases and hydrometeor layers to calculate attenuation under different layer conditions. The ECMWF reanalysis data grid has a 0.25-degree hourly resolution, and vertical interpolation is performed for the calculation to match radar range bins. This approach provides more information than 12 h of sounding data.
The paper is organized as follows:
Section 2 provides an overview of the triple-frequency radar instruments and ground-based auxiliary observation equipment, specifically the micro-rain radar deployed during the Zhangshanying Experiment.
Section 3 details the attenuation correction method used, focusing on the SSRGA scattering model for extinction calculation, followed by the bin-by-bin approximation method for attenuation correction. In the first part of
Section 4, we compare atmospheric gases and hydrometeors attenuation at X, Ka, and W band radars and calculate attenuation attributed to stratiform clouds using different scattering models.
Section 5 presents the vertical effective reflectivity profile of the attenuation correction effect of the triple-frequency radar using different scattering models. We validated the attenuation correction of triple-frequency radar reflectivity using X- and W-band reflectivity and their dual-frequency reflectivity ratios (DFR). We also evaluate scattering models suitable for triple-frequency radar with varying snowfall microphysical properties. Then,
Section 6 compares results with a micro-rain radar to further validate W-band radar attenuation correction. The final part of this section presents the W-band radar attenuation correction results.
Section 7 presents the results of the attenuation correction comparison. Finally,
Section 8 summarizes the main discussions of this study.
2. The Triple-Frequency Radar Field Measurement Campaign Site and Observational System and the Micro-Rain Radar
This study focuses on stratiform clouds with snowfall microphysical properties, and all the data used in this work were obtained from China’s first triple-frequency radar and the ERA5 ECMWF reanalysis data. This triple-frequency radar experiment for winter precipitation was conducted by the Key Laboratory of Middle Atmosphere and Global Environment Observation at the Institute of Atmospheric Physics of the Chinese Academy of Sciences. The experimental site was located in Zhangshanying, Yanqing, Beijing (40.4898°N, 115.8596°E, 494 m above mean sea level) during two periods, from 11 November 2020, to 30 March 2021, and 11 November 2021, to 30 March 2022.
The triple-frequency cloud and precipitation radar system comprises X, Ka, and W band radars with multi-antenna coaxial scanning and Doppler signal observational capabilities. These radars were vertically pointed, providing a comprehensive view of hydrometeors at three frequencies during the experiment.
Before and during the field campaign, these three radars underwent meticulous metal sphere calibration. The reflectivity factor measurements of the Ka and W band radars were independently adjusted. The corrected values for the Ka-band radar reflectivity were 11.3 dB, and for the W-band radar reflectivity, it was 13.5 dB. Additionally, the range bin data of the W-band radar were shifted forward by two range bins.
Figure 1 illustrates the schematic diagram of the triple-frequency cloud and precipitation radar system, showcasing its flexibility and mobility, including the main radar components, shelters, comprehensive data processing, and observation software.
The Ka-band (millimeter wave) and the X-band (centimeter wave) are dual-transmitting and dual-receiving all-solid-state frequency-modulated continuous-wave radars. In contrast, the W-band (millimeter wave) is a single-transmitting and dual-receiving combined pulsed Doppler radar. In the dual-transmitting and dual-receiving mode, two transmitters transmit horizontal and vertical polarization waves simultaneously, while the two receivers collect data returned by these two polarization waves simultaneously. Because a dual-polarization operation mode is in trial operation, spectrum accumulation cannot be performed in this mode, and the observation data of the dual-polarization mode is not yet available. The hardware employs dual-frequency coplanar antennas and integrated coaxial design techniques to synchronize devices with different frequencies for coordinated real-time observations with multiple frequency radars targeting the same hydrometeor.
The technical specifications and settings of the three vertically pointing radars at the Zhangshanying site in Yanqing are detailed in
Table 1. All three radars share a temporal resolution of 1.5 s. The range resolution of the W-band radar was set at 120 m to enhance the sensitivity of the W-band radar, while the X- and Ka-band radars were set at 30 m. Only zenith observation datasets are considered for the attenuation correction, although scanning data were collected during the campaign. It is important to note that we assume continuous and homogeneous stratiform clouds within observation volumes at the same layers are relatively homogeneous, and we interpolate the data for the W-band radar to match the triple-frequency radar’s scattering properties in the attenuation correction process.
The ground-based auxiliary equipment micro-rain radar (METEK MRR-2) was deployed 10 m from the triple-frequency radar. The micro-rain radar operates at a frequency of 24.23 GHz. It provides height detection capabilities within a range from 0 to 6 km. The radar system offers a height resolution of 300 m. The rainfall rates, droplet size distribution, radar reflectivity, falling velocity of precipitation particles, and the reflectivity factor attenuation are provided. The METEK MRR-2 micro-rain radar yields valuable data related to rainfall rates, droplet size distribution, radar reflectivity, falling velocity of precipitation particles, and the attenuation of the reflectivity factor.
3. Attenuation Correction Method Based on the SSRGA Scattering Model in PAMTRA2
3.1. The SSRGA Scattering Model in PAMTRA2
PAMTRA2 offers SSRGA for radar applications, which is crucial for researching frozen hydrometeors [
21]. Tyynelä [
22] proposed that SSRGA can accurately calculate the scattering properties of realistic snowflakes, aligning with other uncertainties inherent in radar measurements. Leinonen [
23] further demonstrated a direct relationship between the backward scattering properties of snowflakes and the mass distribution within the snowflake, confirming the applicability of this approach. Hogan [
18] introduced a simple analytical solution based on the self-similarity of snowflakes and validated the SSRGA approach’s efficiency. SSRGA scales effectively to particles larger than the radar wavelength, offering faster calculations compared to Discrete Dipole Approximation (DDA). Additionally, SSRGA accommodates in-situ measurements of hydrometeor properties and provides more precise scattering calculations for snowflakes compared to the Mie solution or Rayleigh approximation, especially at higher frequencies.
In this study, we focus on the SSRGA scattering model in PAMTRA2 to compute attenuation along the triple-frequency radar path, accounting for hydrometeor vertical distribution and utilizing ECMWF reanalysis data for stratiform clouds with varying snowfall microphysical properties. Simultaneously, different hydrometeor properties are applied in various layers.
3.2. Calculation of Attenuation Coefficients of Different Cloud Layers for Triple-Frequency Radar Based on PAMTRA2
Ice water content (IWC) is a crucial cloud microphysical parameter for precipitation formation, defined as the cloud mass of ice per unit volume of atmospheric air. It is expressed as
where m(D) represents the mass of ice crystal diameter D. Due to the irregular characteristics of frozen snowflakes and ice crystals, in nature, the definition of D has no standard form. Moreover, it is significant as it constitutes the bulk cloud properties. N(D) follows the exponential distribution given by
with the mass of various ice snowflakes represented by a power law
Hence, the equation for IWC can be simplified to
where the unit of IWC is g m
−3 and D is in mm.
With the extinction cross section σ
e(D), the attenuation can be expressed as
where K is in dB km
−1. PAMTRA2 is used to calculate the attenuation coefficient.
The attenuation due to atmospheric propagation in different radar range bins is attributed to atmospheric gases and frozen particles during snowfall. This two-way extinction thickness is defined as
where
,
represent the absorption and scattering coefficients (i.e., extinction or attenuation) due to atmospheric gas (primarily oxygen and water vapor) and clouds, respectively.
represents the absorption and scattering coefficient due to clouds. R (km) represents the distance or range from the radar. The attenuation correction equation can be expressed as
where
(mm
6 m
−3) is the measured radar effective reflectivity and
represents the attenuated correction value of the radar effective reflectivity.
3.3. Attenuation Correction Method with Bin-by-Bin Approximation
The attenuation correction method with bin-by-bin approximation [
24] is defined as
where
is the extinction thickness at each range bin. Z(i) is determined from the measured value of the
radar echo. This method calculates the attenuation correction for each range bin individually along the radial direction. It leverages the actual vertical stratification information of gases and hydrometeors, enhancing the stability and accuracy of the attenuation correction process.
4. Analysis of the Triple-Frequency Radar Attenuation
The attenuation experienced by each particular radar band used in triple-frequency radars varies due to atmospheric gases and frozen snowflakes during snowfall. Thus, it is crucial to estimate attenuation values for all three radars. Attenuation from water vapor and oxygen has been computed to correct radar-effective reflectivity measurements. This correction utilizes the Rosenkranz98 [
25] and Liebe93 [
26] models integrated into PAMTRA2 and atmospheric profiles obtained from the ECMWF reanalyzed data during the triple-frequency radar measurements. It is worth noting that the triple-frequency radars were meticulously calibrated using a metal sphere before and during the field campaign.
4.1. Attenuation Due to Atmospheric Gases and Hydrometeors of Triple-Frequency Radar
Hydrometeors and atmospheric gases contribute differently to attenuation in triple-frequency radars. In this study, we calculate the attenuation caused by atmospheric gases, mainly oxygen, and water vapor, using the gas absorption models Rosenkranz98 and Liebe93 via PAMTRA2. We adapted the oxygen model to the US standard atmospheric profiles. Given the lack of real-time vertical atmospheric profiles, we rely on ECMWF reanalysis data, which provide temperature, pressure, and relative humidity information.
Figure 2 presents the attenuation contributions of hydrometeors and gases at the triple-frequency radar for the ECMWF profile data of 21 January 2022 within the 0~10 km range bins. The results from the two algorithms, Rosenkranz98 (black) and Liebe93 (blue), demonstrate good agreement. The two-way attenuation values vary for the three radars, ranging from 0.001 to 0.01 dB km
−1 for the X-band, 0.01 to 0.05 dB km
−1 for the Ka-band, and 0.01 to 3 dB km
−1 for the W-band. The maximum attenuation occurs at the W-band radar, consistent with the gas attenuation (2.675 dB km
−1) calculated by Neto [
27]. Therefore, atmospheric gas and hydrometeor attenuation at the X- and Ka-band radars are negligible compared to their observed values, while attenuation at the W-band radar is non-negligible and requires correction.
4.2. The Attenuation Coefficient for Snowflake Particles of Triple-Frequency Radar
To achieve more accurate attenuation correction, we simulate and compare different scattering models before correction, including Rayleigh (Ray), Mie, T-Matrix (TMM), and SSRGA, offering more realistic scattering properties compared to sphere/spheroid models. Our simulations assume a temperature of −10 °C and a particle diameter range from 0.01 to 10 mm.
Figure 3 illustrates the two-way attenuation coefficient signatures for the triple-frequency radars. When the particle size is less than 0.2 mm, the two-way attenuation for the triple-frequency radar can be neglected. However, as particle size increases, different scattering models yield significantly varying results. For the Rayleigh and SSRGA scattering models (
Figure 3a,d), the maximum attenuation value at the W-band radar reaches up to 0.05 and 1.5 dB, while the attenuation values at the X- and Ka-band radars remain minimal and can be considered negligible. The Mie and TMM scattering models (
Figure 3b,c) produce nearly identical attenuation values at the X-band radar and the Ka and W-band radars, which is inconsistent with actual measurements. Therefore, due to the nonspherical and complex nature of ice crystals and snowflake-like particles, the SSRGA scattering model, which closely approximates the realistic shape of snowflakes and offers high computational efficiency, is selected for this study. It implies that attenuation caused by snowfall with varying microphysical properties increases with frequency, constraining the maximum range of measurement for the W-band radar.
5. Comparison of the Attenuation Correction of Gas and Stratiform Clouds for Triple-Frequency Radar Effective Reflectivity Profiles
In the following sections, we utilize the different scattering models to perform the gas and hydrometeors attenuation corrections for the triple-frequency radar. The ECMWF reanalysis data are used in this study for the atmospheric vertical profile information. For calculating the attenuation, we assume that the snowflake particle size ranges from 0.001 to 10 mm and that the ice density is 0.9167 g cm−3.
5.1. Case Study of the Triple-Frequency Radar Profile
The two-way gas and stratiform cloud attenuation correction at the X-band radar is performed with the Rayleigh, Mie, TMM, and SSRGA scattering models in PAMTRA2. The attenuation correction with different scattering models and the non-correction reflectivity profile at the X-band radar are shown in
Figure 4 at 8:35 UTC on 21 January 2022. The attenuation correction and the non-correction are nearly coincidental. The signature indicates that the attenuation due to the gas and stratiform clouds with snowfall microphysical properties is relatively tiny compared to their X-band radar measurements. Therefore, the attenuation owing to gas and stratiform clouds with snowfall microphysical properties is negligible for the X-band radar.
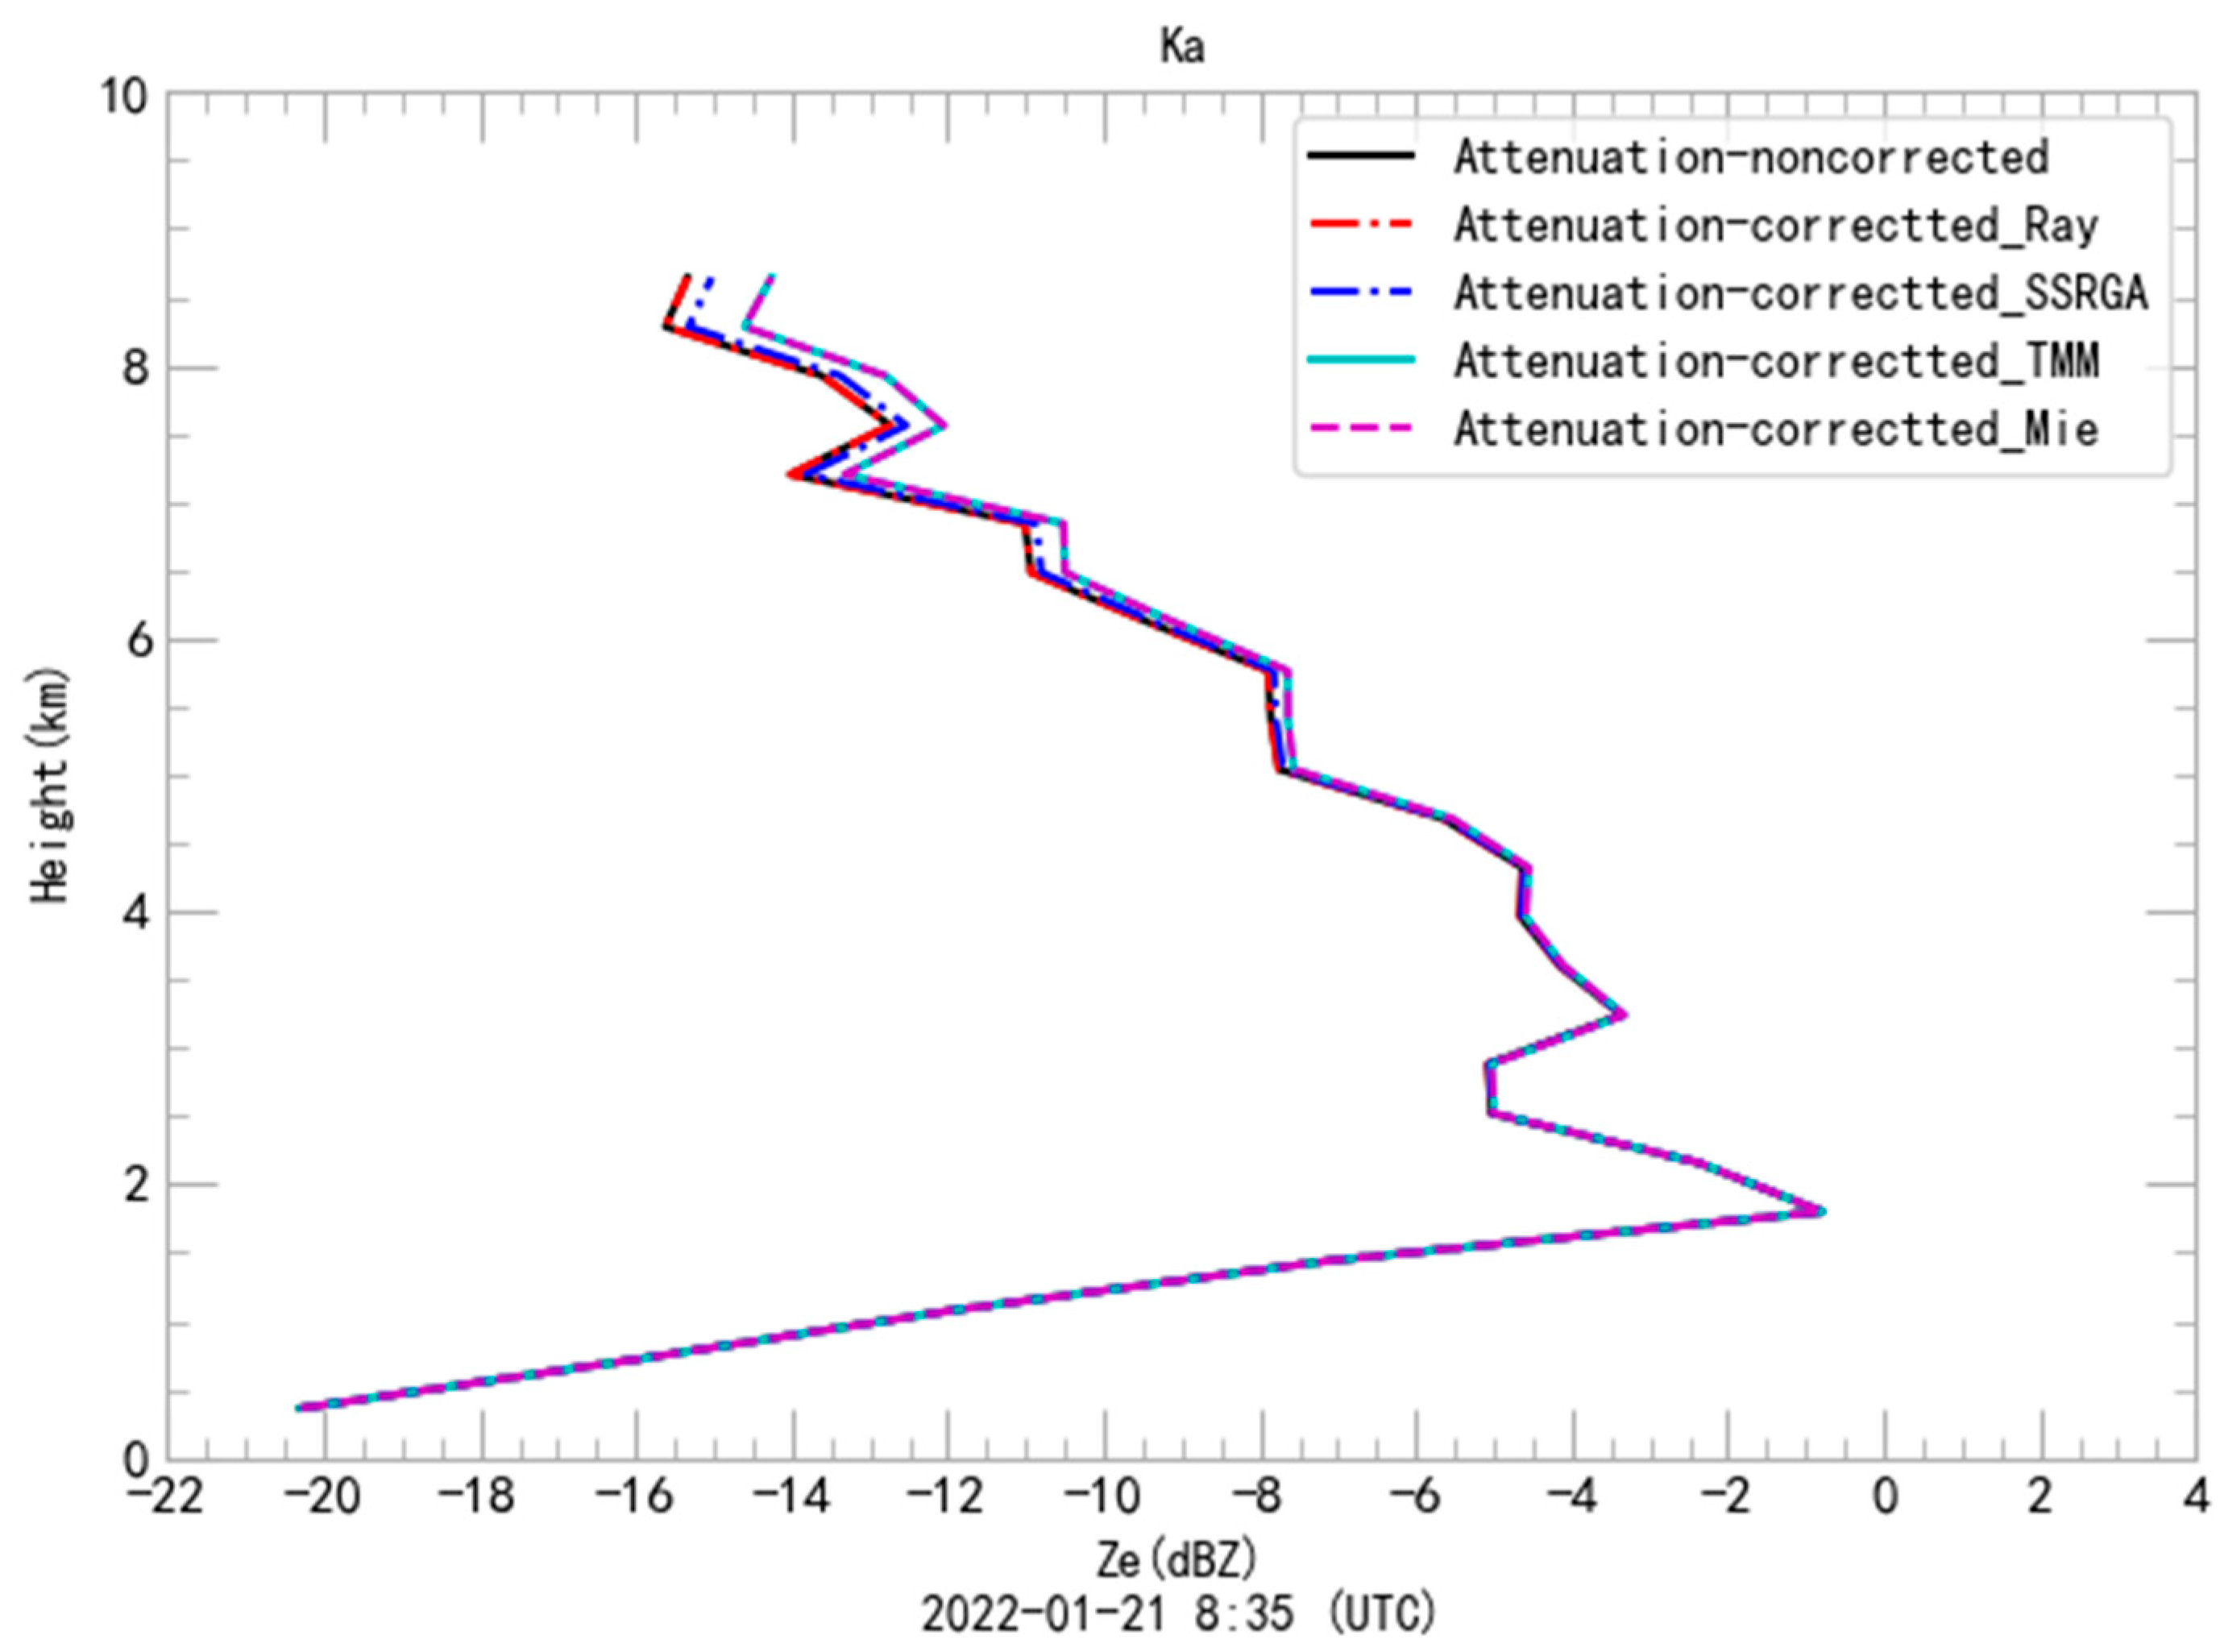
In the same way, we performed attenuation correction of gas and stratiform clouds with snowfall microphysical properties at the Ka-band radar. The attenuation correction and non-corrected effective reflectivity results are displayed in
Figure 5. Only the Mie scattering model slightly increases after attenuation correction for the regions with heights above 6 km. The maximum value reaches 1.45 dB, while the attenuation correction values using the other models are minimal. Consequently, the attenuation corrections for the Ka-band radar are not needed, which are produced by gas and stratiform clouds with snowfall microphysical properties.
However, due to gas and stratiform clouds with snowfall microphysical properties, the attenuation correction for the W-band radar indicated in
Figure 6 with the different scattering models is significant at 8:35 UTC on 21 January 2022. The Mie and TMM scattering models coincided. Nevertheless, these models and the Rayleigh scattering model are far from the range of the measured reflectivity for regions above 3 km, so these scattering models are considered unsuitable. Only the gas and stratiform clouds with snowfall microphysical properties attenuation correction of the SSRGA scattering model are more appropriate than other models. The maximum attenuation correction value reaches 4.38 dB for regions above 6 km, and the values are small for regions below 6 km. Therefore, the SSRGA model was adopted to make the attenuation correction for the W-band radar in this study.
5.2. Case Study of the Attenuation Correction for the W Band Radar Effective Reflectivity
In these case studies, all observational data were obtained from the triple-frequency radar at Zhangshanying, the Yanqing site in Beijing. For the snowfall period from 8:04 to 9:25 UTC on 21 January 2022 and from 19:54 to 5:43 UTC on 17–18 March 2022, the attenuation due to gas was estimated and utilized to correct the radar reflectivity measurements via the Rosenkranz98 model and the atmospheric profiles collected from the ECMWF reanalysis data. The SSRGA scattering model is applied to calculate the W-band radar attenuation caused by stratiform clouds with snowfall microphysical properties in PAMTRA2. The reflectivities of the triple-frequency radar, the W-band radar reflectivity after the attenuation correction, and their dual-frequency reflectivity ratios are presented in
Figure 7 and
Figure 8. It must be noted that these correction values were minimal for the regions with heights below 6 km; as expected, they increased obviously for the regions with heights above 6 km.
The comparison of the results before and after the W-band effective reflectivity attenuation correction and the effective reflectivities of Ka-band and X-band radar from 16:04 to 17:25 UTC on 21 January 2022 is illustrated in
Figure 7. The −15 °C isotherm (dashed line in the time–height plots) is 4.4 km, and the −10 °C isotherm (continuous line in the time–height plots) is approximately 1.0 km. The attenuation correction of the W band radar effective reflectivity for the regions with heights above 6 km is increased to some degree in
Figure 7b compared with
Figure 7a. The maximum correction value reaches 4.42 dB, and the minimum correction value is around zero during the observational period. In the regions above 6 km, the effective reflectivity improved to some extent. Attenuation is found to be negligible on average for the regions with heights below 6 km.
Figure 7c,d show the features of the effective reflectivities of Ka-band and X-band radar during the snowfall period from 8:04 to 9:25 UTC on 21 January 2022 and from 19:54 to 5:43 UTC on 17–18 March 2022. The Ka-band and X-band radar undergo minimal attenuations relative to the W-band radar. We found that the attenuations of the W-band radar increase with heights in the regions above 5 km. The signatures of the effective reflectivity of the triple-frequency radar indicate that it has the effect of cross-calibration to use triple-frequency radar measurements and help correct for the attenuation of the W-band radar measurements. The features also demonstrate that most attenuation results from the upper-lever clouds, far from the radar.
Figure 7e–g show the dual-frequency reflectivity ratios of X-Ka band radar, Ka-W band radar, and Ka-W_ac (the W-band radar reflectivity is after attenuation correction). In
Figure 7e, the dual-frequency reflectivity ratios of X-Ka are divided into two regions with heights below and above 2 km, but they are both close to a constant value. The features indicate the consistency of X- and Ka-band radar reflectivity measurements during snowfall. In
Figure 7f, the dual-frequency reflectivity ratios of Ka-W are significant for the regions with heights above 5 km, though they are at the same altitude. However, the W-band radar reflectivity is after attenuation correction, and the dual-frequency reflectivity ratios of Ka-W_ac remain consistent for the regions with heights above 5 km. It is confirmed that the attenuation correction for the W-band radar used in this study is rational.
The other case is illustrated in
Figure 8 with before and after the W-band effective reflectivity attenuation correction, the effective reflectivity of the Ka-band, and the X-band radar of 17 March 2022 between 19:54 and 18 March 2022 5:25 UTC, and it is used to validate the effect of attenuation correction. The −15 °C isotherm (dashed line in the time–height plots) is around 4.4 km, and the −5 °C isotherm (continuous line in the time–height plots) is about 0.7 km due to the high ground temperature. As expected, the comparison between
Figure 8a,b show that the attenuation corrections of the W-band radar effective reflectivity for regions with heights above 5.5 km were also observed to be distinctly improved. The maximum correction value is up to 4.71 dB, and the minimum is zero during the observational period. For regions with heights above 5.5 km, the effective reflectivity is optimized to a certain degree. Based on this feature, the attenuation from gas and stratiform clouds with snowfall microphysical properties can be negligible on average below 5.5 km. In this case, the maximum attenuation value exceeds the above case. The reason for this difference is that the snowfall intensity in the second case is more significant than in the first. The snow particle sizes are different in the two cases, as well. In sum, the attenuation systematically increases along the radar path. These signatures in
Figure 7 and
Figure 8 indicate that using the SSRGA scattering model in PAMTRA2 is practical and feasible to calculate the attenuation of the W-band radar simulation.
Figure 8c,d show the features of the effective reflectivity of Ka-band and X-band radar during the snowfall period from 9:54 to 5:43 UTC of 17~18 March 2022. Same as in the first case, the Ka-band and X-band radar have tiny attenuations compared to the W-band radar. The attenuations of the W-band radar increase with heights in the regions above 5 Km, especially in the regions above 8 Km. The characteristics of the effective reflectivity of the triple-frequency radar suggest that it has the effect of cross-calibration to use triple-frequency radar measurements. We can better analyze the features of the triple-frequency radar. There are bigger attenuations far from the radar and from the upper-lever clouds.
Figure 8e–g show the dual-frequency reflectivity ratios of X-Ka band radar, Ka-W band radar, and Ka-W_ac (the W-band radar reflectivity is after attenuation correction). In
Figure 8e, the dual-frequency reflectivity ratios of X-Ka are divided into two regions with heights below and above 2 km. However, each has a proximate constant value except for the regions below 500 m. The features suggest that the X- and Ka-band radar reflectivity measurements are consistent during snowfall and attenuate less. In
Figure 8f, the dual-frequency reflectivity ratios of Ka-W are significant differences for the regions with heights above 5 km, while the differences are relatively small. However, the W-band radar reflectivity is after attenuation correction, and the dual-frequency reflectivity ratios of Ka-W_ac have a significant improvement for the regions with heights above 5 km. Therefore, the method of attenuation correction for the W-band radar works here. In addition, the clouds are inhomogeneous in this case, resulting in biases after the attenuation correction of the W-band radar.
6. Comparison Analysis with Micro-Rain Radar Attenuation
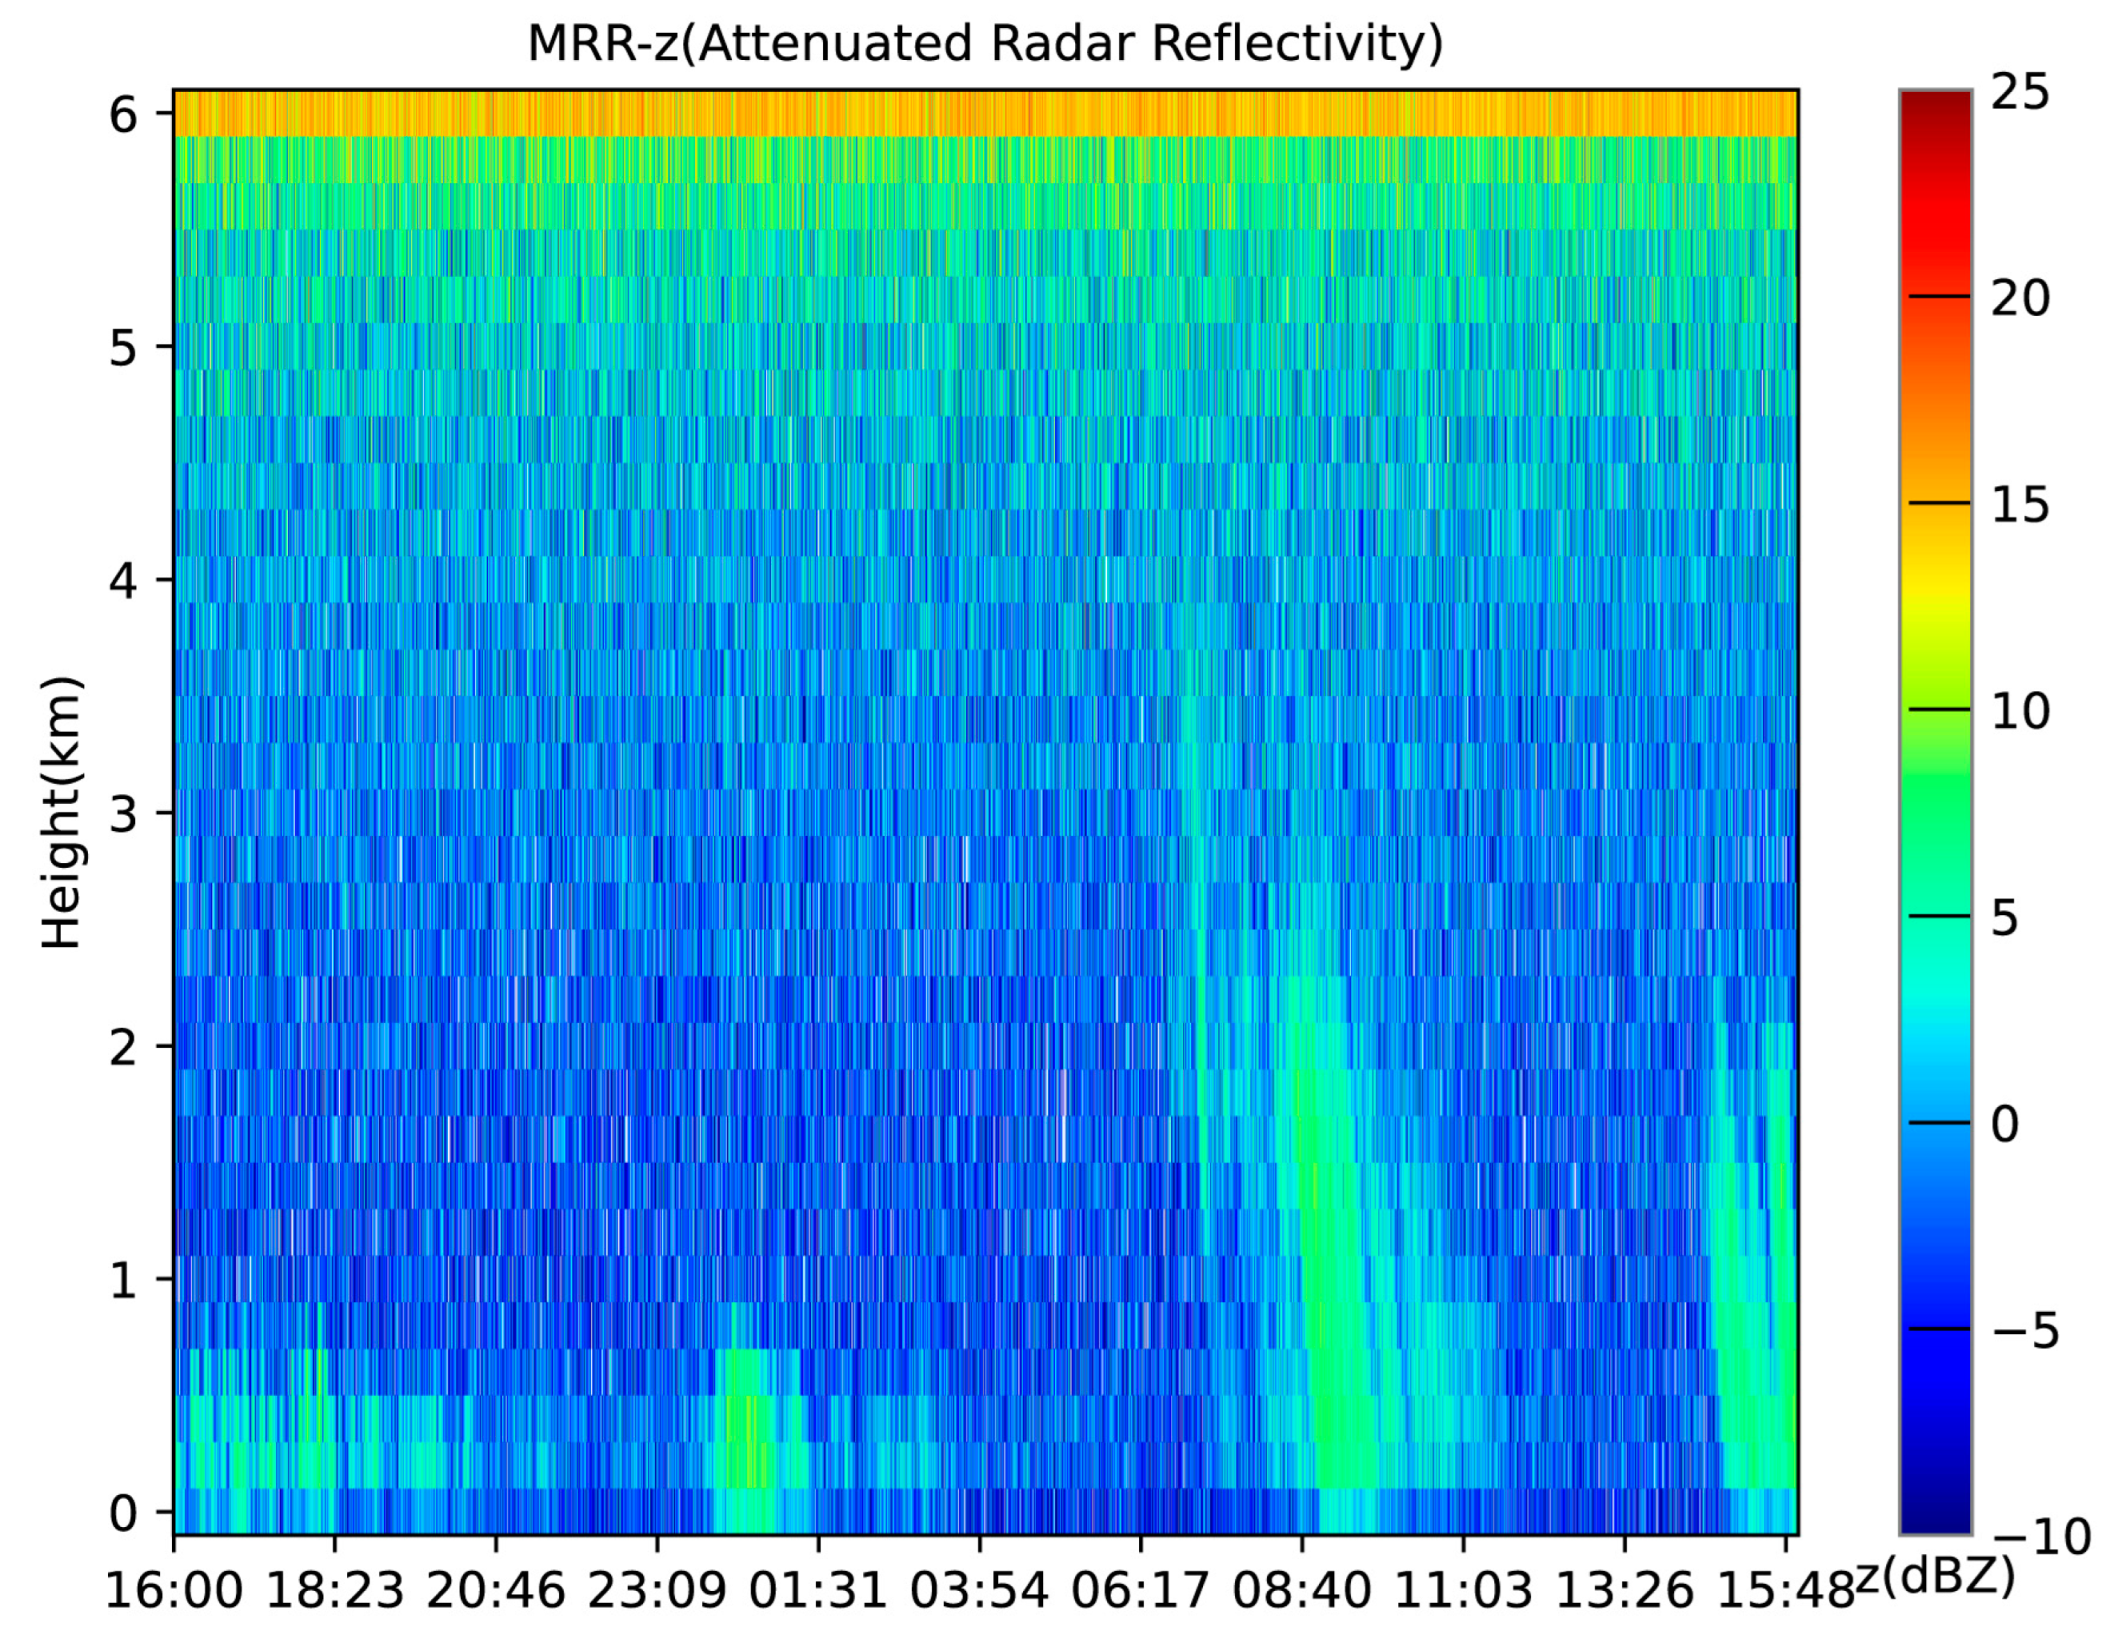
To test the effectiveness of the W-band radar’s attenuation correction, we compare it with the attenuation observed by the ground-based micro-rain radar of 20 January 2022. It is important to note that the micro-rain radar operates at a wavelength of 12.5 mm, distinct from the W-band radar’s wavelength of 3.171 mm. Although the attenuations caused by atmospheric gases and stratiform clouds with snowfall microphysical properties differ for the two radars, we can assess the strength of their attenuations vertically.
Figure 9 displays the attenuated radar reflectivity of the micro-rain radar. It is worth mentioning that the maximum measurable distance of the micro-rain radar is only 6.0 km. As seen in the figure, the attenuation of the MRR-2 during the snowfall period is negligible below 5 km, which aligns with the results of the attenuation correction for the W-band radar using PAMTRA2. However, around 9:00, there is a notable attenuation at a height of approximately 2 km. It likely indicates that attenuation increases with snowfall intensity during this period.
7. Discussion
In this study, we proposed a two-way gas and cloud attenuation correction for the W-band radar method based on the SSRGA scattering model in PAMTRA2. It is challenging to do it due to the need for more information about hydrometeor vertical distribution. This approach utilizes the SSRGA scattering model, which closely approximates the realistic snowflake structure and atmospheric vertical profiles from ECMWF reanalysis data. Compared to traditional methods like DDA, the method offers high computational efficiency for attenuation correction in triple-frequency radar. It is worth noting that the information about hydrometeor vertical distribution varies with the spatial and temporal conditions during the snowfall. Thus, it can introduce errors in the attenuation correction. In order to improve the accuracy of the attenuation correction, we should make more vertical observations of meteorological parameters in future experiments.
In future work, we plan to systematically apply this methodology to expand the dataset for triple-frequency radar observations, helping us better understand snow attenuation at W-band and improve data quality for identifying triple-frequency radar characteristics during snowfall. Additionally, we intend to explore the application of this attenuation correction strategy in scanning modes based on profile information at various levels. Optimizing the observation scheme for the triple-frequency radar and collecting more data will allow us to gain insights into the relationship between attenuation in triple-frequency radar and clouds with snowfall microphysical properties. When dual-polarization data become available, we will explore polarization parameter attenuation correction to enhance attenuation correction effectiveness further when combined with this method.
8. Conclusions
By analyzing the results from the triple-frequency radar reflectivity case studies, we found that the two-way attenuation correction of the W-band radar increased by up to 4.71 dB for regions with heights above 6 km. At the same time, it remained minimal for regions with heights below 6 km. The attenuation values, attributed to gases and stratiform clouds with snowfall microphysical properties, resulted in non-negligible attenuation far from the W-band radar for regions with heights above 6 km. Based on the results shown in
Figure 7,
Figure 8 and
Figure 9, we validated this attenuation by comparing it to the attenuation observed by the ground-based micro-rain radar, the cross-calibrating among the triple-frequency radar, and their dual-frequency reflectivity ratios. It proved that the attenuation correction for the W-band radar is effective. We can obtain better attenuation correction when more information about vertical hydrometeor distribution is available in the future.
Unlike previous attenuation studies that relied only on path-integrated attenuation observations during snowstorms [
28,
29], this technique provides bin-by-bin vertical distribution information to calculate attenuation due to gases and stratiform clouds with varying snowfall microphysical properties. Assessing the impact of neglecting attenuation effects from different stratiform layers is crucial for triple-frequency radar. The quality of the W-band radar data was improved to help further analyze the characteristics of triple-frequency radar during snowfall.
Author Contributions
Conceptualization, Y.C. and H.C.; methodology, X.H.; formal analysis, Y.B.; investigation, S.D.; data curation, J.L.; writing—original draft preparation, Y.C.; writing—review and editing, H.C. and P.W. All authors have read and agreed to the published version of the manuscript.
Funding
This research was funded by the National Key Research and Development Program of China, “Fine-scale observations and data inversion of land-air interactions in Northern China” (Grant 2022YFF0801301) and the National Key Research and Development Program of China, “Research and Experiment of Vertical Comprehensive Meteorological Observation Technology in Megacities” (Grant 2017YFC1501700).
Data Availability Statement
The data that support the findings of this study are available from the corresponding author upon reasonable request.
Conflicts of Interest
The authors declare no conflict of interest.
References
- Oue, M.; Kollias, P.; Matrosov, S.Y.; Battaglia, A.; Ryzhkov, A.V. Analysis of the microphysical properties of snowfall using scanning polarimetric and vertically pointing mul-ti-frequency Doppler radars. Atmos. Meas. Tech. 2021, 14, 4893–4913. [Google Scholar] [CrossRef]
- Falconi, M.T.; Von Lerber, A.; Ori, D.; Marzano, F.S.; Moisseev, D. Snowfall retrieval at X, Ka and W bands: Consistency of backscattering and micro-physical properties using BAECC ground-based measurements. Atmos. Meas. Tech. 2018, 11, 3059–3079. [Google Scholar] [CrossRef]
- Leinonen, J.; Lebsock, M.D.; Tanelli, S.; Sy, O.O.; Dolan, B.; Chase, R.J.; Finlon, J.A.; von Lerber, A.; Moisseev, D. Retrieval of snowflake microphysical properties from multifrequency radar observations. Atmos. Meas. Tech. 2018, 11, 5471–5488. [Google Scholar] [CrossRef]
- Tridon, F.; Battaglia, A.; Kneifel, S. Estimating total attenuation using Rayleigh targets at cloud top: Applications in multi-layer and mixed-phase clouds observed by ground-based multifrequency radars. Atmos. Meas. Tech. 2020, 13, 5065–5085. [Google Scholar] [CrossRef]
- Mason, S.L.; Chiu, C.J.; Hogan, R.J.; Moisseev, D.; Kneifel, S. Retrievals of Riming and Snow Density from Vertically Pointing Doppler Radars. J. Geophys. Res. Atmos. 2018, 123. [Google Scholar] [CrossRef]
- Gorgucci, E.; Baldini, L.; Adirosi, E.; Montopoli, M. Ice water content assessment in the single-, dual-, and triple-frequency radar scenarios. Remote. Sens. Environ. 2020, 254, 112242. [Google Scholar] [CrossRef]
- Tridon, F.; Battaglia, A.; Luke, E.; Kollias, P. Rain retrieval from dual-frequency radar Doppler spectra: Validation and potential for a midlatitude precipi-tating case-study. Q. J. Roy. Meteor. Soc. 2017, 143, 364–1380. [Google Scholar] [CrossRef]
- Battaglia, A.; Kollias, P.; Dhillon, R.; Roy, R.; Tanelli, S.; Lamer, K.; Grecu, M.; Lebsock, M.; Watters, D.; Mroz, K.; et al. Spaceborne Cloud and Precipitation Radars: Status, Challenges, and Ways Forward. Rev. Geophys. 2020, 58, e2019RG000686. [Google Scholar] [CrossRef]
- Mróz, K.; Battaglia, A.; Kneifel, S.; D’Adderio, L.P.; Neto, J.D. Triple-Frequency Doppler Retrieval of Characteristic Raindrop Size. Earth Space Sci. 2020, 7, e2019EA000789. [Google Scholar] [CrossRef]
- Hogan, R.J.; Illingworth, A.J. The Potential of Spaceborne Dual-Wavelength Radar to Make Global Measurements of Cirrus Clouds. J. Atmos. Ocean. Technol. 1999, 16, 518–531. [Google Scholar] [CrossRef]
- Liao, L.; Meneghini, R. A Study on the Feasibility of Dual-Wavelength Radar for Identification of Hydrometeor Phases. J. Appl. Meteorol. Clim. 2011, 50, 449–456. [Google Scholar] [CrossRef]
- Matrosov, S.Y. Feasibility of using radar differential Doppler velocity and dual-frequency ratio for sizing particles in thick ice clouds. J. Geophys. Res. Atmos. 2011, 116, 1–13. [Google Scholar] [CrossRef]
- Kneifel, S.; Kollias, P.; Battaglia, A.; Leinonen, J.; Maahn, M.; Kalesse, H.; Tridon, F. First observations of triple-frequency radar Doppler spectra in snowfall: Interpretation and ap-plications. Geophy. Res. Lett. 2016, 43, 2225–2233. [Google Scholar] [CrossRef]
- Grecu, M.; Tian, L.; Heymsfield, G.M.; Tokay, A.; Olson, W.S.; Heymsfield, A.J.; Bansemer, A. Nonparametric methodology to estimate precipitating ice from multiple-frequency radar reflectivity observations. J. Appl. Meteorol. Clim. 2018, 57, 2605–2622. [Google Scholar] [CrossRef]
- Mason, S.L.; Hogan, R.J.; Westbrook, C.D.; Kneifel, S.; Moisseev, D.; von Terzi, L. The importance of particle size distribution and internal structure for triple-frequency radar re-trievals of the morphology of snow. Atmos. Meas. Tech. 2019, 12, 4993–5018. [Google Scholar] [CrossRef]
- Barrett, A.I.; Westbrook, C.D.; Nicol, J.C.; Stein, T.H.M. Rapid ice aggregation process revealed through triple-wavelength Doppler spectrum radar analysis. Atmos. Meas. Tech. 2019, 19, 5753–5769. [Google Scholar] [CrossRef]
- Tridon, F.; Battaglia, A.; Chase, R.J.; Turk, F.J.; Leinonen, J.; Kneifel, S.; Mroz, K.; Finlon, J.; Bansemer, A.; Tanelli, S.; et al. The Microphysics of Stratiform Precipitation During OLYMPEX: Compatibility Between Tri-ple-Frequency Radar and Airborne In Situ Observations. J. Geophys. Res. Atmos. 2019, 124, 8764–8792. [Google Scholar] [CrossRef]
- Hogan, R.J.; Westbrook, C.D. Equation for the Microwave Backscatter Cross Section of Aggregate Snowflakes Using the Self-Similar Rayleigh–Gans Approximation. J. Atmos. Sci. 2014, 71, 3292–3301. [Google Scholar] [CrossRef]
- Hogan, R.J.; Honeyager, R.; Tyynelä, J.; Kneifel, S. Calculating the millimetre-wave scattering phase function of snowflakes using the self-similar Rayleigh–Gans Approximation. Q. J. R. Meteorol. Soc. 2017, 143, 834–844. [Google Scholar] [CrossRef]
- L’Ecuyer, T.S.; Stephens, G.L. An Estimation-Based Precipitation Retrieval Algorithm for Attenuating Radars. J. Appl. Meteorol. 2002, 41, 272–285. [Google Scholar] [CrossRef]
- Mech, M.; Maahn, M.; Kneifel, S.; Ori, D.; Orlandi, E.; Kollias, P.; Schemann, V.; Crewell, S. PAMTRA 1.0: The Passive and Active Microwave radiative TRAnsfer tool for simulating radiometer and radar measurements of the cloudy atmosphere. Geosci. Model. Dev. 2020, 13, 4229–4251. [Google Scholar] [CrossRef]
- Tyynelä, J.; Leinonen, J.; Westbrook, C.D.; Moisseev, D.; Nousiainen, T. Applicability of the Rayleigh-Gans approximation for scattering by snowflakes at microwave frequencies in vertical incidence. J. Geophys. Res. Atmos. 2013, 118, 1826–1839. [Google Scholar] [CrossRef]
- Leinonen, J.; Moisseev, D.; Nousiainen, T. Linking snowflake microstructure to multi-frequency radar observations. J. Geophys. Res. Atmos. 2013, 118, 3259–3270. [Google Scholar] [CrossRef]
- Zhang, P.C.; Wang, Z.H. A Study on Algorithm to Make Attenuation Correction to Radar Observations of Radar Reflectivity Factor (I): Theoretical Analysis. Plateau Meteorol. 2001, 20, 1–5. [Google Scholar]
- Rosenkranz, P.W. Water vapor microwave continuum absorption: A comparison of measurements and models. Radio Sci. 1998, 33, 919–928, reprinted in Radio Sci. 1999, 34, 1025. [Google Scholar] [CrossRef]
- Liebe, H.J.; Hufford, G.A.; Cotton, M.G. Propagation Modeling of Moist Air and Suspended Water/Ice Particles below 1000GHz. In Proceedings of the Special Meeting of the Electromagnetic Wave Propagation Panel Symposium, Palma de Mal/orca, Spain, 17–20 May 1993. [Google Scholar]
- Neto, J.D.; Kneifel, S.; Ori, D.; Trömel, S.; Handwerker, J.; Bohn, B.; Hermes, N.; Mühlbauer, K.; Lenefer, M.; Simmer, C. The TRIple-frequency and Polarimetric radar Experiment for improving process observations of winter precipitation. Earth Syst. Sci. Data 2019, 11, 845–863. [Google Scholar] [CrossRef]
- Liao, L.; Meneghini, R. Physical Evaluation of GPM DPR Single- and Dual-Wavelength Algorithms. J. Atmos. Ocean. Technol. 2019, 36, 883–902. [Google Scholar] [CrossRef]
- Kalogeras, P.; Battaglia, A. Improving Millimeter Radar Attenuation Corrections in High-Latitude Mixed-Phase Clouds via Radio Soundings and a Suite of Active and Passive Instruments. IEEE Trans. Geosci. Remote. Sens. 2022, 60, 4303611. [Google Scholar] [CrossRef]
Figure 1.
The schematic diagram of the triple-frequency radar system of the Institute of Atmospheric Physics (square cabin system (a), Triple-frequency multiantenna coaxial scanning dual-polarization Doppler radar equipment (b)).
Figure 1.
The schematic diagram of the triple-frequency radar system of the Institute of Atmospheric Physics (square cabin system (a), Triple-frequency multiantenna coaxial scanning dual-polarization Doppler radar equipment (b)).
Figure 2.
The gas and hydrometeor attenuation coefficient at the triple-frequency radar at 06:00 UTC on 21 January 2022. (Black represents the Rosenkranz98 method, blue represents the Liebe93 method).
Figure 2.
The gas and hydrometeor attenuation coefficient at the triple-frequency radar at 06:00 UTC on 21 January 2022. (Black represents the Rosenkranz98 method, blue represents the Liebe93 method).
Figure 3.
The attenuation coefficient for the triple-frequency radar at different snowflake diameters at a temperature −10 °C: (a) Rayleigh scattering, (b) Mie scattering, (c) T matrix scattering, (d) SSRGA scattering.
Figure 3.
The attenuation coefficient for the triple-frequency radar at different snowflake diameters at a temperature −10 °C: (a) Rayleigh scattering, (b) Mie scattering, (c) T matrix scattering, (d) SSRGA scattering.
Figure 4.
Comparison of gas and stratiform clouds with snowfall microphysical properties attenuation correction using Rayleigh, Mie, T matrix and SSRGA models for the effective reflectivity profile of the X-band radar at 8:35 UTC of 21 January 2022.
Figure 4.
Comparison of gas and stratiform clouds with snowfall microphysical properties attenuation correction using Rayleigh, Mie, T matrix and SSRGA models for the effective reflectivity profile of the X-band radar at 8:35 UTC of 21 January 2022.
Figure 5.
Comparison of gas and stratiform clouds with snowfall microphysical properties attenuation correction using Rayleigh, Mie, T matrix and SSRGA models for the effective reflectivity profile of the Ka-band radar at 8:35 UTC of 21 January 2022.
Figure 5.
Comparison of gas and stratiform clouds with snowfall microphysical properties attenuation correction using Rayleigh, Mie, T matrix and SSRGA models for the effective reflectivity profile of the Ka-band radar at 8:35 UTC of 21 January 2022.
Figure 6.
Comparison of gas and stratiform clouds with snowfall microphysical properties attenuation correction using Rayleigh, Mie, T matrix and SSRGA model for the effective reflectivity profile of the W-band radar at 8:35 UTC of 21 January 2022.
Figure 6.
Comparison of gas and stratiform clouds with snowfall microphysical properties attenuation correction using Rayleigh, Mie, T matrix and SSRGA model for the effective reflectivity profile of the W-band radar at 8:35 UTC of 21 January 2022.
Figure 7.
Comparison of attenuations due to gas and stratiform clouds with snowfall microphysical properties before (a) and after (b) the correction of effective reflectivity for W-band radar; the effective reflectivity of Ka-band (c), and X-band radar (d); the dual-frequency ratio of X-Ka (e), Ka-W (f), and Ka-W (the W-band radar reflectivity is after attenuation correction) (g) band radar of 21 January 2022 between 8:04 and 9:25 (UTC). The continuous line and dashed line are the −10 °C and −15 °C isotherms (provided by the ECMWF reanalysis data), respectively.
Figure 8.
Comparison of attenuations due to gas and stratiform clouds with snowfall microphysical properties before (a) and after (b) the correction of effective reflectivity for W-band radar, the effective reflectivity of Ka-band (c) and X-band radar (d); the dual-frequency ratio of X-Ka (e), Ka-W (f) and Ka-W (the W-band radar reflectivity is after attenuation correction) (g) band radar of 17 March 2022 between 19:54 and 18 March 2022 5:25 (UTC). The continuous line and dashed line are the −5 °C and −15 °C isotherms (provided by the ECMWF reanalysis data), respectively.
Figure 9.
The attenuated radar reflectivity at the MRR-2 of 20 January 2022.
Figure 9.
The attenuated radar reflectivity at the MRR-2 of 20 January 2022.
Table 1.
Technical specifications and settings of the three vertically pointing radars operated at Zhangshanying of Yanqing site.
Table 1.
Technical specifications and settings of the three vertically pointing radars operated at Zhangshanying of Yanqing site.
| Specifications | X | Ka | W |
|---|
| Frequency/GHz | 9.375 | 35.015 | 94.5 |
| Pulse repetition period/μs | 833–1667 | 833–1667 | 100–500 |
| Detection capability/dBz | −21@5 km | −34@5 km | −22@5 km |
| Antenna gain/dB | 43.6 | 54.57 | 56.4 |
| 3 dB beam width/° | 1 | 0.33 | 0.24 |
| Average transmit power/W | 118 | 55.5 | 16.3 |
| Noise figure/dB | 2.9 | 3.8 | 5.1 |
| Range resolution/m | 10, 30 | 10, 30 | 30, 120 |
| Pulse repetition frequency/Hz | 2500 | 2500 | 5000 |
| Wavelength/mm | 32.017 | 8.566 | 3.171 |
| Disclaimer/Publisher’s Note: The statements, opinions and data contained in all publications are solely those of the individual author(s) and contributor(s) and not of MDPI and/or the editor(s). MDPI and/or the editor(s) disclaim responsibility for any injury to people or property resulting from any ideas, methods, instructions or products referred to in the content. |
© 2023 by the authors. Licensee MDPI, Basel, Switzerland. This article is an open access article distributed under the terms and conditions of the Creative Commons Attribution (CC BY) license (https://creativecommons.org/licenses/by/4.0/).


 ,
, 


