Article

Evaluation of the Monitoring Capability of 20 Vegetation Indices and 5 Mainstream Satellite Band Settings for Drought in Spring Wheat Using a Simulation Method

1
Faculty of Geographical Science, Beijing Normal University, Beijing 100875, China
2
State Key Laboratory of Remote Sensing Science, Jointly Sponsored by Beijing Normal University and Institute of Remote Sensing and Digital Earth of Chinese Academy of Sciences, Beijing 100875, China
*
Author to whom correspondence should be addressed.
Remote Sens. 2023, 15(19), 4838; https://doi.org/10.3390/rs15194838
Submission received: 6 September 2023 / Revised: 29 September 2023 / Accepted: 4 October 2023 / Published: 6 October 2023
(This article belongs to the Special Issue Remote Sensing for Agrometeorology II)

Abstract

:
This study simulated the canopy reflectance of spring wheat at five distinct growth stages (jointing, booting, heading, flowering, and pustulation) and under four drought scenarios (no drought, mild drought, moderate drought, and severe drought) using the PROSAIL radiative transfer model, and it identified the wavelength range most sensitive to drought. Additionally, the efficacy of 5 mainstream satellites (Sentinel-2, Landsat 8, Worldview-2, MODIS, and GF-2) and 20 commonly utilized remote sensing vegetation indicators (NDVI, SAVI, EVI, ARVI, GVMI, LSWI, VSDI, NDGI, SWIRR, NDWI, PRI, NDII, MSI, WI, SRWI, DSWI, NDREI1, NDREI2, ZMI, and MTCI) in drought monitoring was evaluated. The results indicated that the spectral response characteristics of spring wheat canopy reflectance vary significantly across the growth stages. Notably, the wavelength ranges of 1405–1505 nm and 2140–2190 nm were identified as optimal for drought monitoring throughout the growth period. Considering only the spectral bands, MODIS band 7 was determined to be the most suitable satellite band for monitoring drought in spring wheat at different growth stages. Among the 20 indices examined, WI, MSI, and SRWI, followed by LSWI and GVMI calculated using MODIS bands 2 and 6 as well as bands 8 and 11 of Sentinel-2, demonstrated superior capabilities in differentiating drought scenarios. These conclusions have important implications because they provide valuable guidance for selecting remote sensing drought monitoring data and vegetation indices, and they present insights for future research on the design of new remote sensing indices for assisting drought monitoring and the configuration of remote sensing satellite sensors.

1. Introduction

Drought is a natural disaster caused by a deficiency in precipitation over a period in a certain area. Agricultural drought is a type of drought disaster that occurs worldwide and affects a large population [1]. It has a tremendous impact on agriculture, which is a fundamental sector of human society [2]. In the context of the ongoing climate change, numerous studies have indicated an increase in the frequency and severity of future drought disasters [3,4]. Wheat is a pivotal staple crop worldwide. It plays a crucial role in satisfying over 20% of the caloric and protein requirements of the global population [5]. China is the largest producer and consumer of wheat globally and confronts water scarcity as the primary constraint on wheat yield within its extensive arid and semi-arid regions [6]. The development of a drought monitoring approach that can be applied effectively to different growth stages of wheat is of significant importance.
Drought can reduce crop vitality, relative leaf water content, and chlorophyll content. This, in turn, affects photosynthesis and causes a series of variations in crop physiological and biochemical parameters. This ultimately alters the characteristics of the crop reflectance spectra. Numerous laboratory and field control experiments have been conducted to investigate the spectral responses of various crops under water stress. This has yielded valuable information from the characteristics of the reflectance spectra [7,8,9]. However, the impact of drought on agriculture is related to factors such as the severity of crop drought, crop type, and crop growth stage. The remote sensing observation data were also influenced by the band settings and observed geometric angles. Collecting crop spectral data from laboratories or on-site under different growth stages, drought scenarios, and observation conditions requires a considerable amount of time, money, and labor. In addition to laboratory and on-site observations, radiative transfer models can simulate crop canopy spectral information under different drought scenarios. Among these, the PROSAIL model has gained significant recognition and widespread use among researchers [10]. A few studies have examined the response of canopy reflectance to variations in the water status and other stresses using the PROSAIL model [11,12,13]. Compared with measurement data, simulation data based on radiation transfer models are inexpensive, have a large data volume, and can comprehensively consider different drought degrees, growth stages of crops, and observation geometric conditions.
Vegetation indices derived from satellite images have been widely used to estimate agricultural drought [14,15,16], although some of them may not have been originally designed specifically for drought monitoring. On the one hand, with the development of new sensors, new remote sensing drought indices are being developed continuously [1]. On the other hand, agricultural drought is influenced by many factors including the climatic conditions, crop characteristics, and cultivation conditions. An increasing number of researchers are coupling meteorological and remote sensing data to develop comprehensive drought indices that improve the accuracy of drought monitoring [17,18]. Various vegetation indices are frequently used as input variables to construct comprehensive drought indices [19,20]. Therefore, evaluating the capability of existing vegetation indices to reflect drought can provide methodological guidance for drought monitoring and a reference for designing new drought indices. Many previous studies have evaluated the capability of vegetation indices to monitor drought by analyzing the correlation between these indices and related indices that reflect drought, such as meteorological drought indices (SPI, SPE, etc.), soil moisture, and leaf moisture content [21,22]. Most researchers select vegetation indices calculated using specific satellites for evaluation [23,24]. However, owing to the differences in the band settings of different satellites, the values of a vegetation index calculated using different satellites vary [25,26,27]. Additionally, the capability of the same vegetation index to respond to different drought intensities at different crop growth stages may differ. To summarize, there is currently a deficiency of systematic evaluations of the vegetation index drought monitoring capabilities that consider band settings, crop growth stages, and drought severity.
In this study, we focused on spring wheat using a radiative transfer model (PROSAIL) to simulate canopy reflectance at five distinct growth stages (jointing, booting, heading, flowering, and postulation) and four drought scenarios (ranging from no drought to mild, moderate, and severe drought conditions). We analyzed the response of spring wheat canopy reflectance to variations in water conditions across different wavelengths. The specific objectives of our research were as follows: (1) to identify the most suitable wavelength range for monitoring drought and reveal the relationship between spring wheat canopy spectra and drought, (2) to evaluate the capability of five mainstream remote sensing satellites to monitor spring wheat drought from a spectral perspective, and (3) to assess the capability of 20 commonly used vegetation indicators to reflect drought and verify their applicability based on actual satellite images. This study provided valuable insights into the selection of remote-sensing drought monitoring data and indices.

2. Materials and Methods

2.1. Radiative Transfer Model PROSAIL

The PROSAIL model is a widely employed tool for canopy spectral simulation. It integrates the PROSPECT and SAIL models [10]. SAIL simulates the spectral reflectance of the canopy. It requires inputs such as leaf reflectance ρ l and transmittance τ l derived from PROSPECT, the canopy structure parameters, the observed geometric parameters, and the soil reflectance ρ s [8].
To simulate the wheat canopy reflectance spectra across five growth stages under four drought scenarios, it was necessary to input various physiological parameters of wheat at different growth stages, soil background spectra under different drought scenarios, and diverse observational geometric parameters into the PROSAIL model. Among the different input parameters, the chlorophyll a + b content (Cab), dry matter content (Cm), leaf area index (LAI), and equivalent water thickness (EWT) primarily correspond to the wheat growth period and drought scenarios. We generated the input values for Cab, Cm, LAI, and EWT based on field control experiment data obtained from Ge et al. in 2017 [28]. Using Cab as an example, for the mild drought scenario, we first calculated the mean of all the observed Cab values under mild and moderate drought conditions within a specific growth period. We then calculated the mean of all the Cab values observed under non-drought and mild drought conditions. After that, these two calculated values were used as the upper and lower limits of the 99% confidence interval of the normal distribution. Finally, 20 Cab values were randomly generated from the normal distribution. Using a similar methodology, we generated input values for Cab, Cm, LAI, and EWT for the five growth stages and four drought scenarios. The soil spectrum was set using the default settings of the PROSAIL model, and a soil brightness factor ALFA was introduced to represent the variation of soil water content [29]. The other input parameters were established based on a review by Berger et al. in 2018 [30]. Using the aforementioned parameter settings (Table 1), we generated 4200 spectral reflectance curves for each growth stage.

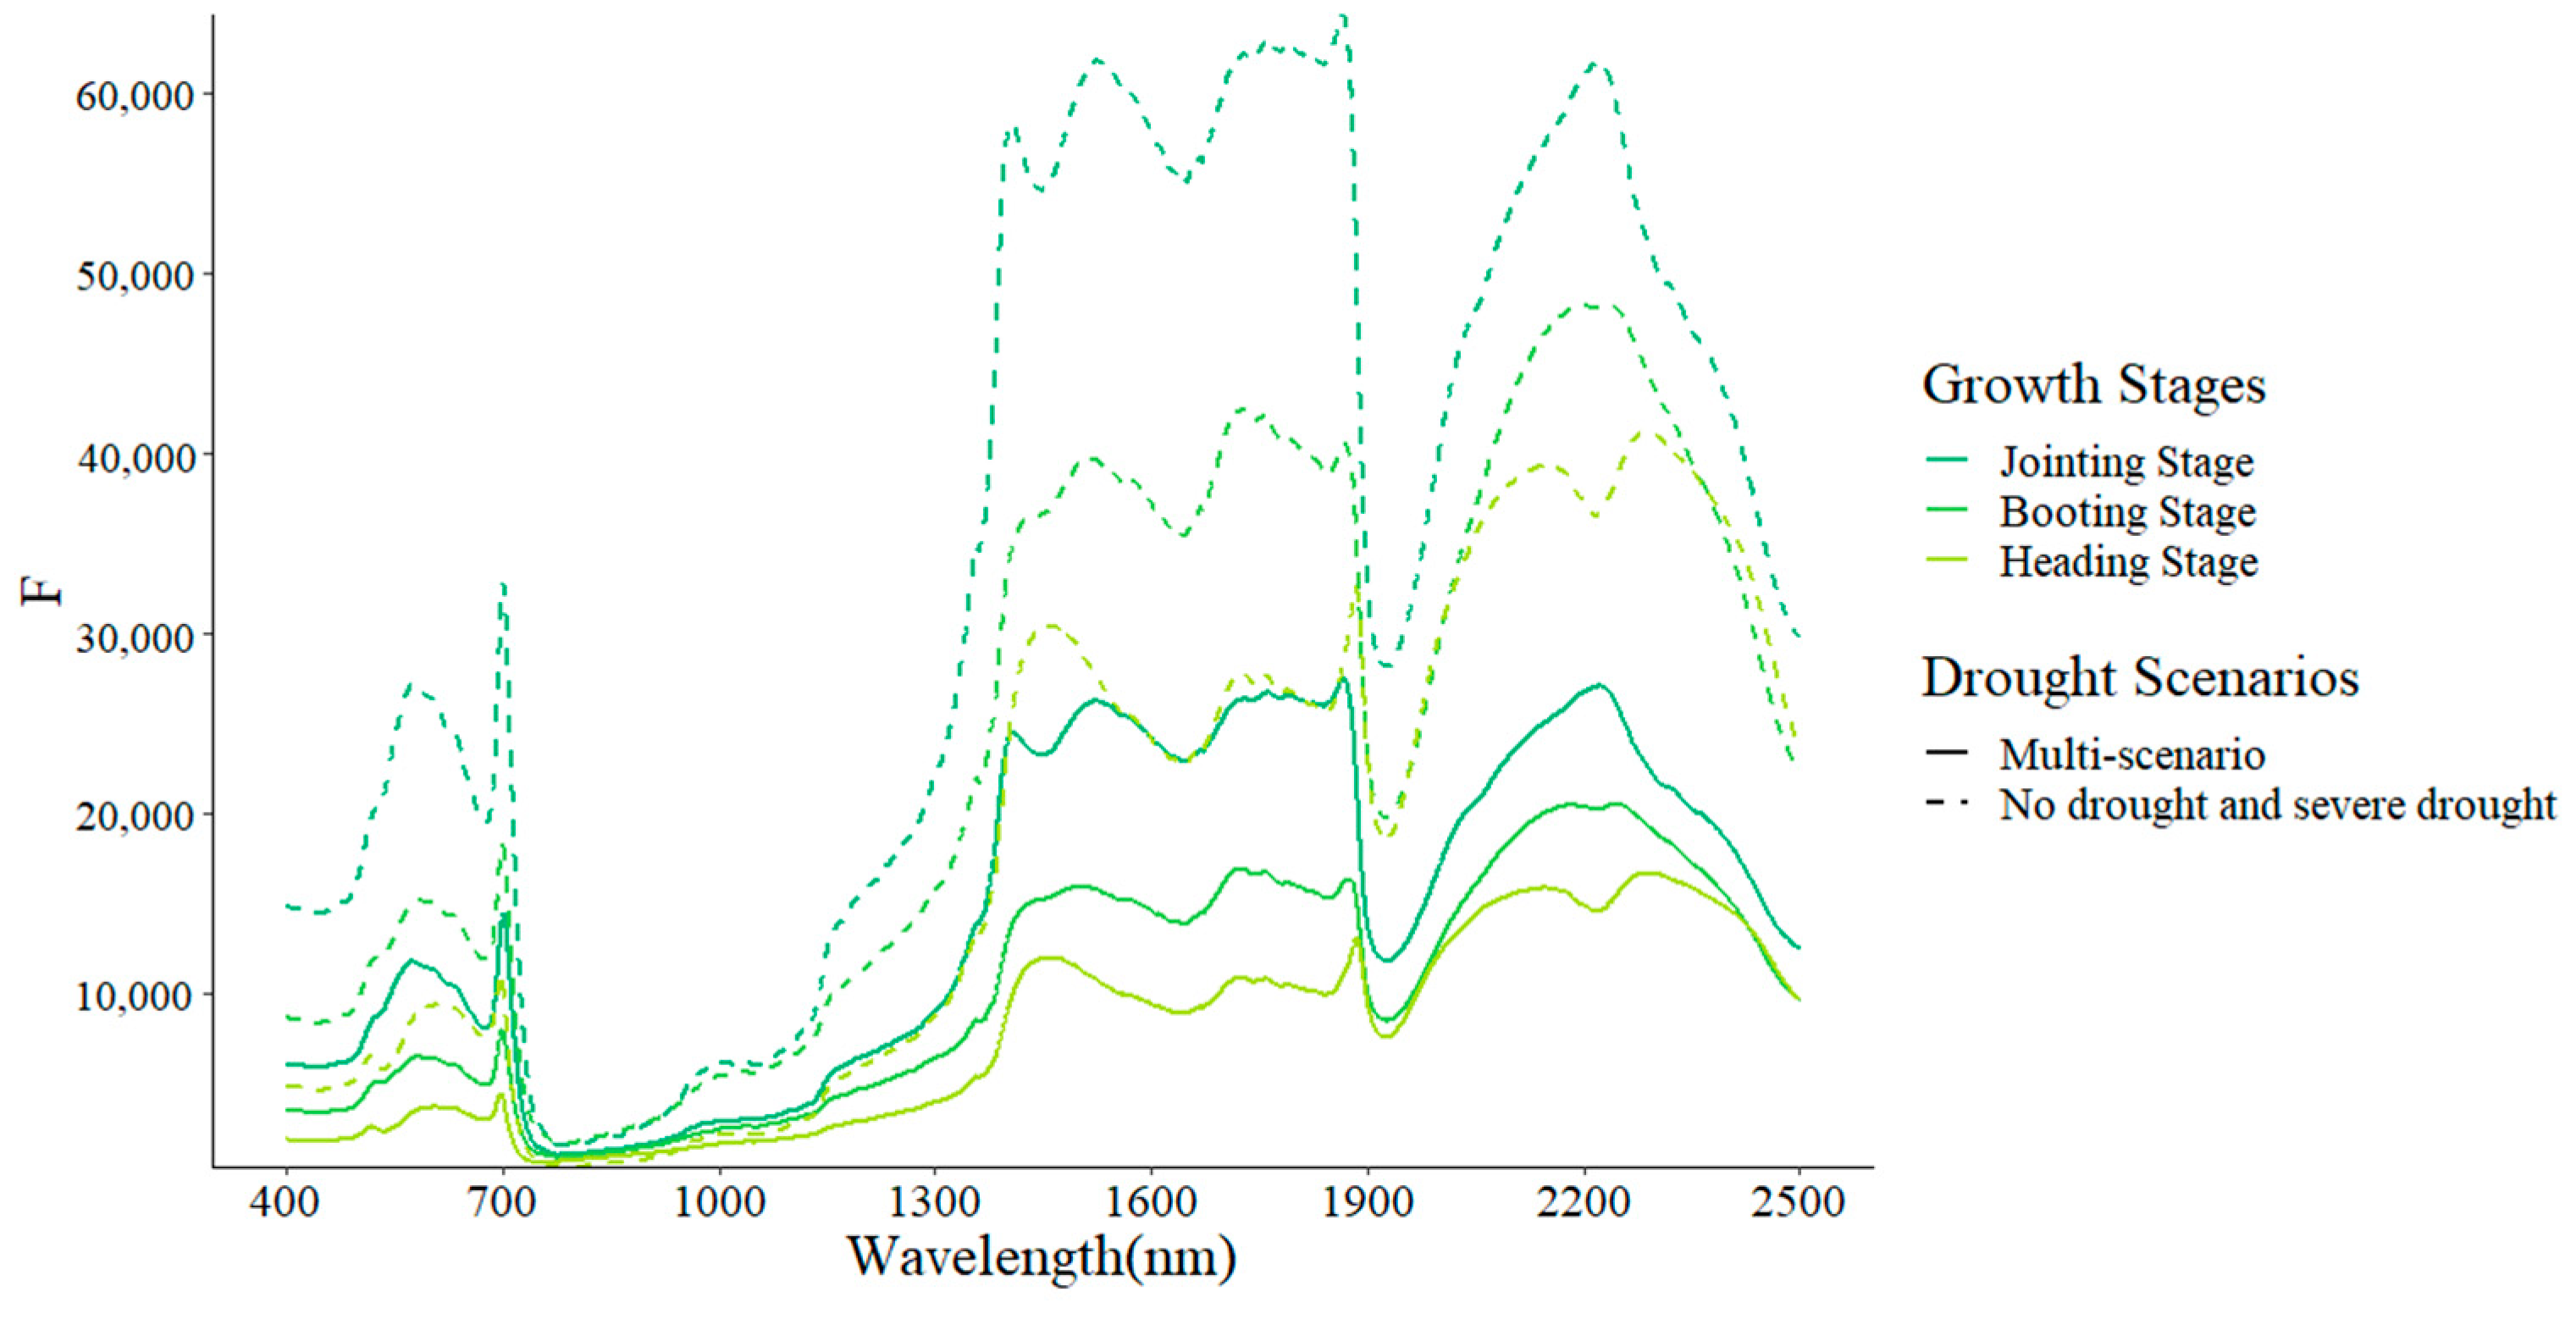
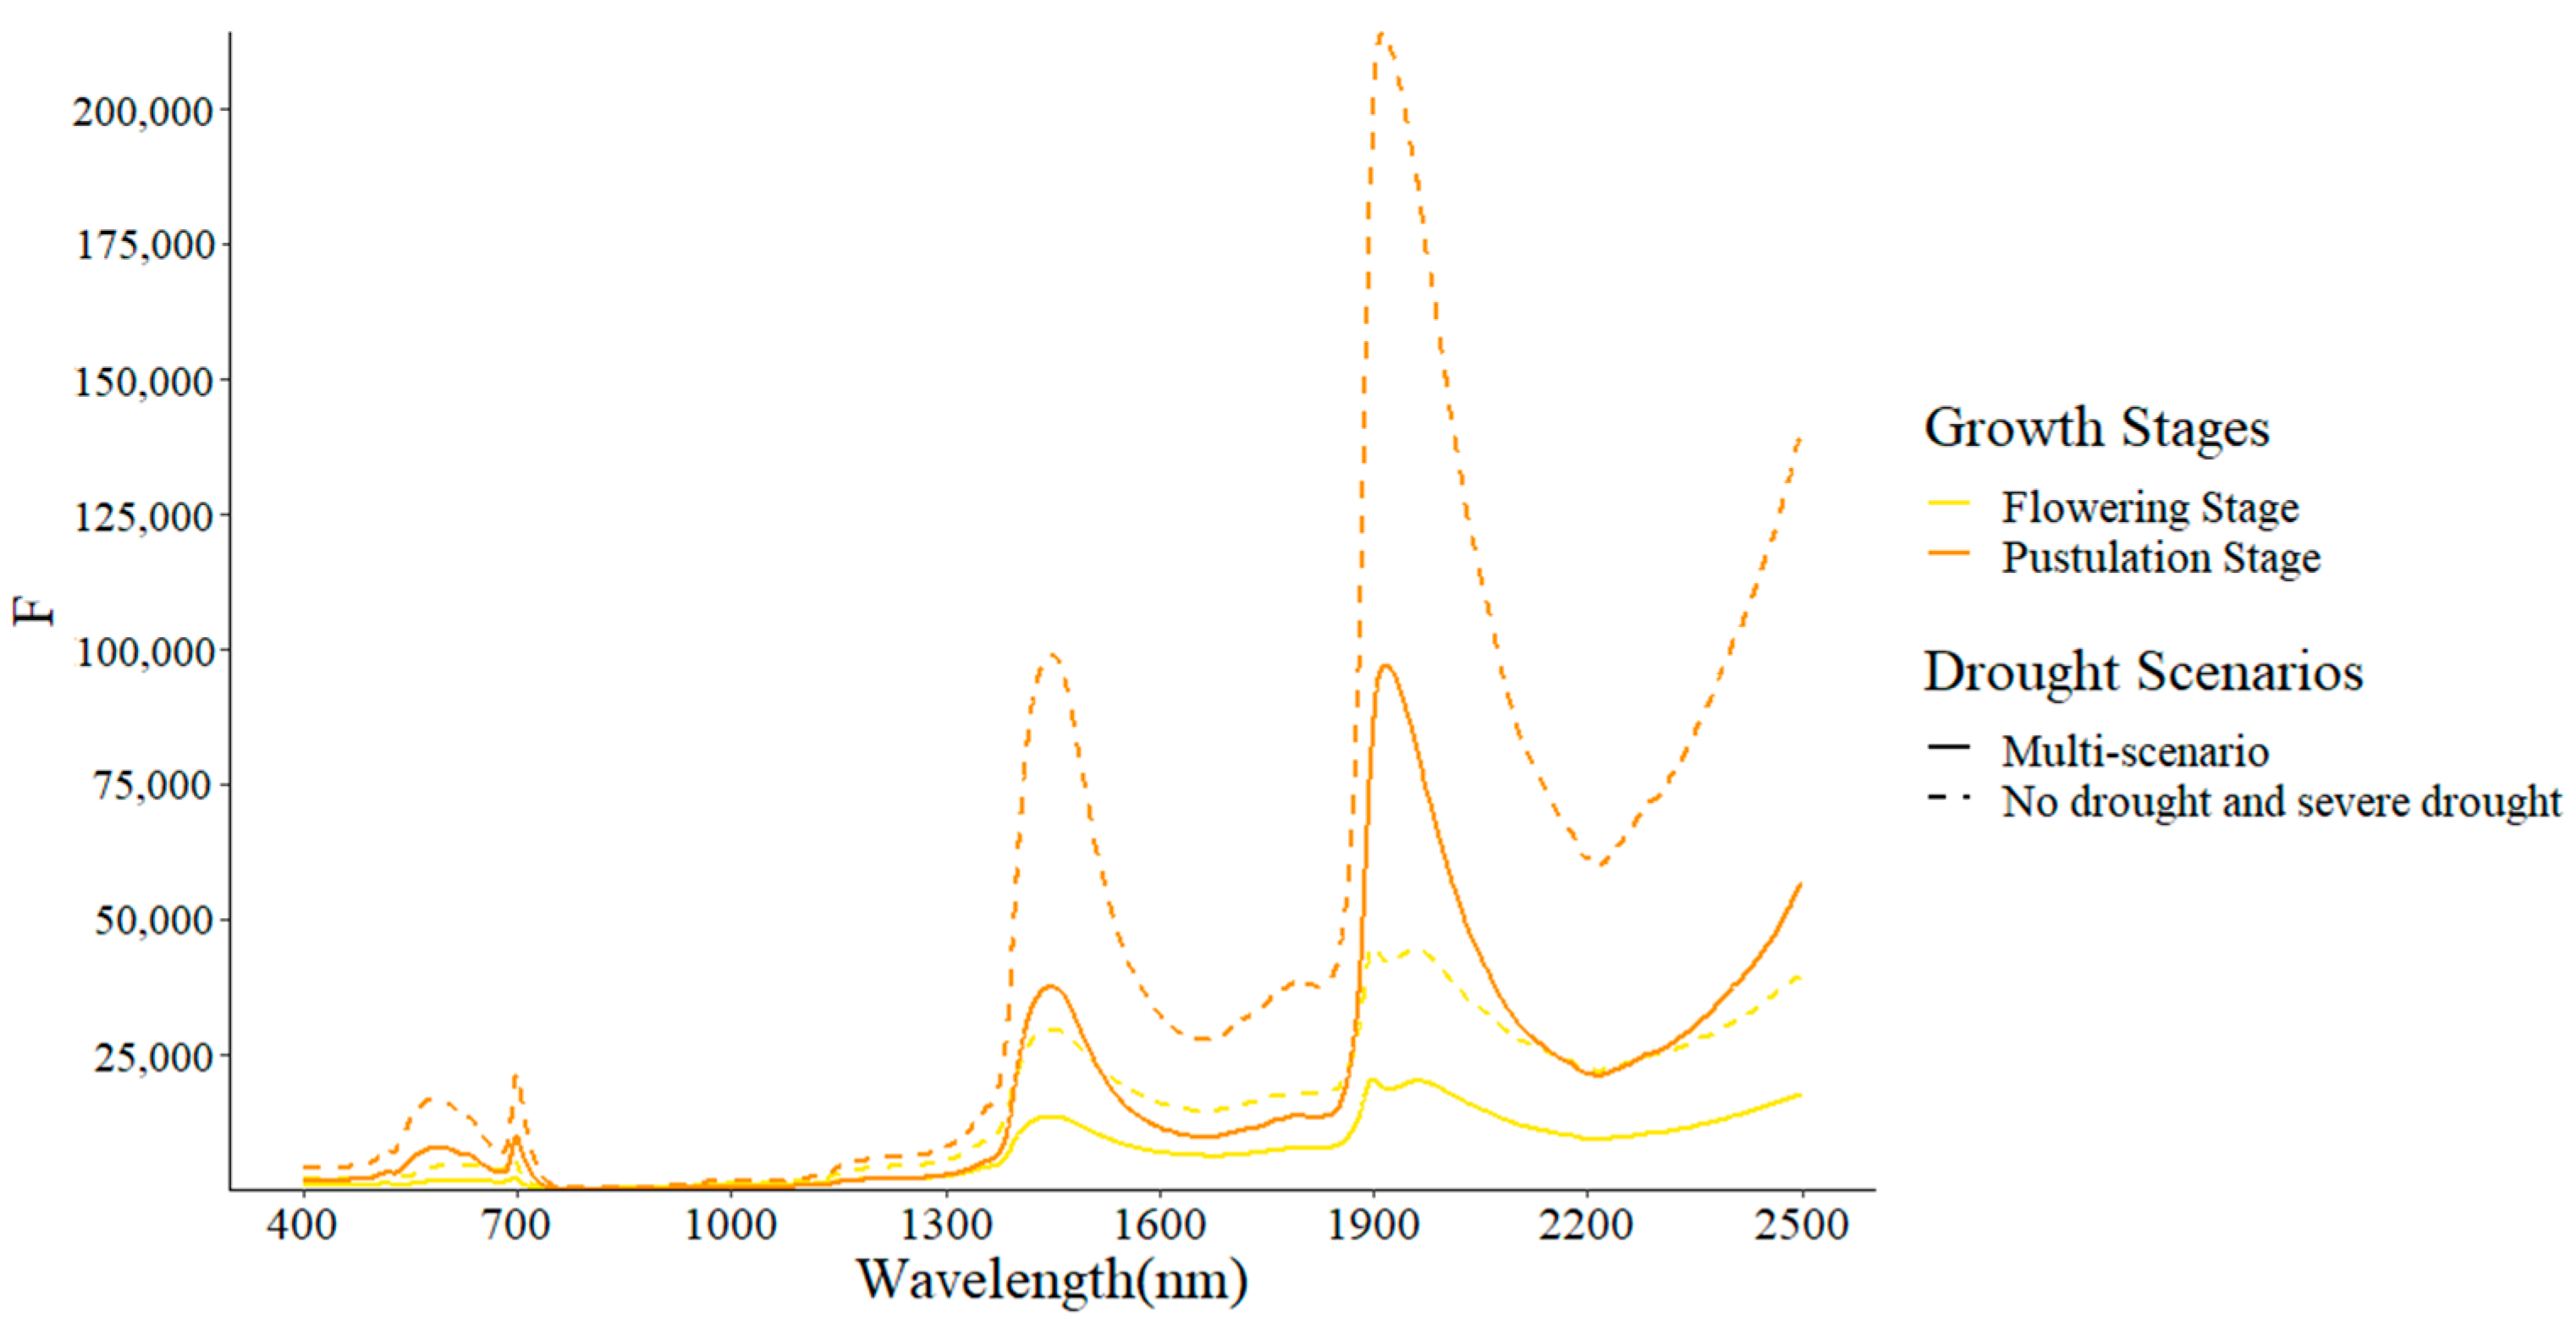
2.2. Analysis of the Response Pattern of Different Wavelength Range and Satellite Bands to Drought

Analysis of variance (ANOVA) is a statistical method employed to assess the significance of differences in sample means across two or more groups. In this study, we utilized the F-value obtained using variance analysis (Equation (1)) to quantify the distinctions in wheat reflectance spectra at specific wavelengths under different drought scenarios. A higher F-value indicates a larger disparity between two or more groups of samples. This, in turn, indicates that the reflectance at a particular wavelength is more responsive to variations in water conditions.
F = S a f a S e f e
where S a represents the variance between groups. It indicates the variability in reflectance among different drought levels at a specific wavelength (1 nm). S e represents the within-group variance. It reflects the variability in reflectance within a particular drought level at the same wavelength. f a denotes the intergroup degrees of freedom for reflectance under different drought levels, and f e represents the degrees of freedom within the group.
A variance analysis was conducted on the simulated canopy reflectance values within the spectral range of 400–2500 nm, with intervals of 1 nm, under different drought scenarios. The F-values were computed for each wavelength to identify the wavelength range that exhibited the highest sensitivity to variations in water conditions. Additionally, to compare the responses of different bands of the five mainstream satellite sensors (Table 2) to water conditions during the different growth stages of spring wheat, we calculated the average F-value within the designated band range of the five satellite sensors. This analysis enabled us to identify the satellite sensors and their corresponding bands that demonstrated the highest sensitivity to drought stress. Two sets of comparative analyses were conducted. The first set calculated the variance analysis statistic F1 (or F1 mean) between the wheat reflectance datasets at different wavelengths (or bands) under the no-drought and severe drought scenarios. Meanwhile, the second set calculated the variance analysis statistic F2 (or F2 mean) between the wheat reflectance datasets at different wavelengths (or bands) across the four drought levels.

2.3. Evaluation of Remote Sensing Vegetation Indices for Drought Monitoring Based on Simulated Spectral Data

In this study, we selected 20 vegetation indices (Table 3) and evaluated their effectiveness for drought monitoring. These indices commonly utilize two bands that exhibit sensitivity to drought scenarios. The red, blue, near-infrared, and shortwave infrared bands are employed frequently. The calculations were divided into two parts. In the first part, we stringently adhered to the band requirements specified in the vegetation index equations and utilized the canopy spectra generated with the PROSAIL model to compute the indices without considering the real band settings of the satellite sensors. In the second part of the calculation, we considered the specific band settings of different satellites. We first converted the simulated reflectance at various wavelengths to reflectance values within the specific band range of each satellite using the sensor’s spectral response function. Then, we calculated the vegetation indices. The satellites involved in the evaluation include Sentinel-2, Landsat 8, Worldview-2, MODIS, and GF-2. These are likely to be the primary satellite remote sensing data sources for scientific research in the next five years [31].
The evaluation index used in this study is the silhouette coefficient. It serves as a measure for assessing the quality of clustering [49] and ranges between −1 and 1. A value close to 1 indicates that a sample is well-separated from other clusters, a value of zero indicates that a sample does not have a clear assignment to any specific category, and a value of −1 implies that a sample has been assigned incorrectly to a cluster [50]. The formula used to compute the silhouette coefficient for sample i is as follows:
S i = b i a i max a i , b i
where a ( i ) is the average distance between sample i and the other samples within the same cluster, and b i is the minimum average distance between sample i and the samples in all the other clusters. The overall silhouette coefficient for the clustering outcome was obtained by calculating the average silhouette coefficient across all the samples. Prior research has indicated that a silhouette coefficient exceeding 0.5 signifies a reasonable distinction between clusters [50].

2.4. Evaluation of Remote Sensing Vegetation Indices for Drought Monitoring Based on Real Satellite Data

To test the credibility of the conclusions obtained from the simulation results, we selected four vegetation indices and tested their drought monitoring capabilities using real MODIS and Sentinel-2 satellite image data. Two of the vegetation indices were identified using simulation results as having strong drought monitoring capabilities, while the other two were identified as having poor drought monitoring capabilities. Specifically, we selected two typical spring wheat planting areas in northern China for testing: Gansu Province and Baoji City, Shaanxi Province (Figure 1). Gansu Province is the main spring wheat planting area and has been facing the challenge of agricultural drought for decades [51]. In particular, a severe drought event occurred in 2011 [52]. The planting area of spring wheat in Baoji City in 2016 was 187,000 hectares, with a total yield of 838,158 tons [53]. In 2016, a drought event occurred in Shaanxi province, including Baoji city [54].
The data (Table 4) used in testing include 20 MOD09A1 images in Gansu Province from March to July 2011, 4 Sentinel-2 1C-level images of the Baoji city from March to June 2016,the soil moisture data obtained from the ChinaCropSM1 km dataset (which is a fine 1 km daily soil moisture dataset for dryland wheat and maize across China) [55], and the spatial distribution of spring wheat obtained from Luo’s work on the harvest areas for three staple crops in China [56].
The data processing process is as follows: first, atmospheric correction of the Sentinel-2 Level-1C data was conducted using Sen2Cor. Second, resampling of the Sentinel-2 images is processed, and all band resolutions are 10 m. Subsequently, in each testing area, we extracted soil moisture data from spring wheat pixels and sorted them from high to low according to soil moisture. Then, we calculated their 4 corresponding vegetation indices and selected the pixels with the highest 1% soil moisture and the pixels with the lowest 1% soil moisture. After that, the contour coefficients of the four vegetation indices corresponding to these two parts of pixels for each image were calculated.

3. Results

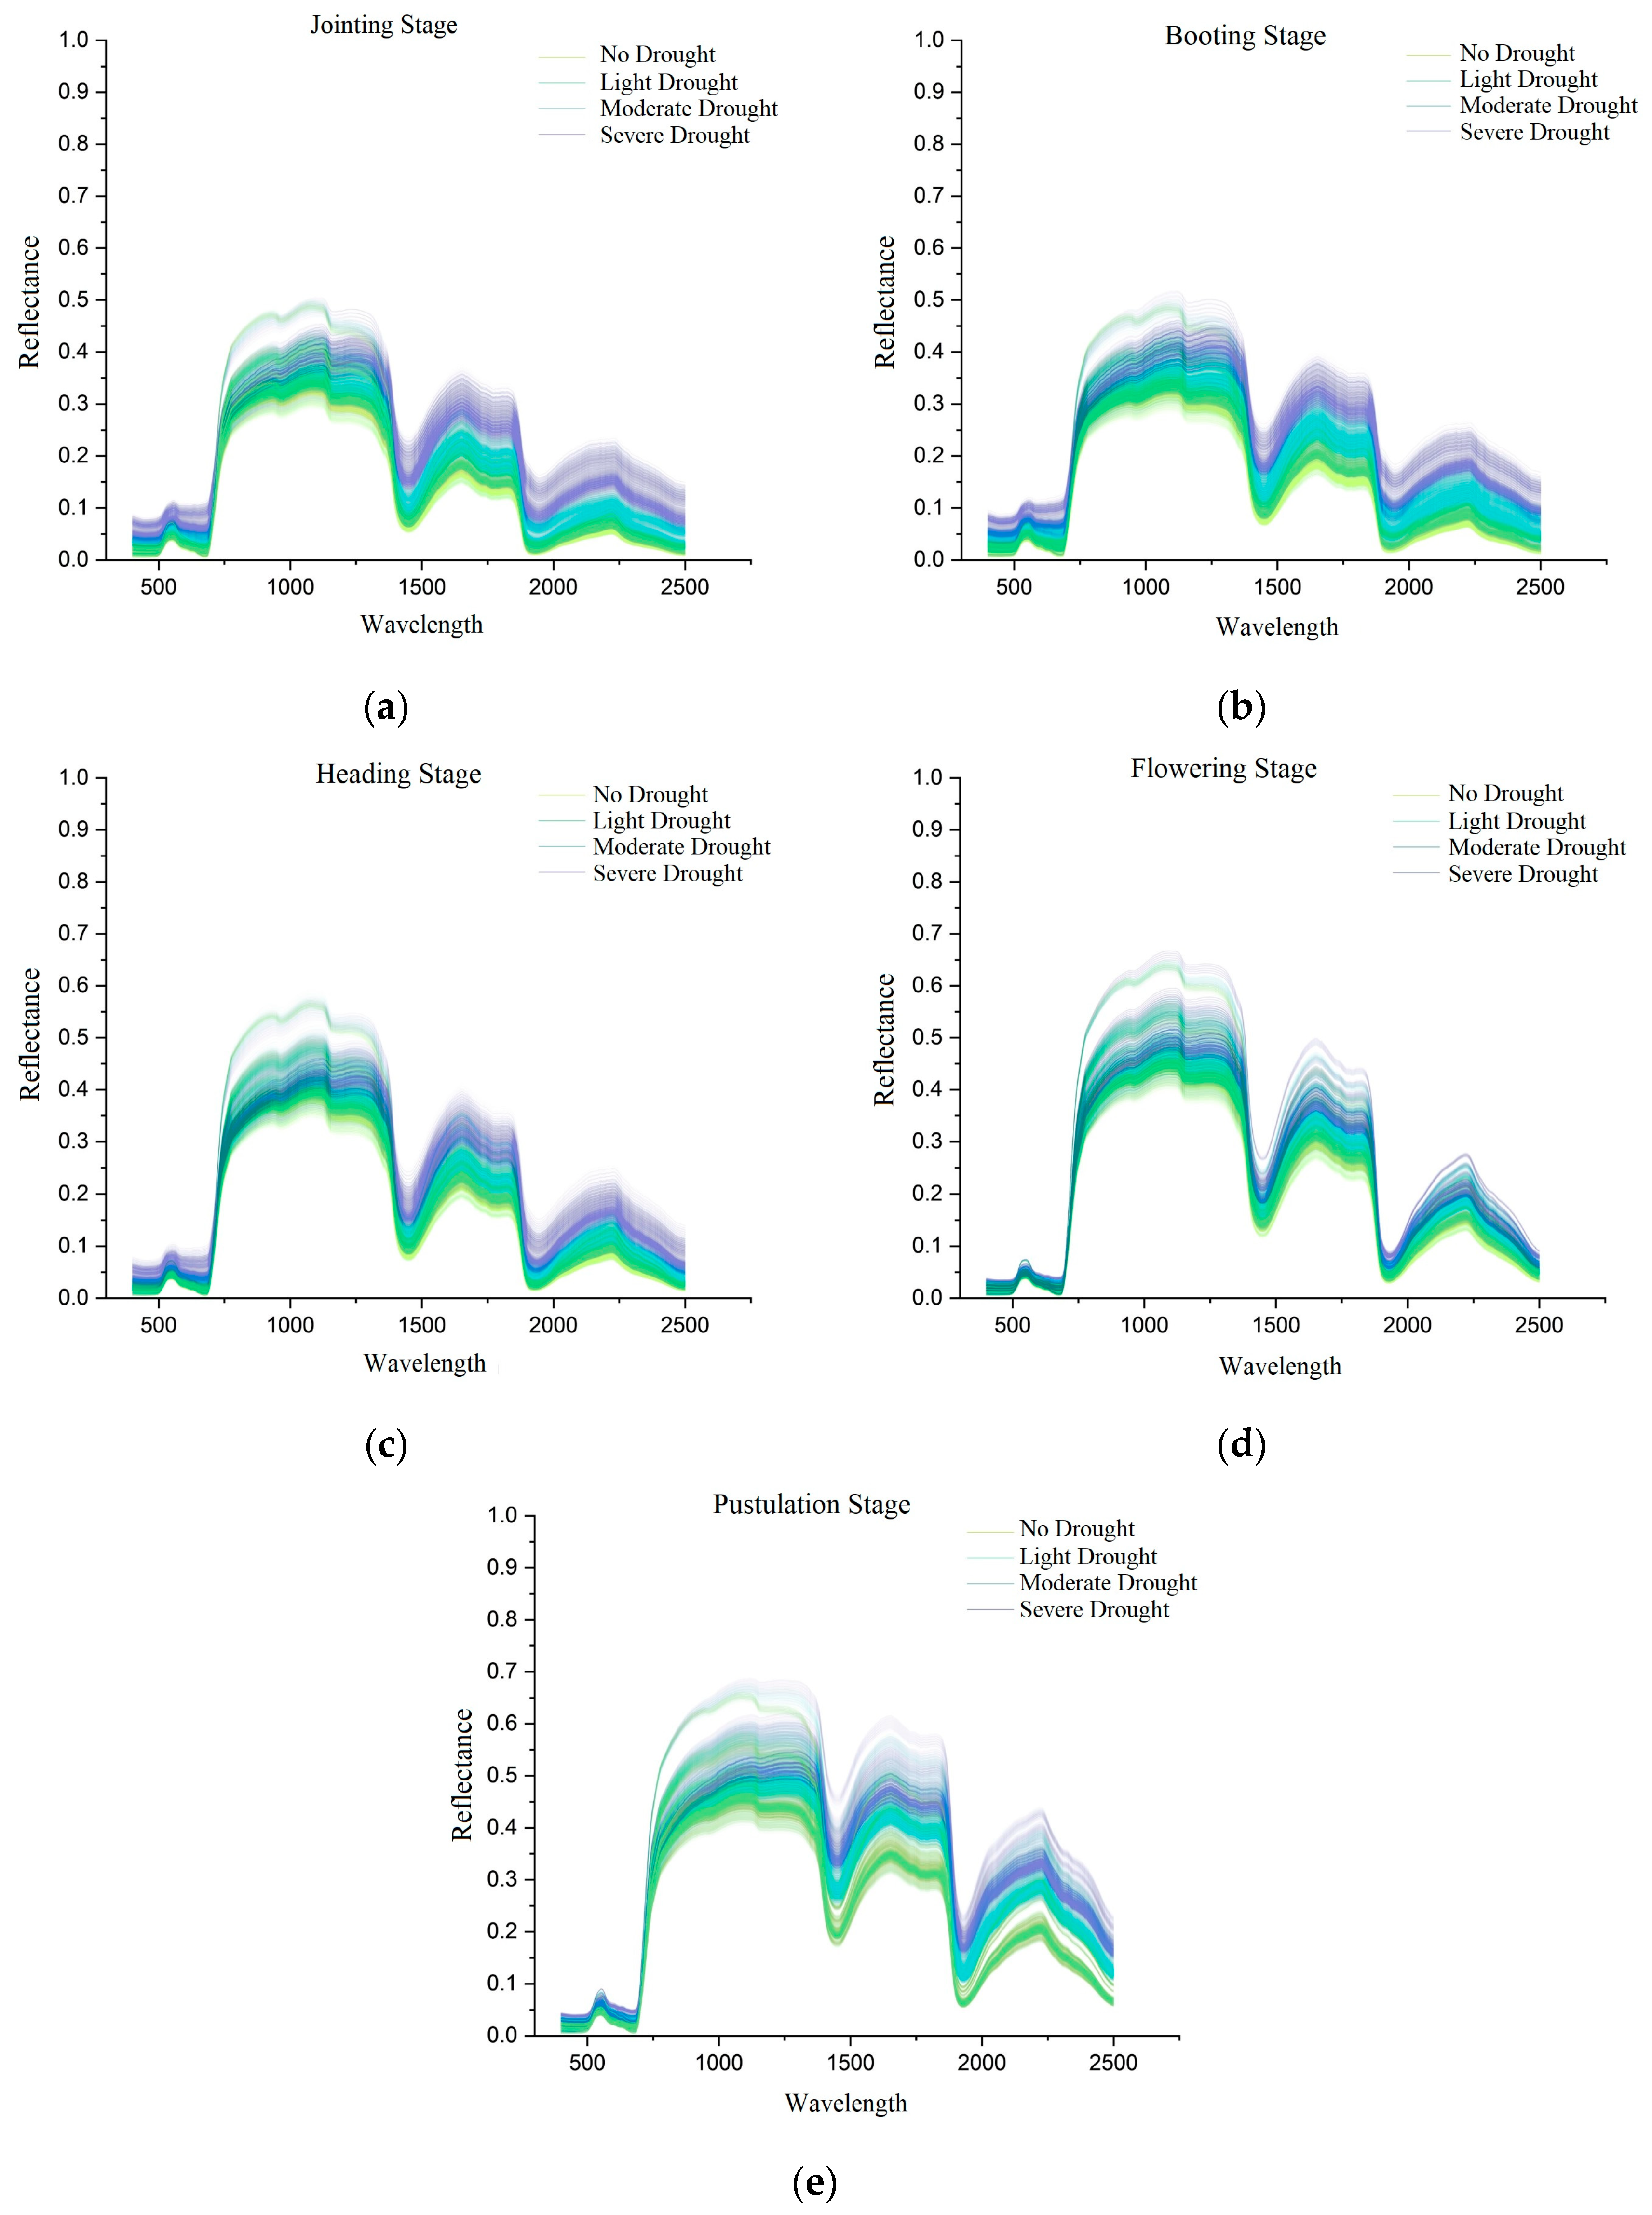
3.1. Spring Wheat Spectra Simulation and Analysis

Figure 2 illustrates the simulated canopy reflectance spectra across the five growth stages and four drought scenarios. The response of canopy reflectance to drought varied among the main growth stages. The influence of water conditions on the vegetation canopy reflectance within 0.4–2.5 μm encompasses both primary and secondary effects [57]. The former signifies direct variations in canopy reflectance owing to alterations in the water status, while the latter denotes the modifications in physiological parameters resulting from moisture variations, which subsequently affect the vegetation canopy reflectance.
The reflectance of the wheat canopy within the visible range of 400–700 nm is predominantly affected by pigments, particularly chlorophyll [58]. Simulation results from different growth stages and drought scenarios revealed that during the jointing, booting, and heading stages, the reflectance increased gradually at 600–700 nm, whereas the absorption valley reduced gradually with intensified water stress. This phenomenon occurs primarily because of the absorption of chlorophyll under normal conditions, thereby resulting in a low-reflectance valley within the 600–700 nm range of the wheat canopy spectrum. However, under limited water availability, the EWT and other physiological parameters tend to vary, including a reduction in the chlorophyll content. This indirect consequence of water shortage results in an increase in reflectance within the 600–700 nm range. Conversely, during the subsequent growth stages, the increase in reflectance within the 600–700 nm range is less significant. This is consistent with the observations of Gates [58] in his investigation of Quercus alba. During the early growth stages, when the chlorophyll levels are low and a water deficit occurs, the reflectance peak at 550 nm and absorption valley at 680 nm are more vulnerable to disappearance. However, as plants develop, chlorophyll gradually accumulates. Previous studies have indicated that chlorophyll accumulation is significantly influenced by the light intensity and temperature, which fluctuate as crops grow [59]. Consequently, the chlorophyll content increases gradually with plant growth. This eventually results in the gradual appearance of reflectance features at 550 nm and 680 nm, whereas the plant develops a certain level of tolerance to water shortage.
In the near-infrared (NIR) range of 800–1100 nm, the reflectance depends primarily on the cellular structure of the plant leaves rather than on the chlorophyll content [60]. The canopy reflectance under drought scenarios during the five growth stages was similar to or marginally lower than that under the non-drought conditions. In the mid-infrared (MIR) range of 1300–2500 nm, the canopy reflectance increased progressively as the intensity of the water deficit increased.

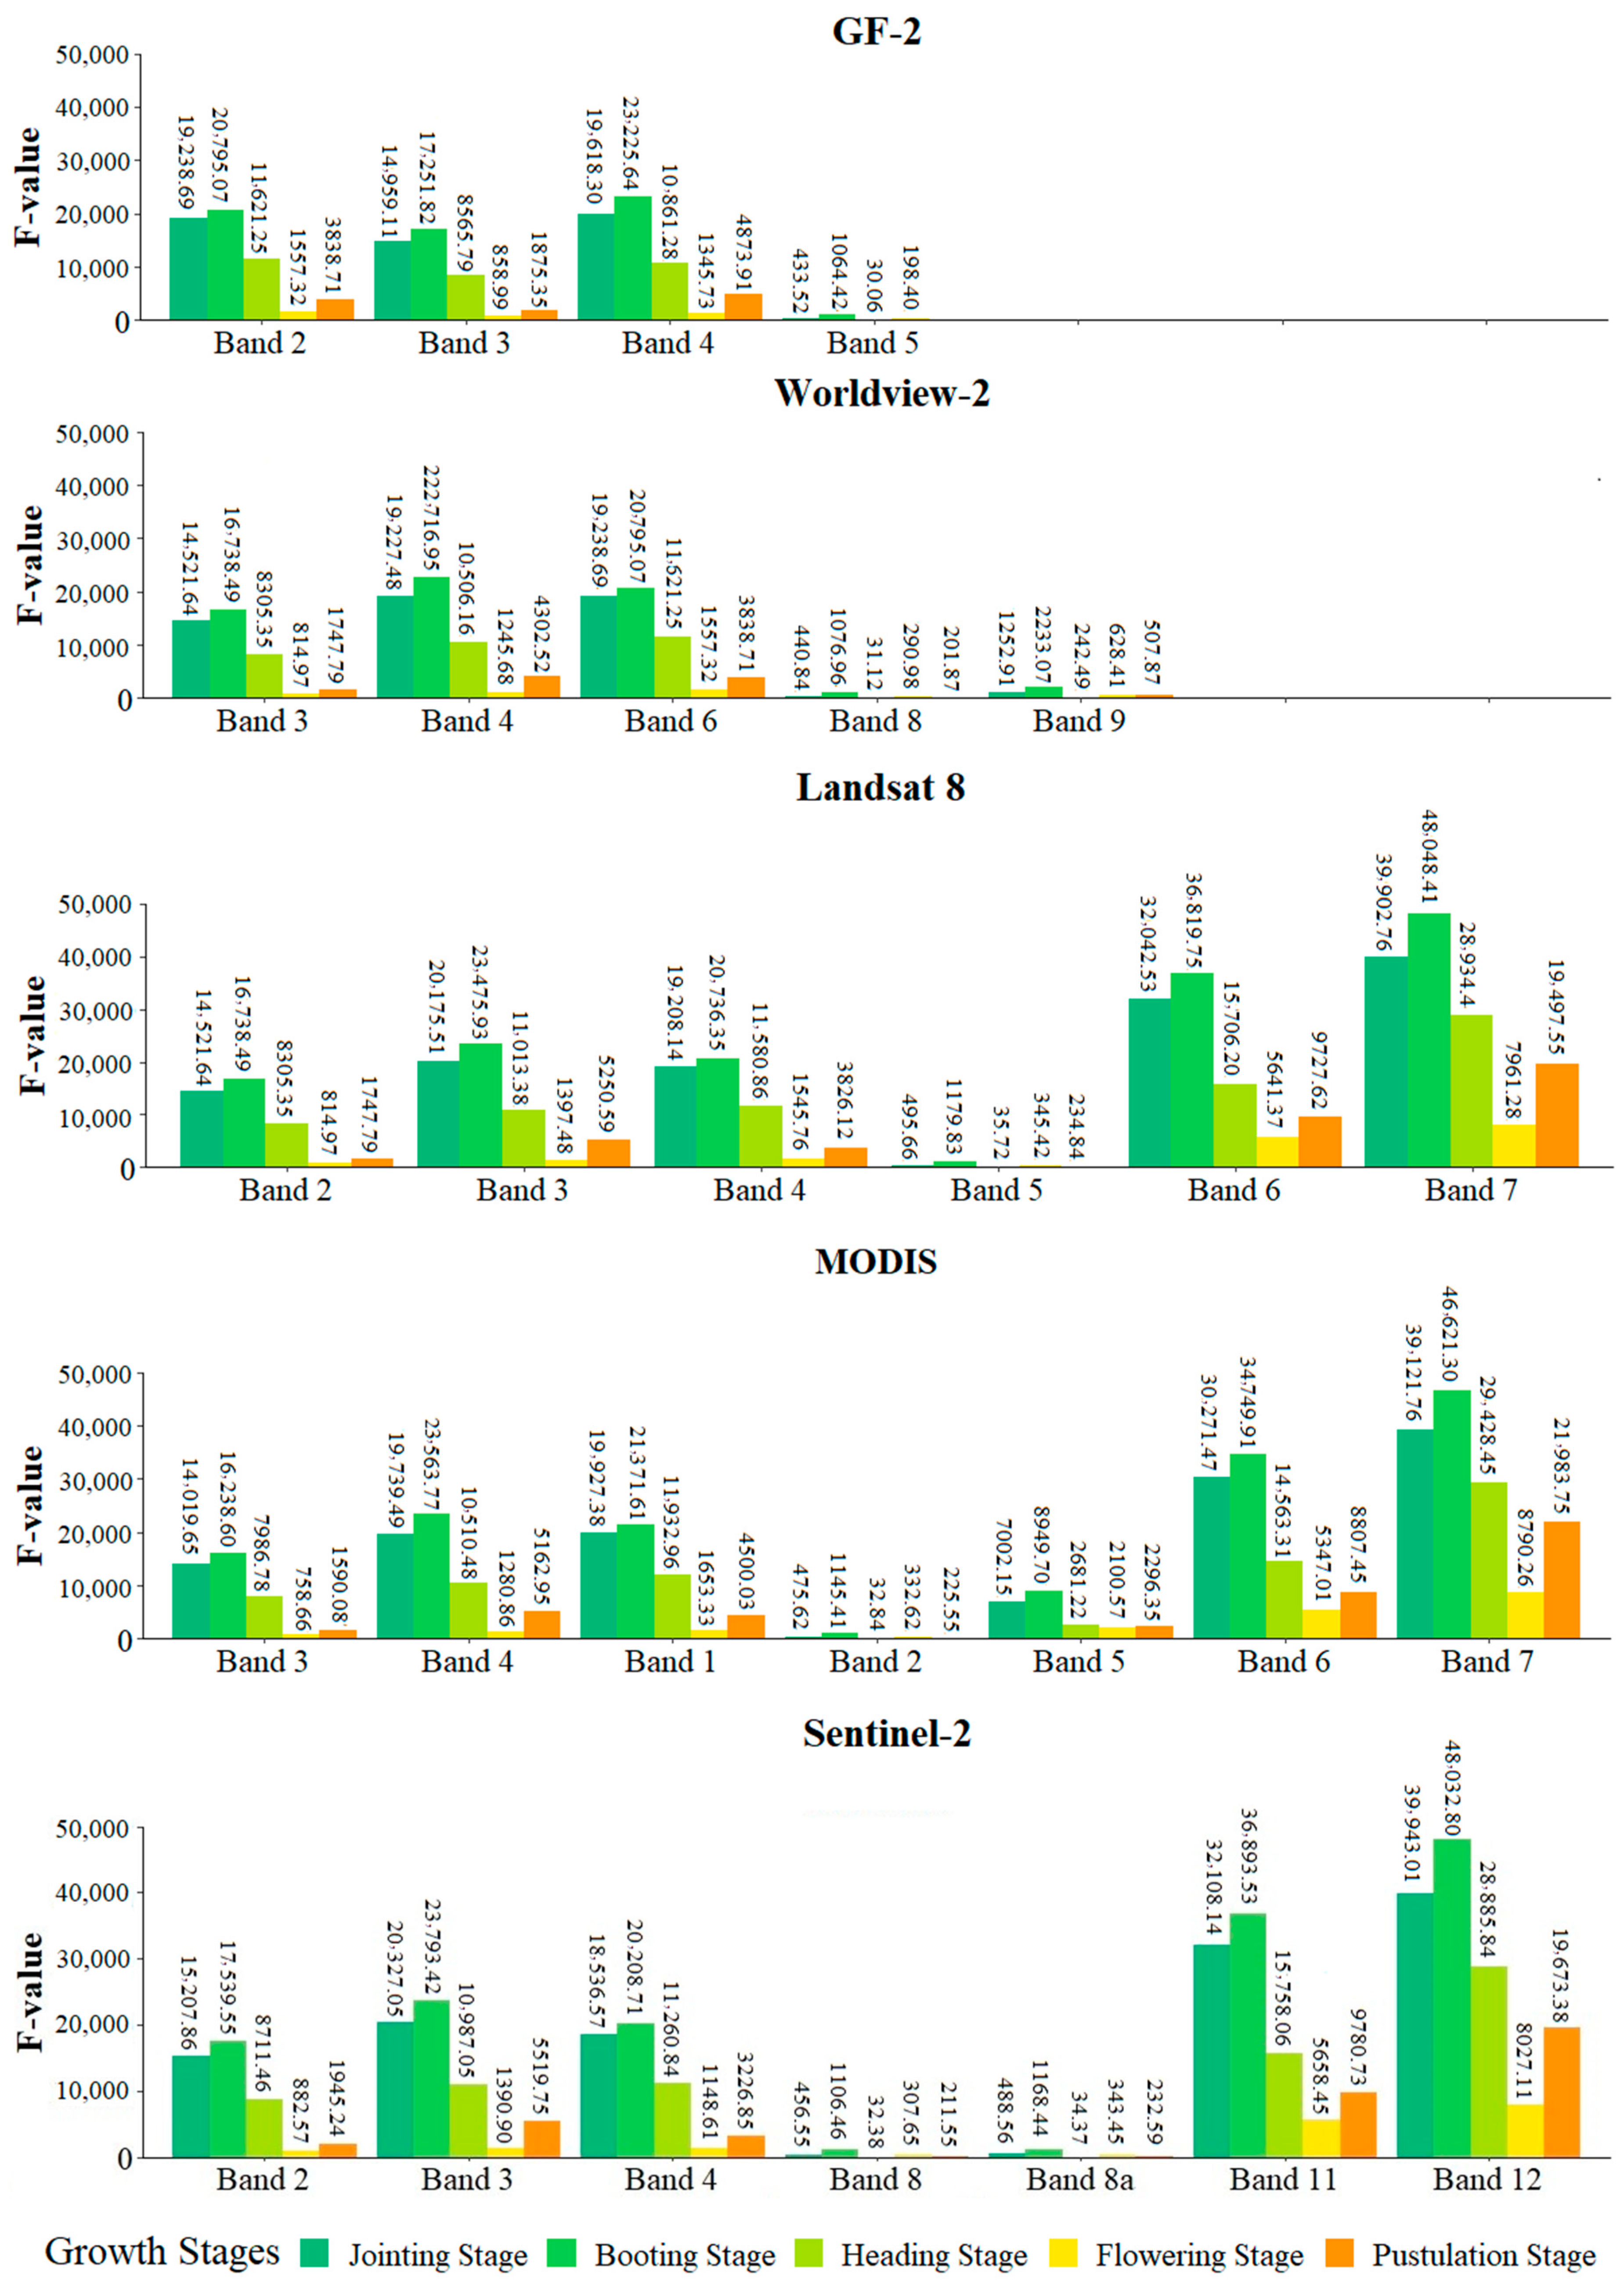
3.2. Evaluation and Analysis of Drought Response of Mainstream Remote Sensing Satellite Bands

Figure 3 shows the results of the variance analysis of the simulated reflectance under different drought scenarios during the three stages of wheat: jointing, booting, and heading. The overall trend of the F-value with wavelength variation was similar, with high values mainly appearing within the ranges of 570–700 nm, 1410–1520 nm, 1730–1860 nm, and 2170–2270 nm. This indicated that the reflectance of the wheat canopy is most sensitive to drought within these wavelength ranges. A significant decrease in F-value was observed at approximately 680 nm in the visible light region, thereby indicating a weak response to drought in this area. This may have been owing to the potential saturation of reflectance at approximately 680 nm when the chlorophyll content attained a certain threshold [61]. In the near-infrared and shortwave infrared regions, the sensitive spectral ranges were observed to be secondary absorption bands rather than the two primary water absorption regions at 1400 and 1900 nm. This is consistent with a previous study by Tucker [62].
Figure 4 shows the F-value curves during the subsequent growth stages of wheat, specifically the flowering and pustulation stages, which exhibited distinct patterns compared with the earlier growth stages. The pronounced response in the secondary water absorption regions diminished, whereas the F-values in the two primary water absorption bands at 1400 and 1900 nm became significantly higher. Our research results indicate that the canopy reflectance at 1900 nm is the most sensitive to variations in the water status. It aligns with the absorption characteristics of liquid water in the infrared region, which is consistent with other laboratory studies [8,63]. The F-values in the visible light region during the flowering and pustulation stages demonstrated a decrease compared with the jointing, booting, and heading stages.
To summarize, the wavelength range of 1405–1505 nm displays consistent sensitivity to water changes throughout the growth period of spring wheat. This makes it the most suitable wavelength range for monitoring drought conditions in spring wheat. The range 2140–2190 nm is the next most preferred monitoring range. The F-values computed by considering all four drought scenarios were lower than those obtained by considering only the non-drought and severe drought scenarios. This aligns with our fundamental understanding that higher differences in reflectance are observed under more severe drought conditions.

3.3. Evaluation of Mainstream Satellites for Monitoring Spring Wheat Drought

Figure 5 demonstrates the results of the variance analysis (i.e., average F-value) of individual bands from Sentinel-2, Landsat 8, Worldview-2, MODIS, and GF-2 under different drought scenarios.
Throughout all the growth stages, the capability of these five satellites to monitor spring wheat drought was low within the visible light region. Because of the similarity in the waveband configurations within this range, the monitoring capabilities of these sensors are essentially equivalent. The five satellites exhibited the lowest monitoring efficacy in the near-infrared region. The shortwave infrared region is optimal for tracking the response of spring wheat to water conditions. However, variations in the number of bands and wavelength coverage among satellite sensors in the shortwave infrared region result in distinct monitoring capacities across satellites. Notably, the most effective shortwave infrared bands for drought monitoring differ during the five growth stages of spring wheat. Specifically, Sentinel-2 band 12 performs best during the jointing stage; Landsat 8 band 7 performs best during the booting stage; and MODIS band 7 performs best at the heading, flowering, and filling stages. In general, the capabilities of satellites to distinguish non-drought conditions from severe drought are better than those for distinguishing between multiple drought scenarios, which have a similar trend of F-values among different bands. That is, the capability of satellites to identify drought intensifies as the severity of the drought increases.

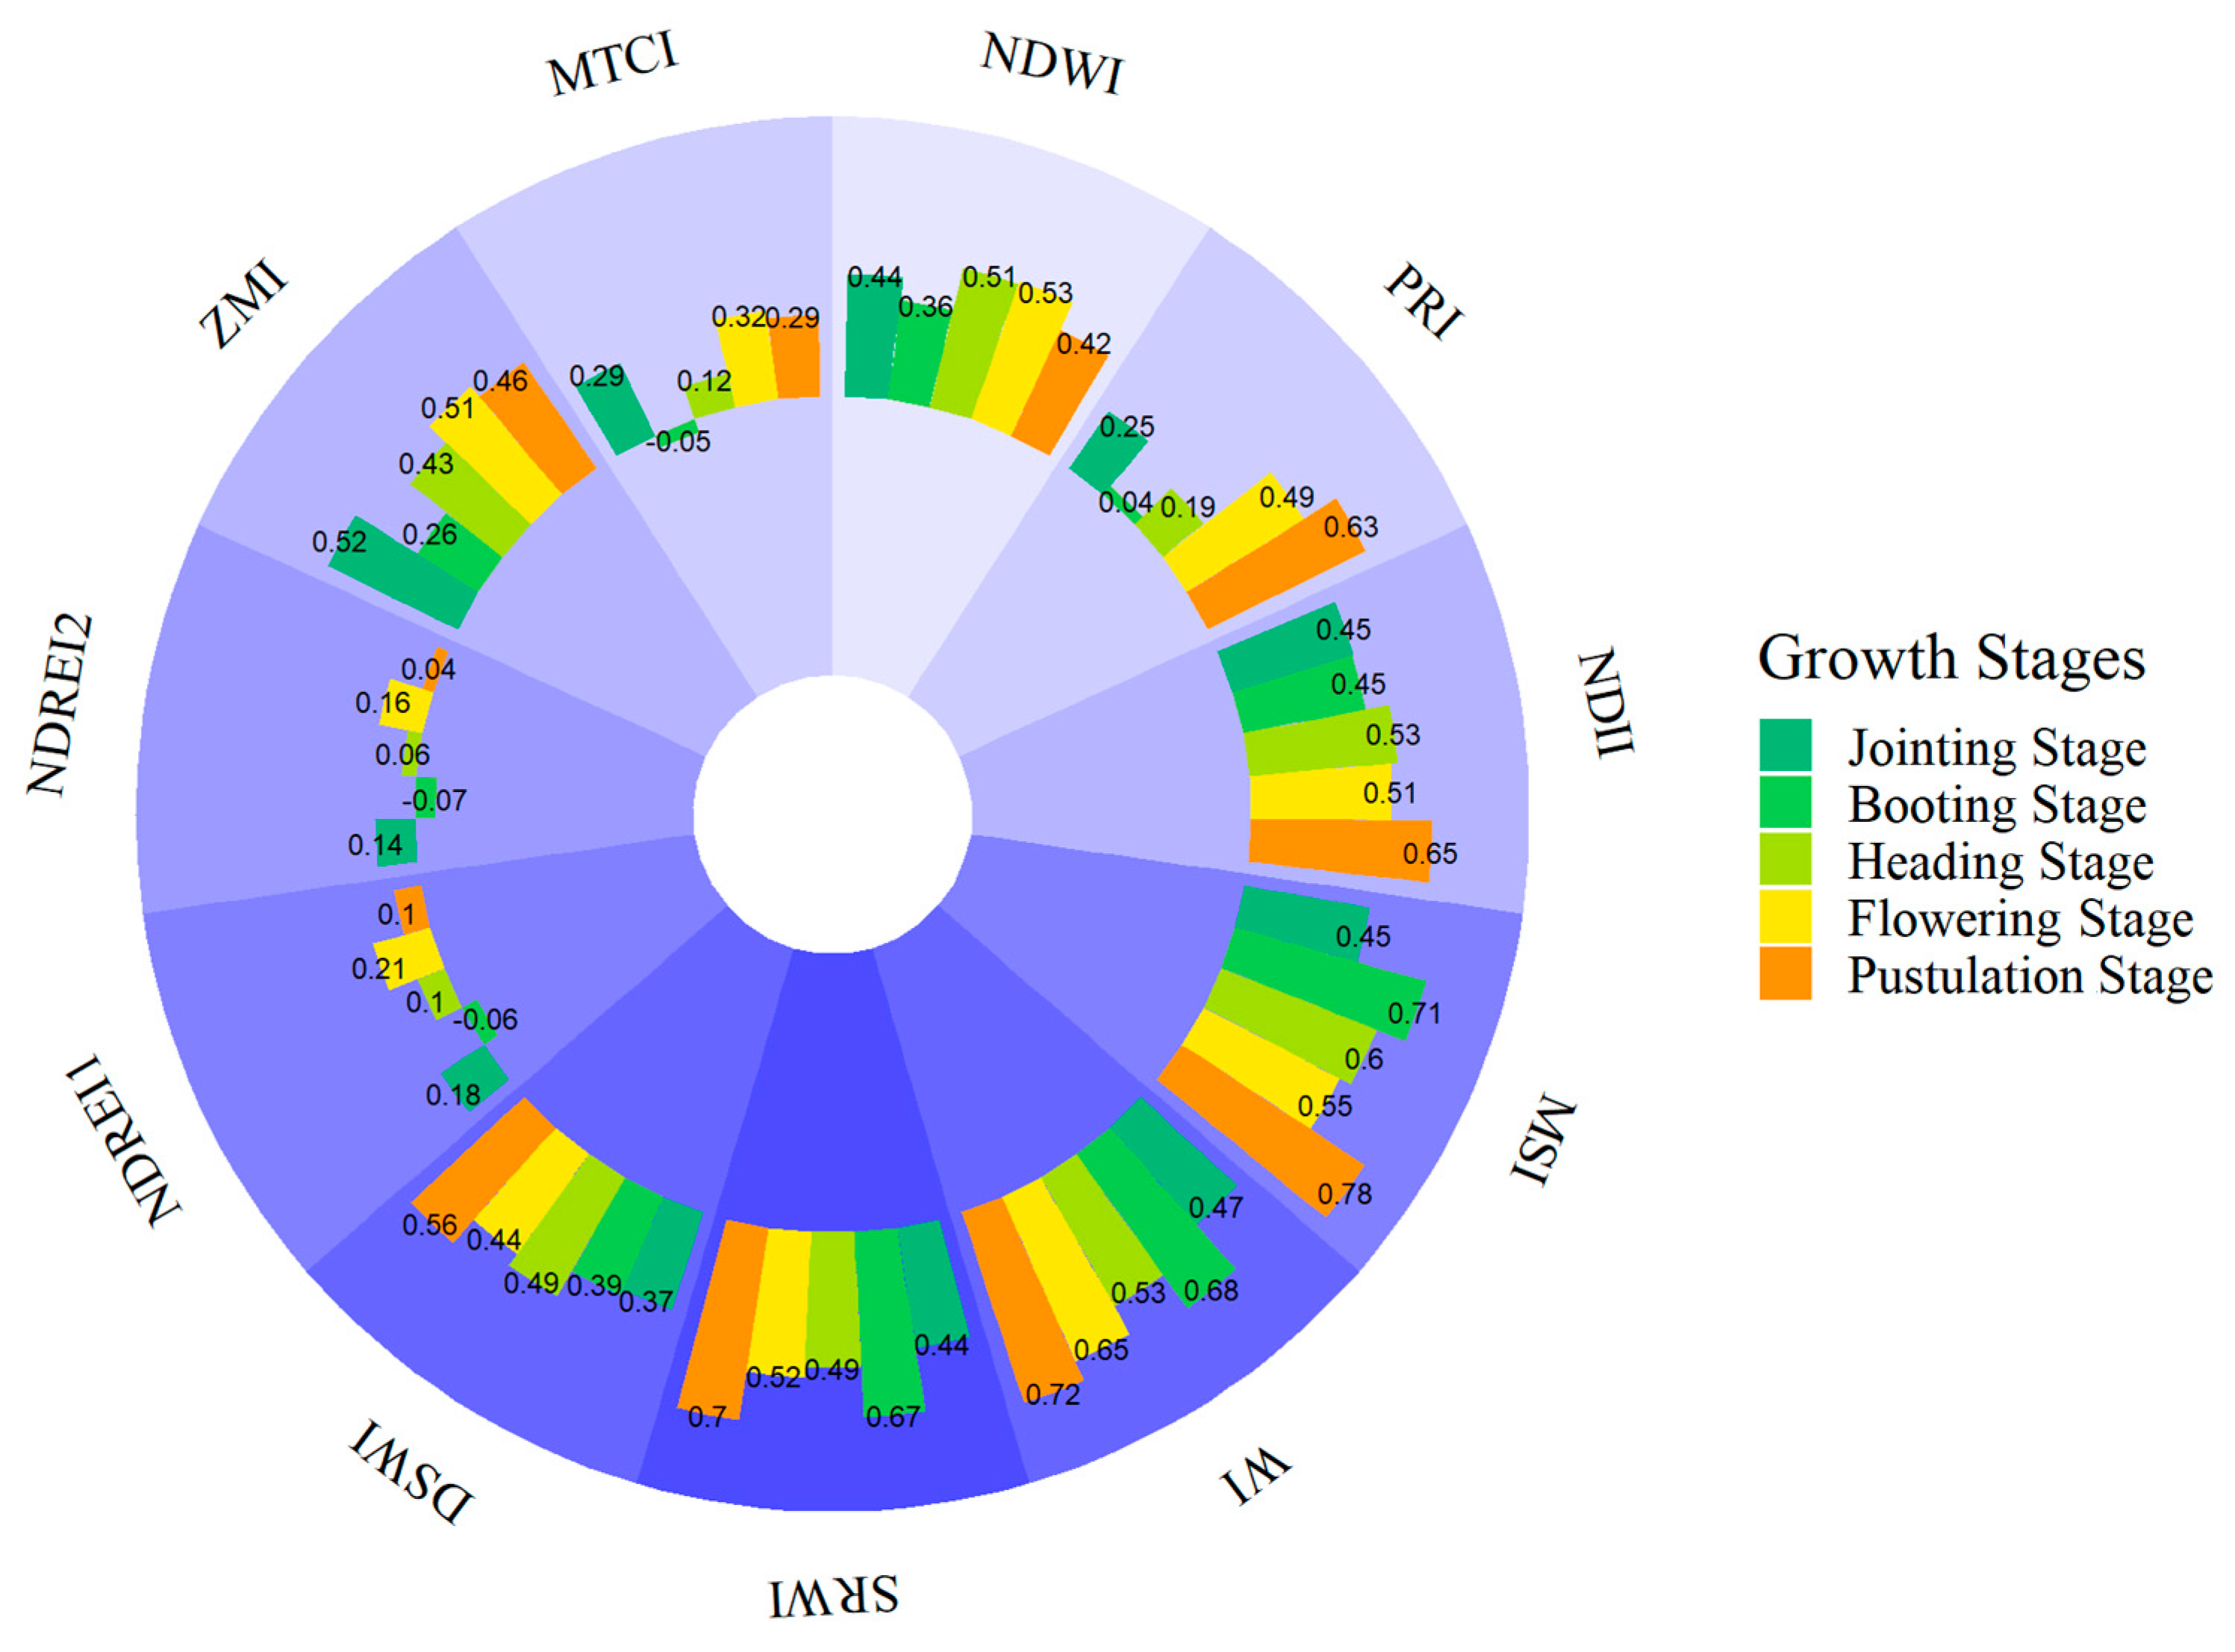
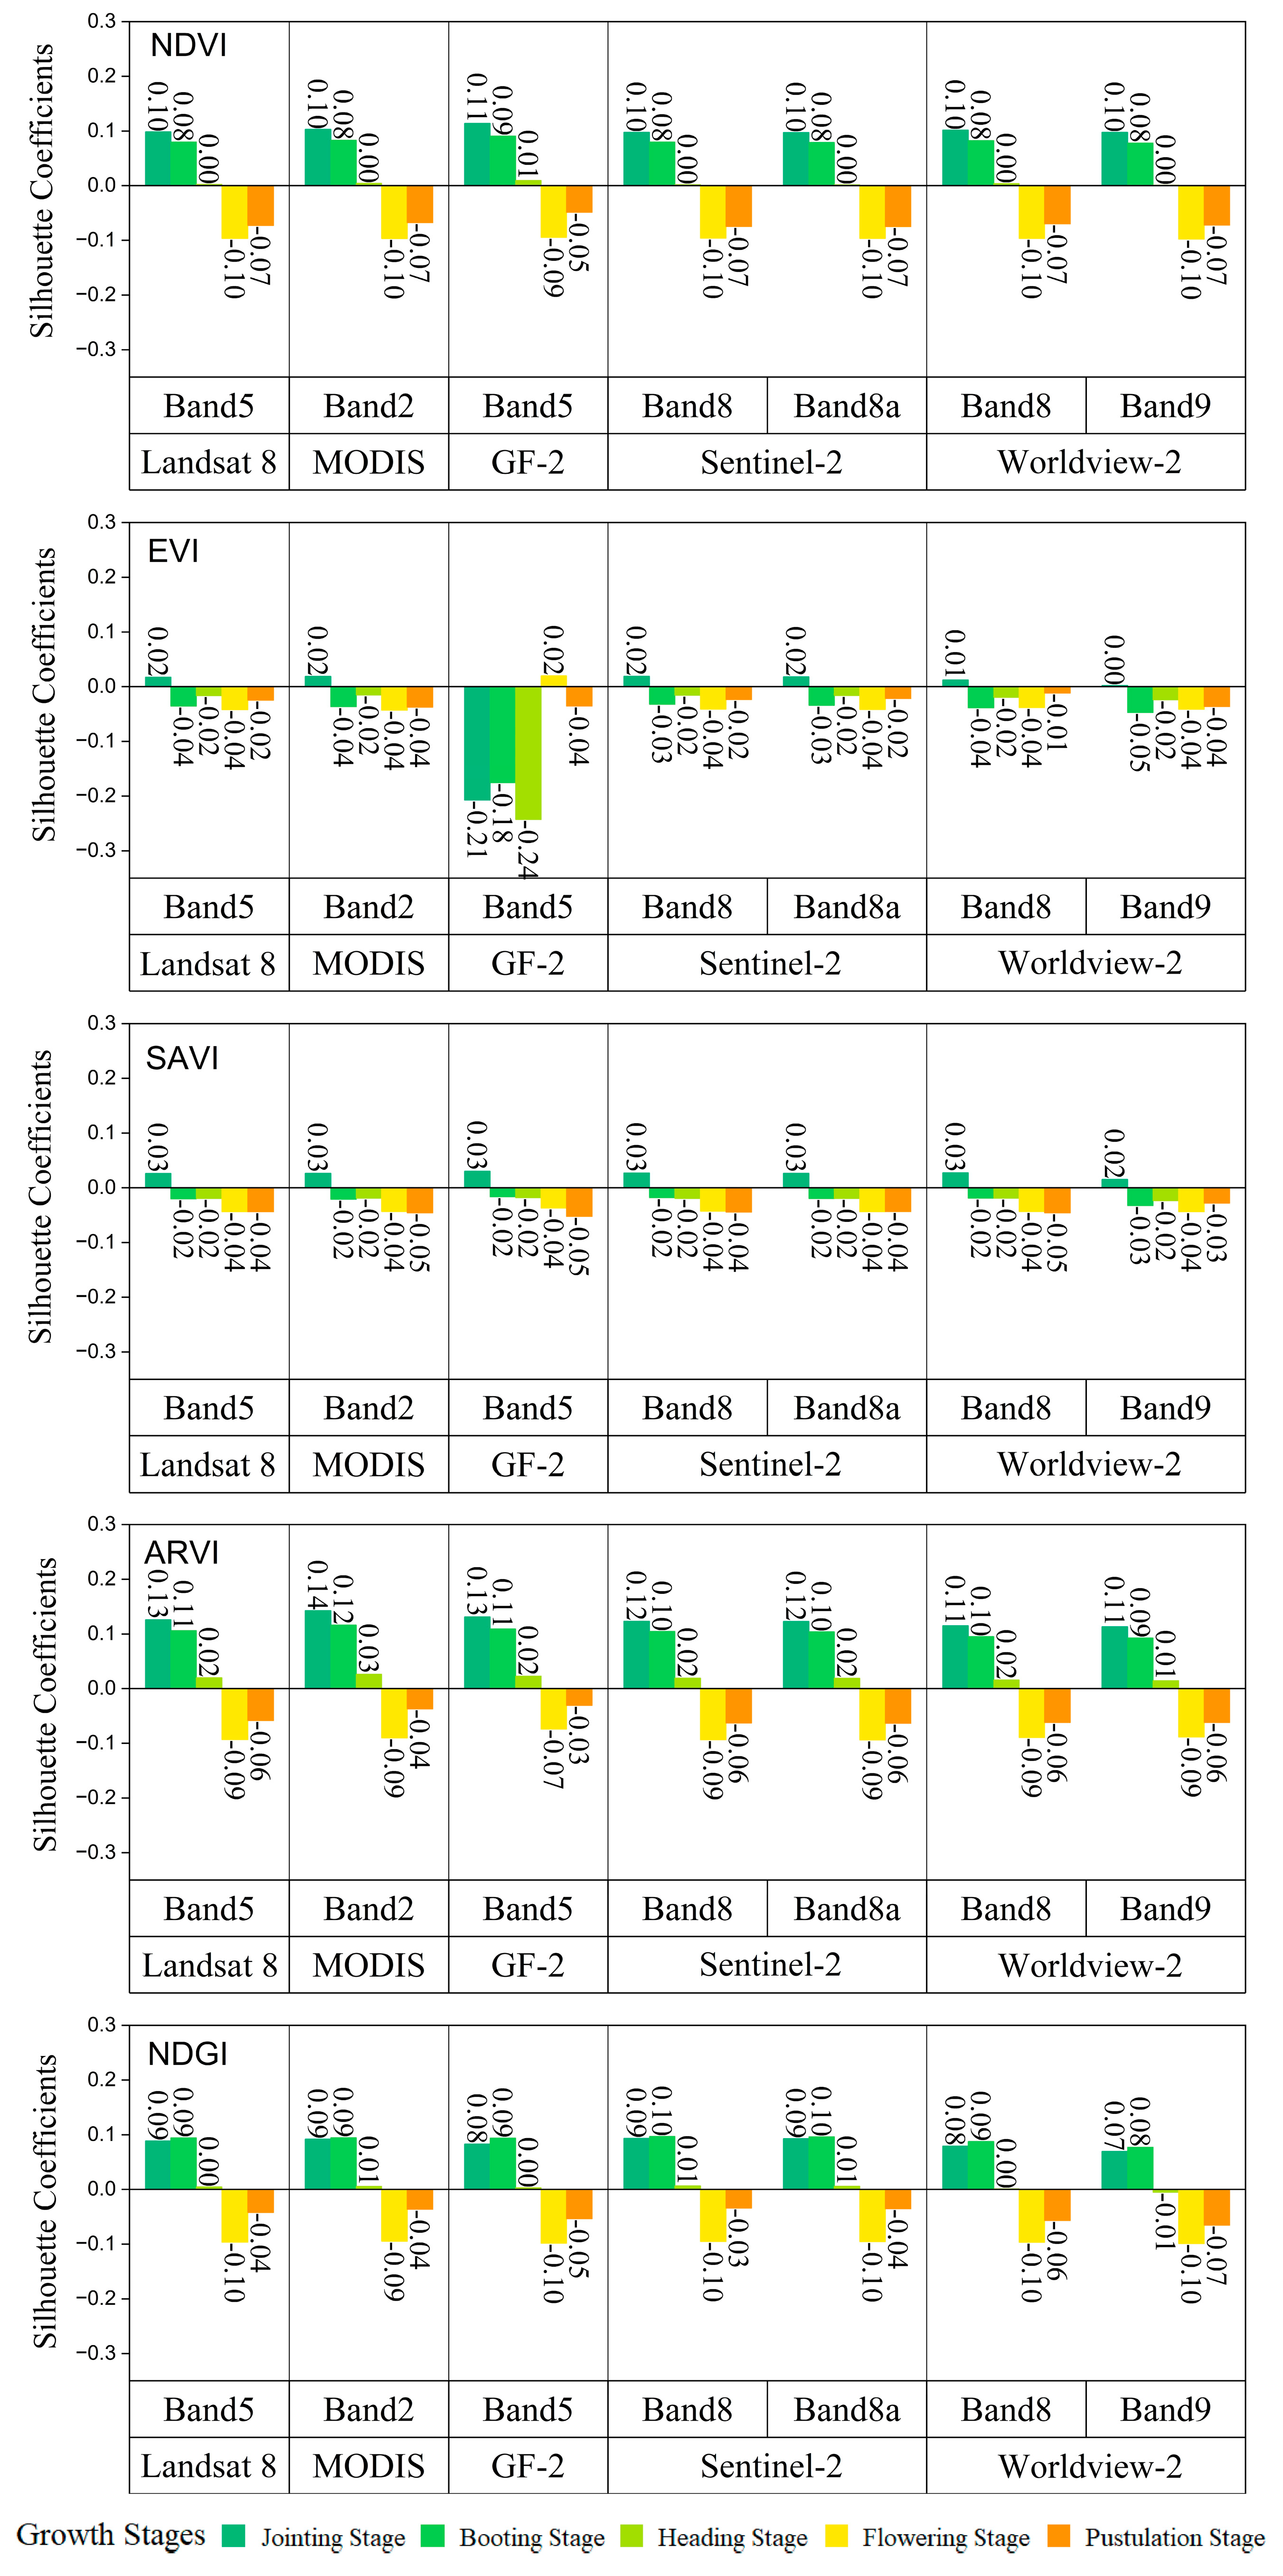
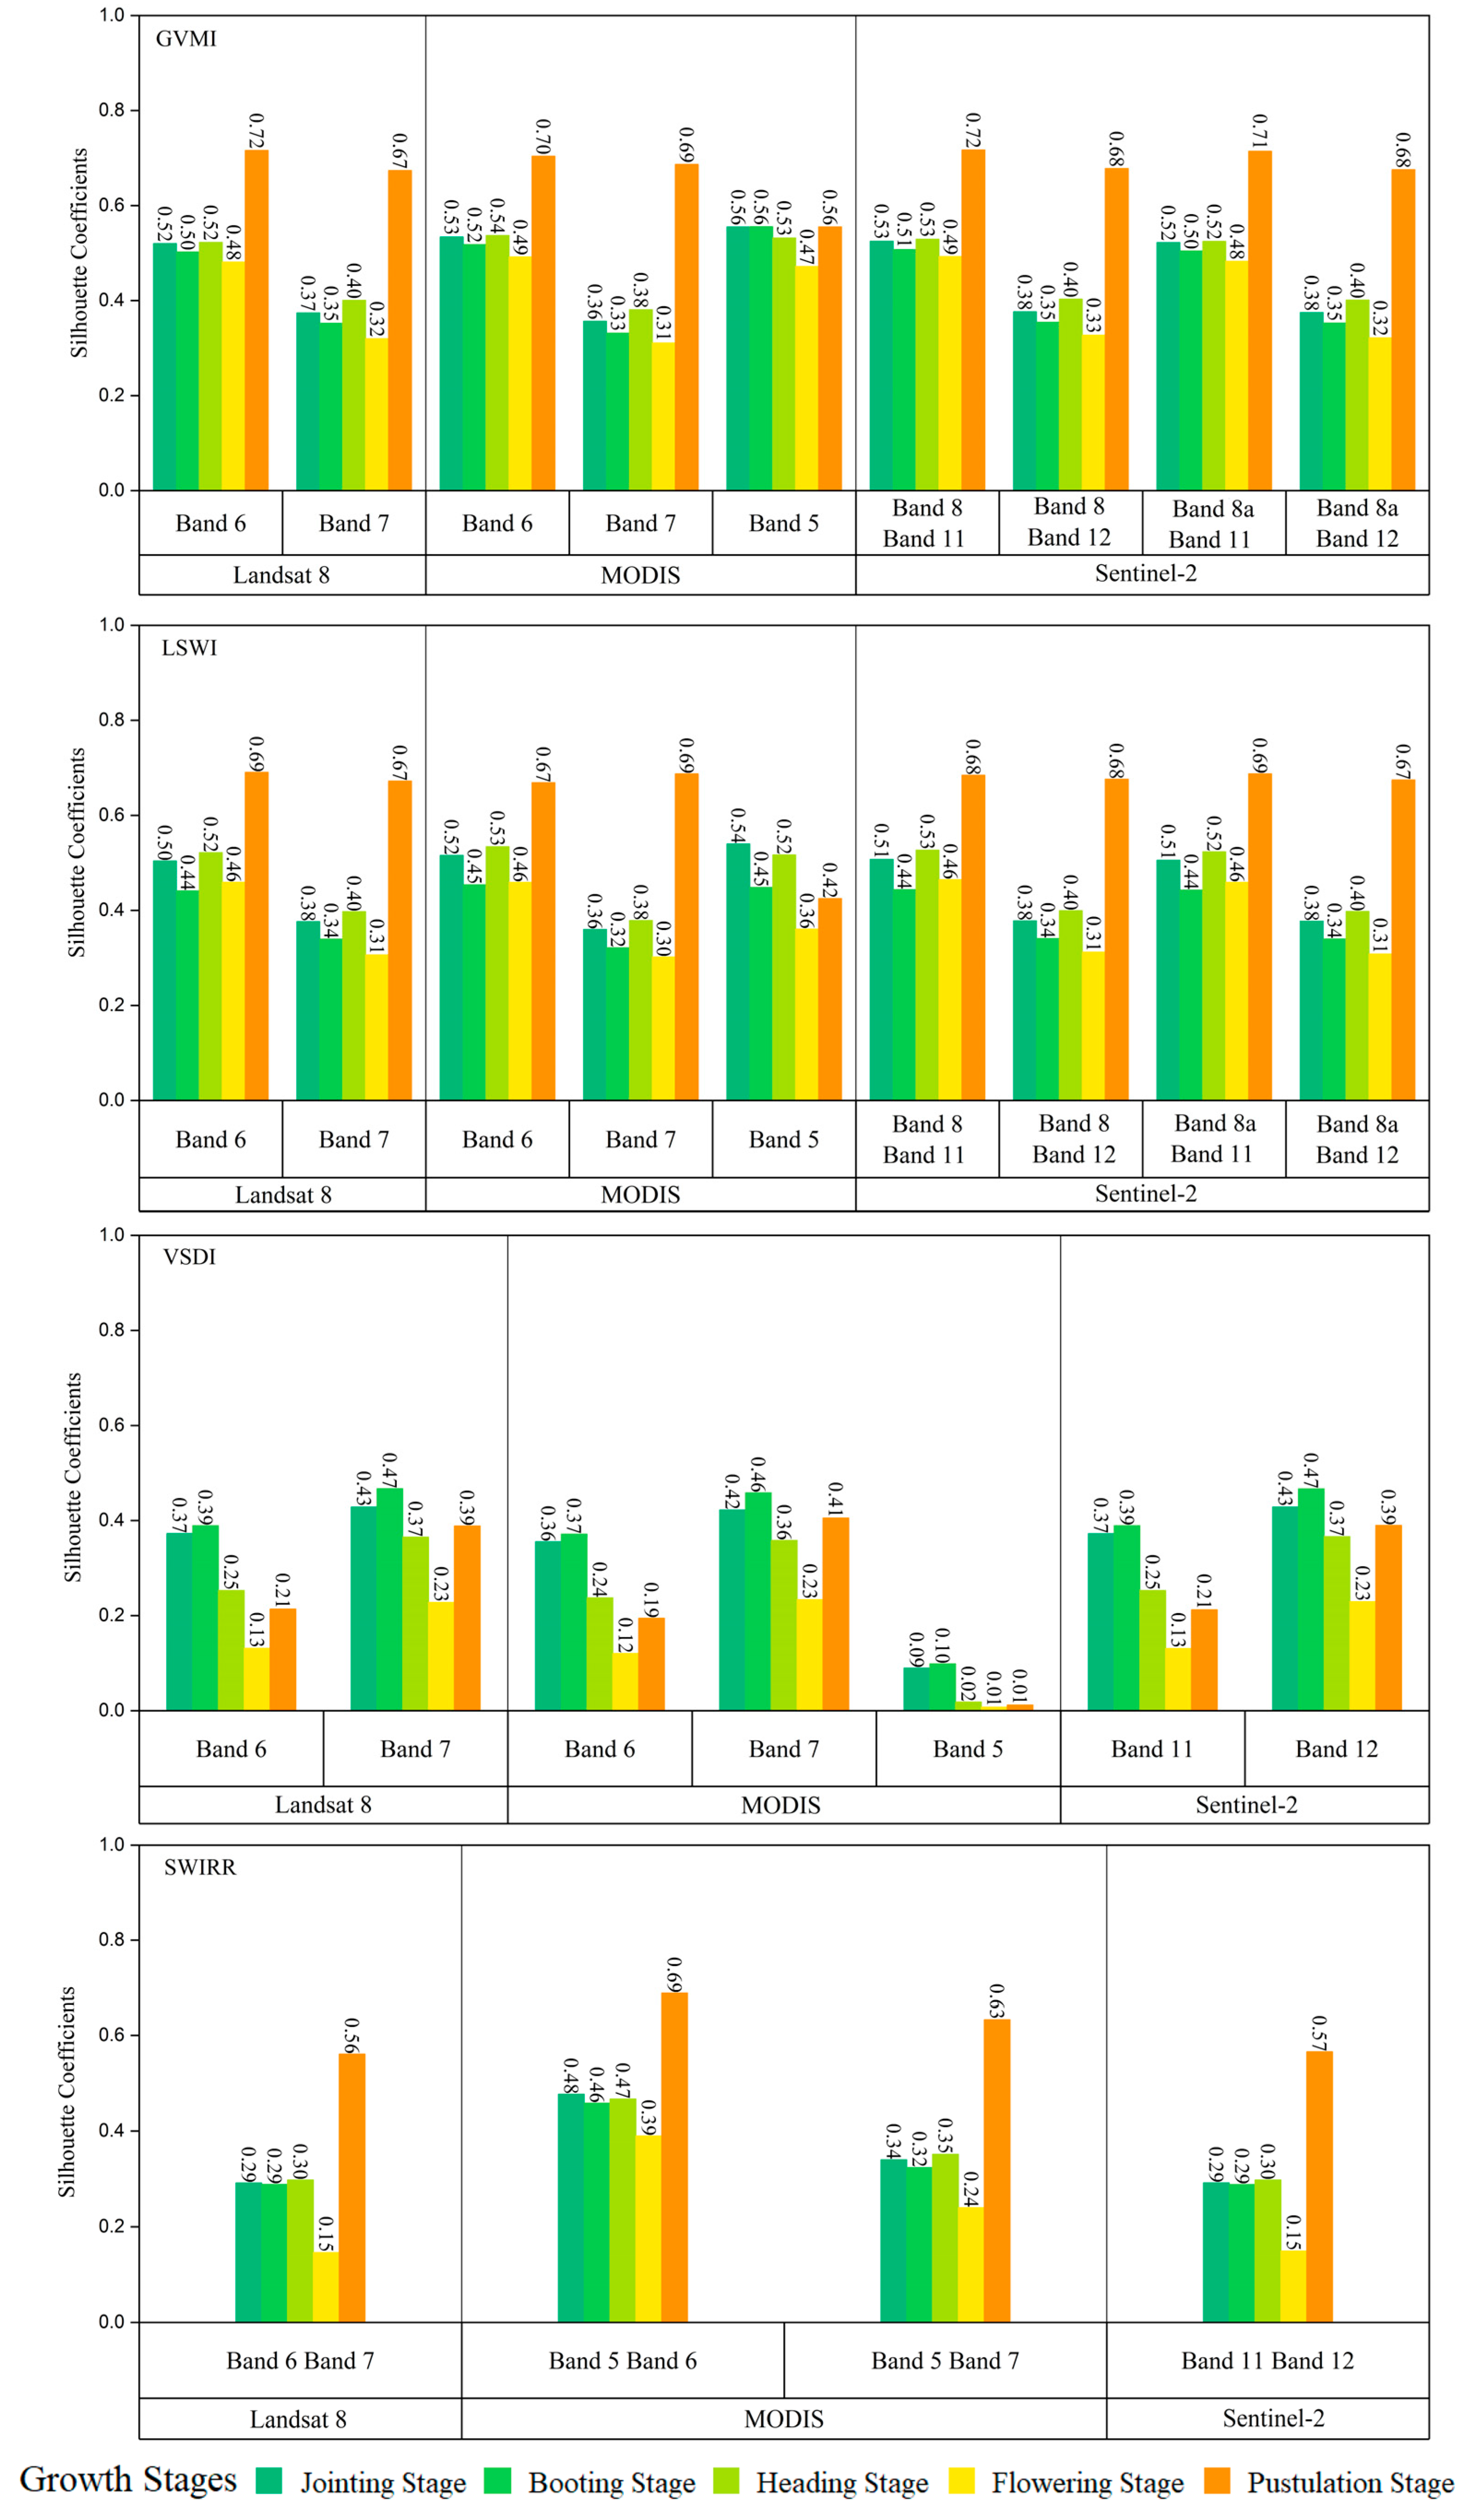
3.4. Applicability Analysis of Drought Indices for Spring Wheat Drought Monitoring

Figure 6 illustrates the silhouette coefficients of the 11 vegetation indices calculated based on specific wavelengths under various drought scenarios. Among these indices, MSI, WI, NDII, and SRWI generally exhibited higher silhouette coefficients, with at least three growth periods having coefficients of at least 0.5. In contrast, NDWI, ZMI, and DSWI showed marginally lower silhouette coefficients, followed by PRI and MTCI. Notably, NDREI1 and NDREI2 were significantly different from the other indices. These observations indicate variations in the suitability of diverse vegetation indices for monitoring wheat drought. Specifically, MSI, WI, and SRWI are generally highly suitable for analyzing spring wheat droughts. WI is optimal for the jointing and booting stages, whereas MSI is the most effective index during the pustulation, flowering, and heading stages. Indices such as MSI and WI are specially designed as indicators of vegetation water content and are optimal for drought monitoring. For the other indices used to assess the general condition, pigments, and other biophysical parameters of vegetation were less applicable for distinguishing droughts. For most of these indices, the silhouette coefficients attained their highest values during the pustulation stage (0.5–0.8). Except for the jointing stage, the applicability of most indices (water indicators) for monitoring drought increased as the wheat growth period progressed. This trend can be attributed to the gradual weakening of the soil background reflection with crop growth, which results in the emergence of more prominent spectral features of water in the crop canopy as the leaf area expands [64]. Notably, the silhouette coefficients of PRI, MCTI, NDREI1, and NDREI2 exhibited distinct patterns compared with the other indices across growth stages. Specifically, the silhouette coefficients of these four indices were significantly lower than those of the other indices throughout all the growth periods. This indicated the weaker discriminative capabilities of these four indices for identifying spring wheat drought in these stages compared with the other indices.
Figure 7 and Figure 8 depict the efficacy of the satellite-based vegetation index in capturing variations in water content during the distinct growth stages of spring wheat. The suitability of different indices for distinguishing drought conditions varied significantly across growth stages. Moreover, the same index exhibited discrepancies when calculated using different satellite sensors or during different growth stages. Specifically, conventional vegetation indices such as NDVI, EVI, SAVI, ARVI, and NDGI demonstrated inadequate performance across the scenarios. The silhouette coefficient values were below 0.3, which indicated their limited capability to identify drought conditions. Conversely, custom-designed indicators for humidity monitoring, such as GVMI, LSWI, VSDI, and SWIRR, exhibit favorable performances. The vegetation index derived from the bands of the Sentinel-2, Landsat 8, and MODIS satellites consistently achieved silhouette coefficients above 0.5 in most cases. Among these indices, LSWI and GVMI based on MODIS bands 2 and 6 as well as Sentinel-2 bands 8 and 11 consistently yielded optimal results across the scenarios. Following these, LSWI and GVMI calculated based on Landsat 8 bands 5 and 6 and Sentinel-2 bands 8a and 11, respectively, exhibited potential performance. However, Worldview-2 and GF-2 have inadequate monitoring bands in the shortwave infrared region. This renders them incapable of calculating these indices.
Among the five growth stages considered, the indices performed most effectively during the pustulation stage, followed by the joint stage. In the pustulation stage, GVMI and LSWI demonstrated exceptional performance, with silhouette coefficients significantly surpassing those of the other growth stages (>0.6). Similarly, during the jointing stage, GVMI and LSWI also exhibited high silhouette coefficients (>0.5) across the band combinations of Sentinel-2 and MODIS. Furthermore, significant discrepancies in the index performance were observed during the booting, heading, and flowering stages. The capability of the better-performing indices, namely, GVMI and LSWI, to discriminate drought conditions was lower during the booting and flowering stages than during the other growth stages. This was indicated by the relatively lower silhouette coefficients. Conversely, conventional vegetation indices predominantly yielded silhouette coefficients of approximately zero during these stages.

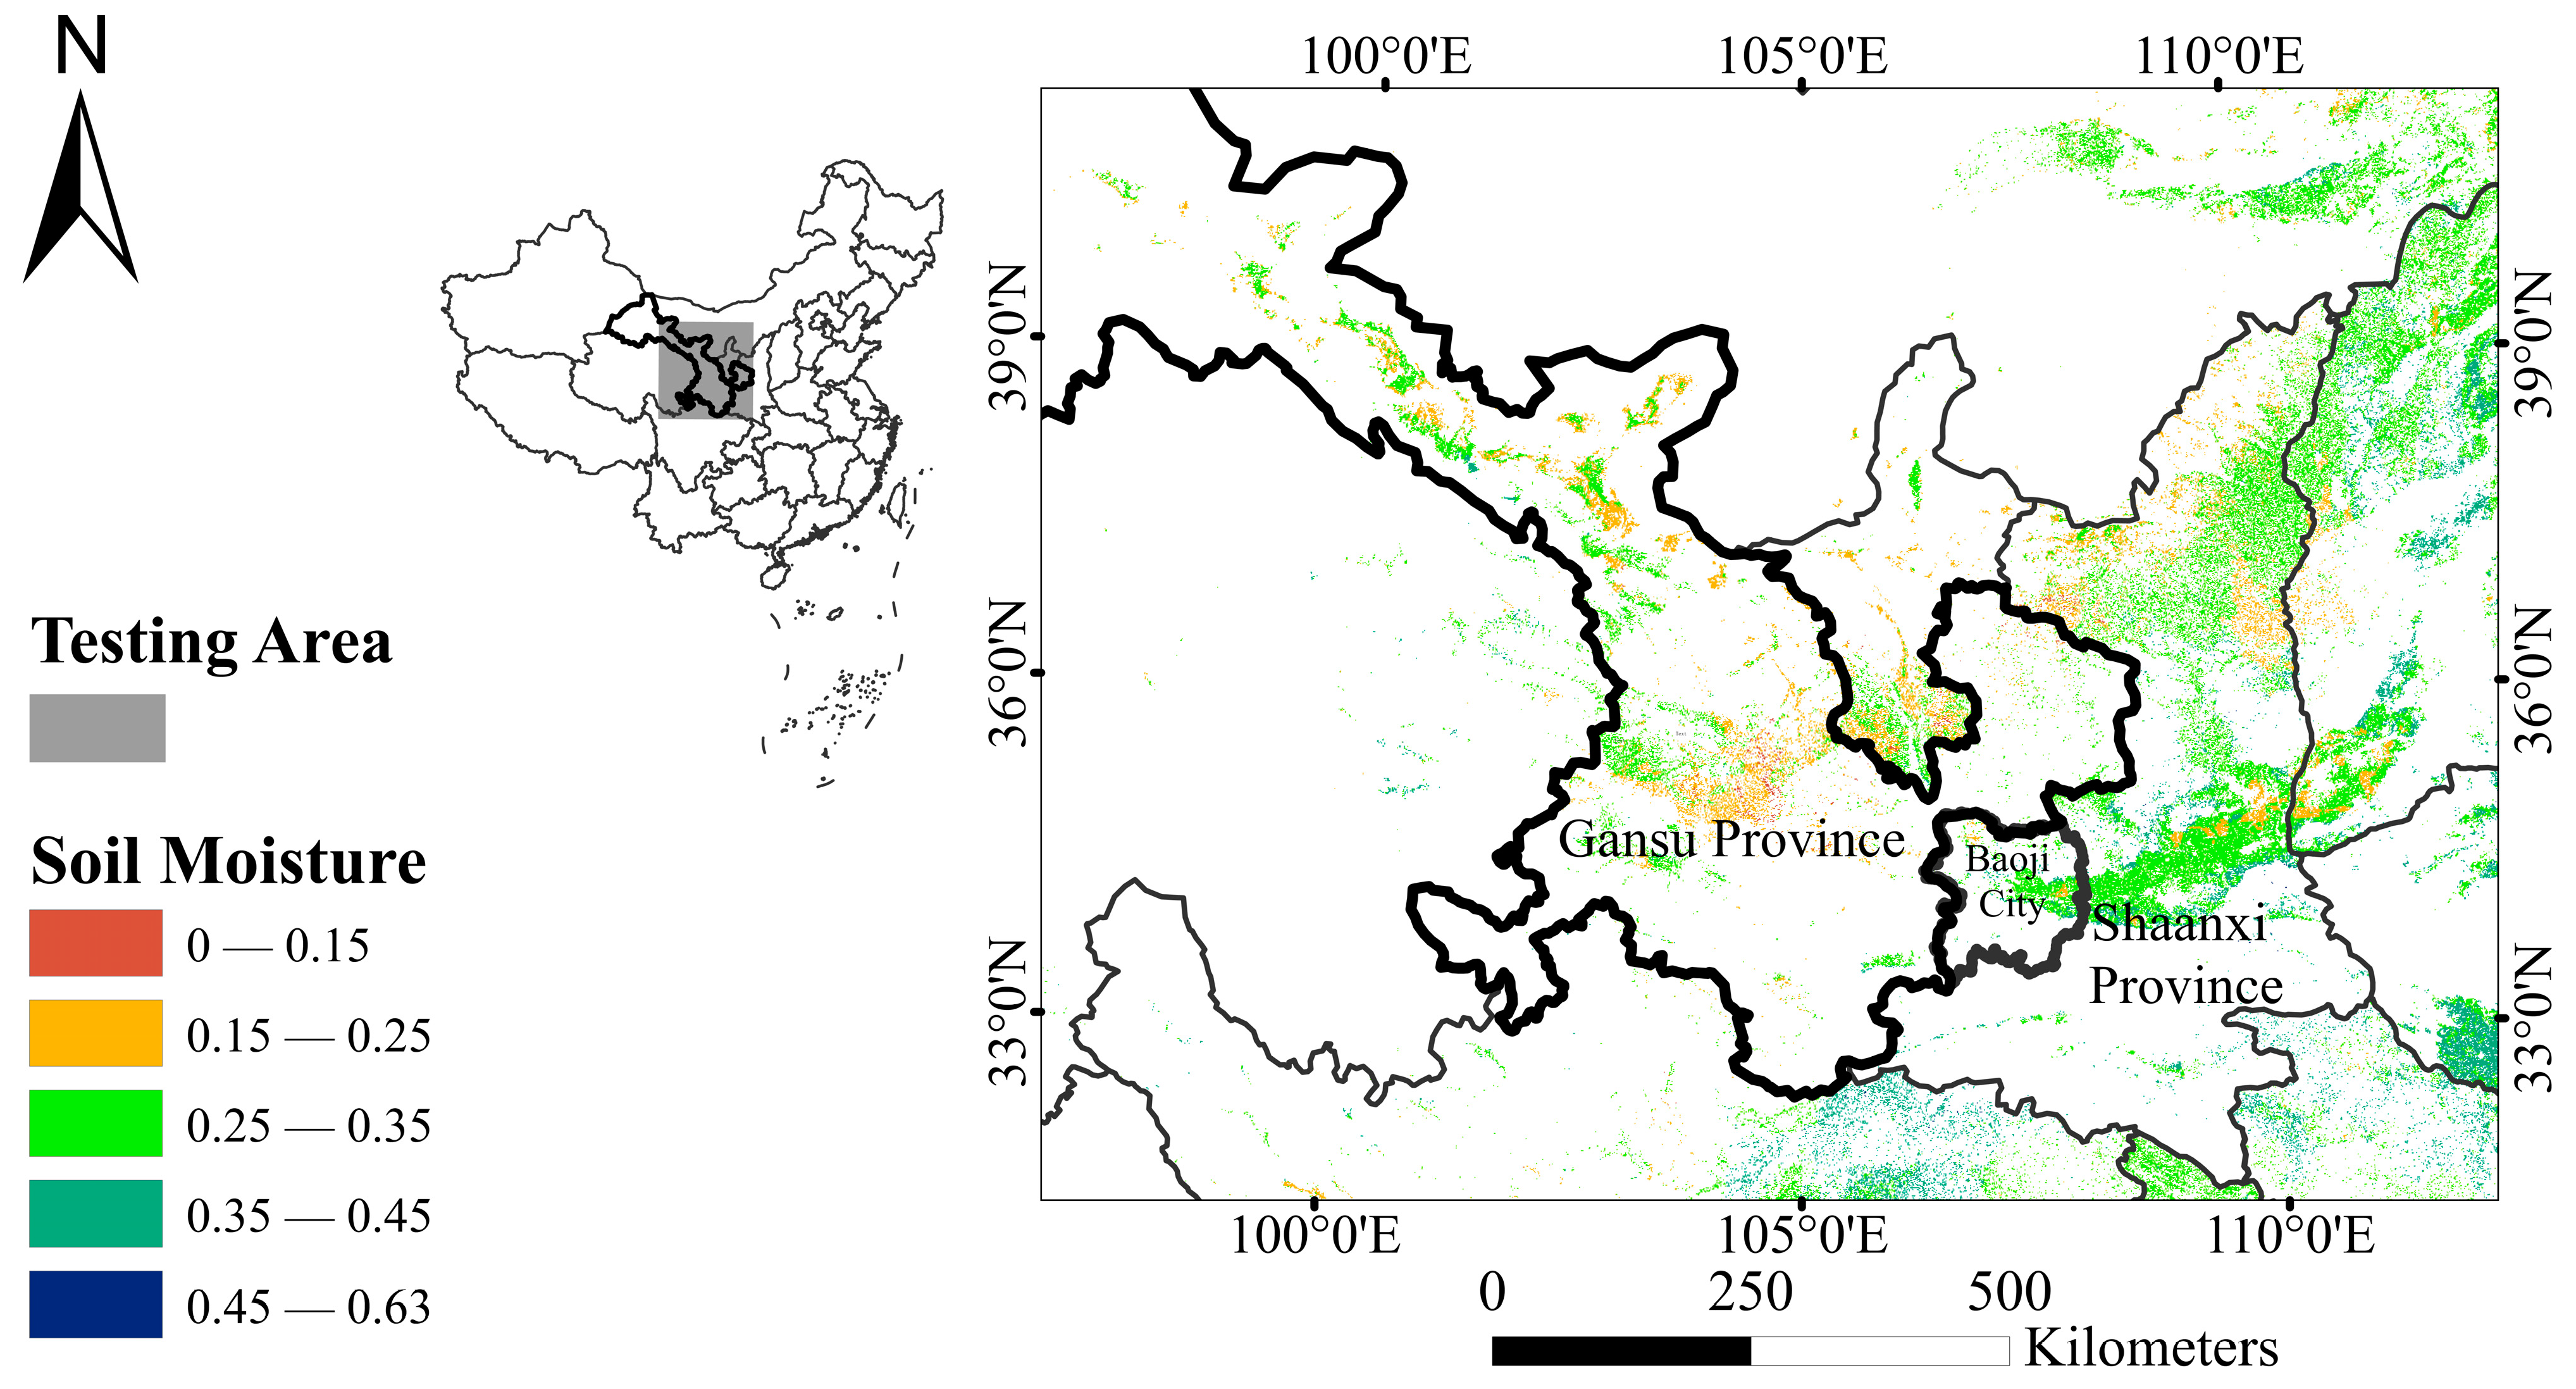
3.5. Verification Based on Satellite Images

Our simulation results show that LSWI and GVMI based on MODIS bands 2 and 6 and Sentinel-2 bands 8 and 11 exhibit better drought monitoring capabilities compared to EVI and SAVI. To verify this result, we selected two typical spring wheat planting areas in Northern China for testing: Gansu Province and Baoji City, Shaanxi Province. In each testing area, we extracted soil moisture data from spring wheat pixels and sorted them from high to low according to soil moisture. We calculated their corresponding GVMI, LSWI, EVI, and NDVI and selected the pixels with the highest 1% soil moisture and the pixels with the lowest 1% soil moisture, then calculated the contour coefficients of the four vegetation indices corresponding to these two parts of pixels for each image. The results are shown in Table 5. In both study areas, the average silhouette coefficients of GVMI and LSWI were higher than those of NDVI and EVI, which is consistent with our simulation results. The silhouette coefficients calculated based on Sentinel-2 are lower than those calculated based on MODIS, mainly because the drought that occurred in 2016 was lighter than the drought that occurred in 2011 [52,54].

4. Discussion

4.1. Comparison with Previous Studies

The investigation presented in this study examined the response features of spring wheat canopy reflectance to water stress by employing the PROSAIL model simulation. These observations align with the conclusions of Gausman [63] and Tucker [62], albeit during distinct growth stages. Notably, Gausman’s experiments identified the absorption bands at 1400 and 1900 nm as the most responsive to variations in water conditions, whereas Tucker’s study indicated that minor water absorption bands such as 1.83–1.88 μm and 2.1–2.35 μm are more suitable for indicating variations in water content. Our study revealed that in the early growth stages (jointing, heading, and booting), the minor water absorption bands exhibited heightened sensitivity to drought stress, whereas the major water absorption bands at 1400 and 1900 nm dominated during the subsequent growth stages (flowering and pustulation). By isolating the other parameters through the simulations, we attributed this discrepancy to variations in the absolute water content of the leaves. Specifically, the jointing, heading, and booting stages exhibited EWT values ranging from 0.009 to 0.015, whereas the EWT values during flowering and pustulation did not exceed 0.006. A higher absolute water content accentuates the prominence of the minor water absorption bands, whereas a lower absolute water content places a higher emphasis on the two major water absorption bands. Consequently, when utilizing reflectance as a means of monitoring drought stress in wheat or other crops, it is crucial to consider factors that influence variations in the absolute water content of leaves, such as the growth stage or physiological discrepancies among different crop types. Thus, it is apparent that the indiscriminate application of existing conclusions to different crops is ineffective. Analyzing the spectral response characteristics within specific contexts is essential for selecting appropriate drought monitoring bands to achieve optimal outcomes.

4.2. Contributions

First, this study adopted a different method to evaluate the capability of vegetation indices to reflect drought. Previous studies commonly employed regression analysis and correlation coefficient methods to assess the relationship between water status such as soil moisture and vegetation indices [21,65]. In this study, we used silhouette coefficient analysis to assess the distinctiveness of vegetation index values under various scenarios. This approach enabled us to evaluate the suitability of remote-sensing vegetation indices for monitoring drought incidents in spring wheat. Although regression analysis can capture variable correlations, it fails to adequately assess the capability of vegetation indices to distinguish drought incidents under specific application scenarios. Therefore, evaluating the distinguishability of vegetation indices under different drought intensities is crucial.
Second, our evaluation of the monitoring capabilities of existing remote-sensing vegetation indices and commonly used satellites can help users select appropriate indices and satellites for effective drought monitoring. NDVI, a vegetation index widely utilized in drought monitoring, exhibits weak responses to water deficits, delayed responses, and low timeliness [66]. These factors render it less optimal. Conversely, vegetation indices specifically designed to monitor water conditions (MSI, WI, GVMI, and LSWI) demonstrate better applicability in analyzing water stress. This is because these incorporate the mid-infrared region, which is highly sensitive to water content variations. Therefore, satellites equipped with shortwave infrared bands are preferred for drought monitoring. Among the satellites providing shortwave infrared bands, MODIS Band 7 performed exceptionally well. It exhibited a high sensitivity to variations in spring wheat water conditions across all the five growth stages, particularly during the booting, flowering, and pustulation stages. Additionally, among the vegetation indices based on specific band combinations of certain satellites, LSWI with MODIS bands 2 and 6 and GVMI with Sentinel-2 bands 8 and 11 demonstrated superior drought detection capabilities.
Third, the analysis results of the drought-sensitive bands in this study would be effective for developing new remote-sensing drought indices and designing agricultural remote-sensing monitoring satellite sensors. Our observations highlighted the 1405–1505 nm range as the most water-sensitive region in spring wheat canopy spectra. This knowledge can be leveraged to extract and utilize reflectance information within this range to develop drought indices with improved monitoring capabilities. Notably, the satellites examined in this study do not have a band covering the 1405–1505 nm region. Rather, the optimized bands analyzed in Figure 5, Figure 7 and Figure 8 rely on more information within the 2140–2190 nm range. Even though with new technologies like data fusion enriches the information we can obtain from the satellite images, given that many in-orbit remote sensing satellites such as MODIS and Landsat 8 are approaching or have exceeded their service life and considering the deteriorating drought disasters owing to climate change, there is an increasing demand for advanced remote sensing satellites with enhanced drought monitoring capabilities. The conclusions drawn from this study can guide the design of future satellite sensors to better serve the drought monitoring requirements of crops, particularly spring wheat. In addition to drought, changes in crop canopy moisture are also affected by diseases and pests. Mining sensitive bands and using machine learning algorithms to construct pest and disease monitoring models and vegetation parameter inversion models are also current research hotspots [67,68]. The research results of this article also have a certain contribution on the development of disease and pest monitoring methods and parameter inversion indicating crop growth status.

4.3. Limitations

First, one purpose of this study is to evaluate the capability of monitoring spring wheat drought using five mainstream remote sensing satellites from a spectral perspective. The quality of real satellite data is also affected by the temporal and spatial resolution of the satellite. Using real data for research is difficult to strip away factors other than spectral settings, such as the impact of spatial resolution. Therefore, we generated extensive spectral curves using the PROSAIL model for analysis. However, the uncertainty in setting model parameters should be acknowledged. While selecting the input parameters for the PROSAIL model, we referred to field experimental records from other studies and a literature review. Subsequently, numerous parameter sets were generated using a Gaussian distribution to approximate realistic and complex situations. However, the representativeness of field experimental data remains limited. This necessitates more extensive and in-depth observational records and simulation experiments to delineate the response of the canopy spectra of spring wheat and other crops comprehensively and accurately under different drought conditions. Some studies have identified a certain deviation between the results of the PROSAIL model’s forward simulation of crop canopy spectra and the field reality [69]. This can also impact experimental outcomes. Moreover, some study pointed out PROSAIL cannot account for row effects leading to uncertainty in the results of PROSAIL simulations in the direction of zenith observations. Based on two considerations, we believe that this issue is not significant in our research, but the row effect still needs to be noted, especially in the early stages of wheat growth. First, compared to maize and sugar beet, wheat has a smaller row effect [70]. Second, we conducted simulations at different geometric observation angles, where the solar zenith angle includes 30° and 60°; the observation zenith angle includes 0°, 30°, and 60°; and the relative azimuth angle between the sun and sensor includes 45°, 90°, 135°, 180°, 225°, 270°, and 315°. Our analysis considers a comprehensive combination of various observation angles and considers the variability of multiple parameters across different growth stages, which can reveal the response pattern of canopy reflectance regardless of certain deviations on a few simulated results.
Second, this study evaluated only the applicability of satellite drought monitoring from the perspective of band settings and vegetation indices. It did not consider other factors such as the spatial resolution, temporal resolution, and swath width. In practical applications, it is necessary to consider various satellite parameters [71,72,73]. For example, the revisit period of Sentinel-2 is eight days, and the spatial resolution of bands is 10 m, 20 m, or 60 m. The revisit period of Landsat 8 is 16 days, and the spatial resolution of the bands is 30 m (OLI). MODIS can obtain daily surface data. However, its spatial resolution is 250 m, 500 m, or 1000 m. It is necessary to comprehensively consider the actual requirements of monitoring frequency, monitoring area size, and farmland fragmentation and to select the most suitable remote sensing satellite for spring wheat drought monitoring.
It should be noted that the analysis of satellite sensors and various indices in this study was based on the response characteristics of the spring wheat canopy spectra to variations in water conditions. However, this feature may vary owing to the differences in the absolute content of crop water under different scenarios. Therefore, the conclusions of this study may not be applicable to other crop drought monitoring studies. However, the analysis and implementation methods may be valuable references. In addition, it is of high significance to consider the diverse values of physiological parameters and the differences between the growth stages of certain crops.

5. Conclusions

The PROSAIL model was employed to simulate the canopy spectrum of spring wheat at five growth stages under four drought scenarios. By optimizing the input parameters and generating extensive reflectance spectra that approximate real-world complexities, we evaluated the response of canopy spectra at various wavelengths to variations in the water conditions using variance analysis. Our results indicate that the canopy spectra of spring wheat are sensitive to variations in the 1405–1505 nm range. Among the mainstream satellites currently available, MODIS band 7 has emerged as being optimal for monitoring spring wheat. WI, MSI, and SRWI, followed by LSWI and GVMI calculated using MODIS band 2 and 6 as well as band 8 and 11 of Sentinel-2, are suitable indices for evaluating spring wheat drought. The effectiveness of the other indices based on different satellite bands varies across the different scenarios.

Author Contributions

Conceptualization, X.Z.; Data curation, C.X. and Y.W.; Formal analysis, C.X. and Y.W.; Funding acquisition, X.Z.; Investigation, C.X. and Y.W.; Methodology, X.Z. and C.X.; Software, C.X. and Y.W.; Visualization, Y.W.; Writing—original draft, C.X., Y.W. and X.Z.; Writing—review and editing, X.Z. All authors have read and agreed to the published version of the manuscript.

Funding

This work was supported by the National Key R&D Program of China (Grant No. 2021YFB3901201) and the National Natural Science Foundation of China (Grant No. 42077436).

Data Availability Statement

Data are available upon request.

Acknowledgments

We thank the journal’s editors and reviewers for their kind comments and valuable suggestions to improve the quality of this paper.

Conflicts of Interest

The authors declare no conflict of interest. The funders had no role in the design of the study; in the collection, analyses, or interpretation of data; in the writing of the manuscript; or in the decision to publish the results.

References

  1. Liu, X.; Zhu, X.; Pan, Y.; Li, S.; Liu, Y.; Ma, Y. Agricultural Drought Monitoring: Progress, Challenges, and Prospects. J. Geogr. Sci. 2016, 26, 750–767. [Google Scholar] [CrossRef]
  2. Wang, W.; Ertsen, M.W.; Svoboda, M.D.; Hafeez, M. Propagation of Drought: From Meteorological Drought to Agricultural and Hydrological Drought. Adv. Meteorol. 2016, 33, 35. [Google Scholar] [CrossRef]
  3. IPCC. Global Warming of 1.5 °C-IPCC Special Report-Summary for Policymakers; Cambridge University Press: Cambridge, UK, 2018. [Google Scholar]
  4. Petit, J.R.; Jouzel, J.; Raynaud, D.; Barkov, N.I.; Barnola, J.M.; Basile, I.; Bender, M.; Chappellaz, J.; Davis, M.; Delaygue, G.; et al. Climate and Atmospheric History of the Past 420,000 Years from the Vostok Ice Core, Antarctica. Nature 1999, 399, 429–436. [Google Scholar] [CrossRef]
  5. Hawkesford, M.J.; Araus, J.-L.; Park, R.; Calderini, D.; Miralles, D.; Shen, T.; Zhang, J.; Parry, M.A.J. Prospects of Doubling Global Wheat Yields. Food Energy Secur. 2013, 2, 34–48. [Google Scholar] [CrossRef]
  6. Pan, X.; Wang, G.; Yang, H.; Wei, X. Effect of Water Deficits on within-Plot Variability in Growth and Grain Yield of Spring Wheat in Northwest China. Field Crops Res. 2003, 80, 195–205. [Google Scholar] [CrossRef]
  7. Carlson, R.E.; Yarger, D.N.; Shaw, R.H. Factors Affecting the Spectral Properties of Leaves with Special Emphasis on Leaf Water Status. Agron. J. 1971, 63, 486–489. [Google Scholar] [CrossRef]
  8. Bayat, B.; van der Tol, C.; Verhoef, W. Remote Sensing of Grass Response to Drought Stress Using Spectroscopic Techniques and Canopy Reflectance Model Inversion. Remote Sens. 2016, 8, 557. [Google Scholar] [CrossRef]
  9. Ripple, W.J. Spectral Reflectance Relationships to Leaf Water-Stress. Photogramm. Eng. Remote Sens. 1986, 52, 1669–1675. [Google Scholar]
  10. Jacquemoud, S.; Verhoef, W.; Baret, F.; Bacour, C.; Zarco-Tejada, P.J.; Asner, G.P.; François, C.; Ustin, S.L. PROSPECT+ SAIL Models: A Review of Use for Vegetation Characterization. Remote Sens. Environ. 2009, 113, S56–S66. [Google Scholar] [CrossRef]
  11. Broge, N.H.; Leblanc, E. Comparing Prediction Power and Stability of Broadband and Hyperspectral Vegetation Indices for Estimation of Green Leaf Area Index and Canopy Chlorophyll Density. Remote Sens. Environ. 2001, 76, 156–172. [Google Scholar] [CrossRef]
  12. Weiss, M.; Baret, F.; Myneni, R.; Pragnère, A.; Knyazikhin, Y. Investigation of a Model Inversion Technique to Estimate Canopy Biophysical Variables from Spectral and Directional Reflectance Data. Agronomie 2000, 20, 3–22. [Google Scholar] [CrossRef]
  13. Kong, W.; Huang, W.; Zhou, X.; Song, X.; Casa, R. Estimation of Carotenoid Content at the Canopy Scale Using the Carotenoid Triangle Ratio Index from in Situ and Simulated Hyperspectral Data. J. Appl. Remote Sens. 2016, 10, 26–35. [Google Scholar] [CrossRef]
  14. Nichol, J.E.; Abbas, S. Integration of Remote Sensing Datasets for Local Scale Assessment and Prediction of Drought. Sci. Total Environ. 2015, 505, 503–507. [Google Scholar] [CrossRef] [PubMed]
  15. Abbas, S.; Nichol, J.E.; Qamer, F.M.; Xu, J. Characterization of Drought Development through Remote Sensing: A Case Study in Central Yunnan, China. Remote Sens. 2014, 6, 4998–5018. [Google Scholar] [CrossRef]
  16. Reinermann, S.; Gessner, U.; Asam, S.; Kuenzer, C.; Dech, S. The Effect of Droughts on Vegetation Condition in Germany: An Analysis Based on Two Decades of Satellite Earth Observation Time Series and Crop Yield Statistics. Remote Sens. 2019, 11, 1783. [Google Scholar] [CrossRef]
  17. Dabrowska-Zielinska, K.; Malinska, A.; Bochenek, Z.; Bartold, M.; Gurdak, R.; Paradowski, K.; Lagiewska, M. Drought Model DISS Based on the Fusion of Satellite and Meteorological Data under Variable Climatic Conditions. Remote Sens. 2020, 12, 2944. [Google Scholar] [CrossRef]
  18. Liu, X.; Zhu, X.; Zhang, Q.; Yang, T.; Pan, Y.; Sun, P. A Remote Sensing and Artificial Neural Network-Based Integrated Agricultural Drought Index: Index Development and Applications. Catena 2020, 186, 104–394. [Google Scholar] [CrossRef]
  19. Chen, S.; Zhong, W.; Pan, S.; Xie, Q.; Kim, T.-W. Comprehensive Drought Assessment Using a Modified Composite Drought Index: A Case Study in Hubei Province, China. Water 2020, 12, 462. [Google Scholar] [CrossRef]
  20. Hao, C.; Zhang, J.; Yao, F. Combination of Multi-Sensor Remote Sensing Data for Drought Monitoring over Southwest China. Int. J. Appl. Earth Obs. Geoinf. 2015, 35, 270–283. [Google Scholar] [CrossRef]
  21. Sun, H.; Feng, M.; Xiao, L.; Yang, W.; Wang, C.; Jia, X.; Zhao, Y.; Zhao, C.; Muhammad, S.K.; Li, D. Assessment of Plant Water Status in Winter Wheat (Triticum Aestivum L.) Based on Canopy Spectral Indices. PLoS ONE 2019, 14, e0216890. [Google Scholar] [CrossRef]
  22. Xie, X.; Li, Y.X.; Li, R.; Zhang, Y.; Huo, Y.; Bao, Y.; Shen, S. Hyperspectral Characteristics and Growth Monitoring of Rice (Oryza Sativa) under Asymmetric Warming. Int. J. Remote Sens. 2013, 34, 8449–8462. [Google Scholar] [CrossRef]
  23. Richardson, A.J.; Everitt, J.H. Using Spectral Vegetation Indices to Estimate Rangeland Productivity. Geocarto Int. 1992, 7, 63–69. [Google Scholar] [CrossRef]
  24. Birth, G.S.; McVey, G.R. Measuring the Color of Growing Turf with a Reflectance Spectrophotometer1. Agron. J. 1968, 60, 640–643. [Google Scholar] [CrossRef]
  25. Pettorelli, N.; Vik, J.O.; Mysterud, A.; Gaillard, J.M.; Tucker, C.J.; Stenseth, N.C. Using the Satellite-Derived NDVI to Assess Ecological Responses to Environmental Change. Trends Ecol. Evol. 2005, 20, 503–510. [Google Scholar] [CrossRef]
  26. Huete, A.R. A Soil-Adjusted Vegetation Index (SAVI). Remote Sens. Environ. 1988, 25, 295–309. [Google Scholar] [CrossRef]
  27. Gamon, J.A.; Serrano, L.; Surfus, J.S. The Photochemical Reflectance Index: An Optical Indicator of Photosynthetic Radiation Use Efficiency across Species, Functional Types, and Nutrient Levels. Oecologia 1997, 112, 492–501. [Google Scholar] [CrossRef]
  28. Ge, L.; Wang, X.; Wang, Q.; Dang, H.; Zhao, C. Applicability of PROSAIL Model to Spring Wheat in Semi-Arid Region of the Loess Plateau under Different Drought Stress. J. Arid. Meteorol. 2017, 35, 926. (In Chinese) [Google Scholar] [CrossRef]
  29. Richter, K.; Rischbeck, P.; Eitzinger, J.; Schneider, W.; Suppan, F.; Weihs, P. Plant Growth Monitoring and Potential Drought Risk Assessment by Means of Earth Observation Data. Int. J. Remote Sens. 2008, 29, 4943–4960. [Google Scholar] [CrossRef]
  30. Berger, K.; Atzberger, C.; Danner, M.; D’Urso, G.; Mauser, W.; Vuolo, F.; Hank, T. Evaluation of the PROSAIL Model Capabilities for Future Hyperspectral Model Environments: A Review Study. Remote Sens. 2018, 10, 85. [Google Scholar] [CrossRef]
  31. Zhao, Q.; Yu, L.; Du, Z.; Peng, D.; Hao, P.; Zhang, Y.; Gong, P. An Overview of the Applications of Earth Observation Satellite Data: Impacts and Future Trends. Remote Sens. 2022, 14, 1863. [Google Scholar] [CrossRef]
  32. Huete, A.; Didan, K.; Miura, T.; Rodriguez, E.P.; Gao, X.; Ferreira, L.G. Overview of the Radiometric and Biophysical Performance of the MODIS Vegetation Indices. Remote Sens. Environ. 2002, 83, 195–213. [Google Scholar] [CrossRef]
  33. Kaufman, Y.J.; Tanre, D. Atmospherically Resistant Vegetation Index (ARVI) for EOS-MODIS. IEEE Trans. Geosci. Remote Sens. 1992, 30, 261–270. [Google Scholar] [CrossRef]
  34. Pc, A.; Sf, B.; Jmg, A. Designing a Spectral Index to Estimate Vegetation Water Content from Remote Sensing Data. Remote Sens. Environ. 2002, 82, 198–207. [Google Scholar] [CrossRef]
  35. Xiao, X.; Hollinger, D.; Aber, J.; Goltz, M.; Davidson, E.A.; Zhang, Q.; Moore, B. Satellite-Based Modeling of Gross Primary Production in an Evergreen Needleleaf Forest. Remote Sens. Environ. 2004, 89, 519–534. [Google Scholar] [CrossRef]
  36. Zhang, N.; Hong, Y.; Qin, Q.; Liu, L. Vsdi: A Visible and Shortwave Infrared Drought Index for Monitoring Soil and Vegetation Moisture Based on Optical Remote Sensing. Int. J. Remote Sens. 2013, 34, 4585–4609. [Google Scholar] [CrossRef]
  37. Romero, M.; Luo, Y.; Su, B.; Fuentes, S. Vineyard Water Status Estimation Using Multispectral Imagery from an UAV Platform and Machine Learning Algorithms for Irrigation Scheduling Management. Comput. Electron. Agric. 2018, 147, 109–117. [Google Scholar] [CrossRef]
  38. Arango, R.B.; Campos, A.M.; Combarro, E.F.; Canas, E.R.; Díaz, I. Identification of Agricultural Management Zones through Clustering Algorithms with Thermal and Multispectral Satellite Imagery. Int. J. Uncertain. Fuzziness Knowl. Based Syst. 2017, 25, 121–140. [Google Scholar] [CrossRef]
  39. Gao, B. NDWI—A Normalized Difference Water Index for Remote Sensing of Vegetation Liquid Water from Space. Remote Sens. Environ. 1996, 58, 257–266. [Google Scholar] [CrossRef]
  40. Hardisky, M.S.; Klemas, V.; Smart, A. The Influence of Soil Salinity, Growth Form, and Leaf Moisture on the Spectral Radiance of Spartina Alterniflora Canopies. Photogramm. Eng. Remote Sens. 1983, 49, 77–84. [Google Scholar]
  41. Rock, B.N.; Vogelmann, J.E.; Williams, D.L.; Vogelmann, A.F.; Hoshizaki, T. Remote Detection of Forest Damage. BioScience 1986, 36, 439–445. [Google Scholar] [CrossRef]
  42. Penuelas, J.; Pinol, J.; Ogaya, R.; Filella, I. Estimation of Plant Water Concentration by the Reflectance Water Index Wi (R900/R970). Int. J. Remote Sens. 2010, 18, 2869–2875. [Google Scholar] [CrossRef]
  43. Zarco-Tejada, P.J.; Ustin, S.L. Modeling Canopy Water Content for Carbon Estimates from MODIS Data at Land EOS Validation Sites. In Proceedings of the IEEE International Geoscience & Remote Sensing Symposium, Sydney, Australia, 9–13 July 2001; pp. 342–344. [Google Scholar] [CrossRef]
  44. Galvão, L.S.; Formaggio, A.R.; Tisot, D.A. Discrimination of Sugarcane Varieties in Southeastern Brazil with EO-1 Hyperion Data. Remote Sens. Environ. 2005, 94, 523–534. [Google Scholar] [CrossRef]
  45. Gitelson, A.; Merzlyak, M.N. Spectral Reflectance Changes Associated with Autumn Senescence of Aesculus Hippocastanum L. And Acer Platanoides L. Leaves. Spectral Features and Relation to Chlorophyll Estimation. J. Plant Physiol. 1994, 143, 286–292. [Google Scholar] [CrossRef]
  46. Gurdak, R.; Bartold, M. Remote Sensing Techniques to Assess Chlorophyll Fluorescence in Support of Crop Monitoring in Poland. Misc. Geogr. 2021, 25, 226–237. [Google Scholar] [CrossRef]
  47. Zarco-Tejada, P.J.; Miller, J.R.; Noland, T.L.; Mohammed, G.H.; Sampson, P.H. Scaling-up and Model Inversion Methods with Narrowband Optical Indices for Chlorophyll Content Estimation in Closed Forest Canopies with Hyperspectral Data. IEEE Trans. Geosci. Remote Sens. 2001, 39, 1491–1507. [Google Scholar] [CrossRef]
  48. Dash, J.; Curran, P.J. The Meris Terrestrial Chlorophyll Index. Int. J. Remote Sens. 2004, 25, 5403–5413. [Google Scholar] [CrossRef]
  49. Rousseeuw, P.J. Silhouettes: A Graphical Aid to the Interpretation and Validation of Cluster Analysis. J. Comput. Appl. Math. 1987, 20, 53–65. [Google Scholar] [CrossRef]
  50. Kaufman, L.; Rousseeuw, P.J. Finding Groups in Data: An Introduction to Cluster Analysis; Wiley Online Library: Hoboken, NJ, USA, 2005. [Google Scholar]
  51. Zhai, L.; Feng, Q. Spatial and Temporal Pattern of Precipitation and Drought in Gansu Province, Northwest China. Nat. Hazards 2009, 49, 1–24. [Google Scholar] [CrossRef]
  52. Duan, H.; Wang, S.; Feng, J. Drought Events and Its Influence in 2011 in China. J. Arid. Meteorol. 2012, 30, 136–147. (In Chinese) [Google Scholar] [CrossRef]
  53. Baoji Bureau of Statistics. Baoji Statistical Yearbook (2017); China Statistics Press: Beijing, China, 2017. [Google Scholar]
  54. Wang, S.; Wang, S.; Feng, J. Drought Events and Its Influence in 2016 in China. J. Arid. Meteorol. 2017, 35, 342–351. (In Chinese) [Google Scholar] [CrossRef]
  55. Cheng, F.; Zhang, Z.; Zhuang, H.; Han, J.; Luo, Y.; Cao, J.; Zhang, L.; Zhang, J.; Xu, J.; Tao, F. ChinaCropSM1 Km: A Fine 1km Daily Soil Moisture Dataset for Dryland Wheat and Maize across China During 1993–2018. Earth Syst. Sci. Data 2023, 15, 395–409. [Google Scholar] [CrossRef]
  56. Luo, Y.; Zhang, Z.; Li, Z.; Chen, Y.; Zhang, L.; Cao, J.; Tao, F. Identifying the Spatiotemporal Changes of Annual Harvesting Areas for Three Staple Crops in China by Integrating Multi-Data Sources. Environ. Res. Lett. 2020, 15, 074003. [Google Scholar] [CrossRef]
  57. Carter, G.A. Primary and Secondary Effects of Water Content on the Spectral Reflectance of Leaves. Am. J. Bot. 1991, 78, 916–924. [Google Scholar] [CrossRef]
  58. Gates, D.M.; Keegan, H.J.; Schleter, J.C.; Weidner, V.R. Spectral Properties of Plants. Appl. Opt. 1965, 4, 11–20. [Google Scholar] [CrossRef]
  59. Calbert, J.G. Radiation Biology. Volume III. Visible and Near-Visible Light; Alexander, H., Ed.; McGraw-Hill: New York, NY, USA, 1954. [Google Scholar]
  60. Mestre, H. The Absorption of Radiation by Leaves and Algae. Cold Spring Harb. Symp. Quant. Biol. 1935, 3, 191–209. [Google Scholar] [CrossRef]
  61. Xiao, Y.; Zhao, W.; Zhou, D.; Gong, H. Sensitivity Analysis of Vegetation Reflectance to Biochemical and Biophysical Variables at Leaf, Canopy, and Regional Scales. IEEE Trans. Geosci. Remote Sens. 2013, 52, 4014–4024. [Google Scholar] [CrossRef]
  62. Tucker, C.J. Remote Sensing of Leaf Water Content in the near Infrared. Remote Sens. Environ. 1980, 10, 23–32. [Google Scholar] [CrossRef]
  63. Gausman, H.; Allen, W.; Cardenas, R.; Richardson, A. Relation of Light Reflectance to Histological and Physical Evaluations of Cotton Leaf Maturity. Appl. Opt. 1970, 9, 545–552. [Google Scholar] [CrossRef] [PubMed]
  64. Fensholt, R.; Sandholt, I. Derivation of a Shortwave Infrared Water Stress Index from MODIS near-and Shortwave Infrared Data in a Semiarid Environment. Remote Sens. Environ. 2003, 87, 111–121. [Google Scholar] [CrossRef]
  65. Mikaili, O.; Rahimzadegan, M. Investigating Remote Sensing Indices to Monitor Drought Impacts on a Local Scale (Case Study: Fars Province, Iran). Nat. Hazards 2022, 111, 2511–2529. [Google Scholar] [CrossRef]
  66. Ghulam, A.; Qin, Q.; Teyip, T.; Li, Z.-L. Modified Perpendicular Drought Index (MPDI): A Real-Time Drought Monitoring Method. ISPRS J. Photogramm. Remote Sens. 2007, 62, 150–164. [Google Scholar] [CrossRef]
  67. Bartold, M.; Kluczek, M. A Machine Learning Approach for Mapping Chlorophyll Fluorescence at Inland Wetlands. Remote Sens. 2023, 15, 2392. [Google Scholar] [CrossRef]
  68. Jing, X.; Zou, Q.; Yan, J.; Dong, Y.; Li, B. Remote Sensing Monitoring of Winter Wheat Stripe Rust Based on Mrmr-Xgboost Algorithm. Remote Sens. 2022, 14, 756. [Google Scholar] [CrossRef]
  69. Danner, M.; Berger, K.; Wocher, M.; Mauser, W.; Hank, T. Fitted PROSAIL Parameterization of Leaf Inclinations, Water Content and Brown Pigment Content for Winter Wheat and Maize Canopies. Remote Sens. 2019, 11, 1150. [Google Scholar] [CrossRef]
  70. Richter, K.; Atzberger, C.; Vuolo, F.; Urso, G.D. Evaluation of Sentinel-2 Spectral Sampling for Radiative Transfer Model Based Lai Estimation of Wheat, Sugar Beet, and Maize. IEEE J. Sel. Top. Appl. Earth Obs. Remote Sens. 2011, 4, 458–464. [Google Scholar] [CrossRef]
  71. Roy, D.P.; Wulder, M.A.; Loveland, T.R.; Woodcock, C.E.; Allen, R.G.; Anderson, M.C.; Helder, D.; Irons, J.R.; Johnson, D.M.; Kennedy, R.; et al. Landsat-8: Science and Product Vision for Terrestrial Global Change Research. Remote Sens. Environ. 2014, 145, 154–172. [Google Scholar] [CrossRef]
  72. Drusch, M.; Del Bello, U.; Carlier, S.; Colin, O.; Fernandez, V.; Gascon, F.; Hoersch, B.; Isola, C.; Laberinti, P.; Martimort, P.; et al. Sentinel-2: Esa’s Optical High-Resolution Mission for GMES Operational Services. Remote Sens. Environ. 2012, 120, 25–36. [Google Scholar] [CrossRef]
  73. Salomonson, V.V.; Barnes, W.L.; Maymon, P.W.; Montgomery, H.E.; Ostrow, H. MODIS: Advanced Facility Instrument for Studies of the Earth as a System. IEEE Trans. Geosci. Remote Sens. 1989, 27, 145–153. [Google Scholar] [CrossRef]
Figure 1. Geographical location of the testing area.
Remotesensing 15 04838 g001
Figure 2. Simulated spectra of spring wheat under different drought scenarios at (a) jointing stage; (b) booting stage; (c) heading stage; (d) flowering stage; and (e) pustulation stage.
Remotesensing 15 04838 g002
Figure 3. F-value variation with wavelength in jointing, booting, and heading stages of spring wheat.
Remotesensing 15 04838 g003
Figure 4. F-value variation with wavelength in flowering and pustulation stages of spring wheat.
Remotesensing 15 04838 g004
Figure 5. Applicability of mainstream satellites for monitoring drought at different growth stages of spring wheat (non-drought and severe drought).
Remotesensing 15 04838 g005
Figure 6. Silhouette coefficients of vegetation indices based on specific wavelengths.
Remotesensing 15 04838 g006
Figure 7. Silhouette coefficients of vegetation indices (without the usage of SWIR bands) based on different band combinations of mainstream satellites.
Remotesensing 15 04838 g007
Figure 8. Silhouette coefficients of vegetation indices (with the usage of SWIR bands) based on different band combinations of mainstream satellites.
Remotesensing 15 04838 g008
Table 1. PROSAIL input parameters (except Cab, Cm, LAI, and EWT).
ParameterSymbolUnitsValue
Total carotenoid contentCcx(μg/cm2)12
Brown pigmentsCbp/0.5
Leaf inclination distribution LIDF(°)55
Hot spot parameterHot(m/m)0.25
Soil brightness factorALFA(rsoil)/0.5–1.5
Sun zenith angletts(°)[30:90:30]
Viewing (observer) zenith angletto(°)[0:90:30]
Relative azimuth angle between sun and sensorpsi(°)[0:45:360]
Table 2. Band information of satellites analyzed in this study.
BlueGreenRedNIRSWIR
Sentinel-2Band2:
458–523 nm
Band3:
543–578 nm
Band4:
650–680 nm
Band8:
785–900 nm
Band8a:
855–875 nm
Band11:
1565–1655 nm
Band12:
2100–2280 nm
Landsat 8Band2:
450–510 nm
Band3:
530–590 nm
Band4:
640–670 nm
Band5:
850–880 nm
Band6:
1570–1650 nm
Band7:
2110–2290 nm
MODISBand3:
459–479 nm
Band4:
545–565 nm
Band1:
620–670 nm
Band2:
841–876 nm
Band5:
1230–1250 nm
Band6:
1628–1652 nm
Band7:
2105–2155 nm
Worldview-2Band2:
450–510 nm
Band3:
510–580 nm
Band5:
630–690 nm
Band7:
770–900 nm
Band8:
860–1040 nm
/
GF-2Band2:
450–520 nm
Band3:
520–590
Band4:
650–690
Band5:
730–890 nm
/
Table 3. List of vegetation indices used in this study.
NoIndexFormulaReference
1 Normalized Difference Vegetation Index (NDVI) N D V I = N I R     R E D N I R   +   R E D [25]
2Soil-Adjusted Vegetation Index (SAVI) S A V I = N I R     R E D N I R   +   R E D   +   0.5 ( 1   +   0.5 ) [26]
3Enhanced Vegetation Index (EVI) E V I = 2.5 N I R     R E D N I R   +   6 R E D     7.5 B L U E   +   1 [32]
4Atmospherically Resistant
Vegetation Index (ARVI)
A R V I = N I R     2 R E D   +   B L U E N I R   +   2 R E D     B L U E [33]
5 Global Vegetation Moisture Index (GVMI) G V M I = ( N I R   +   0.1 )     ( S W I R   +   0.02 ) N I R   +   0.1   +   ( S W I R   +   0.02 ) [34]
6Land Surface Water Index (LSWI) L S W I = N I R     S W I R N I R   +   S W I R [35]
7Visible and Shortwave infrared Drought Index (VSDI) V S D I = 1 [ S W I R B L U E + ( R E D B L U E ) [36]
8Normalized Difference Greenness Vegetation Index (NDGI) N D G I = N I R     G R E E N N I R   +   G R E E N [37]
9Shortwave Infrared Ratio (SWIRR) S W I R R = S W I R 1 S W I R 2 [38]
10Normalized Difference Water
Index (NDWI)
N D W I = R 860     R 1240 R 860   +   R 1240 [39]
11Photochemical Reflectance Index (PRI) P R I = R 531     R 570 R 531   +   R 570 [27]
12Normalized Difference Infrared
Index (NDII)
N D I I = R 850     R 1650 R 850   +   R 1650 [40]
13Moisture Stress Index (MSI) M S I = R 1600 R 820 [41]
14Water Index (WI) W I = R 900 R 970 [42]
15Simple Ratio Water Index (SRWI) S R W I = R 858 R 1240 [43]
16Disease Water Stress Index (DSWI) D S W I = R 802   +   R 547 R 1657   +   R 682 [44]
17Normalized Difference Red Edge
Index1 (NDREI1)
N D R E I 1 = R 790     R 720 R 790   +   R 720 [45]
18Normalized Difference Red Edge
Index2 (NDREI2)
N D R E I 2 = R 750     R 705 R 750   +   R 705     R 445 [46]
19Zarco-Tejada and Miller Index (ZMI) Z M I = R 750 R 710 [47]
20MERIS Terrestrial Chlorophyll
Index (MTCI)
M T C I = R 754     R 709 R 709     R 681 [48]
Note: ‘RED’, ‘GREEN’, ‘BLUE’, ‘NIR’, and ‘SWIR’ represent the red, green, blue, near-infrared, and shortwave infrared bands, respectively, of different satellites. R x represents the reflectance at x nm.
Table 4. Data used for testing.
DataSourceLocationResolutionAcquisition TimeApplication
20 MOD09A1 images National Aeronautics and Space Administration (NASA)Gansu Province250 mMarch to July 2011Calculate vegetation index
4 Sentinel-2 1C-level imagesEuropean Space
Agency (ESA)
Baoji City,
Shaanxi Province
10 mMarch to June 2016Calculate vegetation index
ChinaCropSM1[55]Gansu Province and Baoji City, Shaanxi Province1 kmMarch to July 2011 and March to June 2016Assist in selecting drought and normal crop pixels
Distribution map of spring wheat[56]Gansu Province and Baoji City, Shaanxi Province1 kmMarch to July 2011 and
March to June 2016
Assist in selecting crop pixels
Table 5. Average silhouette coefficients of four indices throughout the entire growth period of spring wheat.
LSWIGVMISAVIEVI
20 MODIS images in Gansu Province0.440.490.400.39
4 Sentinel-2 images in Baoji City0.210.200.110.15
Disclaimer/Publisher’s Note: The statements, opinions and data contained in all publications are solely those of the individual author(s) and contributor(s) and not of MDPI and/or the editor(s). MDPI and/or the editor(s) disclaim responsibility for any injury to people or property resulting from any ideas, methods, instructions or products referred to in the content.

