Article

Comprehensive Assessment of Vulnerability to Storm Surges in Coastal China: Towards a Prefecture-Level Cities Perspective

1
State Key Laboratory of Resources and Environmental Information System, Institute of Geographic Sciences and Natural Resources Research, Chinese Academy of Sciences, Beijing 100101, China
2
University of Chinese Academy of Sciences, Beijing 100049, China
3
School of Geography and Information Engineering, China University of Geosciences, Wuhan 430074, China
*
Author to whom correspondence should be addressed.
Remote Sens. 2023, 15(19), 4828; https://doi.org/10.3390/rs15194828
Submission received: 13 August 2023 / Revised: 22 September 2023 / Accepted: 27 September 2023 / Published: 5 October 2023
(This article belongs to the Special Issue Remote Sensing for Mapping Global Land Surface Parameters)

Abstract

:
China is one of the countries that suffers severe damage from storm surges. Assessing the vulnerability to storm surges holds great significance for promoting sustainable development and minimizing disaster losses in coastal areas. This study first developed a vulnerability index by integrating 15 indicators from three components (exposure, sensitivity, and adaptability) that provide a comprehensive portrayal of the multidimensional structure of vulnerability. Subsequently, the vulnerability of Chinese coastal areas was comprehensively evaluated from the perspective of prefecture-level cities using a weight combination strategy. Furthermore, spatial statistical techniques were utilized to analyze the spatial heterogeneity of vulnerability. The results show that 64% of coastal cities are classified as being in the very high and high vulnerability categories, with Zhanjiang, Lingao, Dalian, Yancheng, and Shanwei exhibiting the highest vulnerability levels. Among the provinces, Guangxi and Hainan Provinces demonstrate the highest vulnerability, with more than 90% of their coastal cities facing high vulnerability. Additionally, the vulnerability of Chinese coastal cities exhibits significant spatial heterogeneity. Specifically, coastal cities located in the Yangtze River Delta and the Pearl River Delta regions are identified as low–low (LL) vulnerability clusters, whereas high–high (HH) vulnerability clusters are observed in coastal cities within the Beibu Gulf region. These results provide valuable insights for the formulation of disaster reduction policies at the provincial level and the focus for action at the local level.

1. Introduction

Marine dynamic disasters, including storm surges, huge waves, tsunami, and sea ice, are the most harmful natural disasters for the world’s coastal countries [1]. Among them, storm surges have gained increasing attention in recent decades as the most economically devastating marine dynamic disaster affecting coastal countries worldwide. Within the context of global climate change, storm surges are not only intensifying but also occurring more frequently [2,3]. The low-lying coastal regions of mainland China, situated at the intersection of the Eurasian and Pacific plates, are especially vulnerable to natural disasters. Moreover, with the population growth and rapid economic development in coastal areas, China’s coastal cities are experiencing escalating losses from storm surges [4]. According to the Bulletin of China Marine Disaster, storm surges caused an average annual economic loss of CNY 10.5 billion between 1990 and 2010, leading to 148 fatalities and impacting 11.5 million people. Furthermore, from 2011 to 2020, an average of 17 storm surge events related to tropical cyclones occurred annually in coastal areas, leading to an average annual economic loss of CNY 80.82 billion, which accounted for 92.18% of the total economic loss caused by marine disasters [5,6,7]. Recently, the “14th Five-Year Plan for National Comprehensive Disaster Prevention and Reduction” released by the China National Commission for Disaster Reduction underscored the increasing vulnerability of disaster-bearing bodies due to the frequent occurrence of marine disasters. The plan also highlighted the critical importance of conducting vulnerability assessments to enhance the disaster prevention and reduction system in coastal areas [8]. Given this backdrop, mitigating the impact of storm surges has become a crucial aspect of promoting sustainable development in China’s coastal areas, posing a significant challenge for governments at all levels.
A vulnerability assessment serves as a critical link between disaster and risk investigation, playing a vital role in mitigating the future threat of storm surges [9]. Conducting a comprehensive assessment of vulnerability to storm surges in coastal areas can assist management in prioritizing and formulating adaptive strategies that optimize resource allocation and enhance response efficiency [10]. The scientific literature presents various concepts of vulnerability, each emphasizing different dimensions of vulnerability [11,12,13,14,15]. One widely accepted concept, as proposed by the Intergovernmental Panel on Climate Change (IPCC), defines vulnerability as “the degree to which a system is susceptible to, or unable to cope with, adverse effects of climate change, including climate variability and extremes”. In this case, vulnerability is a function of the character, magnitude, and rate of climate variation to which a system is exposed, its sensitivity, and its adaptive capacity [16,17,18]. Vulnerability index methods, rooted in the aforementioned concepts, have been widely employed in assessing vulnerability to storm surges by integrating various factors across different temporal and spatial scales [19,20,21,22,23]. The integration of different factors into vulnerability assessments heavily relies on data availability and the unique characteristics of the study area. To date, numerous factors related to exposure, sensitivity, and adaptive capacity have been employed in vulnerability assessments conducted worldwide [24,25,26,27].
Although previous studies related to assessing vulnerability to storm surges in coastal areas of China have been reported, these studies mainly focused on a single dimension of vulnerability and largely ignored the fact that vulnerability has evolved into a multidimensional structure, which is determined by social, economic, physical, and environmental systems [28,29,30,31,32]. Moreover, the incomplete consideration of vulnerability elements is more likely to exacerbate the uncertainty of assessment results, leading to incorrect (either too low or too high) estimates of vulnerability [33]. Therefore, it is essential to conduct a comprehensive assessment that integrates adequate indicators of vulnerability elements in order to generate detailed and accurate vulnerability information. On the other hand, most studies have concentrated on individual provinces or limited regions in terms of their research scope. Few studies have provided vulnerability mapping specifically pertaining to storm surge disasters across the entire coastal areas of mainland China [20,21,24,34,35,36,37,38]. However, at the national level, it is highly desirable to have higher resolution (local administrative level) studies covering the entire coastal areas in order to effectively manage and plan for a sustainable future in developed but highly susceptible regions [39,40,41].
In China, the administrative system is primarily structured into a four-tier hierarchy comprising provincial, prefectural, county, and township levels. Prefecture-level cities, operating under provinces, assume direct administrative control over counties. Therefore, as the pivotal links connecting provinces and counties, prefecture-level cities play a critical role in the development and execution of disaster prevention and mitigation policies [42,43]. Up to now, no studies have been found on mapping the prefecture-level spatial patterns of vulnerability to storm surge disasters encompassing the entire coastline of mainland China. To bridge this gap, this study aims to provide a comprehensive assessment of the vulnerability to storm surges in coastal China from the perspective of prefecture-level cities based on up-to-date data. The three specific objectives of this study include the following: (1) to integrate the exposure, sensitivity, and adaptability components of vulnerability to construct a vulnerability index that provides a comprehensive portrayal of the multidimensional structure of vulnerability; (2) to evaluate the degree of vulnerability to storm surges for 64 coastal cities based on the weight combination strategy; and (3) to apply a spatial statistics-based approach to assess the spatial heterogeneity of vulnerability at the prefecture-level.

2. Study Area and Data Sources
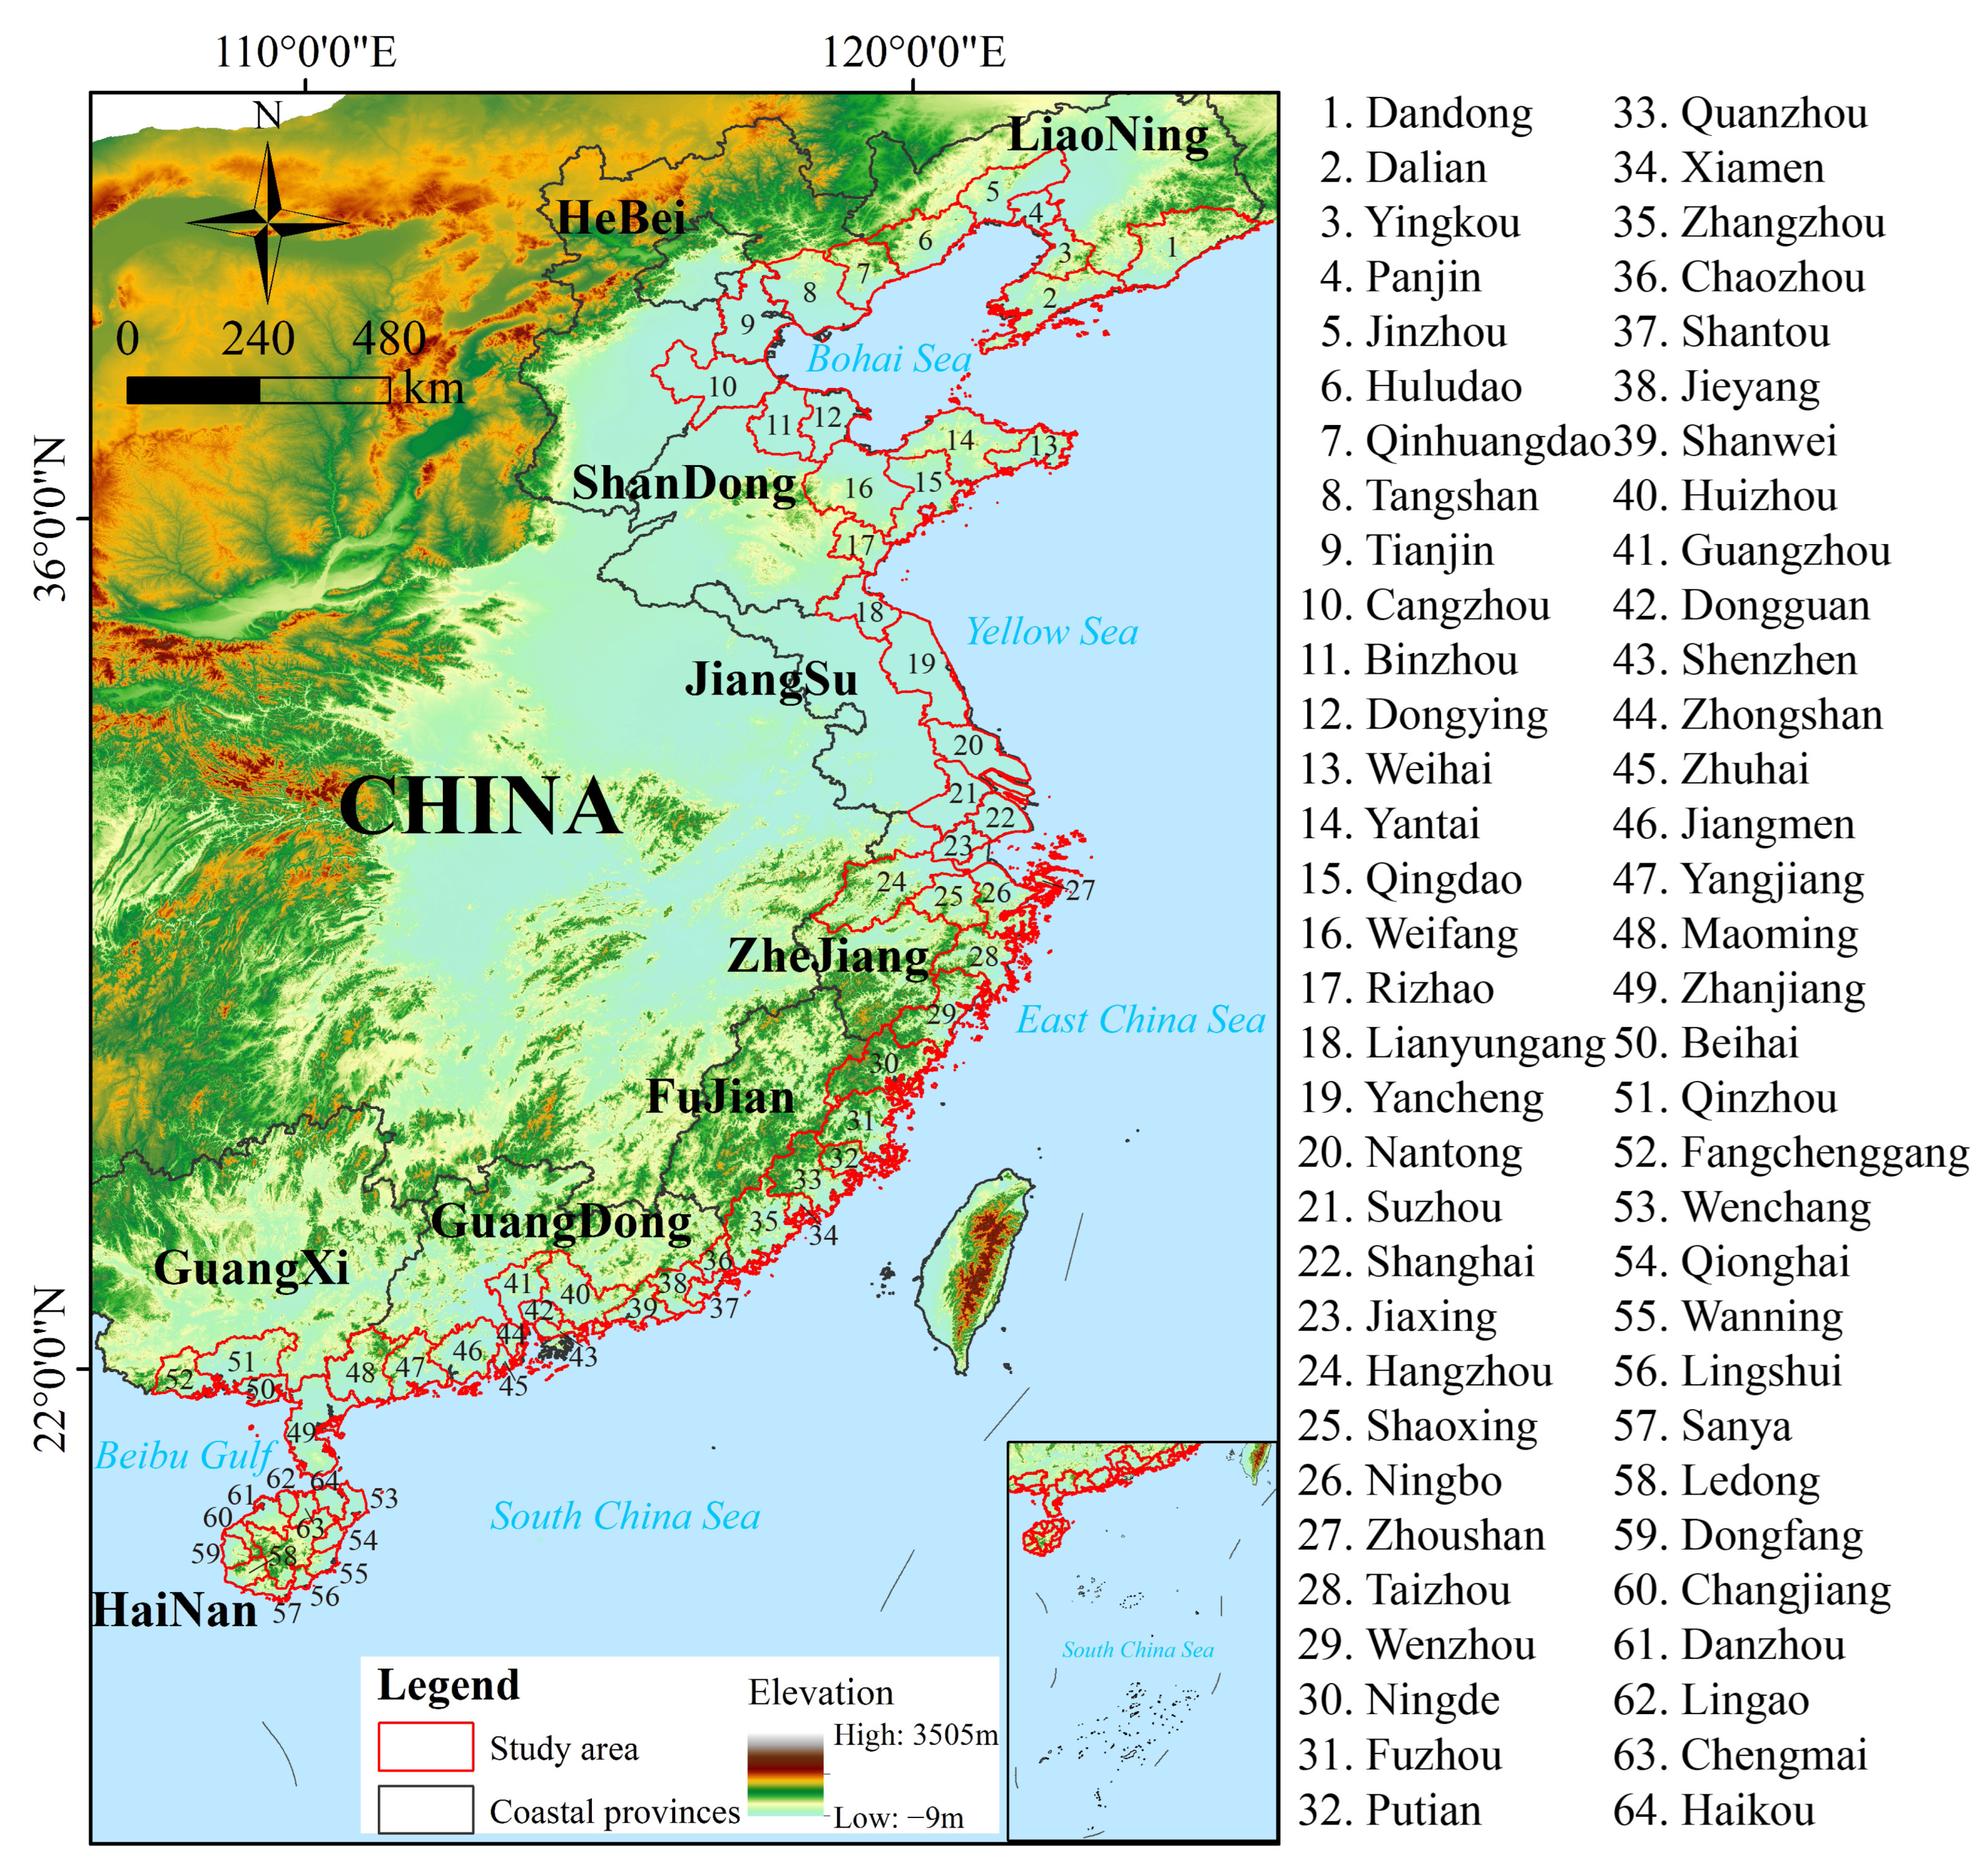
2.1. Study Area

The coastal regions of mainland China span from 108°21′E to 124°21′E and from 18°15′N to 39°60′N, covering over 18,000 km of coastline and traversing three climate zones (i.e., tropical, subtropical, and temperate). The densely populated and rapidly urbanizing coastal areas are becoming increasingly vulnerable to natural disasters and the impacts of climate change, owing to their complex climatic and geological conditions [44]. The study area comprises 64 cities in 11 coastal provinces, including 53 prefecture-level cities, 2 provincial-level municipalities (Tianjin and Shanghai), 4 county-level cities, and 5 counties (Figure 1). It should be noted that all 4 county-level cities and 5 counties are located in Hainan Province and are under the direct administration of the provincial government. To ensure a comprehensive and holistic assessment, these cities are considered as prefecture-level cities. Hong Kong, Macau, and Taiwan were excluded due to their unique political and economic circumstances. While these coastal cities cover only approximately 4.8% of the national land area, they play a leading role in China’s socio-economic development, contributing to 34.3% of the total national gross domestic product [45]. The increasing intensity and concentration of human activity will continue to increase the vulnerability of coastal areas to natural disasters in the future [46]. Therefore, assessing the vulnerability to storm surges of these 64 coastal cities in China holds great practical significance.

2.2. Data Sources

(1)
Land cover data
The European Space Agency (ESA) WorldCover 10 m 2020 product was selected for this study, which provides a global land cover map for 2020 at 10 m resolution with 74% overall classification accuracy [47]. The dataset includes 11 land cover types that align with the UN-FAO’s Land Cover Classification System. However, since our study area is situated in the coastal region of mainland China, land cover types such as moss, lichen, snow, and ice are not represented in the dataset.
(2)
Digital elevation model (DEM) data
The SRTM V3 product (SRTM Plus) provided by NASA JPL at 30 m resolution was selected for this study, which covers almost 80% of the global land mass between 60° north and 56° south latitude [47]. Furthermore, the slope data utilized in this study were also derived from the aforementioned dataset.
(3)
Coastline data
The coastline data were extracted by visual interpretation of the 2018 Landsat OLI images based on the 1980–2010 coastline data and land-use change data. The coastlines were classified into 2 primary classes based on their geographical location and coastal development: artificial and natural coastlines.
Artificial coastline refers to a coastline constructed at the junction of land and sea for human production and living needs, including 6 secondary classes: aquaculture dike, salt pan dike, farmland dike, groin and jetty, town dike, and traffic dike. Notably, the groin and jetty, town dikes, and traffic dikes are built for the protection of ports (wharf, quay), transportation infrastructure, and structures. These constructions adhere to standards that enable them to withstand storm surges occurring once every 20 years or more. However, the construction standards for tidal protection of aquaculture dikes, salt pan dikes, and farmland dikes are generally set at a lower level, providing weak defenses against storm surges.
Natural coastline refers to coastlines whose shapes and attributes remain unaltered by human activities. This classification includes 5 secondary classes: rocky coastline, sandy coastline, muddy coastline, biogenic coastline, and estuary. Among these, only biogenic coastlines are covered with mangroves, coral reefs, or reeds, which effectively weaken the impact of waves and fulfill the role of coastal protection. Detailed methods for visual interpretation and the coastline classification system can be found in references [48,49].
(4)
Point vector data of critical transportation facilities
The spatial location data of critical transportation facilities were obtained from the national basic geographic information data (2021) published by the National Catalogue Service for Geographic Information [50]. The data are in vector point format, and the transportation facilities include five categories: airports, ports, tunnels, bridges, and railway stations.
(5)
Census data
The census data utilized in this study were obtained from the up-to-date 7th National Census of China (2020), which provides the most accurate and detailed statistics currently available. The bulletin of the 7th National Census reveals that China’s population has exhibited a pronounced concentration in coastal areas over the past decade, with particularly rapid growth observed in coastal urban agglomerations such as the Yangtze River Delta and the Pearl River Delta in particular [51].
(6)
Socio-economic data
Socio-economic data were collected from the China City Statistical Yearbook (2021) and the China Statistical Yearbook (2021) published by the National Bureau of Statistics, as well as from the 2021 statistical yearbooks of each coastal city published by the local government statistical offices [45,52].

3. Research Methods

3.1. Vulnerability Assessment Model

The assessment of vulnerability to storm surges is a complex and multidimensional issue, encompassing multiple aspects such as population, economy, industry, agriculture, environment, and ecology. Therefore, the application of an advanced and comprehensive vulnerability assessment model that incorporates essential elements is fundamental for robust and accurate vulnerability mapping. In this study, after conducting an extensive literature review, we adopted the vulnerability assessment model described by Equation (1), which defines vulnerability as a function of exposure, sensitivity, and adaptability [12,18,53,54,55,56].
V i = E i × S i A i
where V i , E i , S i , and A i represent the vulnerability index, exposure index, sensitivity index, and adaptability index for coastal city i , respectively. All these variables are explained in more detail in the following sections. In the calculation of V i , the three elements of vulnerability were treated equally and normalized to a 0–1 scale. The values of V i were highest for the most vulnerable coastal cities and lowest for the least vulnerable coastal cities. Note that this equation does not represent an actual mathematical function, but rather illustrates the relationship between the different elements of vulnerability. Specifically, increases in exposure and sensitivity contribute to a higher vulnerability, whereas increases in adaptability result in a decreased vulnerability.

3.2. Selection and Processing of Indicators

Exposure index ( E i ): exposure is defined as the nature and extent to which a system is exposed to significant climatic variations or natural disasters [12,57,58]. This study utilizes an approach that integrates the physical characteristics of disaster-bearing bodies and environment factors to assess the exposure of coastal cities to storm surges [21]. The guidelines for risk assessment and zoning of storm surge disasters, issued by the State Oceanic Administration of China in 2015, provide reference vulnerability values for different land cover types. However, assessing vulnerability solely based on land cover types considers only the physical characteristics of disaster-bearing bodies. Therefore, the guidelines were adapted and improved in this study. Specifically, the 11 land cover types in the ESA WorldCover product were reclassified into 5 land cover types: impervious surface, cropland, wetland, vegetation (including trees, shrubland, and grassland), and other (including water bodies and sparse vegetation). The vulnerability values prescribed by the guidelines were then incorporated into a comprehensive assessment of vulnerability as exposure values for different land cover types. Additionally, the exposure of a particular type of disaster-bearing body is not fixed, but varies depending on the natural environment in which it is situated. Moreover, storm surge outbreaks may be accompanied by extreme rainfall, in which case, environmental factors have a more dramatic effect on the exposure of disaster-bearing bodies to disasters. For example, low-lying areas are more susceptible to damage from heavy rainfall or surges. The steeper the slope, the faster the water flows, and the closer the area is to rivers or oceans, the more likely it is to be flooded. Thus, we further quantified the influence of environmental factors on the exposure of disaster-bearing bodies to storm surges and rainfall. In short, the lower the elevation, the gentler the slope, and the closer the proximity to water bodies, the higher the exposure to storm surges and rainfall. Lastly, the analytic hierarchy process (AHP) was employed to determine the weight of each factor, with expert scores assigned based on our previous research (Table 1) [21,59]. The formula for calculating the exposure value of different land cover types considering natural environmental factors is as follows:
E l = w l × l + w e × e + w s × s + w d × d
where w l and l represent the weights and exposure values, respectively, of different land cover types. Similarly, w e , w s , and w d represent the weights, while e , s , and d represent the corresponding exposure values of different environmental factors.
Note that this study considers the city as the unit of assessment, and the exposure values of different land cover types cannot be directly used as indicators to calculate the exposure index of a city. Therefore, the area of land cover types with different exposure values within each coastal city was further counted as final indicators. To avoid redundancy in indicators, the area statistical results were divided into three levels at equal intervals based on the exposure values. Moreover, considering the extent of storm surges, only the region extending 10 km inland from the coastline was taken into account.
Sensitivity index ( S i ): sensitivity is defined as the degree to which a system is susceptible to disasters [21,58]. The indicators involved in the sensitivity assessment primarily focus on the population composition, economic structure, and infrastructure layout of a city. Firstly, storm surge disasters directly jeopardize the lives and well-being of individuals. Among society, children and the elderly are the most vulnerable groups, facing greater challenges in taking appropriate self-protective measures during disasters. Moreover, individuals with lower levels of education often possess limited resources and face difficulties in accessing or comprehending early warning information. Therefore, three indicators were chosen to gauge the sensitivity of the population to storm surges, including the percentage of the population aged 14 and under, the percentage of the population aged 65 and above, and the percentage of the population with junior high school education or below [57,60,61,62]. Secondly, storm surge disasters pose a significant threat to coastal economies, particularly those reliant on fisheries production. China holds the distinction of being the world’s largest fish exporter and seafood producer. By the year 2020, the combined area of pond aquaculture and mariculture had exceeded 330,000 km2 in 2020 [63,64]. Hence, the ratio of fishery output to GDP was adopted as an indicator to measure the sensitivity of coastal economies to storm surges [65]. Finally, certain transportation facilities located in coastal areas are susceptible to storm surges. The potential loss of these critical infrastructures could have a significant impact on people’s lives and the city’s economic development. Thus, the density of critical transportation facilities, including airports, ports, tunnels, bridges, and railway stations, within 10 km from the coastline was used to measure the sensitivity of a city’s infrastructure to a storm surge [66].
Adaptability index ( A i ): adaptability is defined as the capacity of a system to respond, adjust, or adapt to the adverse effects of climate change or disasters in terms of behaviors, resources, and technology [12,58,67]. First, a more developed city implies having more resources to prevent and resist disasters, either directly or indirectly. Therefore, we selected general public budget expenditure and GDP as indicators to reflect the social adaptive capacity to storm surge disasters. Disposable income per capita represents the economic situation of individuals, indicating the availability of resources to absorb, reduce, and recover from losses. Thus, urban disposable income per capita and rural disposable income per capita were utilized to characterize the adaptability of citizens to storm surge disasters. Healthcare providers play a crucial role in post-event relief. Insufficient medical services can hinder the emergency response and prolong the recovery process after a disaster. Adequate medical personnel and infrastructure also contribute to regional resilience and help mitigate the immediate damage caused by disasters. Therefore, we chose the number of hospital medical staff and medical institutions as indicators to reflect the medical and health resources of a city [32,60,61,62]. Finally, artificial coastlines with high tide protection standards, as well as biogenic coastlines, can effectively mitigate the damage caused by storm surges, and thereby enhance the disaster prevention and mitigation capacity of coastal regions. Therefore, the proportion of artificial coastlines with high tide protection standards (i.e., groin and jetty, town dike, and traffic dike) and biogenic coastlines to the total length of the coastline was taken as an indicator to directly characterize a city’s capacity to withstand storm surge disasters [28,35].
Ultimately, 15 indicators were utilized to calculate the vulnerability index for each city (Table 2). Detailed data for each coastal city are provided in Supplementary Table S1. Furthermore, the raw data for different indicators are often presented with diverse criteria. For example, the ratio of fishery output to GDP and the general public budget expenditure involve completely different units. Therefore, the raw data were standardized to eliminate differences between indicators caused by inconsistencies in dimensionality and orientation [68]. For a positive indicator,
x i j = x i j M I N x j M A X x j M I N x j
For a negative indicator,
x i j = M A X x j x i j M A X x j M I N x j
where x i j is the raw data value, x i j is the standardized value of x i j , M A X x j represents the maximum value of the j t h indicator, and M I N x j represents the minimum value of the j t h indicator.

3.3. Comprehensive Assessment Based on Weight Combination Strategy

After constructing the indicator system, the next step is to assign an appropriate weight to each indicator and calculate vulnerability values for each city. Since different methods have their own limitations, inconsistent assessment results are easily produced when using different evaluation methods. In order to ensure the reliability of the assessment, it is inadvisable to apply only one method. Therefore, we adopted a comprehensive assessment method based on a weight combination strategy. Firstly, the entropy weight method [69], the coefficient of variation method [70], the technique for order of preference by similarity to ideal solution (TOPSIS) method [71], and the AHP method [21] were adopted for weighting the indicators and evaluating the vulnerability elements, respectively. Subsequently, the compatibility test method, specifically the Kendall consistency test [38], was employed to test the consistency of the assessment results obtained from different methods. Finally, once all the above-mentioned methods passed the consistency test, the combination weighting method was utilized to determine the weights of each evaluation method, thereby obtaining the final comprehensive evaluation results for vulnerability.
Among these methods, the entropy weight method is an evaluation method that determines the weight of an indicator based on the information entropy. Information entropy serves as a measure of the amount of information contained within a system. For example, indicators with greater dispersion exhibit lower information entropy, and consequently, they should be assigned higher weights. The coefficient of variation method assigns weights based on the degree of variation observed in the indicators. A higher degree of variation enables better differentiation among evaluated objects, assigning a greater weight to the indicator. The core principle of the TOPSIS method involves calculating the distance between the evaluated object and both the positive and negative ideal solutions. The merit of the evaluated object is then determined based on its proximity to the ideal solution. AHP is a decision analysis method combining qualitative and quantitative analysis. The main idea is to decompose complex problems into several levels and factors, and then compare the importance of indicators in pairs to determine the weight of indicators. We selected four experts from government, universities, and research institutions at the national level. The expert selection was based on their relevant research experience and in-depth knowledge of coastal China.

3.3.1. Consistency Test

The Kendall consistency test was applied to verify the consistency of the evaluation results obtained from the four methods. Table S2 demonstrates that while the evaluation values of the coastal cities differ among the four methods, the majority of the cities exhibit consistent rankings. Further validation showed that the Kendall’s W values of the consistency coefficients for the three elements of vulnerability were 0.985, 0.942, and 0.984 (Table 3), respectively, indicating that the ranking results from the four methods are highly consistent. There were no significant differences in the ranking results.

3.3.2. Combination Weighting Method

Compared to the potential bias introduced by using a single evaluation method, a strategy that integrates multiple methods helps ensure the objectivity and reliability of the final assessment results. The combination weighting method based on maximizing deviations was used to calculate the combination weight coefficients of the four evaluation methods [20]. The specific calculation formula is as follows:
θ j * = i = 1 m t = 1 m f i j f t j j = 1 n i = 1 m t = 1 m f i j f t j
where θ j * represents the combination weight coefficients of the j t h ( j = 1, 2, 3, 4) evaluation method. f i j and f t j denote the evaluation values of the i t h and t t h coastal city under the j t h evaluation method, respectively. Subsequently, the weighted evaluation values of the four evaluation methods were calculated to obtain the final comprehensive evaluation results. The calculation formulas are as follows:
e i = θ e 1 * e 1 i + θ e 2 * e 2 i + + θ e j * e j i
s i = θ s 1 * s 1 i + θ s 2 * s 2 i + + θ s j * s j i
a i = θ a 1 * a 1 i + θ a 2 * a 2 i + + θ a j * a j i
where e i , s i , and a i represent the final calculated values of the exposure index, sensitivity index, and adaptability index, respectively, for the i t h coastal city using the combination weighting method. θ e j * , θ s j * , and θ a j * denote the combination weight coefficients of the j t h ( j = 1, 2, 3, 4) evaluation method in calculating the exposure index, sensitivity index, and adaptability index, respectively. e j i , s j i , and a j i represent the exposure index value, sensitivity index value, and adaptability index value for the i t h coastal city calculated using the j t h evaluation method, respectively.
Finally, the vulnerability index values of 64 coastal city were calculated by combining the aforementioned three vulnerability elements according to Equation (1). These comprehensive assessment results obtained from the four evaluation methods can be considered as a reliable representation of vulnerability to storm surge disasters. To illustrate the spatial characteristics and patterns of vulnerability and its components, we classified the results into four categories (i.e., very high, high, low, and very low) using the Natural Break (Jenks) algorithm, which employs a statistical formula called Jenks’ optimization to identify breakpoints between categories. The Jenks algorithm is designed to minimize variability within categories while maximizing variability between categories, which facilitates the demonstration of spatial differences in vulnerability. Detailed assessment results are provided in Supplementary Table S2.
It is worth noting that the comprehensive assessment method proposed in this study actually presents a flexible and extensible framework for storm surge vulnerability assessment. It is not restricted to the currently selected indicators but allows for dynamic adjustment of indicators based on the specific needs and practical circumstances within the study area. This ensures the broad applicability of the framework and the scientific validity of the final evaluation results. For instance, when applying this assessment framework to countries in the African region, it may be necessary to exclude fisheries-related indicators. This is because aquaculture is not well developed in most African coastal countries and direct economic losses from storm surges are typically unrelated to fisheries.

3.4. Spatial Analysis of Vulnerability

We applied a spatial autocorrelation analysis to identify statistically significant spatial clustering of vulnerabilities, which can provide insights for prioritizing immediate or stepwise actions. The spatial autocorrelation analysis tests whether the same attributes are significantly correlated at adjacent spatial locations and can be categorized into the global spatial autocorrelation and the local spatial autocorrelation. The global spatial autocorrelation, commonly described by the Global Moran’s I index, is used to determine whether an attribute exhibits global spatial associations. The Global Moran’s I index ranges from −1 to 1, where positive and negative values indicate positive and negative spatial autocorrelation in the spatial distribution of the attribute, respectively [72,73]. The calculation formula for the Global Moran’s I index is as follows:
I = n i = 1 n j = 1 n W i j X i X ¯ X j X ¯ i = 1 n j = 1 n W i j i = 1 n X i X ¯ 2
where n represents the total number of coastal cities (64 in our study), i represents the candidate city for which I is calculated, and j represents different neighboring cities. X i and X j represent the vulnerability index values of coastal cities i and j , respectively. X ¯ represents the average of the vulnerability indices of all coastal cities, and W i j is the spatial weight matrix indicating the spatial relationship between the city i and city j . When city i and city j are spatially adjacent, W i j = 1 , otherwise, W i j = 0 .
The global spatial autocorrelation analysis is unable to provide information about the specific spatial location of clusters or anomalies. Therefore, it is necessary to employ the local Moran’s I index (i.e., local spatial autocorrelation analysis) to examine the correlation of vulnerability at some local spatial locations and identify significant spatial clusters and patterns [72,73]. The calculation formula for the local Moran’s I index is as follows:
I i = n X i X ¯ j = 1 n W i j X j X ¯ i = 1 n X i X ¯ 2
where n , X ¯ , X i , X j , and W i j are the same as in Equation (9). According to the calculation result of the local Moran’s I index, the spatial distribution of vulnerability indices can be classified into five types: “high-high” (HH) and “low-low” (LL) indicate the spatial clustering of similar values, demonstrating positive spatial autocorrelation; “high-low” (HL) and “low-high” (LH) can be described as spatial outliers, indicating negative spatial autocorrelation; and “not significant” denotes the absence of a significant spatial difference in the vulnerability index between a city and its surrounding cities.

4. Results

4.1. Spatial Characteristics of Vulnerability Elements
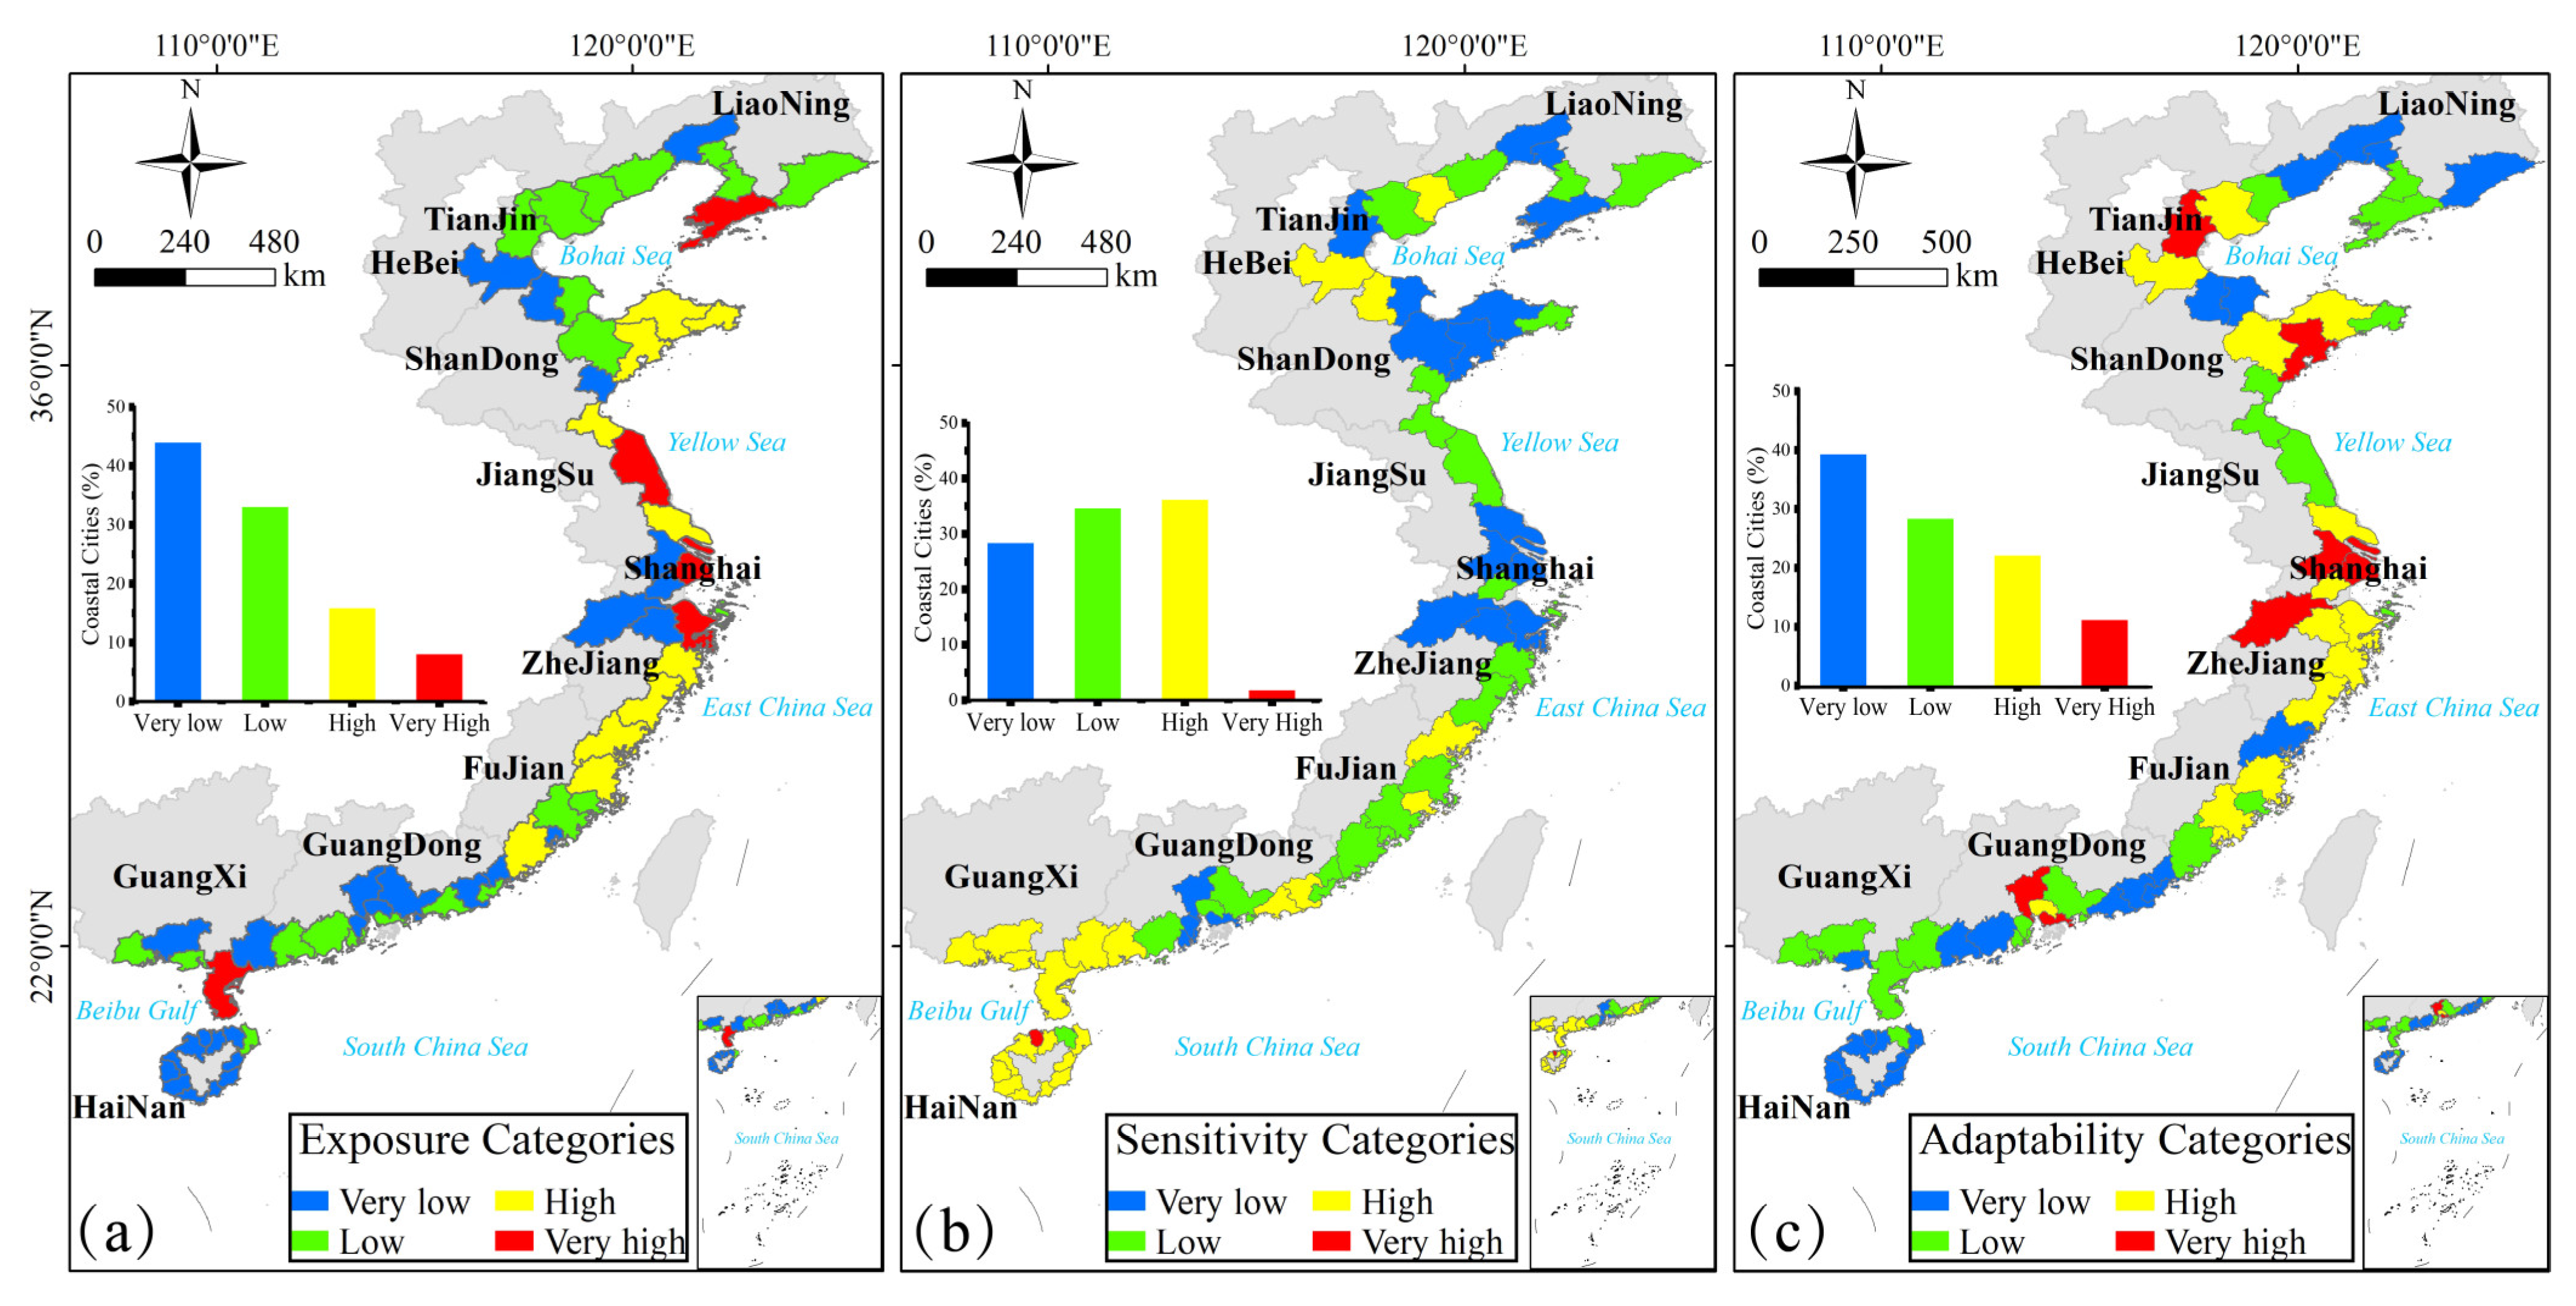
4.1.1. Exposure

In general, there are significant differences in the spatial characteristics of exposure, sensitivity, and adaptability. The assessment results of exposure (Figure 2a) reveal that approximately 77% of the coastal cities in mainland China fall into the categories of low and very low exposure. These cities are predominantly situated in the coastal areas of the Bohai Sea and the South China Sea. On the other hand, cities classified as being in the very high exposure category are mainly found in the Liaodong Peninsula, the Leizhou Peninsula and the Yangtze River Delta, including Dalian, Zhanjiang, Ningbo, and Shanghai. Cities in the high exposure category are concentrated in the Shandong Peninsula and the coastal region of Zhejiang and Fujian provinces. The unique geographical positioning of the peninsula region, surrounded by the sea on three sides, leads to coastal cities experiencing higher exposure to storm surges. In contrast, Hangzhou and Shaoxing in Zhejiang Province, as well as Guangzhou and Dongguan in Guangdong Province, all fall into the very low exposure category due to their short coastlines. Furthermore, nearly all coastal cities in Hainan Province are classified as very low exposure. This can be attributed to the prevalence of trees and shrubland with a low exposure in the coastal areas of Hainan Province, which accounts for more than 60% of the total area, while the impervious surface with a high exposure accounts for less than 11% of the total area.

4.1.2. Sensitivity

The assessment results of sensitivity (Figure 2b) show that nearly 40% of the cities fall into the very high and high sensitivity categories, mainly located in the southern coastal areas of China. All of the coastal cities around the Leizhou Peninsula are in the high sensitivity category, mainly due to the high percentage of the population with junior high school education or below, all of which are close to 80%. Nearly all coastal cities in Hainan Province also fall into the high sensitivity category. This is primarily due to the fact that the core areas of these cities are situated within 10 km from the coastline, characterized by remarkably high densities of critical transportation facilities. In addition, the city with the highest sensitivity index is Lingao County in Hainan Province, due to its high economic dependence on marine fisheries, which account for more than 60% of GDP. On the contrary, the coastal cities located in the Yangtze River Delta and Pearl River Delta economic circles have highly developed economies with a low ratio of fishery output to GDP. At the same time, economically developed cities attract large numbers of highly qualified people for employment, resulting in a generally high education level of the population. Therefore, the cities in these regions all belong to the very low and low sensitivity categories.

4.1.3. Adaptability

Regarding the assessment results of adaptability (Figure 2c), only 33% of the coastal cities fall into the very high and high adaptability categories, which are concentrated in economically developed regions such as the Yangtze River Delta, the Pearl River Delta, and the Bohai Economic Rim. Cities in these regions exhibit a robust capacity to withstand external disturbances because of the high proportion of artificial coastlines along their coastlines that conform to the high-tide protection standards. For example, Tianjin has a high proportion of 86% artificial coastlines. It is noteworthy that all coastal cities located in Hainan Province are in the very low adaptability category. Compared to other coastal provinces in China, Hainan Province is relatively backward in terms of economic development, and there is a large gap between its economic output and per capita income compared with coastal cities in other provinces. At the same time, government investment in disaster preparedness, including medical and health resources, is insufficient. The number of medical staff and health institutions is significantly inferior compared to coastal cities in other provinces. More importantly, Hainan Province is dominated by sandy coastlines and lacks protection from artificial coastlines or biogenic coastlines. Sandy coastlines are prone to severe erosion from storm surges. These are the main reasons for the poor adaptability of coastal cities in Hainan Province.

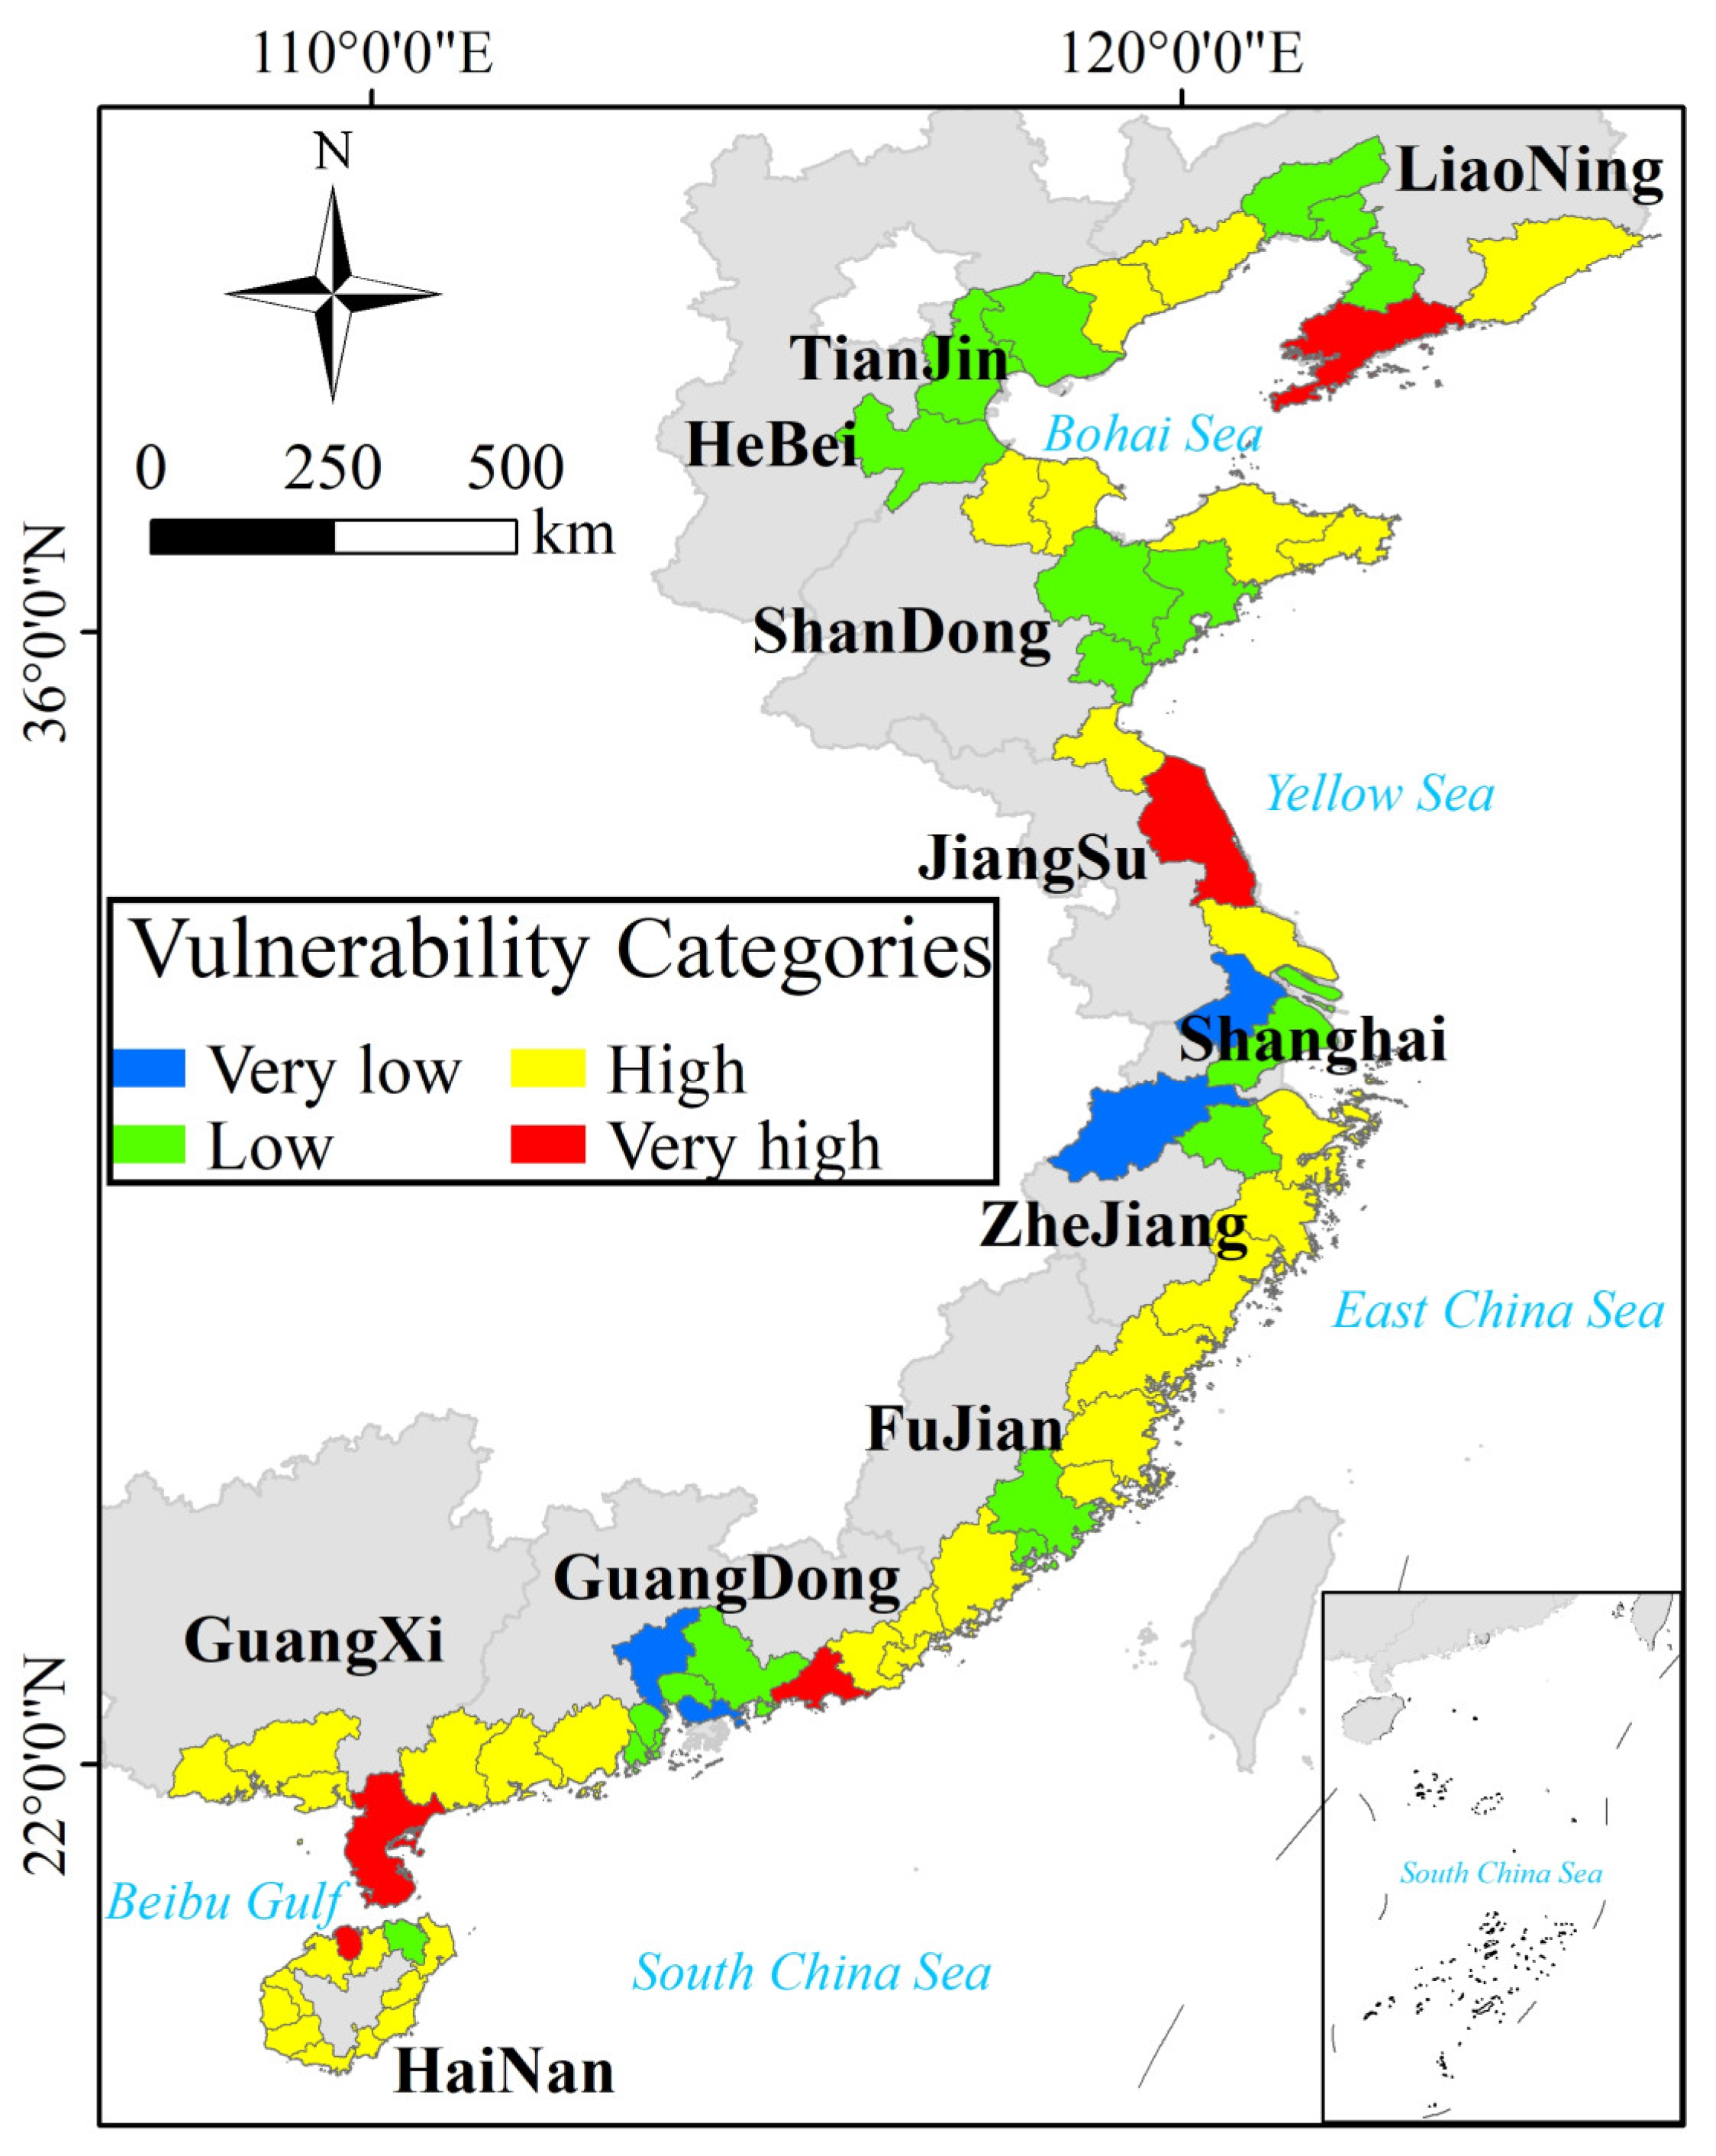
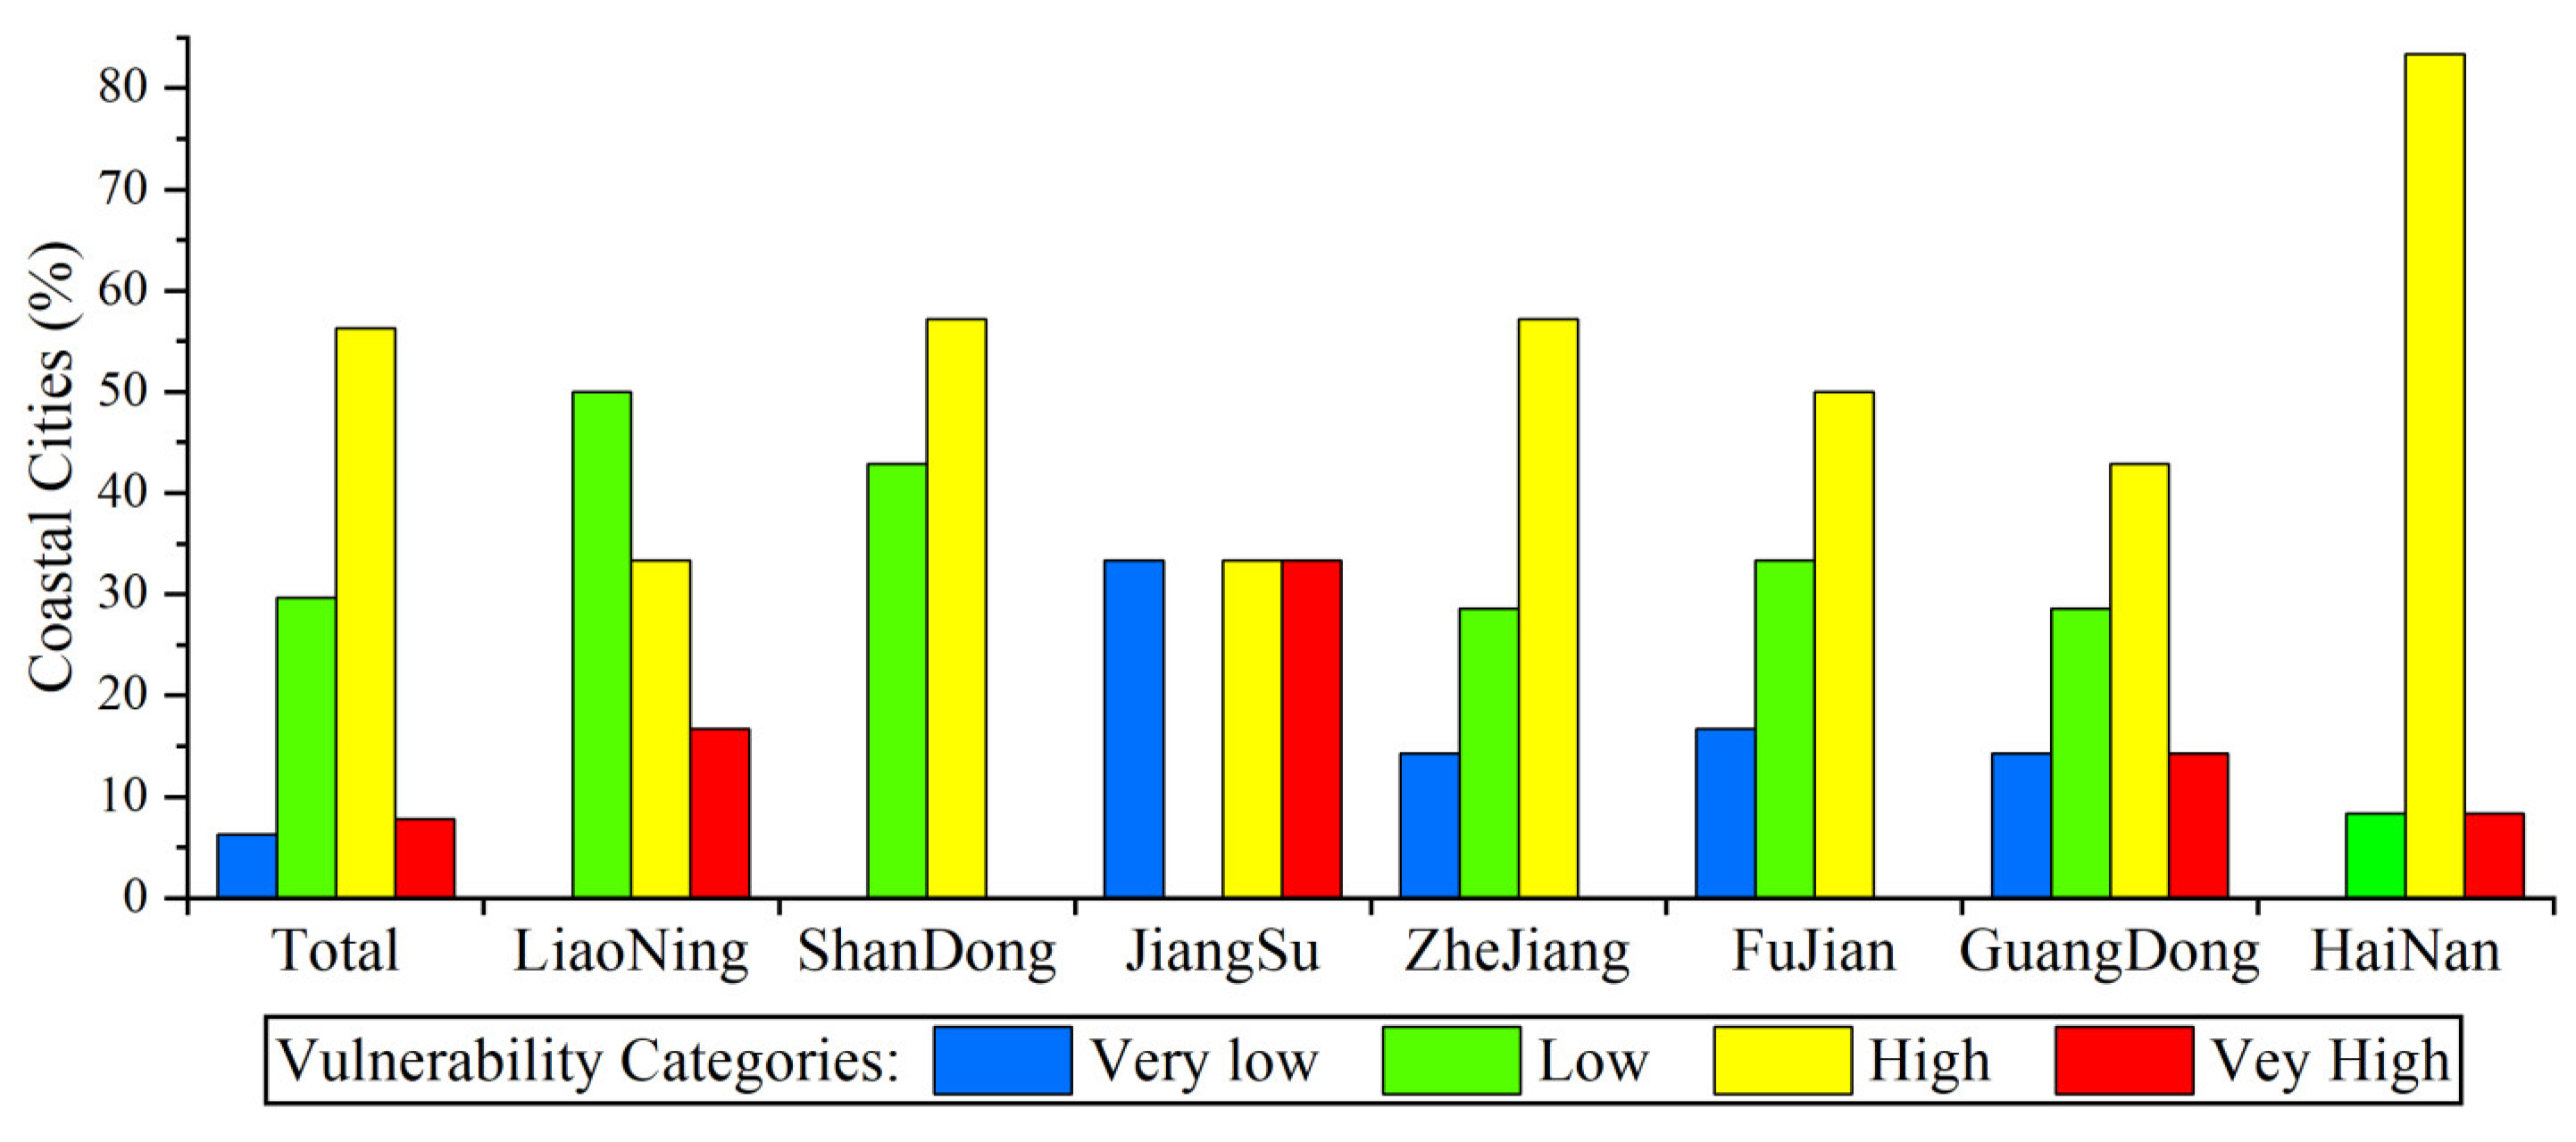
4.2. Spatial Characteristics of Vulnerability

The comprehensive assessment results of vulnerability to storm surges for 64 coastal cities in mainland China are presented in Figure 3. From a national perspective, the percentage of coastal cities belonging to the very high and very high vulnerability categories reached 64%. Among them, the five cities displaying the highest vulnerability are Zhanjiang, Lingao, Dalian, Yancheng, and Shanwei. Specifically, the primary reason for the high vulnerability of Zhanjiang and Dalian lies in their unique geographical locations. These peninsular cities, surrounded by the sea on three sides, experience the highest exposure. Similarly, Yancheng, located in the plains, has the longest coastline in Jiangsu Province, resulting in high exposure. Moreover, the coastlines of Yancheng predominantly comprise aquaculture dikes, resulting in weak protection against storm surges. Unlike the cities mentioned above, Lingao exhibits high vulnerability due to its strong economic dependence on fisheries and insufficient medical resources. Shanwei is characterized by a low GDP and an exceptionally high percentage of population with junior high school education or below (84%), which leads to a high sensitivity to storm surge disasters. Concurrently, the coastline of Shanwei predominantly comprises sandy coastlines and rocky coastlines, which are vulnerable to storm surge erosion.
From a provincial perspective (Figure 3 and Figure 4), Guangxi Province is the most vulnerable to storm surges compared to other provinces, with all of its coastal cities classified as being in the high vulnerability category. In contrast, all coastal cities in Hebei Province are classified as being in the low vulnerability categories. The second most vulnerable province is Hainan Province, with more than 90% of coastal cities falling into the very high and high vulnerability categories. Guangdong, Zhejiang, and Shandong all have 57% of coastal cities classified in the very high and high vulnerability categories. The percentages of coastal cities classified in the very low and low vulnerability categories are 50% for Fujian and Liaoning. In addition, Shanghai and Tianjin, the only two coastal municipalities in China, are both classified as the low vulnerability.

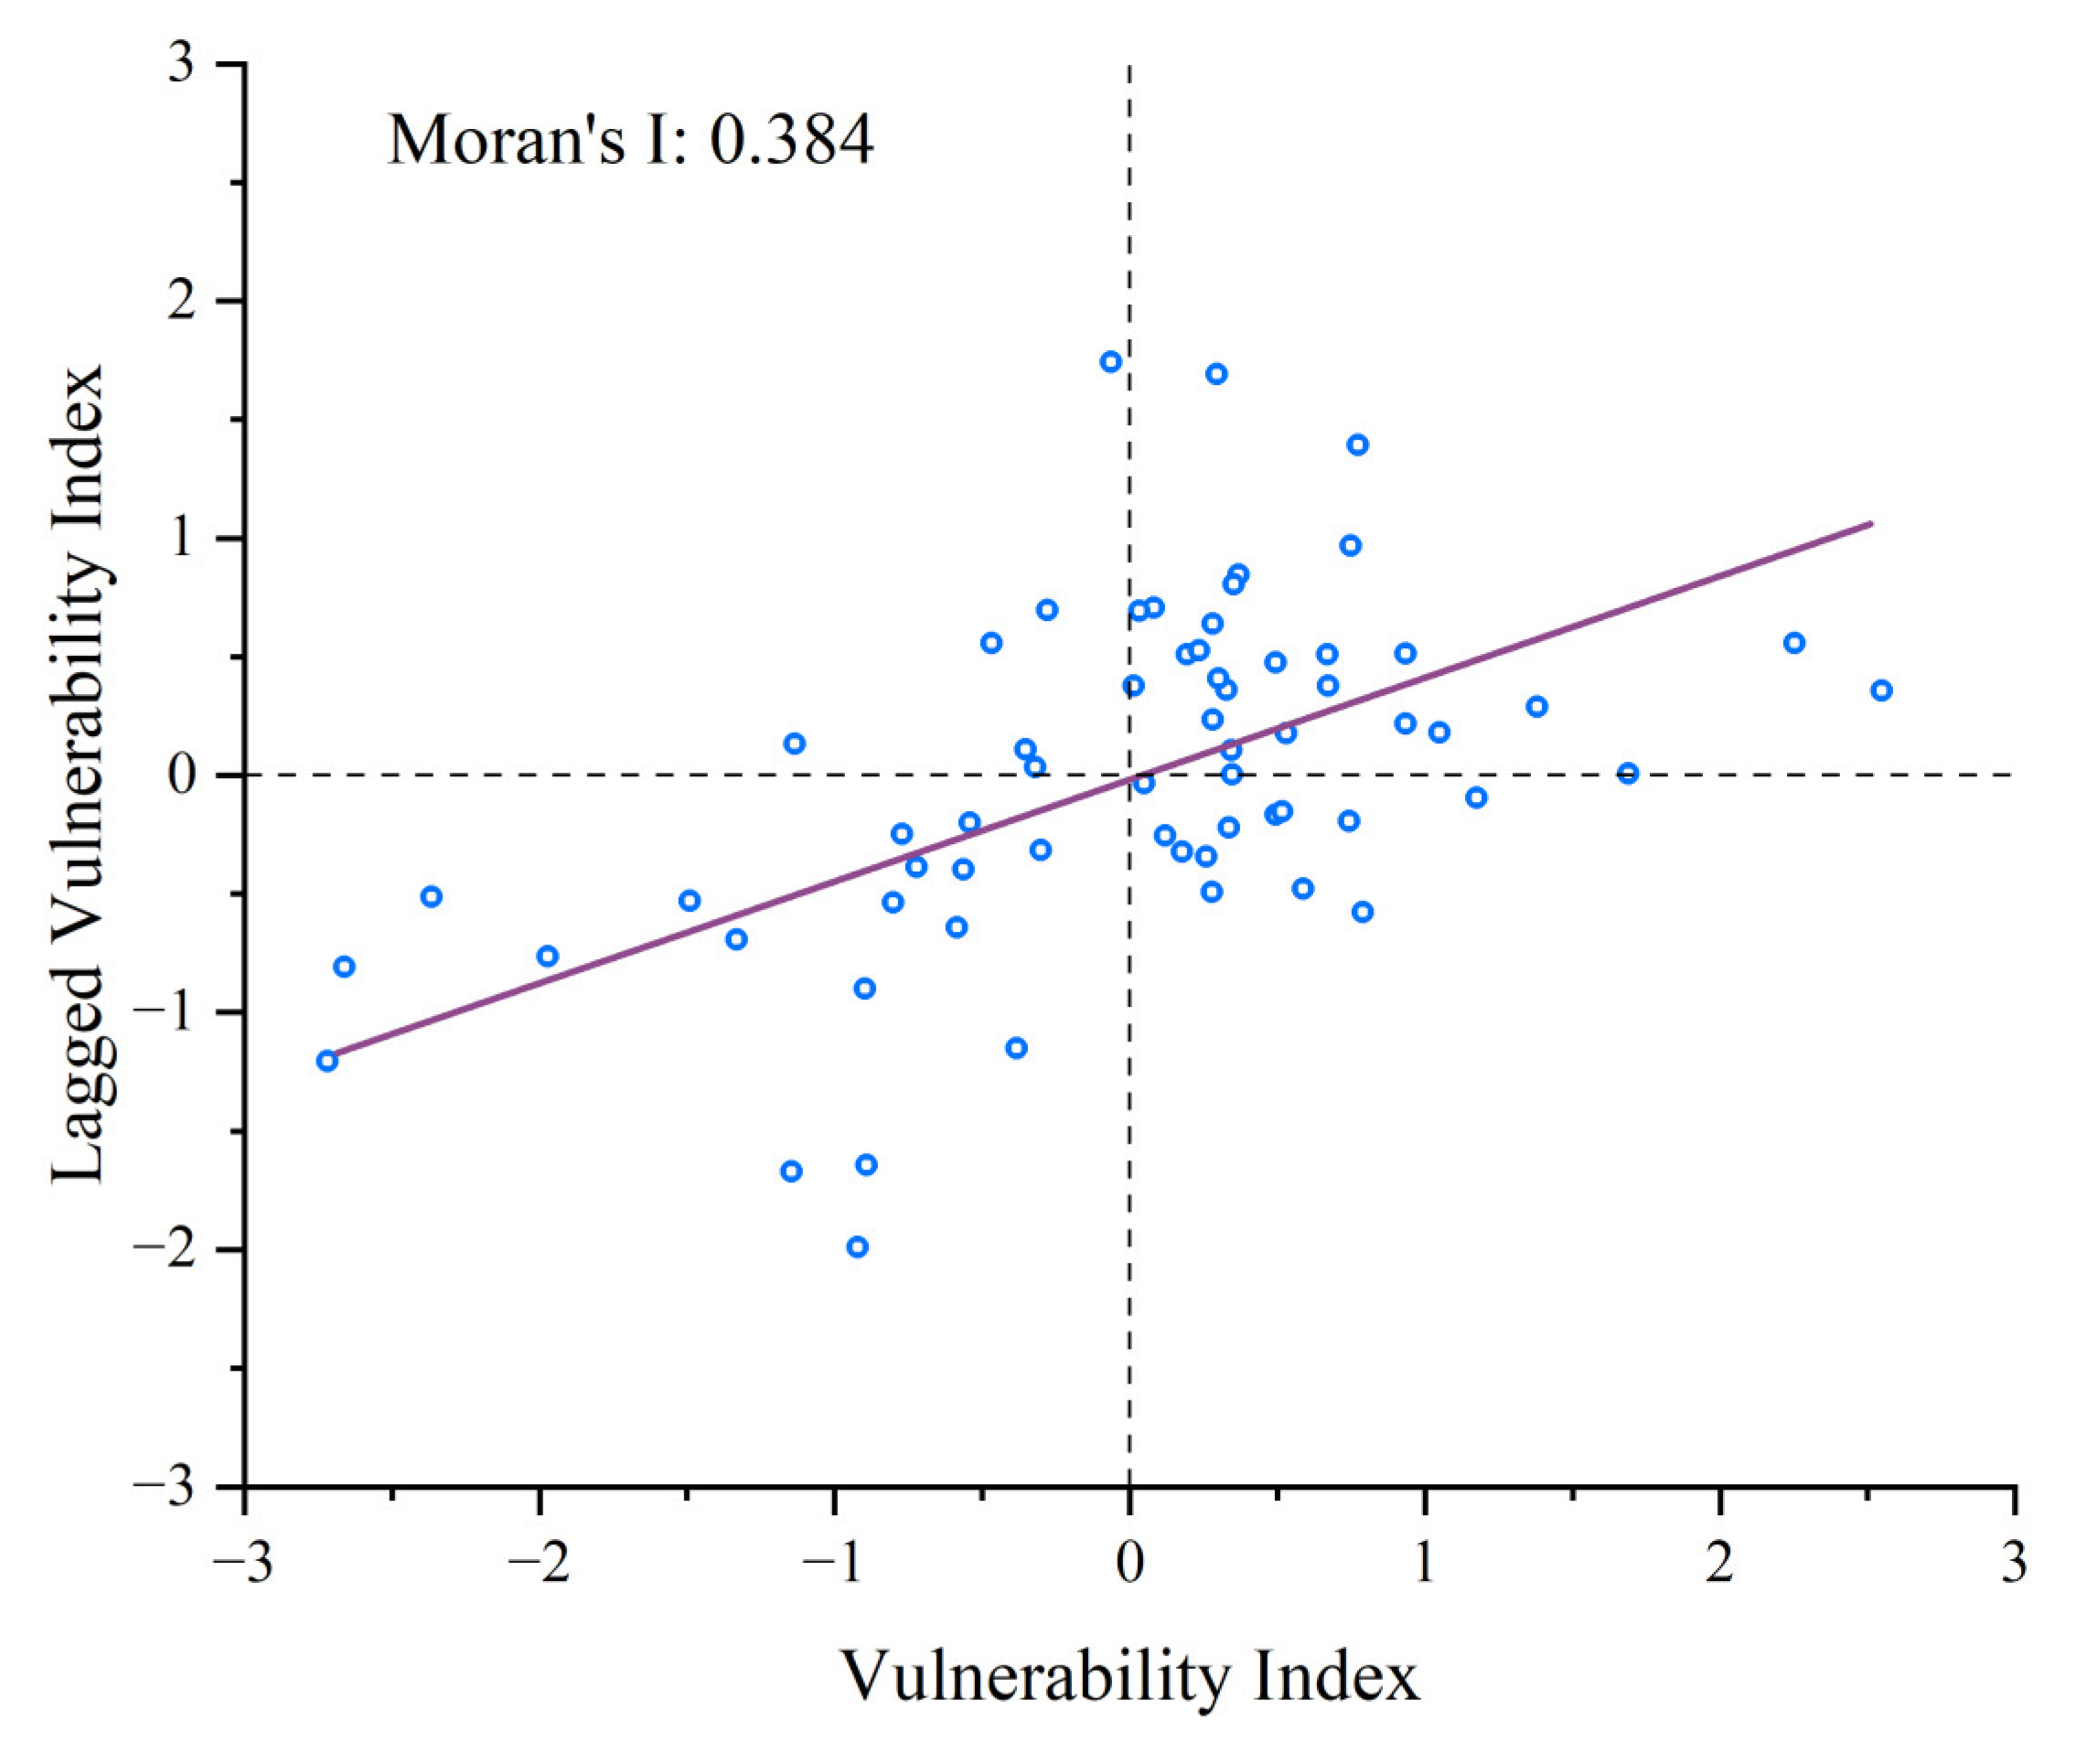
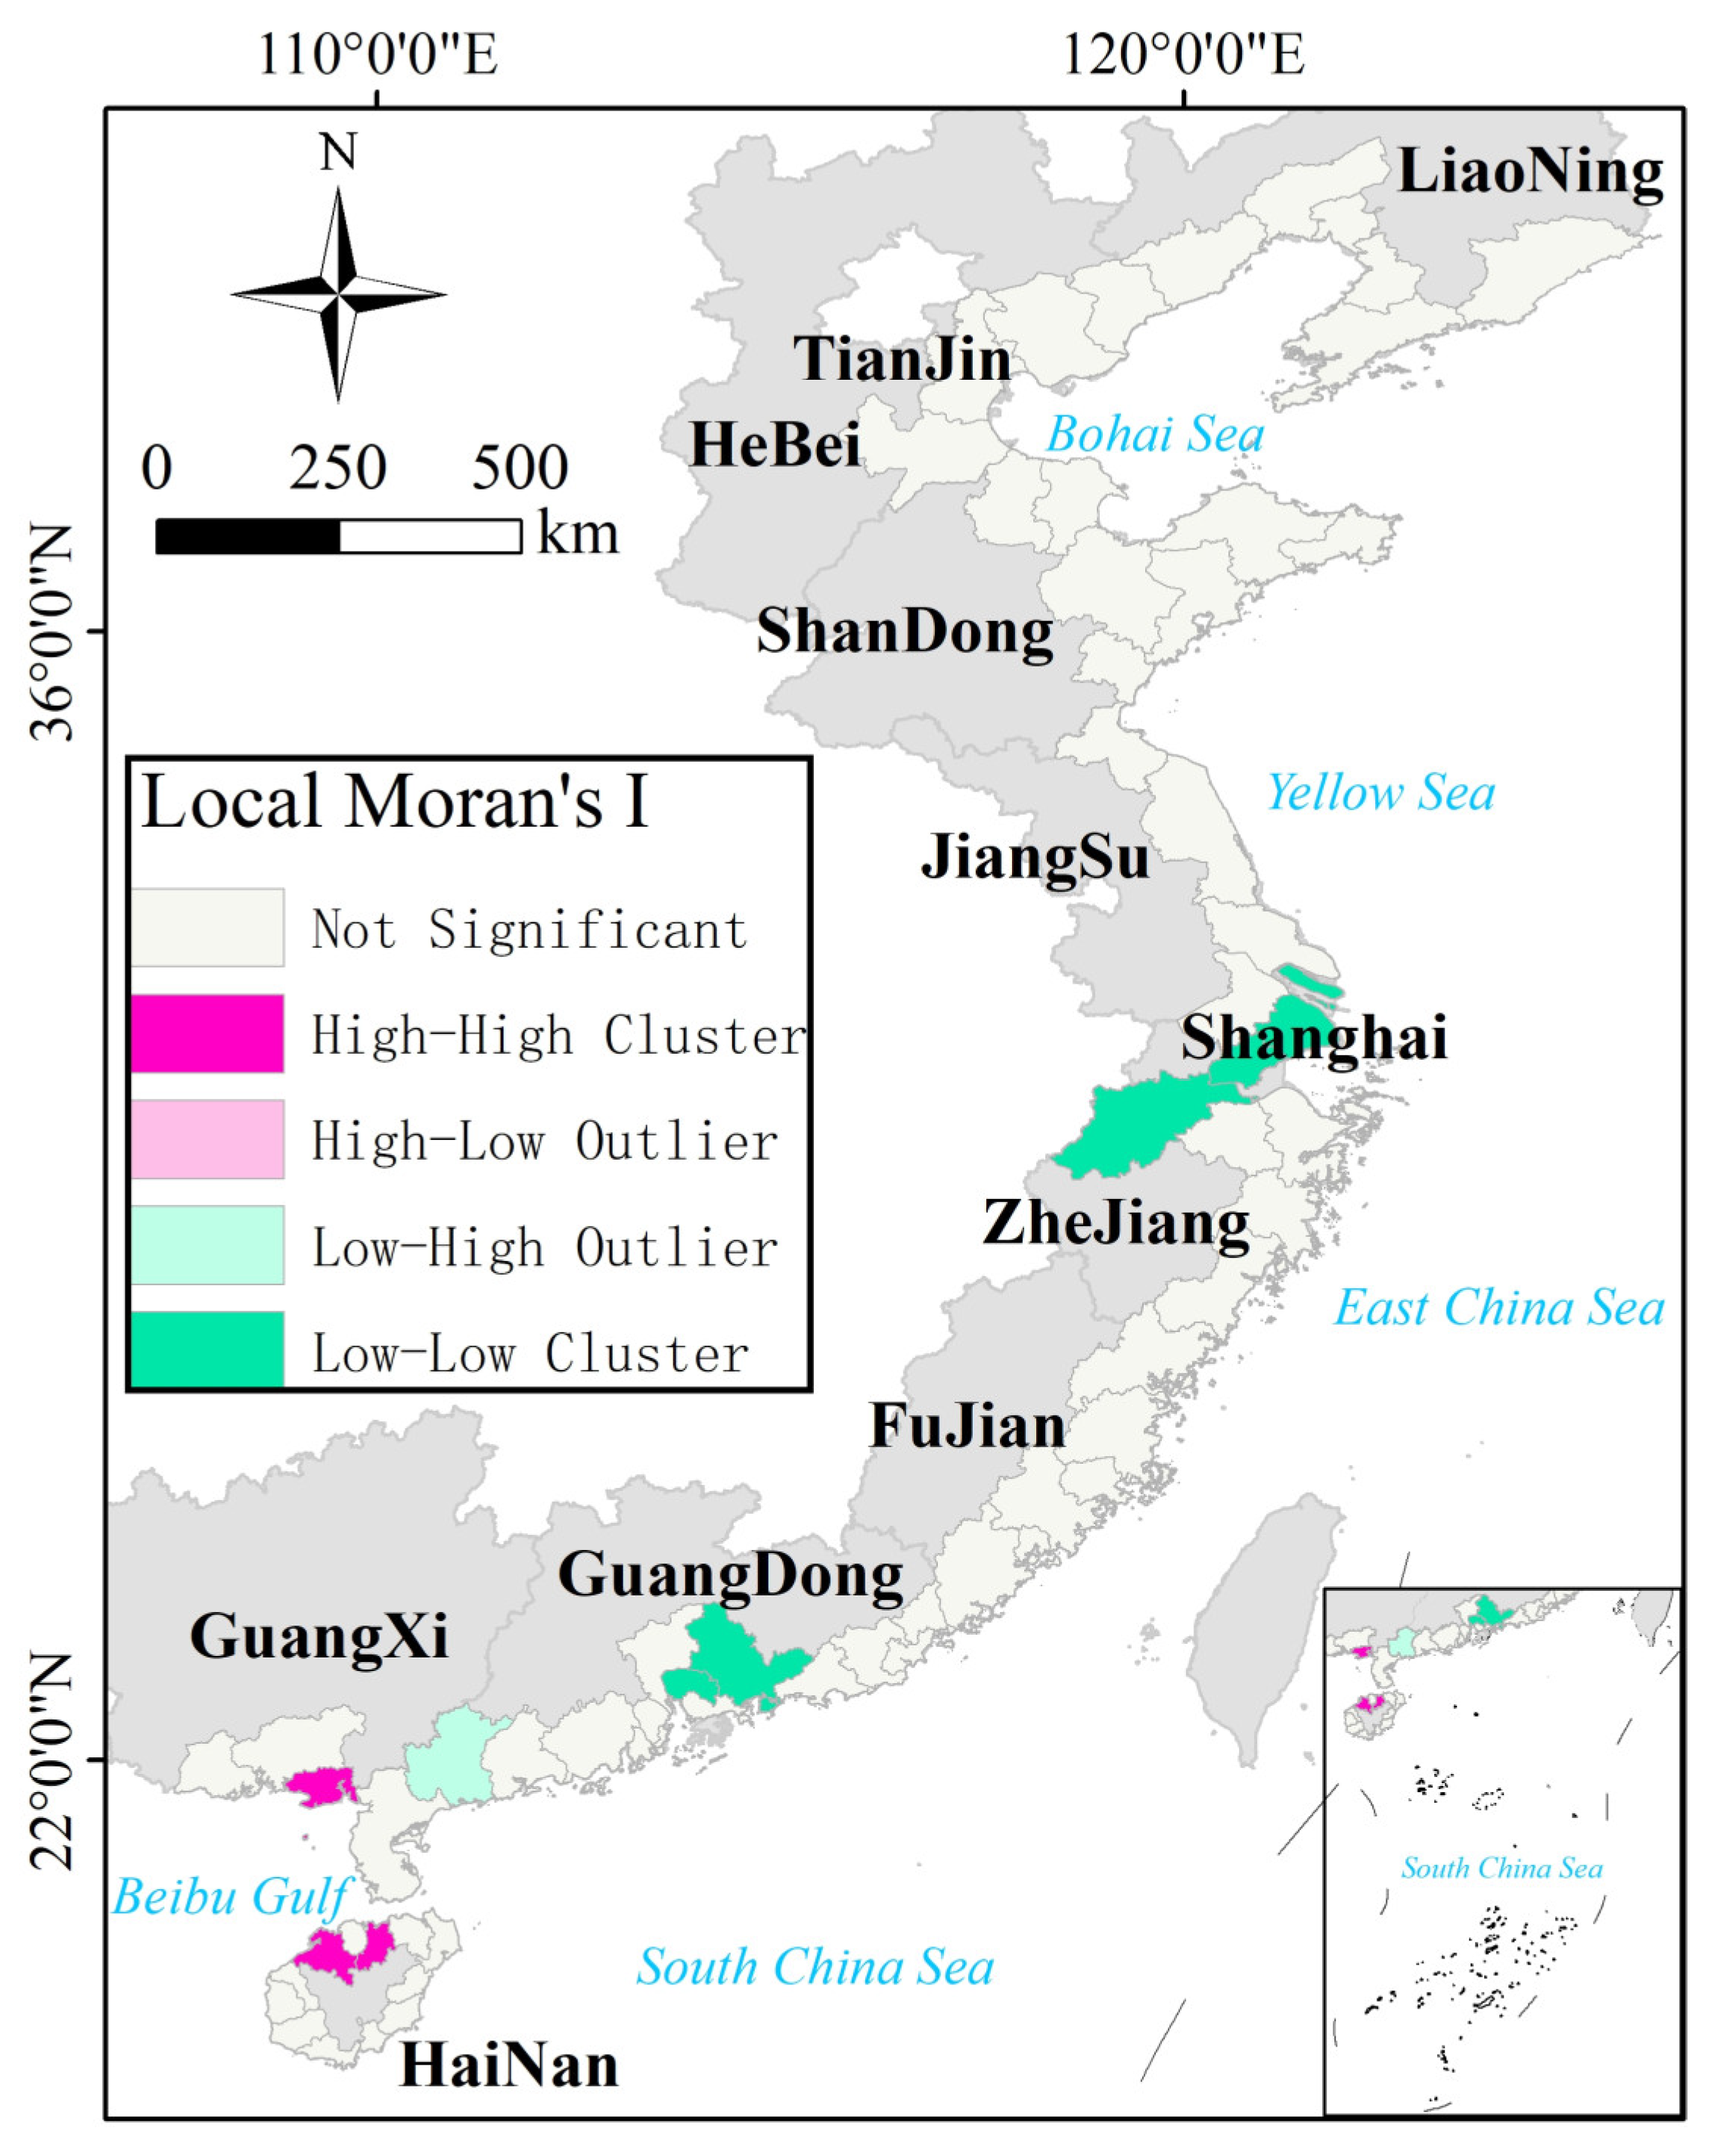
4.3. Global and Local Spatial Autocorrelation Analysis

The spatial autocorrelation statistical techniques can determine whether the vulnerability is statistically significant in spatial clustering, and the results are shown in Figure 5 and Figure 6. Firstly, the Global Moran’s I index is calculated to be 0.384 (z-score = 3.46, p-value = 0.001), indicating a significant positive spatial autocorrelation and spatial agglomeration of vulnerability among the 64 coastal cities analyzed. The Moran scatter plot, illustrated in Figure 5, reveals that most of the points are situated in the first and third quadrants, representing the aggregation of high vulnerability cities and low vulnerability cities, respectively. In other words, the vulnerability of most coastal cities is characterized by HH and LL aggregation. In addition, a small number of points are distributed in the second and fourth quadrants, signifying that cities with a low vulnerability are surrounded by cities with a high vulnerability, and cities with a high vulnerability are surrounded by cities with a low vulnerability, respectively. That is, these coastal cities exhibit a negative spatial correlation in terms of vulnerability.
The local spatial autocorrelation analysis (Figure 6) provides an intuitive representation of vulnerability clusters in cluster types of “HH”, “LL”, “HL”, and “LH”. Firstly, coastal cities situated in the Beibu Gulf are identified as an HH cluster of vulnerability, which corresponds to relatively higher vulnerability for these cities. Secondly, cities situated in the Yangtze River Delta (e.g., Shanghai, Jiaxing, and Hangzhou) and the Pearl River Delta (e.g., Huizhou, Shenzhen, Dongguan, and Guangzhou) are identified as LL vulnerability clusters. The Pearl River Delta and the Yangtze River Delta economic circles are the most economically, technologically, and culturally developed regions along the Chinese coast. Cities in these regions have developed in a resilient manner and are less vulnerable to storm surge disasters. In addition, there is an LH cluster centered on Maoming. That is, Maoming is surrounded by cities with a high vulnerability. Compared with neighboring cities, Maoming is characterized by low exposure due to its short coastline. At the same time, the relatively developed economy, especially the adequate medical resources, makes Maoming highly adaptable. Lastly, the remaining cities exhibit no significant agglomeration, and the spatial autocorrelation is insignificant, indicating that vulnerability is randomly distributed. Given that the results are the evidence-based vulnerability distributions of coastal cities in mainland China, it is essential to prioritize these identified cities with high vulnerability when conducting vulnerability reduction planning and management.

5. Discussion

5.1. Comparison with Previous Studies

Given that previous studies assessing vulnerability to storm surges along the coast of mainland China were primarily conducted at the provincial scale, it is not possible to directly compare their results with our findings at the prefecture-level city scale [39,74,75]. Storm surges are marine dynamic disasters mainly triggered by tropical or temperate cyclones. Therefore, we compared our findings with two studies conducted at the county scale, which focused on risk assessment for tropical storm surges and typhoons in coastal regions of China, respectively [28,76]. In both studies, the assessment of vulnerability was an integral component of the risk assessment.
In the risk assessment of tropical storm surges conducted by Gao et al. [28], Dalian, Tianjin, Shantou, Fangchenggang, and Wenchang were identified as the cities with the highest vulnerability along the Chinese coast. This generally aligns with our findings, except for Tianjin, which was classified in the very low vulnerability category in our study. First, the relative consistency of the results can be attributed to the similarity of the vulnerability assessment models employed. The vulnerability assessment model used by Gao et al. is a function composed of the socioeconomic index, land use index, ecological environment index, and resilience index, which essentially correspond to the components of the model we employed. Specifically, the socioeconomic index and resilience index can be equated to the sensitivity index and adaptability index, respectively, while the land use index and the ecological index can be equated to the exposure index. The significant discrepancies in the evaluation results for Tianjin may be due to differences in the data collection timing. Gao et al. primarily used data from the 6th National Census and the 2010 statistical yearbook, whereas we utilized data from the latest 7th National Census and the 2020 statistical yearbook. Taking two specific indicators as an example, Tianjin’s GDP and per capita income in 2020 increased by 55% and 81%, respectively, compared to 2010, reaching CNY 14,083.73 billion and CNY 43,854. However, Dalian, also located in the Bohai Sea Rim, only experienced a 36% GDP increase to CNY 7030.4 billionduring the same period. Tianjin is not only the largest coastal open city in northern China, but also the economic center of the Bohai Rim. The considerable improvement of the economic level may indirectly increase the government’s investment in disaster prevention and mitigation, thereby enhancing the city’s adaptability and reducing its vulnerability to storm surges.
In the risk assessment of typhoons conducted by Xu et al. [76], cities located in the Yangtze River Delta and Pearl River Delta were identified as having the highest vulnerability, which is in direct contrast to our results. The main reason for such a significant discrepancy may be attributed to the different definitions of the concept of vulnerability. In Xu et al.’s study, vulnerability was defined as the susceptibility of elements exposed to hazards, and the vulnerability index, which included four elements (population density, GDP, road network, and land use), was adopted as the assessment model. In this assessment model, the vulnerability index of a city increased with its level of economic development. However, this model overlooks the cities’ ability to cope with disasters, i.e., adaptability. For instance, some cities in certain geographic locations may be highly susceptible to disasters but also exhibit a remarkable adaptability simultaneously. This adaptability can minimize the impact of disasters on cities and shorten their recovery time. Therefore, it is imperative to integrate adaptability into the assessment model to provide a more comprehensive understanding of a city’s vulnerability. On the other hand, although storm surges can be triggered by typhoons, they differ fundamentally in nature. Storm surges belong to marine dynamic disasters, while typhoons belong to meteorological disasters. Consequently, considering the actual impact extent of the storm surges, the extent we confined during the calculation of critical transportation facilities density was 10 km from the coastline. In contrast, the calculation of a similar indicator (i.e., the density of road networks) by Xu et al. considered the entire city as the impact range for typhoons. This discrepancy may be another important reason for the difference in evaluation results.

5.2. Implications for Policy Making

This study provides important information for the development of disaster reduction policies at the provincial level, as well as focus for action at the local level (prefecture-level city scale), by identifying the spatial distribution of vulnerability, statistically significant clusters of high vulnerability, and reporting the top vulnerability cities. First, the vulnerability assessment results presented in this study can directly assist decision-makers in prioritizing cities for location-specific interventions, thereby facilitating the implementation of sustainable development strategies in coastal areas. In particular, for cities with a high vulnerability, provincial governments should increase their policy inclination accordingly. At the same time, given that vulnerability is the consequence of complex interactions between natural ecosystems and socio-economic environments, prefectural governments should adjust the investment scale and structure, improve land use planning, strengthen defense systems against storm surges, and increase investment in disaster prevention and mitigation (e.g., reforestation of mangroves, construction of sea walls, protection and restoration of natural coastal habitats, and increasing the number of shelters and health facilities), which substantially contribute to reducing disaster losses and vulnerability levels of cities [2,27]. Finally, the results of the local spatial autocorrelation analysis indicate significant clustering of cities with high vulnerability, such as the Beibu Gulf urban agglomeration, including Beihai in Guangxi Province, Zhanjiang in Guangdong Province, Lingao in Hainan Province, and others. Given the long-standing fragmentation of China’s emergency management organizations, the synergistic emergency efficiency among these cities, which are administered separately by different provinces, may be relatively poor [74]. Therefore, it is necessary to promote inter-city communication and cooperation and develop scientific collaborative emergency response measures. For example, establishing inter-city emergency linkage mechanisms and emergency command systems, organizing joint city emergency drills, and enhancing public awareness of marine disaster prevention and mitigation.

5.3. Uncertainties and Limitations

Although we used the best available data to assess the vulnerability of coastal cities to storm surges, we should acknowledge several limitations of this study. China is one of the countries with the longest coastlines in the world, and acquiring high-quality data at the local level for each indicator is challenging. First, a reliable vulnerability assessment requires high-resolution topographic data. However, we used a 30 m resolution DEM to extract elevation and slope, which is still not precise enough and may affect the assessment results. In addition, the overall classification accuracy of the land cover product is only 74%, and excessive classification errors can lead to uncertainty in the exposure evaluation [77,78,79]. Moreover, owing to the coarse classification system of the 10m resolution land cover product, we cannot distinguish different types of disaster-bearing bodies in detail, while a high-resolution image-based land cover product could perform better. For instance, residential land and transportation land are both impervious surfaces, but residential land generally has a higher exposure to storm surges [21,29]. Second, the indicator system of sensitivity and adaptability was established based on the literature review and data availability. However, there is an absence of more detailed indicators on artificial coastlines, particularly concerning the tide protection standards of the dikes. Given that artificial coastlines within each city are constructed with varying tidal protection standards, their ability to withstand storm surges varies accordingly. Presently, significant disparities in tide protection standards for artificial dikes exist among various coastal cities in China. For example, while the tide protection standard for artificial dikes in Shanghai is designed to withstand against a storm surge occurring once in a hundred years, the tide protection standard for artificial dikes in the majority of other cities are designed to withstand a storm surge occurring once in twenty years [80]. Finally, coastal cities may face more severe compound flooding under storm surges and rainfall [81,82]. Although this study quantifies the exposure of disaster-bearing bodies to surges and rainfall in terms of environmental factors, relevant indicators of a city’s drainage capacity (e.g., drainage pipe network density) are also very important. This limits a sound analysis of a city’s adaptability to storm surges. Therefore, future work will involve revising and further improving the established evaluation indicator system.

6. Conclusions

With the rapid development and continued concentration of populations in coastal areas, the vulnerability of coastal cities to marine dynamics disasters such as storm surges is increasing, posing a critical challenge to sustainable development. This study pioneers in producing the first comprehensive assessment of vulnerability to storm surges for China’s coastal areas from the perspective of prefecture-level cities. The three components of vulnerability were integrated to construct a vulnerability index that provides a comprehensive characterization of the multidimensional structure of vulnerability. Additionally, we quantified the effect of environmental factors on the exposure of disaster-bearing bodies to storm surges at the patch scale. Finally, the degree of vulnerability to storm surges for 64 coastal cities was evaluated based on the weight combination strategy, which combines the advantages of multiple evaluation methods. Furthermore, we explored the profile of vulnerability of Chinese coastal areas to storm surges and analyzed the spatial variation of vulnerability using spatial autocorrelation statistical techniques.
The assessment results indicate that 64% of coastal cities are classified into the very high and high vulnerability categories. Among them, the cities with the highest level of vulnerability are Zhanjiang, Lingao, Dalian, Yancheng, and Shanwei. Additionally, the distribution of vulnerability in coastal cities of mainland China exhibits statistically significant spatial heterogeneity. Coastal cities located in the Yangtze River Delta and the Pearl River Delta are identified as LL vulnerability clusters, while coastal cities located in the Beibu Gulf are identified as HH vulnerability clusters that must be prioritized for immediate actions related to vulnerability reduction. Since planning for the mitigation of storm surges is a continuous and ongoing process, vulnerability assessments should be priority work undertaken among the coping strategies to be decided. Despite the limitations, the vulnerability assessment results generated in this study can still provide an important reference for the development and application of effective policies and measures for reducing the impact of storm surges in the coastal areas of mainland China.

Supplementary Materials

The following supporting information can be downloaded at: https://zenodo.org/record/8241621, Table S1: Detailed data for the 15 indicators used to calculate the vulnerability index; Table S2: Detailed assessment results of vulnerability and its elements based on the combination weighting method.

Author Contributions

Conceptualization, X.L. and X.Y.; methodology, X.L. and Y.L.; formal analysis, X.L., X.Z. and Y.L.; resources, X.Y.; data curation, X.Z. and D.M.; writing—original draft preparation, X.L.; writing—review and editing, Y.L., Z.W. and X.Y.; funding acquisition, X.Y. All authors have read and agreed to the published version of the manuscript.

Funding

This research was funded by the Earth Big Data Science Project of CAS [grant number XDA19060202], and the Key Project of Innovation LREIS [grant number KPI001].

Data Availability Statement

The census and socio-economic statistics presented in this paper can be downloaded from https://doi.org/10.5281/zenodo.8241621 (accessed on 12 August 2023).

Acknowledgments

The authors sincerely acknowledge the European Space Agency for the provision of open access land cover data.

Conflicts of Interest

The authors declare no conflict of interest.

References

  1. Hu, P.; Liu, Y.; Hou, Y. Studies on marine dynamic disasters. J. Oceanol. Limnol. 2019, 37, 1791–1794. [Google Scholar] [CrossRef]
  2. Fang, J.; Sun, S.; Shi, P.; Wang, J.A. Assessment and Mapping of Potential Storm Surge Impacts on Global Population and Economy. Int. J. Disaster Risk Sci. 2014, 5, 323–331. [Google Scholar] [CrossRef]
  3. Needham, H.F.; Keim, B.D.; Sathiaraj, D. A review of tropical cyclone-generated storm surges: Global data sources, observations, and impacts. Rev. Geophys. 2015, 53, 545–591. [Google Scholar] [CrossRef]
  4. Yi, X.; Sheng, K.; Wang, Y.; Wang, S. Can economic development alleviate storm surge disaster losses in coastal areas of China? Mar. Policy 2021, 129, 104531. [Google Scholar] [CrossRef]
  5. Shi, X.; Liu, S.; Yang, S.; Liu, Q.; Tan, J.; Guo, Z. Spatial–temporal distribution of storm surge damage in the coastal areas of China. Nat. Hazards 2015, 79, 237–247. [Google Scholar] [CrossRef]
  6. Wang, Y.; Liu, J.; Du, X.; Liu, Q.; Liu, X. Temporal-spatial characteristics of storm surges and rough seas in coastal areas of Mainland China from 2000 to 2019. Nat. Hazards 2021, 107, 1273–1285. [Google Scholar] [CrossRef]
  7. Ministry of Natural Resources of the People’s Republic of China. Bulletin of China Marine Disaster (1990–2020); Ministry of Natural Resources of the People’s Republic of China: Beijing, China, 2020.
  8. China National Commission for Disaster Reduction. 14th Five-Year Plan for National Comprehensive Disaster Prevention and Reduction; China National Commission for Disaster Reduction: Beijing, China, 2022. [Google Scholar]
  9. Fekete, A. Spatial disaster vulnerability and risk assessments: Challenges in their quality and acceptance. Nat. Hazards 2012, 61, 1161–1178. [Google Scholar] [CrossRef]
  10. Du, Y.; Ding, Y.; Li, Z.; Cao, G. The role of hazard vulnerability assessments in disaster preparedness and prevention in China. Mil. Med. Res. 2015, 2, 27. [Google Scholar] [CrossRef]
  11. de Chazal, J.; Quétier, F.; Lavorel, S.; Van Doorn, A. Including multiple differing stakeholder values into vulnerability assessments of socio-ecological systems. Glob. Environ. Chang. 2008, 18, 508–520. [Google Scholar] [CrossRef]
  12. Hufschmidt, G. A comparative analysis of several vulnerability concepts. Nat. Hazards 2011, 58, 621–643. [Google Scholar] [CrossRef]
  13. Huang, Y.; Li, F.; Bai, X.; Cui, S. Comparing vulnerability of coastal communities to land use change: Analytical framework and a case study in China. Environ. Sci. Policy 2012, 23, 133–143. [Google Scholar] [CrossRef]
  14. Bevacqua, A.; Yu, D.; Zhang, Y. Coastal vulnerability: Evolving concepts in understanding vulnerable people and places. Environ. Sci. Policy 2018, 82, 19–29. [Google Scholar] [CrossRef]
  15. Diaz-Sarachaga, J.M.; Jato-Espino, D. Analysis of vulnerability assessment frameworks and methodologies in urban areas. Nat. Hazards 2020, 100, 437–457. [Google Scholar] [CrossRef]
  16. IPCC. Climate Change 2001: Impacts, Adaptation, and Vulnerability Contribution of Working Group II to the Third Assessment Report of the Intergovernmental Panel on Climate Change; Cambridge University Press: Cambridge, UK, 2001. [Google Scholar]
  17. IPCC. Climate Change 2007: Impacts, Adaptation and Vulnerability: Contribution of Working Group II to the Fourth Assessment Report of the Intergovernmental Panel on Climate Change; Cambridge University Press: Cambridge, UK, 2007. [Google Scholar]
  18. Estoque, R.C.; Ishtiaque, A.; Parajuli, J.; Athukorala, D.; Rabby, Y.W.; Ooba, M. Has the IPCC’s revised vulnerability concept been well adopted? Ambio 2023, 52, 376–389. [Google Scholar] [CrossRef]
  19. Mahapatra, M.; Ratheesh, R.; Rajawat, A.S. Storm surge vulnerability assessment of Saurashtra coast, Gujarat, using GIS techniques. Nat. Hazards 2017, 86, 821–831. [Google Scholar] [CrossRef]
  20. Yu, H.; Shen, Y.; Kelly, R.M.; Qi, X.; Wu, K.; Li, S.; Yu, H.; Bao, X. Trends in social vulnerability to storm surges in Shenzhen, China. Nat. Hazards Earth Syst. Sci. 2020, 20, 2447–2462. [Google Scholar] [CrossRef]
  21. Liu, Y.; Lu, C.; Yang, X.; Wang, Z.; Liu, B. Fine-Scale Coastal Storm Surge Disaster Vulnerability and Risk Assessment Model: A Case Study of Laizhou Bay, China. Remote Sens. 2020, 12, 1301. [Google Scholar] [CrossRef]
  22. Zhu, J.; Lu, Y.; Ren, F.; McBride, J.L.; Ye, L. Typhoon disaster risk zoning for China’s coastal area. Front. Earth Sci. 2021, 16, 291–303. [Google Scholar] [CrossRef]
  23. Arun Kumar, A.; Kunte, P.D. Coastal vulnerability assessment for Chennai, east coast of India using geospatial techniques. Nat. Hazards 2012, 64, 853–872. [Google Scholar] [CrossRef]
  24. Zhang, Y.; Ruckelshaus, M.; Arkema, K.K.; Han, B.; Lu, F.; Zheng, H.; Ouyang, Z. Synthetic vulnerability assessment to inform climate-change adaptation along an urbanized coast of Shenzhen, China. J. Environ. Manag. 2020, 255, 109915. [Google Scholar] [CrossRef]
  25. Roukounis, C.N.; Tsihrintzis, V.A. Indices of Coastal Vulnerability to Climate Change: A Review. Environ. Process. 2022, 9, 29. [Google Scholar] [CrossRef]
  26. Ballesteros, C.; Esteves, L.S. Integrated Assessment of Coastal Exposure and Social Vulnerability to Coastal Hazards in East Africa. Estuaries Coasts 2021, 44, 2056–2072. [Google Scholar] [CrossRef] [PubMed]
  27. Sajjad, M.; Li, Y.; Tang, Z.; Cao, L.; Liu, X. Assessing Hazard Vulnerability, Habitat Conservation, and Restoration for the Enhancement of Mainland China’s Coastal Resilience. Earth’s Future 2018, 6, 326–338. [Google Scholar] [CrossRef]
  28. Gao, Y.; Wang, H.; Liu, G.M.; Sun, X.Y.; Fei, X.Y.; Wang, P.T.; Lv, T.T.; Xue, Z.S.; He, Y.W. Risk assessment of tropical storm surges for coastal regions of China. J. Geophys. Res. Atmos. 2014, 119, 5364–5374. [Google Scholar] [CrossRef]
  29. Liu, Q.; Ruan, C.; Zhong, S.; Li, J.; Yin, Z.; Lian, X. Risk assessment of storm surge disaster based on numerical models and remote sensing. Int. J. Appl. Earth Obs. Geoinf. 2018, 68, 20–30. [Google Scholar] [CrossRef]
  30. Xianwu, S.; Jufei, Q.; Bingrui, C.; Xiaojie, Z.; Haoshuang, G.; Jun, W.; Zhuyuan, B. Storm surge risk assessment method for a coastal county in China: Case study of Jinshan District, Shanghai. Stoch. Environ. Res. Risk Assess. 2020, 34, 627–640. [Google Scholar] [CrossRef]
  31. Wang, Y.; Guo, Z.; Zheng, S.; Zhang, M.; Shu, X.; Luo, J.; Qiu, L.; Gao, T. Risk assessment for typhoon-induced storm surges in Wenchang, Hainan Island of China. Geomat. Nat. Hazards Risk 2021, 12, 880–899. [Google Scholar] [CrossRef]
  32. Wang, S.; Mu, L.; Qin, H.; Wang, L.; Yao, Z.; Zhao, E. The utilization of physically based models and GIS techniques for comprehensive risk assessment of storm surge: A case study of Huizhou. Front. Mar. Sci. 2022, 9, 939380. [Google Scholar] [CrossRef]
  33. Paprotny, D.; Terefenko, P. New estimates of potential impacts of sea level rise and coastal floods in Poland. Nat. Hazards 2017, 85, 1249–1277. [Google Scholar] [CrossRef]
  34. Li, K.; Li, G.S. Vulnerability assessment of storm surges in the coastal area of Guangdong Province. Nat. Hazards Earth Syst. Sci. 2011, 11, 2003–2010. [Google Scholar] [CrossRef]
  35. Zhang, Y.; Guo, J.; Che, Z. Discussion on evaluating the vulnerability of storm surge hazard bearing bodies in the coastal areas of Wenzhou. Front. Earth Sci. 2015, 9, 300–307. [Google Scholar] [CrossRef]
  36. Yan, B.; Li, S.; Wang, J.; Ge, Z.; Zhang, L. Socio-economic vulnerability of the megacity of Shanghai (China) to sea-level rise and associated storm surges. Reg. Environ. Chang. 2016, 16, 1443–1456. [Google Scholar] [CrossRef]
  37. Liu, J.; Gong, J.-H.; Liang, J.-M.; Li, Y.; Kang, L.-C.; Song, L.-L.; Shi, S.-X. A quantitative method for storm surge vulnerability assessment—a case study of Weihai city. Int. J. Digit. Earth 2017, 10, 539–559. [Google Scholar] [CrossRef]
  38. Huang, X.; Jin, H.; Bai, H. Vulnerability assessment of China’s coastal cities based on DEA cross-efficiency model. Int. J. Disaster Risk Reduct. 2019, 36, 101091. [Google Scholar] [CrossRef]
  39. Yuan, S.; Guo, J.; Zhao, X. Integrated Weighting Technique for Coastal Vulnerability to Storm Surges. J. Coast. Res. 2017, 80, 6–12, 17. [Google Scholar] [CrossRef]
  40. Sajjad, M.; Chan, J.C.L. Risk assessment for the sustainability of coastal communities: A preliminary study. Sci. Total Environ. 2019, 671, 339–350. [Google Scholar] [CrossRef]
  41. Sajjad, M.; Chan, J.C.L.; Kanwal, S. Integrating spatial statistics tools for coastal risk management: A case-study of typhoon risk in mainland China. Ocean Coast. Manag. 2020, 184, 105018. [Google Scholar] [CrossRef]
  42. Wang, G.; Liu, Y.; Wang, H.; Wang, X. A comprehensive risk analysis of coastal zones in China. Estuar. Coast. Shelf Sci. 2014, 140, 22–31. [Google Scholar] [CrossRef]
  43. Su, S.; Pi, J.; Wan, C.; Li, H.; Xiao, R.; Li, B. Categorizing social vulnerability patterns in Chinese coastal cities. Ocean Coast. Manag. 2015, 116, 1–8. [Google Scholar] [CrossRef]
  44. Wang, W.; Liu, H.; Li, Y.; Su, J. Development and management of land reclamation in China. Ocean Coast. Manag. 2014, 102, 415–425. [Google Scholar] [CrossRef]
  45. National Bureau of Statistics of the People’s Republic of China. Available online: http://www.stats.gov.cn/sj/ndsj/2021/indexch.htm (accessed on 1 January 2023).
  46. Newton, A.; Weichselgartner, J. Hotspots of coastal vulnerability: A DPSIR analysis to find societal pathways and responses. Estuar. Coast. Shelf Sci. 2014, 140, 123–133. [Google Scholar] [CrossRef]
  47. Earth Engine Data Catalog. Available online: https://developers.google.com/earth-engine/datasets (accessed on 1 January 2023).
  48. Gao, Y.; Wang, H.; Su, F.; Liu, G. The analysis of spatial and temporal changes of the continental coastlines of China in recent three decades. Acta Oceanol. Sin. 2013, 35, 31–42. [Google Scholar]
  49. Yan, F.; Wang, X.; Su, F. Ecosystem service changes in response to mainland coastline movements in China: Process, pattern, and trade-off. Ecol. Indic. 2020, 116, 106337. [Google Scholar] [CrossRef]
  50. The National Catalogue Service for Geographic Information. Available online: https://www.webmap.cn/commres.do?method=dataDownload (accessed on 1 July 2023).
  51. The State Council of the People’s Republic of China. Available online: https://www.gov.cn/guoqing/2021-05/13/content_5606149.htm (accessed on 1 January 2023).
  52. Regional Development Statistics Database. Available online: http://cnki.nbsti.net/CSYDMirror/area/Yearbook/Single/N2022040095?z=D26 (accessed on 1 January 2023).
  53. Bukvic, A.; Rohat, G.; Apotsos, A.; de Sherbinin, A. A Systematic Review of Coastal Vulnerability Mapping. Sustainability 2020, 12, 2822. [Google Scholar] [CrossRef]
  54. Nguyen, T.T.X.; Bonetti, J.; Rogers, K.; Woodroffe, C.D. Indicator-based assessment of climate-change impacts on coasts: A review of concepts, methodological approaches and vulnerability indices. Ocean Coast. Manag. 2016, 123, 18–43. [Google Scholar] [CrossRef]
  55. Lima, C.O.; Bonetti, J. Bibliometric analysis of the scientific production on coastal communities’ social vulnerability to climate change and to the impact of extreme events. Nat. Hazards 2020, 102, 1589–1610. [Google Scholar] [CrossRef]
  56. Adger, W.N. Vulnerability. Glob. Environ. Chang. 2006, 16, 268–281. [Google Scholar] [CrossRef]
  57. Ge, Y.; Dou, W.; Liu, N. Planning Resilient and Sustainable Cities: Identifying and Targeting Social Vulnerability to Climate Change. Sustainability 2017, 9, 1394. [Google Scholar] [CrossRef]
  58. Füssel, H.-M.; Klein, R.J.T. Climate Change Vulnerability Assessments: An Evolution of Conceptual Thinking. Clim. Change 2006, 75, 301–329. [Google Scholar] [CrossRef]
  59. Meng, D.; Liu, Y.; Wang, Z.; Yang, X.; Liu, X.; Zhang, J.; Gao, K. Decreasing Vulnerability of Storm Surge Disasters in Coastal Cities of China over the Past 30 Years. J. Mar. Sci. Eng. 2023, 11, 128. [Google Scholar] [CrossRef]
  60. Frigerio, I.; De Amicis, M. Mapping social vulnerability to natural hazards in Italy: A suitable tool for risk mitigation strategies. Environ. Sci. Policy 2016, 63, 187–196. [Google Scholar] [CrossRef]
  61. Cutter, S.L.; Boruff, B.J.; Shirley, W.L. Social Vulnerability to Environmental Hazards. Soc. Sci. Q. 2003, 84, 242–261. [Google Scholar] [CrossRef]
  62. Zhou, Y.; Li, N.; Wu, W.; Wu, J.; Shi, P. Local Spatial and Temporal Factors Influencing Population and Societal Vulnerability to Natural Disasters. Risk Anal. 2014, 34, 614–639. [Google Scholar] [CrossRef] [PubMed]
  63. Liu, X.; Wang, Z.; Yang, X.; Liu, Y.; Liu, B.; Zhang, J.; Gao, K.; Meng, D.; Ding, Y. Mapping China’s offshore mariculture based on dense time-series optical and radar data. Int. J. Digit. Earth 2022, 15, 1326–1349. [Google Scholar] [CrossRef]
  64. Wang, Z.; Zhang, J.; Yang, X.; Huang, C.; Su, F.; Liu, X.; Liu, Y.; Zhang, Y. Global mapping of the landside clustering of aquaculture ponds from dense time-series 10 m Sentinel-2 images on Google Earth Engine. Int. J. Appl. Earth Obs. Geoinf. 2022, 115, 103100. [Google Scholar] [CrossRef]
  65. Chen, Q.; Shen, W.; Yu, B. Assessing the Vulnerability of Marine Fisheries in China: Towards an Inter-Provincial Perspective. Sustainability 2018, 10, 4302. [Google Scholar] [CrossRef]
  66. Do, C.; Kuleshov, Y. Tropical cyclone multi-hazard risk mapping for Queensland, Australia. Nat. Hazards 2023, 116, 3725–3746. [Google Scholar] [CrossRef]
  67. Smit, B.; Wandel, J. Adaptation, adaptive capacity and vulnerability. Glob. Environ. Chang. 2006, 16, 282–292. [Google Scholar] [CrossRef]
  68. Li, Q.; Shi, X.; Wu, Q. Effects of protection and restoration on reducing ecological vulnerability. Sci. Total Environ. 2021, 761, 143180. [Google Scholar] [CrossRef]
  69. Zhao, S.A.; Chai, L.H. A new assessment approach for urban ecosystem health basing on maximum information entropy method. Stoch. Environ. Res. Risk Assess. 2015, 29, 1601–1613. [Google Scholar] [CrossRef]
  70. Chen, P. On the Diversity-Based Weighting Method for Risk Assessment and Decision-Making about Natural Hazards. Entropy 2019, 21, 269. [Google Scholar] [CrossRef]
  71. Kuo, T. A modified TOPSIS with a different ranking index. Eur. J. Oper. Res. 2017, 260, 152–160. [Google Scholar] [CrossRef]
  72. Yang, Y.; Song, G. Human disturbance changes based on spatiotemporal heterogeneity of regional ecological vulnerability: A case study of Qiqihaer city, northwestern Songnen Plain, China. J. Clean Prod. 2021, 291, 125262. [Google Scholar] [CrossRef]
  73. Hu, X.; Ma, C.; Huang, P.; Guo, X. Ecological vulnerability assessment based on AHP-PSR method and analysis of its single parameter sensitivity and spatial autocorrelation for ecological protection–A case of Weifang City, China. Ecol. Indic. 2021, 125, 107464. [Google Scholar] [CrossRef]
  74. Fang, J.; Liu, W.; Yang, S.; Brown, S.; Nicholls, R.J.; Hinkel, J.; Shi, X.; Shi, P. Spatial-temporal changes of coastal and marine disasters risks and impacts in Mainland China. Ocean Coast. Manag. 2017, 139, 125–140. [Google Scholar] [CrossRef]
  75. Yin, J.; Yin, Z.; Xu, S. Composite risk assessment of typhoon-induced disaster for China’s coastal area. Nat. Hazards 2013, 69, 1423–1434. [Google Scholar] [CrossRef]
  76. Xu, X.; Sun, D.; Guo, T. A systemic analysis of typhoon risk across China. Nat. Hazards 2015, 77, 461–477. [Google Scholar] [CrossRef]
  77. Kang, J.; Yang, X.; Wang, Z.; Cheng, H.; Wang, J.; Tang, H.; Li, Y.; Bian, Z.; Bai, Z. Comparison of Three Ten Meter Land Cover Products in a Drought Region: A Case Study in Northwestern China. Land 2022, 11, 427. [Google Scholar] [CrossRef]
  78. Wang, J.; Yang, X.; Wang, Z.; Cheng, H.; Kang, J.; Tang, H.; Li, Y.; Bian, Z.; Bai, Z. Consistency Analysis and Accuracy Assessment of Three Global Ten-Meter Land Cover Products in Rocky Desertification Region—A Case Study of Southwest China. ISPRS Int. J. Geo-Inf. 2022, 11, 202. [Google Scholar] [CrossRef]
  79. Zhao, T.; Zhang, X.; Gao, Y.; Mi, J.; Liu, W.; Wang, J.; Jiang, M.; Liu, L. Assessing the Accuracy and Consistency of Six Fine-Resolution Global Land Cover Products Using a Novel Stratified Random Sampling Validation Dataset. Remote Sens. 2023, 15, 2285. [Google Scholar] [CrossRef]
  80. The State Council of the People’s Republic of China. National Seawall Construction Program; The State Council of the People’s Republic of China: Beijing, China, 2017.
  81. Ke, Q. Flood Risk Analysis for Metropolitan Areas—A Case Study for Shanghai. Ph.D. Thesis, Delft University of Technology, Delft, The Netherlands, 2014. [Google Scholar]
  82. Xu, H.; Tian, Z.; Sun, L.; Ye, Q.; Ragno, E.; Bricker, J.; Mao, G.; Tan, J.; Wang, J.; Ke, Q.; et al. Compound flood impact of water level and rainfall during tropical cyclone periods in a coastal city: The case of Shanghai. Nat. Hazards Earth Syst. Sci. 2022, 22, 2347–2358. [Google Scholar] [CrossRef]
Figure 1. Geographical location of the study area and the distribution of 64 coastal cities in mainland China.
Remotesensing 15 04828 g001
Figure 2. Assessment results of (a) exposure, (b) sensitivity, and (c) adaptability to storm surges in coastal areas of mainland China. The distribution is based on the Jenks method. The bar-graph depicts the percentage of coastal cities under different categories.
Remotesensing 15 04828 g002
Figure 3. Assessment results of vulnerability to storm surges in coastal areas of mainland China. The distribution is based on the Jenks method.
Remotesensing 15 04828 g003
Figure 4. Percentage of coastal cities in different provinces under the four vulnerability categories (excluding Tianjin, Shanghai, and Hebei Province).
Remotesensing 15 04828 g004
Figure 5. Moran scatter plot of vulnerability for 64 coastal cities in mainland China.
Remotesensing 15 04828 g005
Figure 6. Spatial cluster map of vulnerability to storm surges in coastal areas of mainland China.
Remotesensing 15 04828 g006
Table 1. Exposure value and weight of different land cover types and environmental factors.
FactorJudgment CriterionExposure ValueExpert ScoreWeight
Land coverImpervious surface190.5
Cropland0.8
Wetland0.6
Vegetation0.4
Other0.2
Elevation (m)<1.0130.167
1.0–3.00.8
3.0–5.00.6
5.0–10.00.4
>10.00.2
Slope<0.5°120.111
0.5°–2.0°0.8
2.0°–5.0°0.6
5.0°–15.0°0.4
>15.0°0.2
Distance to water (km)<0.5140.222
0.5–1.00.8
1.0–2.00.6
2.0–5.00.4
>5.00.2
Table 2. Indicators for calculating the vulnerability index.
Vulnerability DimensionNo.IndicatorImpact to Vulnerability
Exposure1Total area of land cover with exposure values of 0.2–0.4 (km2)+
2Total area of land cover with exposure values of 0.5–0.7 (km2)+
3Total area of land cover with exposure values of 0.8–1.0 (km2)+
4Density of critical transportation facilities (facilities/km2)+
Sensitivity5Percentage of population aged 14 and under (%)+
6Percentage of population aged 65 and above (%)+
7Percentage of population with junior high school education or below (%)+
8Ratio of fishery output to GDP (%)+
Adaptability9General public budget expenditure (CNY 100 million)
10GDP (CNY 100 million)
11Urban disposable income per capita (CNY)
12Rural disposable income per capita (CNY)
13Number of hospital medical staff
14Number of medical institutions
15Proportion of artificial and biogenic coastlines (%)
“+”: positive indicator, indicating that the indicator tends to increase vulnerability; “−”: negative indicator, indicating that the indicator tends to decrease vulnerability.
Table 3. Results of Kendall consistency test.
Vulnerability ComponentsKendall’s WX2p
Exposure0.985248.1870.000 ***
Sensitivity0.942237.3910.000 ***
Adaptability0.984247.9470.000 ***
“***” indicates the result at 1% significance level.
Disclaimer/Publisher’s Note: The statements, opinions and data contained in all publications are solely those of the individual author(s) and contributor(s) and not of MDPI and/or the editor(s). MDPI and/or the editor(s) disclaim responsibility for any injury to people or property resulting from any ideas, methods, instructions or products referred to in the content.

