1. Introduction
Large-scale migration is an important cyclic process of matter and energy in nature [
1,
2]. Due to the effectiveness of radars for aerial surveillance, bird or insect radars are becoming an increasingly important tool for studying aerial animal migration [
3,
4,
5]. These radars can provide data on individual parameters, such as body size, body axis orientation, wing-beat frequency, and so on [
6]. However, the current challenge lies in the limited coverage areas of these radars, which restricts the monitoring of large-scale aerial migration.
Weather radar, with its wide coverage, is indeed suitable for macro aerial migration observation [
1,
7,
8,
9]. The Next-Generation Weather Radar (NEXRAD) in the U.S., the Operational Program for Exchange of Weather Radar Information (OPERA) in Europe, and the China New-Generation Weather Radar (CINRAD) can all provide surveillance data for aerial animal migration over a large spatial area and continuous time [
1,
8,
10].
Based on weather radar data, researchers in the U.S. and Europe have conducted extensive research, exploring topics such as the relationship between bird migration intensity and wind [
8], the impact of city light on bird activities [
11], analysis of large-scale bird population changes [
10], and quantifying the diurnal timing of spring trans-Gulf bird migration [
12]. As a result, a relatively comprehensive research system has been established. However, in China, research based on weather radar data is still in its early stages, despite the development of a comprehensive weather radar network.
Quantifying bird migration based on radar echoes is essential for using weather surveillance radar to study bird migration. In Europe, a quantitative relationship between bird density and echo intensity has been established using data from different radars [
13]. However, the monitoring range of weather radar, which spans hundreds of kilometers, is much larger than that of bird radar, which has a range of only a few kilometers. Additionally, the distribution of birds within the surveillance area of weather radar is uneven. Spatial matching is important for establishing a quantification relationship. Furthermore, different regions have varying species and sizes of migratory birds, making it necessary to develop a quantification model specially for weather radars in China.
We analyzed the bird observation model in weather radar, and proposed a quantification method based on weather radar and bird scanning radar like a previous study [
13], but with more detailed processing and analysis. To ensure the effectiveness of radar observations, we utilized geometric features of flight tracks to filter the non-bird tracks in the scanning bird radar. Additionally, we employed the depolarization rate [
14] and the standard deviation of radial velocity to filter weather echoes and insect dominated echoes, respectively. We carried out field experiments in Jinan, Shandong Province, then acquired a quantitative model of migratory birds in Jinan area by means of regression analysis of the data from common monitoring areas at the same time. The average radar cross section (RCS) of migratory birds in Jinan is about 19.09 dBscm (i.e., 81.19 cm
2; 95% confidence interval, CI: 18.92–19.27 dBscm), and the determination coefficient of the linear quantitative model is 0.79. In addition, by analyzing the correlation between bird density from scanning bird radar and reflectivity from weather radar in different regions, the ground terrain (open fields and urban buildings, ridges and valleys) may affect the distribution of aerial birds.
2. Methods
At present, the range bin distances of the operation weather radar in China are 0.25 km or 1 km. It is difficult to distinguish the tracks or extract the number of aerial birds directly from weather radar observation. Therefore, it was necessary to determine the relationship for weather radars between the echo intensity and bird density.
2.1. Bird Quantitative Observation Model
The spatial resolution of weather radar is low, and there are multiple birds in one range gate. This is a typical volume scattering model [
15,
16]. Suppose that the distribution of the angle between the target’s axis and weather radar line-of-sight is
, and the fluctuation model of the radar cross sectional area (RCS) of birds at different horizontal angles is
, representing the ratio of RCS of different azimuths to RCS at an azimuth of
. We also assume that the fluctuation patterns of different birds are consistent. The RCS at an azimuth of
is proportional to body size. The distribution of bird body size satisfies the Gaussian distribution, with a mean of
and a standard deviation of
. Therefore, the total RCS in a range gate of weather radar can be written as
where
is the bird density and
is the fixed ratio of RCS to body size.
We further assume that
is a uniform distribution, so (1) can be simplified as
The total RCS of bird in a range gate of weather radar is proportional to the bird density in the simplified observation model.
The total RCS within a range gate can be obtained from the reflectivity factor observed by weather radar. The key to retrieving the bird number is to build a function, i.e., obtaining the average RCS of birds. Bird average RCS can be estimated by means of simulation [
15,
17,
18] or actual measurement [
19] in a microwave darkroom, but it requires a lot of effort to build bird geometric models or acquire experimental data in a darkroom. In addition, the number of samples is limited, leading to a lack of representativeness. If we can acquire the ground truth of bird density and corresponding weather radar observation, there is a promising possibility to estimate a representative value for bird average RCS through (2).
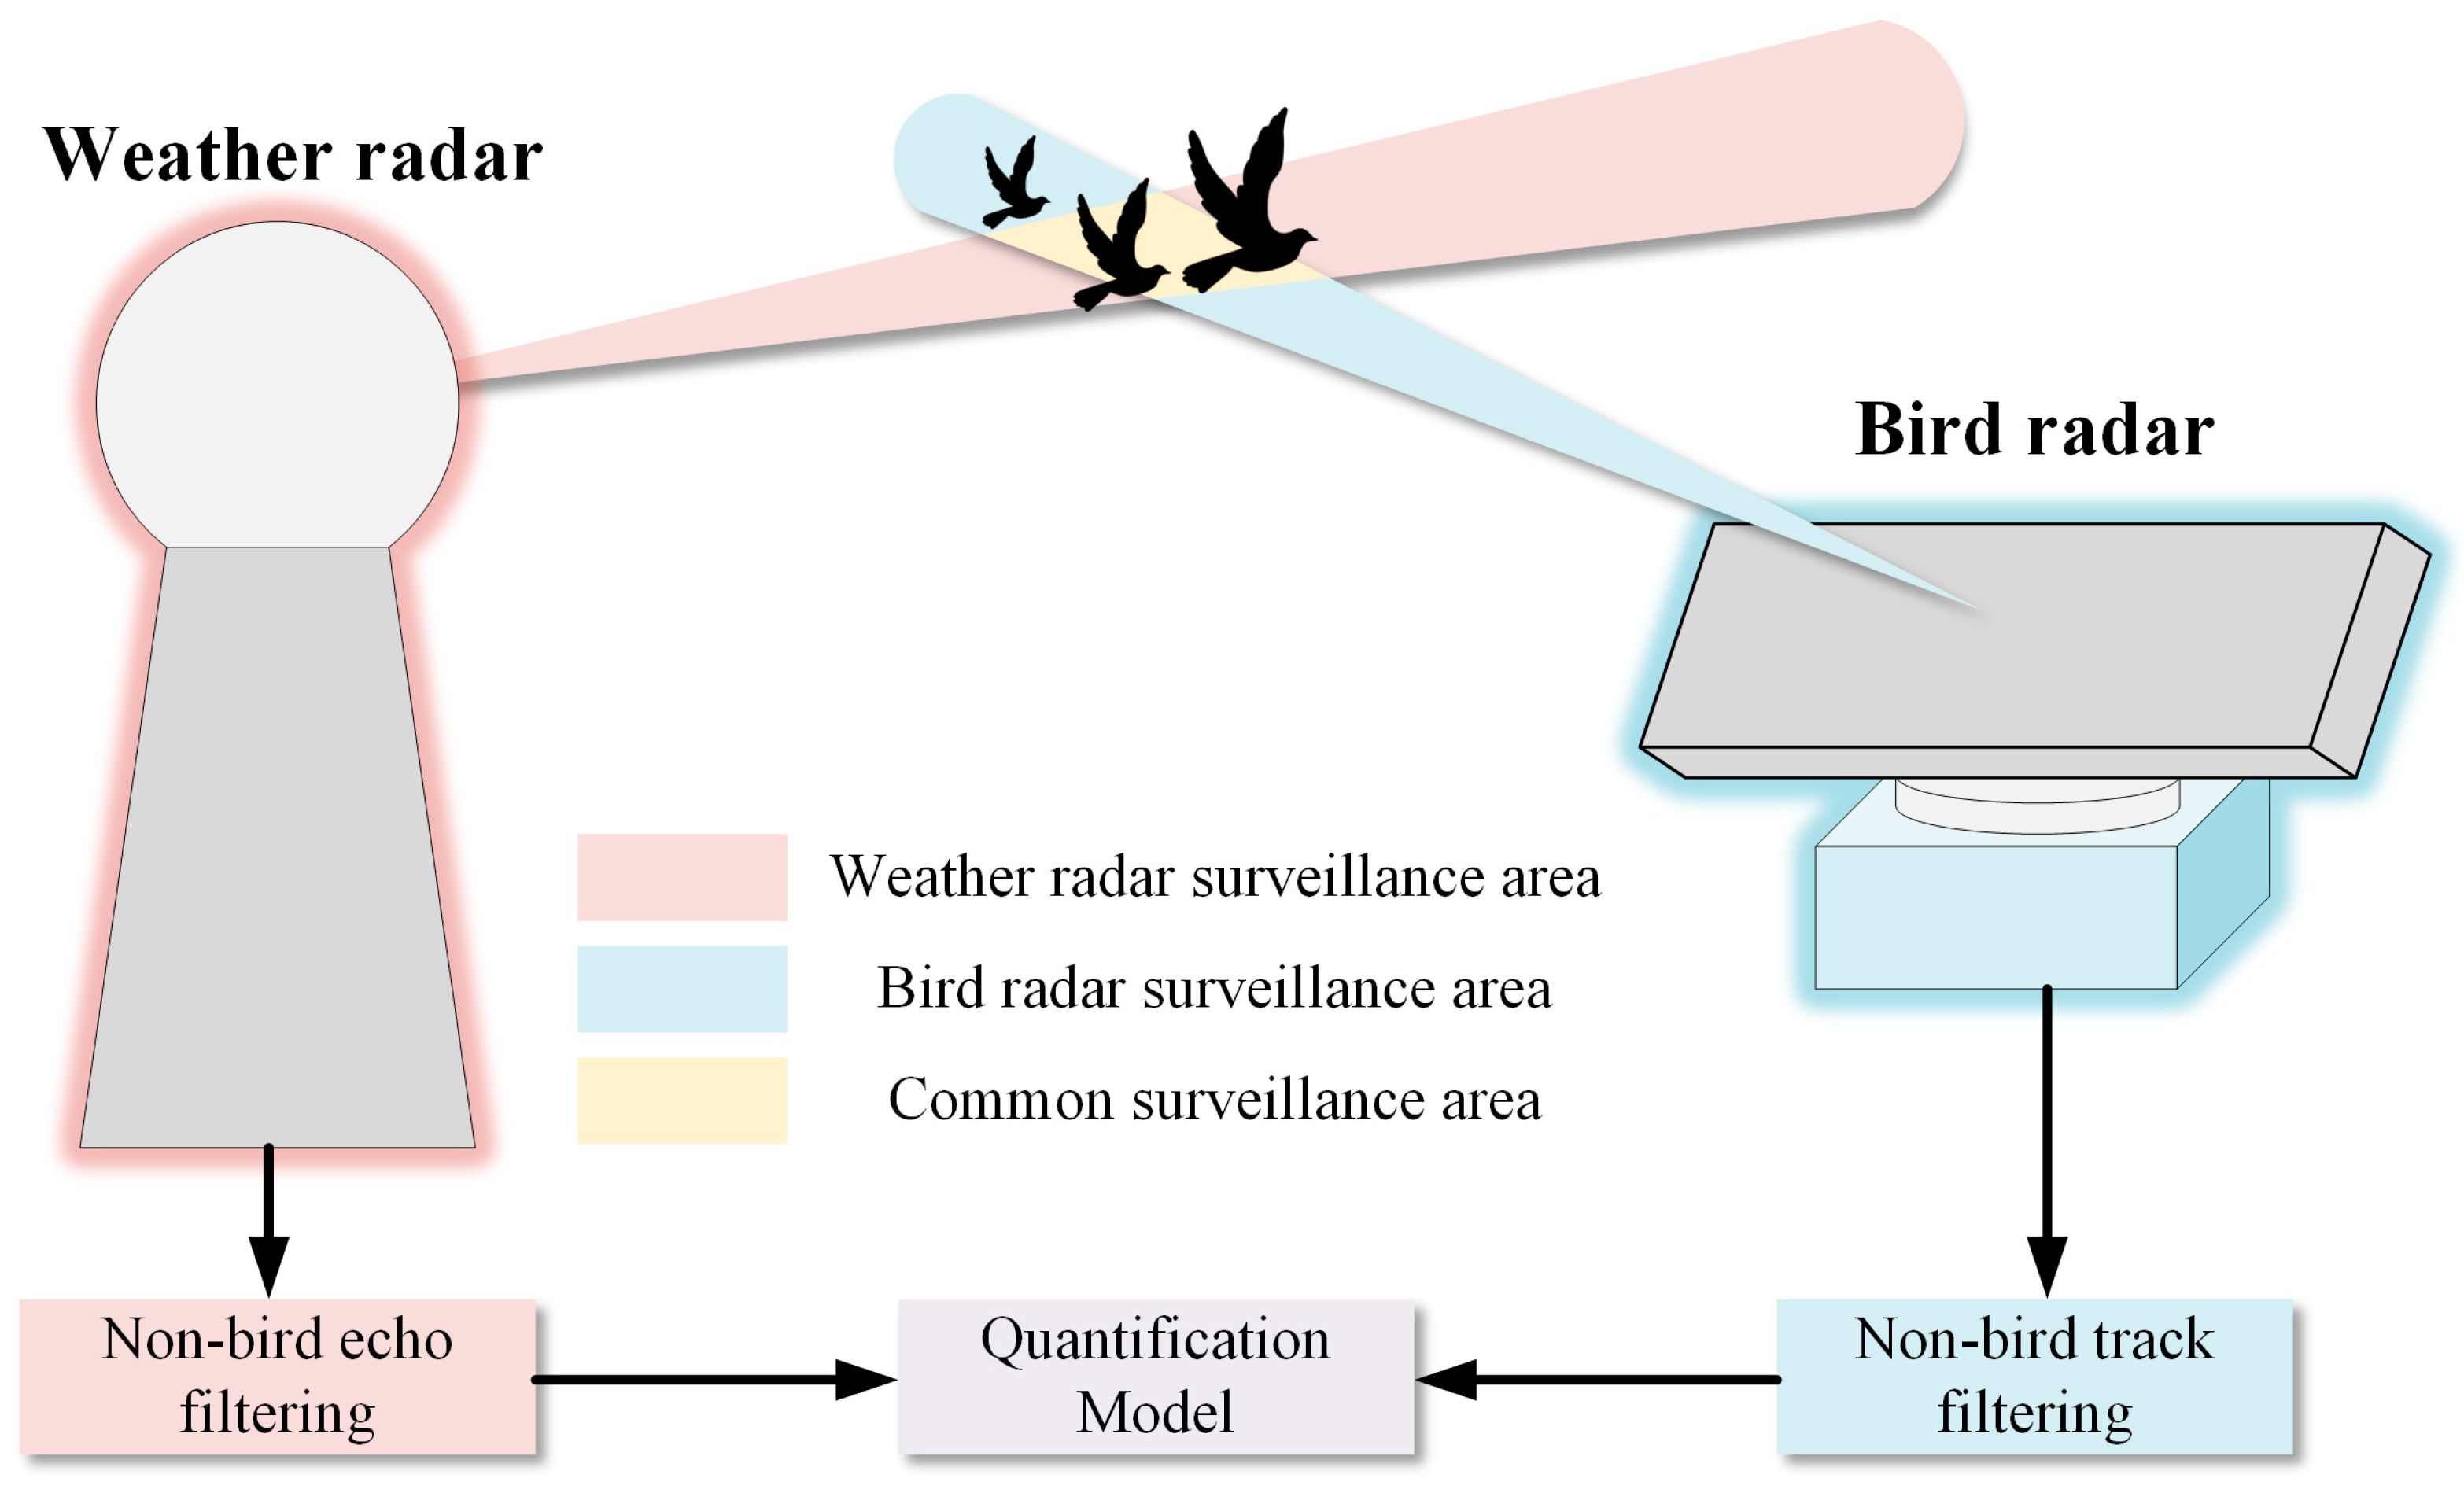
Therefore, based on the above analysis, we propose a quantification method which applies the scanning bird radar to acquire the bird density and weather radar to measure the total RCS, as shown in
Figure 1. When estimating the mean RCS, it is vital to access the accurate bird density and the corresponding total reflectivity. The quality of the data is crucial for establishing the quantitative relationship [
20,
21]. Therefore, in the following parts, we design the detailed data process for scanning bird radar and weather radar to filter out non-bird tracks or echoes.
2.2. Non-Bird Track Filtering in Scanning Bird Radar
There are not only bird tracks, but also non-bird tracks caused by ground clutter and thermal noise in scanning bird radar. Eliminating the above non-bird tracks is important for accessing the clear bird density.
The signal-to-noise ratio (SNR) of tracks generated by false alarms is usually lower than that of real tracks generated by birds, so the SNR threshold method is feasible to filter out fake targets. The extra calibration experiment based on calibrators for the scanning bird radar can help us to set an appropriate threshold.
Tracks generated by ground clutter always appear in fixed locations and show the complex geometry, while bird tracks are usually relatively smooth lines with few drastic changes and fluctuations, especially for migratory birds. Therefore, we can design a filter based on the geometric difference to filter out non-bird tracks. In the coordinate system with the radar position as the origin, we denote a point in tracks as
, where
and
represent the coordinates in E–W and N–S, respectively, and
is the height. Then,
represents a whole track, where
is the point number of the track. The degree of variation in flying direction is useful to present the geometric complexity of tracks. The flying direction between any two consecutive points in a track is defined as follows:
The direction sequence of a track is denoted as
Due to the periodicity of direction data, it is not possible to apply the arithmetic mean in traditional statistics. According to [
22], we use (5) and (6) to calculate the mean value of direction data, as follows:
The essence of the above operations is to use the direction of the resultant vector to present the mean direction. We use the standard deviation of the direction sequence to present the geometric characteristic. The larger the value, the more complex the geometry of the track. The standard deviations of bird tracks are usually smaller than those of non-bird tracks, so we can design a threshold to eliminate the ground tracks.
2.3. Meteorological and Insect Echoes Filtering in Weather Radar
Meteorological and insect echoes have a significant impact on weather radar acquiring bird reflectivity. The polarization information of echoes can reflect the shape characteristics of reflectors [
9,
23]. Due to the significant difference in the shape of meteorological particles and individual migratory animals, we can apply polarization products from weather radar to exclude meteorological echoes. The depolarization ratio is an effective index to distinguish meteorological echoes from biological echoes [
14], which is defined as
where
and
represent the differential reflectivity factor and correlation coefficient, respectively. We set the threshold value at −12 dB [
14], where any echoes above the threshold were considered as biological echoes, while those below the threshold were considered as meteorological echoes.
We used the observation data to build a dataset (about 120,000 items of meteorological and non-meteorological echoes each) to calculate the probability distribution of meteorological and non-meteorological echoes in the plane of
, as shown in
Figure 2. There are obvious differences in the distribution of the two. The distribution of meteorological echoes is more concentrated, while that of the biological echoes is dispersed.
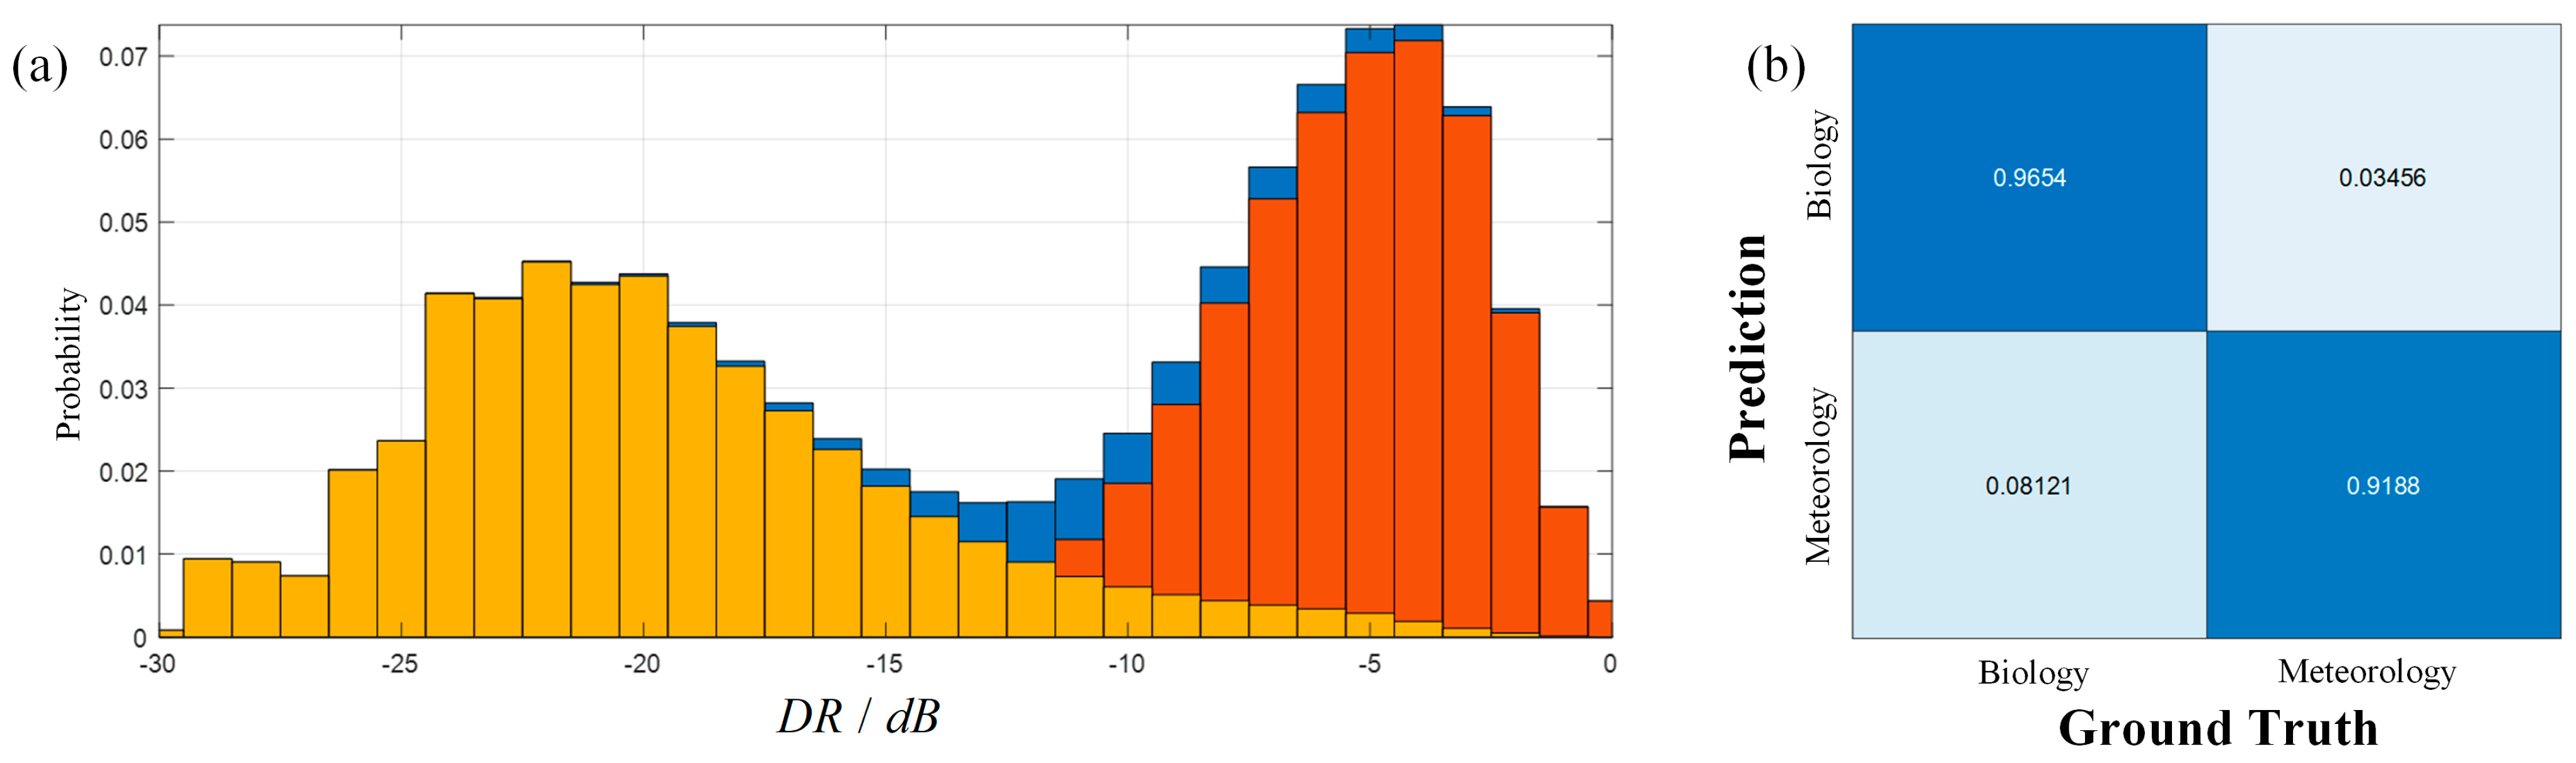
The distribution of depolarization ratio and the confusion matrix are shown in
Figure 3. The depolarization ratio of meteorological echoes is often smaller than that of biological echoes, indicating that depolarization ratio is a useful classification index. Based on bimodal threshold method, −12 dB is a suitable threshold, with the accuracy rate being over 90% for both biological and meteorological echoes.
Insects and birds may appear simultaneously within the same range gate. The low range resolution of weather radar makes it difficult to extract their respective reflectivity values. Therefore, flight capability is often used to distinguish between insect and bird echoes roughly [
1,
10]. Here, we apply estimate errors of radial velocity [
10] to present the flight capability, which is defined as
where
is the number of azimuth samples in a complete PPI (Plan Position Indicator) scan,
and
are the retrieved velocity and direction, respectively, based on the VAD (Velocity Azimuth Display) method [
24], and
is the observed radial velocity at the azimuth of
. The flight capability of birds is much stronger than insects, so a bigger
indicates that birds dominate the migration. The threshold is set as 2 m/s [
10].
We convert bird reflectivity factors into reflectivity, as follows:
where
is the corresponding reflectivity,
is the reflectivity factor from weather radar products, and
is a parameter to transfer reflectivity factor to reflectivity, related to the frequency of weather radar [
1].
2.4. Observation Results Matching
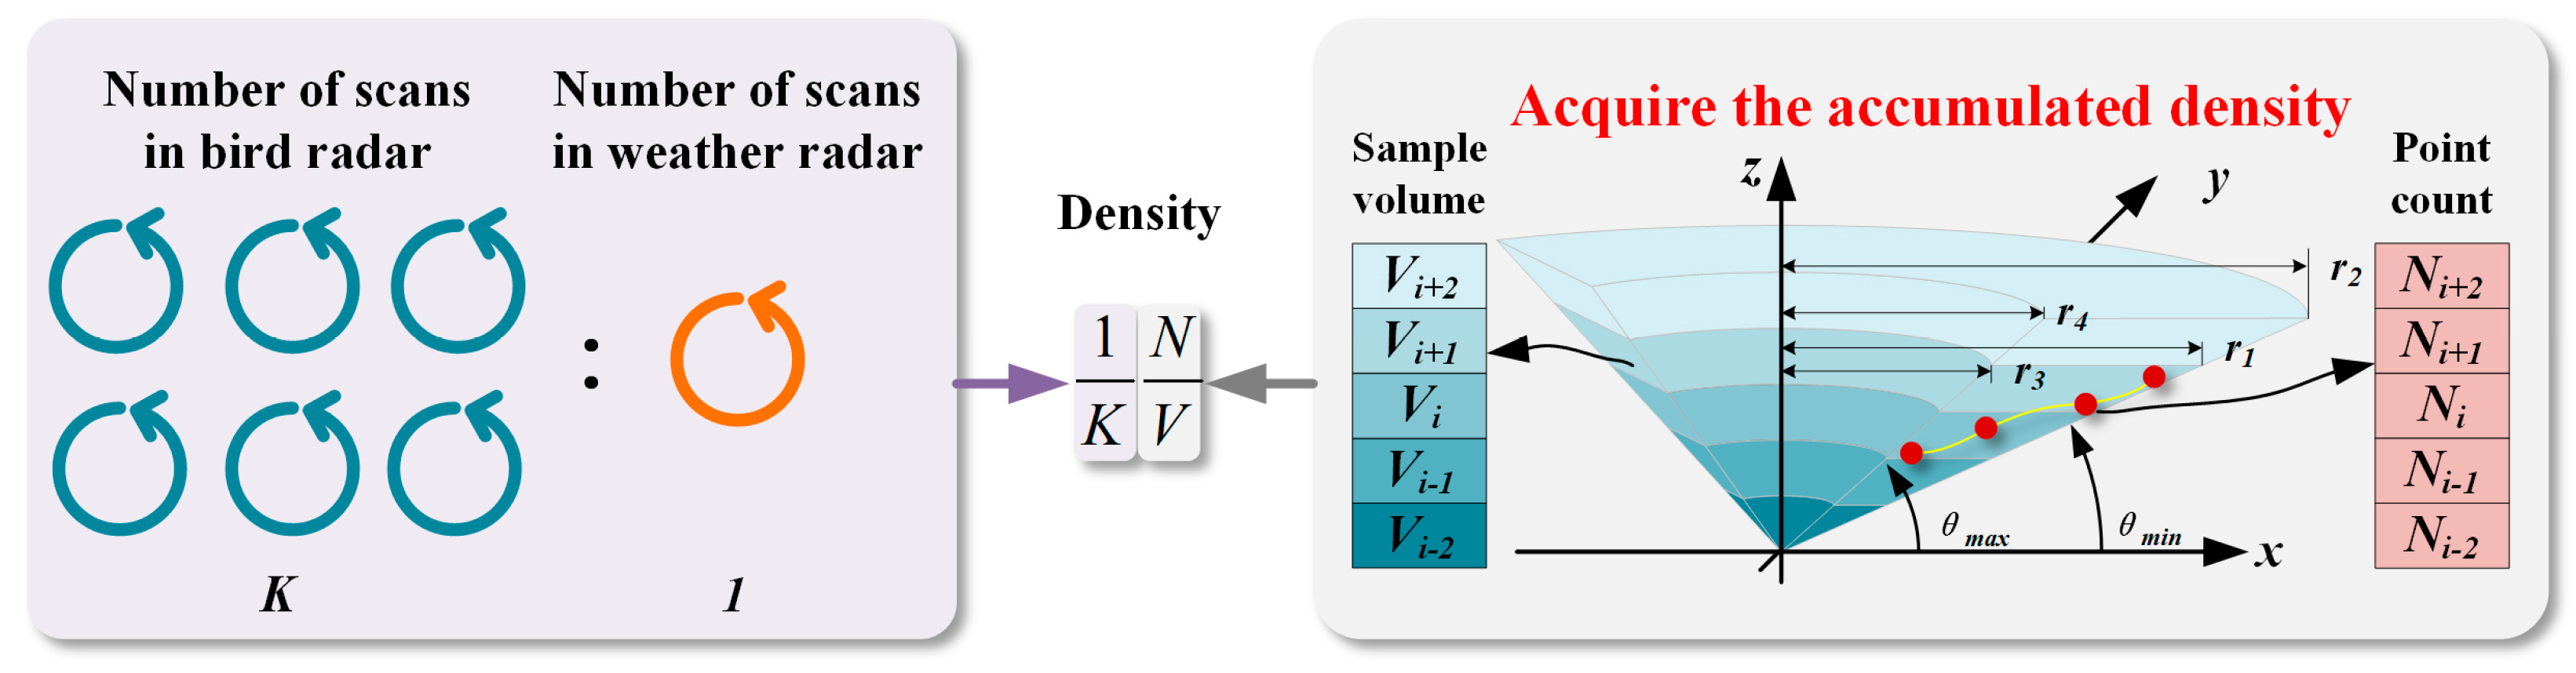
Compared with scanning bird radar, weather radar has a larger surveillance range and a lower time sample rate. It is necessary to match observations of the two radars in time and space when building a quantification model. To align the sample time of two radars, bird tracks within each complete scan of the weather radar are converted into densities. The density calculation diagram is shown in
Figure 4. According to the maximum and minimum elevations of the collected tracks and the pre-defined height axis, we can acquire the sample volumes of scanning bird radar at different height levels. For 360-degree scans, the sample volume within the height from
to
can be regarded as the difference between two circular truncated cones approximatively, that is, one with radiuses of
and
, and another with radiuses of
and
. According to the volume formula of the circular truncated cone, we can calculate the sample volume as follows:
Then, the actual sample volume is
where
is the actual sampling angle of scanning bird radar in azimuth.
Based on the heights of points in the valid tracks, we can obtain the point number for each height level, denoted as . The density can be retrieved according to sample volume and number count results, i.e., . However, the density is the accumulated result of multiple scans from scanning bird radar, while the reflectivity is the result of one scan from weather radar. Therefore, we divide the density by the scanning number ratio between two radars, . As for spatial matching, according to the relative positions of the two radars, we extract the reflectivity factor in the common surveillance area. Finally, linear regression is a simple tool to estimate the mean RCS.
3. Results
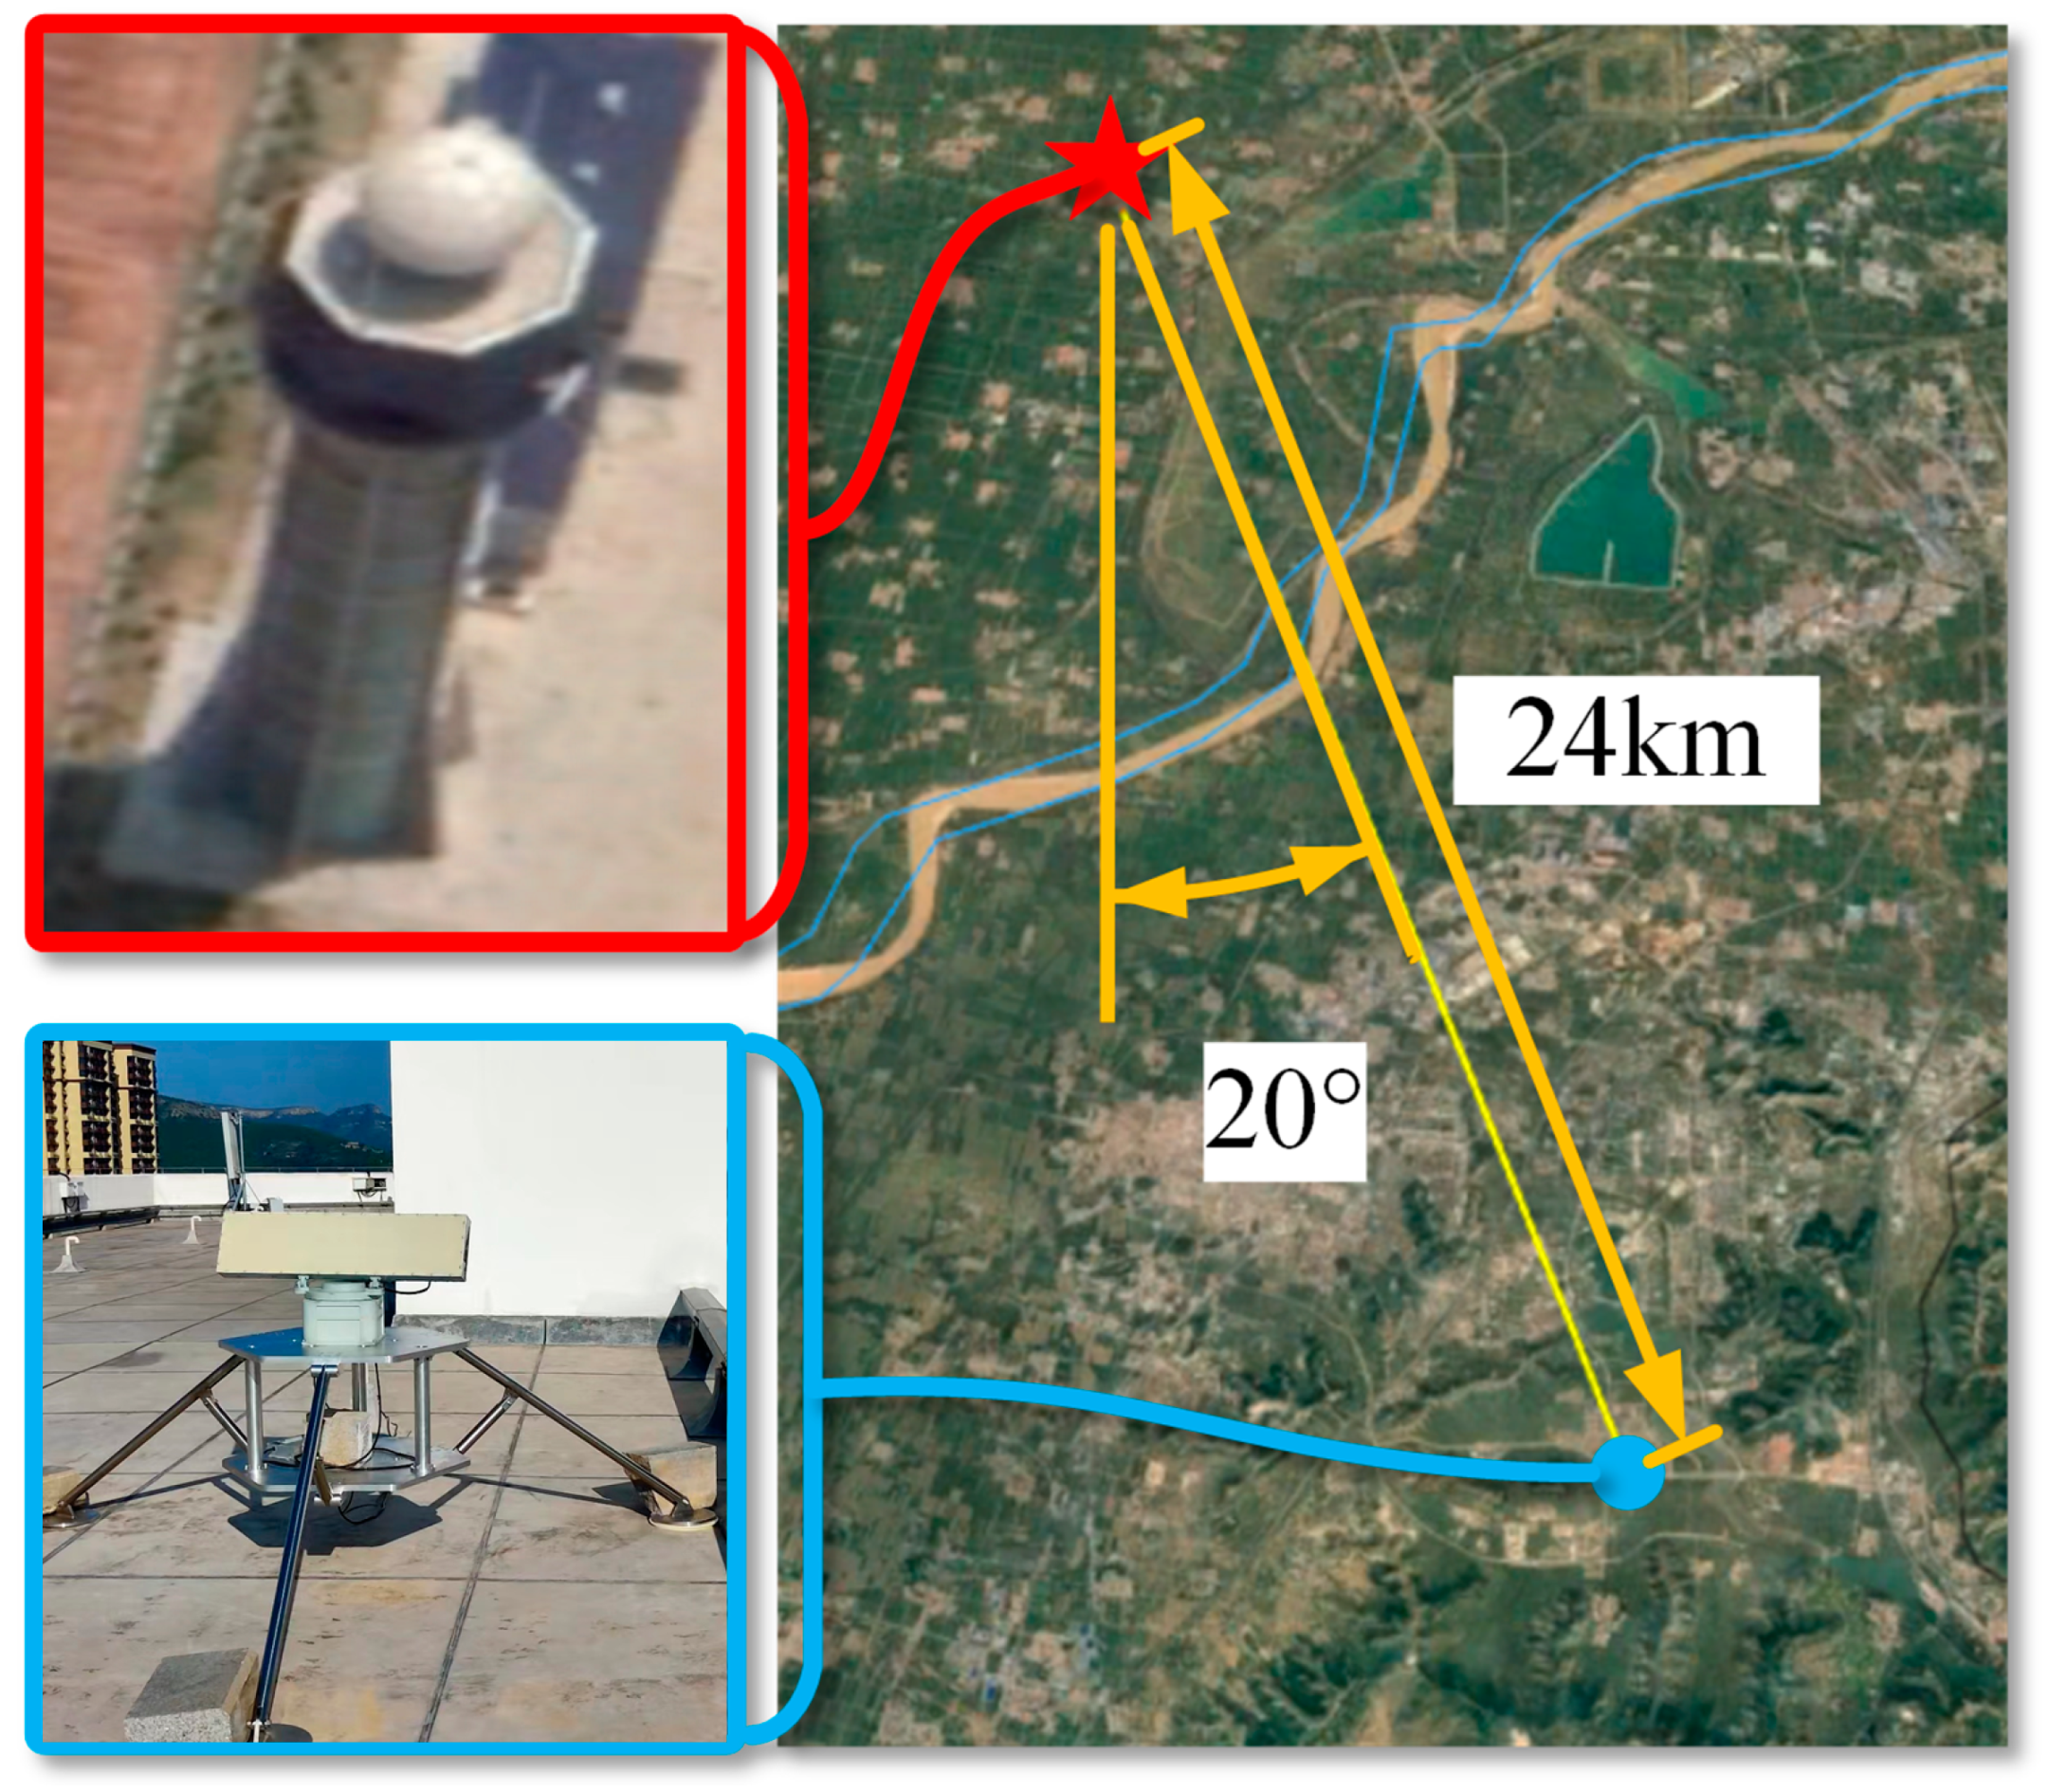
To validate the proposed method, we carried out field experiments. To obtain the ground truth of bird density, we installed a scanning bird radar on the roof of a tall building within the surveillance area of a dual-polarization Doppler weather radar in Jinan, Shandong province. The geospatial locations of the two radars are shown in
Figure 5. The scanning bird radar was located approximately 20 degrees south-southeast of the weather radar, at a distance of about 24 km in a straight line.
The weather radar operates in the S-band and emits electromagnetic waves to detect the atmosphere [
25,
26]. The 3 dB beam width is about 1°, and the detection radius is 460 km, which can effectively cover the surveillance area of the scanning bird radar. After the dual-polarization upgrade, the range resolution improved from 1000 m to 250 m. In addition to the products of single-polarization weather radar, it can also provide a variety of polarization information, such as the differential reflectivity factor, correlation coefficient, and differential phase [
9]. It takes about 6 min to complete a volume scan from 0.5° to 19.5° in elevation. The weather radar operates continuously for 24 h during the flood season, while it normally works for 8 h during the day and is turned off at night in the non-flood season.
Compared to weather radar, the scanning bird radar can provide more precise individual target observation information. It uses electronic scanning in the elevation direction to quickly cover multiple elevations, and mechanical scanning in the azimuth direction with a rotation speed of 60 degrees per second, completing a scan in 6 s. The range resolution is 15 m, while the azimuth resolution is 2.5 degrees and the elevation resolution is 10 degrees. It can obtain a three-dimensional track for an individual target. It can achieve 360-degree and 0- to 40-degree elevation scans, and the scanning azimuth range can be adjusted according to actual requirements. The scanning beam can be either a fan or a circle. The radar uses near and far waveform alternation to improve the range coverage; the near waveform covers 150 m to 2400 m and the far waveform starts at 1500 m. The scanning bird radar was enclosed by a wall on the east side and high-rise residential buildings on the north side, so the main observation area was in the southwest region. The actual observation azimuth angle ranged from 150 to 330 degrees clockwise from true north (0 degrees), i.e., a semicircular scanning area.
3.1. Non-Bird Tracks in Scanning Bird Radar
There were obvious circular track clusters in the overlapped area of near and far waveforms, as shown in
Figure 6a. The number of false alarms in the overlapped area was twice that of the non-overlapped area, which made it more likely to form tracks. These tracks circled around the radar coordinate origin and were mostly confined within the overlapped area. The number of tracks in the overlapped area at night was much smaller than during midday, due to the lower thermal noise level.
To be specific, we eliminated the tracks with an average SNR lower than 18 dB and the ratio of points in the overlapped area over 0.85, and the results are shown in
Figure 6b. The filter processing effectively filtered out the annular tracks and retained the real tracks crossing the overlapped area.
Figure 6d,e present the histograms of average track altitude before and after processing, respectively, and the number of tracks between 300 m to 500 m was significantly reduced.
In addition to the false alarm tracks, there were also non-bird tracks caused by the fixed ground targets. In
Figure 6b, there were two track clusters at the positions of (−1000 m, 0 m) and (0 m, 200 m). Meanwhile, there were also two outliers with heights below 200 m in the average altitude histogram in
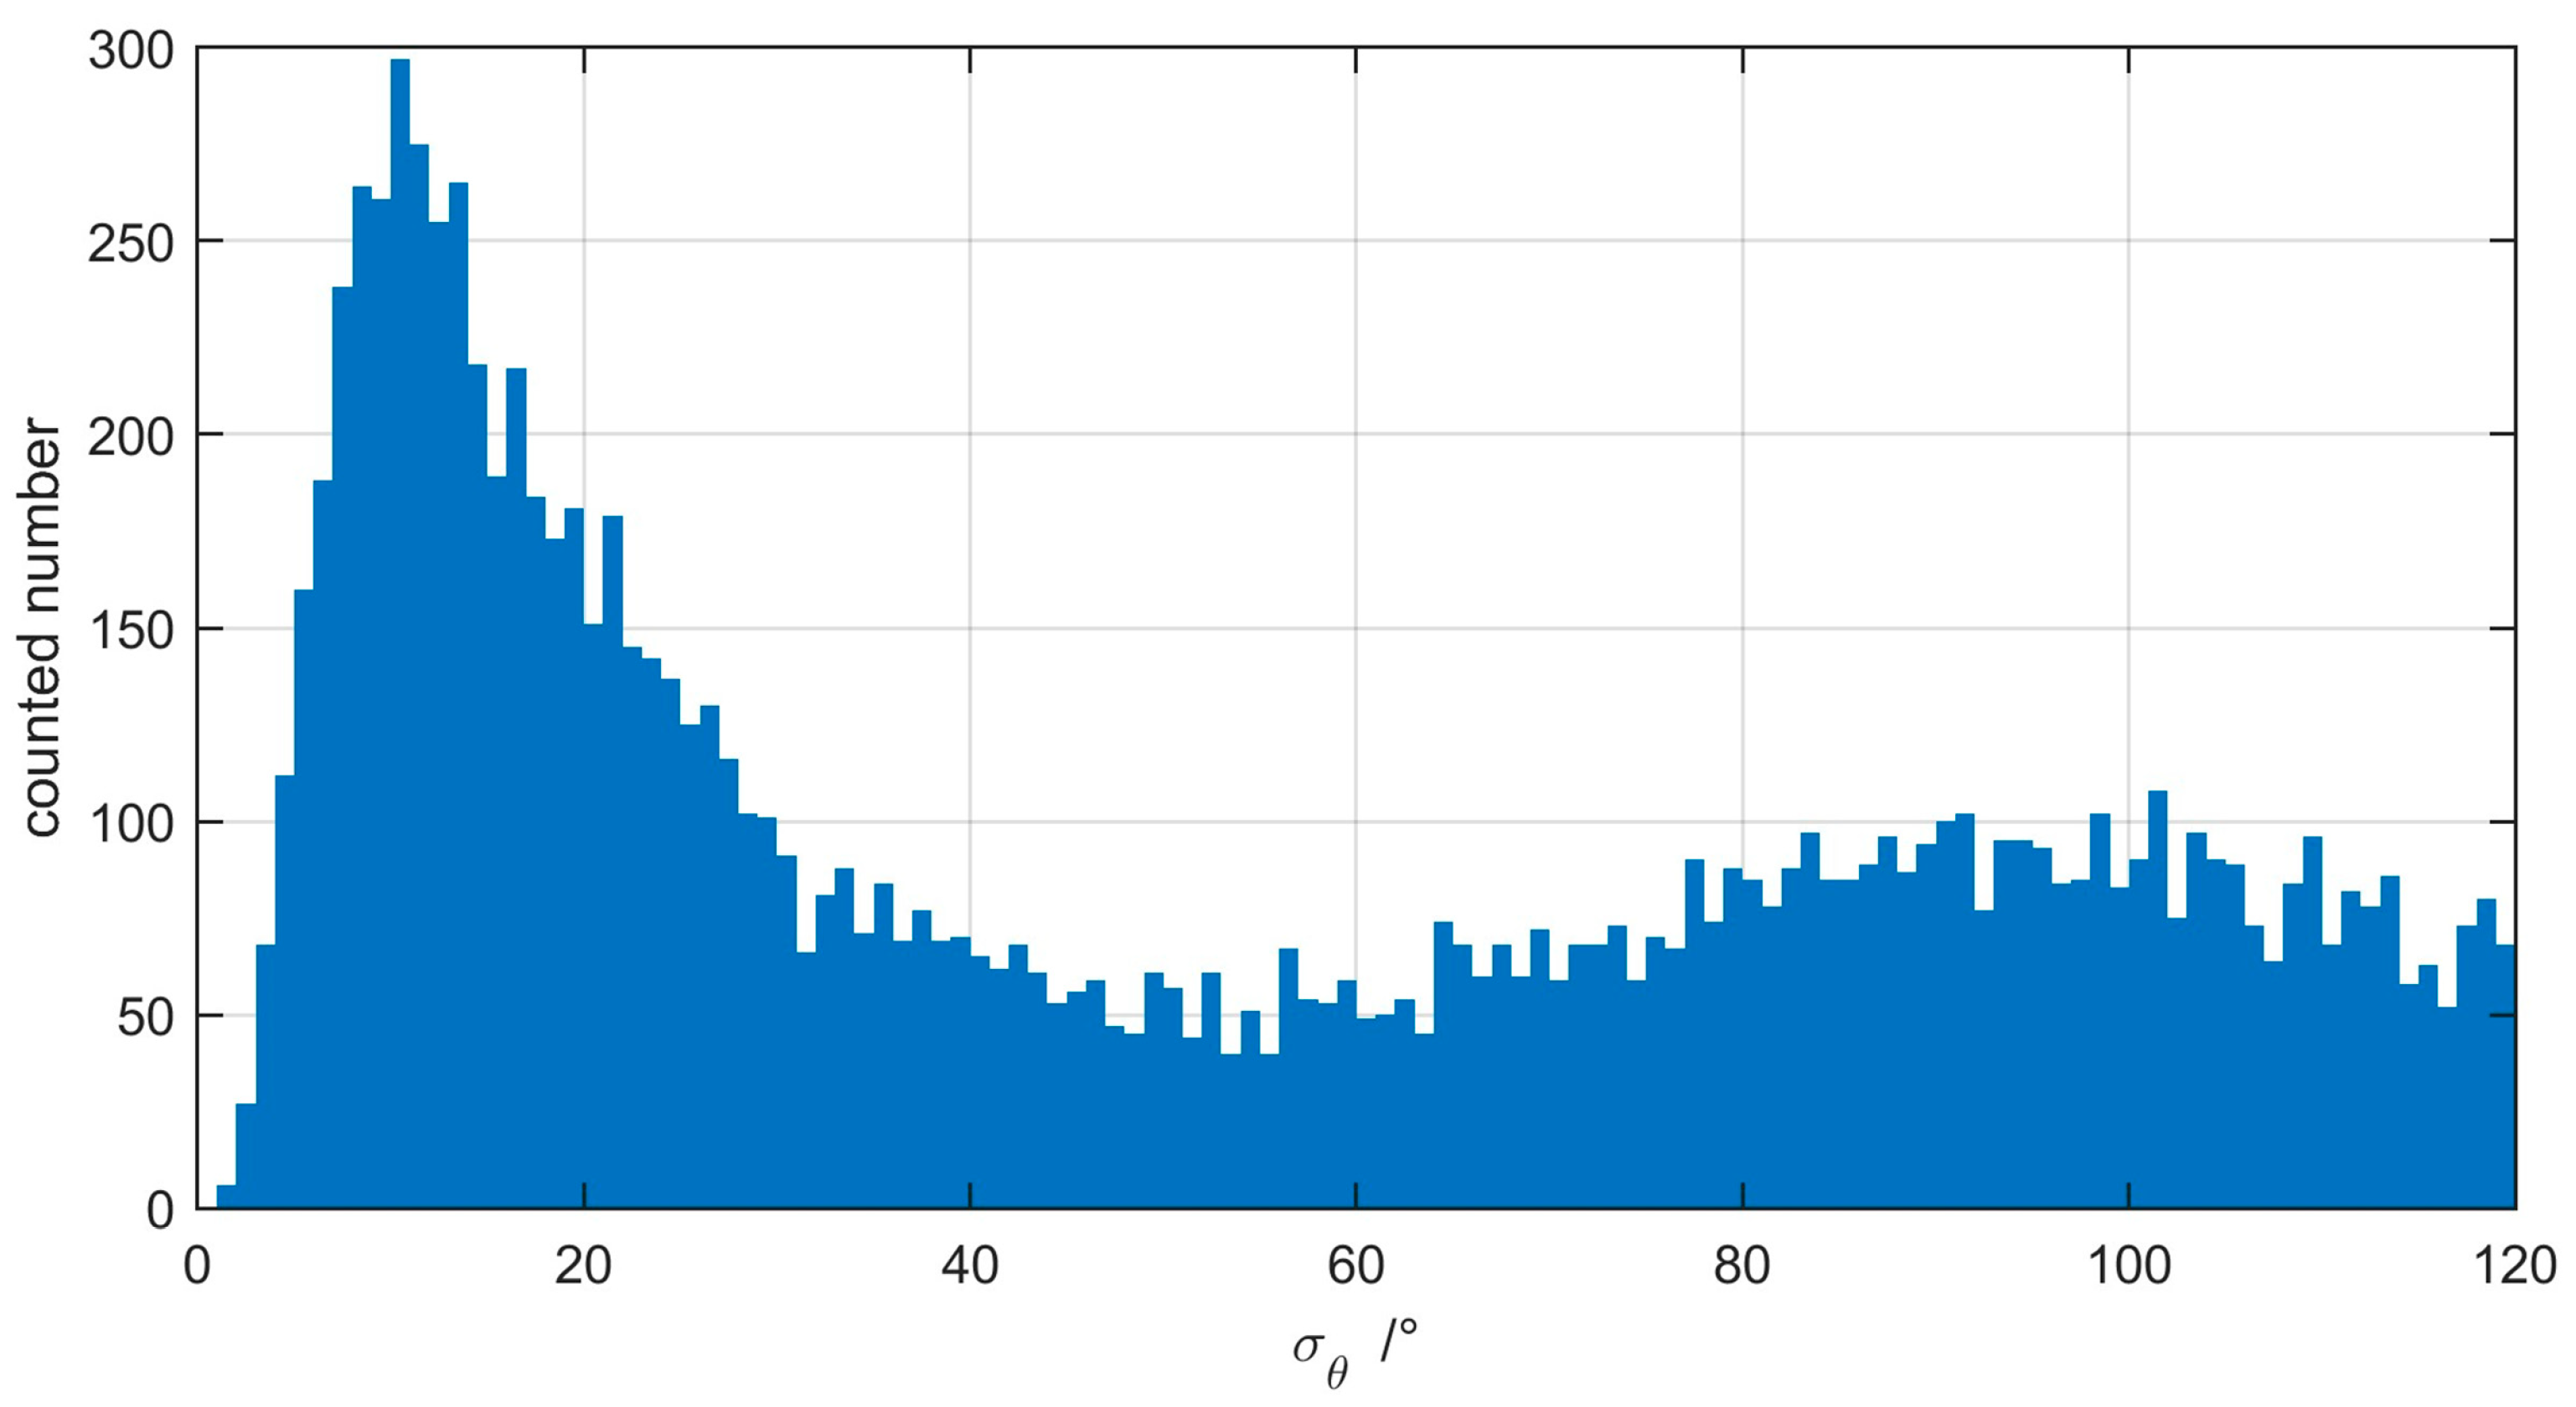
Figure 6e. We calculated the standard deviation of track directions, and the results are shown in
Figure 7. There existed two peaks, one with a higher peak value at a position of about 10 degrees, and another with a lower peak value at the position of about 90 degrees. The larger the value, the more complex the geometry. Based on the two-mode method, we set the threshold as 50 degrees. The final results are shown in
Figure 6c. In
Figure 6f, the outliers below 200 m are effectively filtered.
3.2. Quantification Relationship
Due to lots of ground clutters in the lowest-elevation (0.5 degrees) data of the weather radar, and the limited common surveillance area between the third elevation (2.4 degrees) of the weather radar and the scanning bird radar, we adopted the observations from the second elevation (1.5 degrees) to build a quantification model with the bird density. According to the relative positions of the two radars, we extracted the weather radar observations in the common surveillance area, i.e., the region of the azimuth from 160 degrees to 172 degrees and range from 24 km to 30 km for weather radar, and bird density at altitudes from 600 m to 800 m.
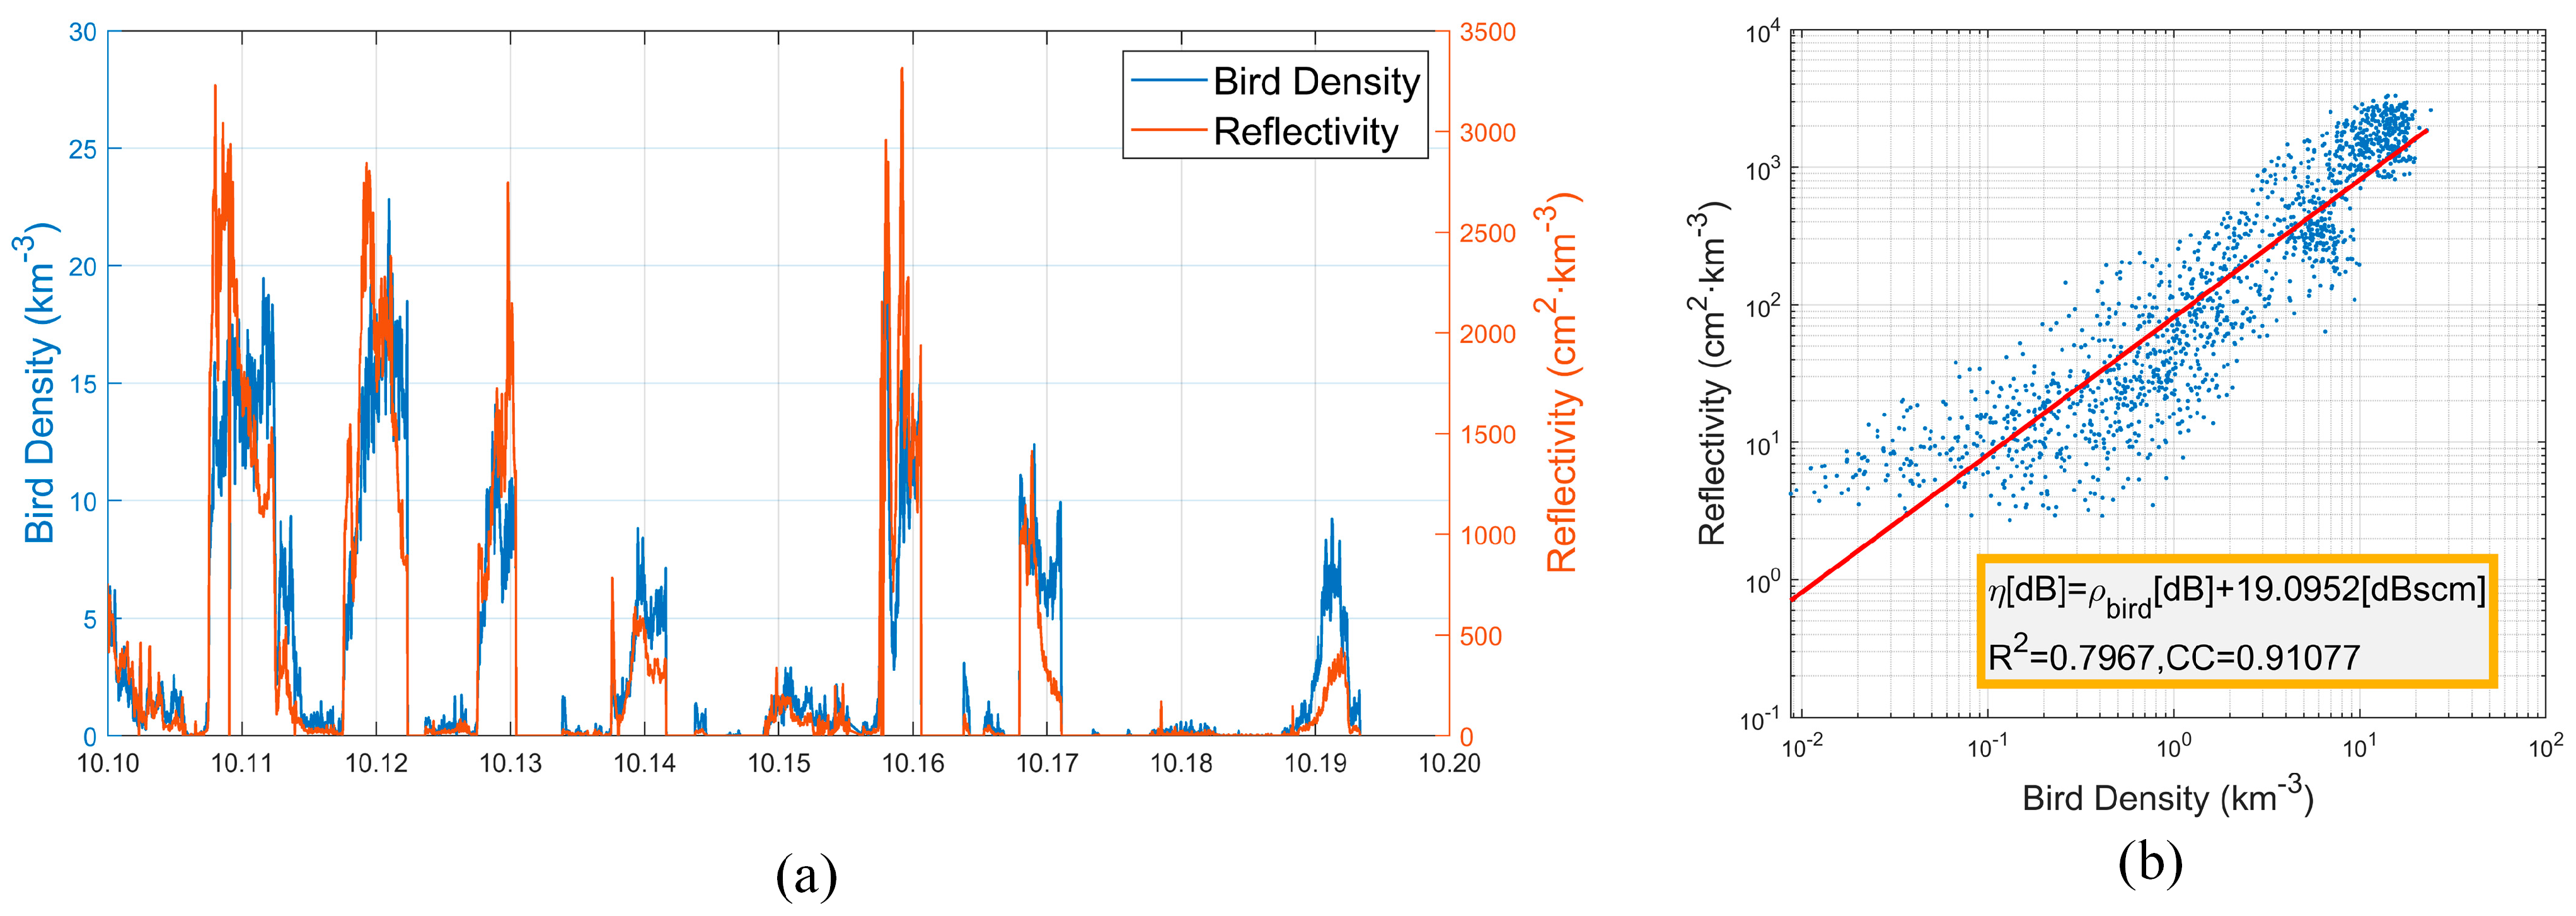
The sequences of mean reflectivity and mean bird density in the common surveillance area are shown in
Figure 8a, and the precipitation period was excluded in advance. We found that the migration trends observed by the two radars were highly similar. After the data cleaning and matching process, we collected 1508 valid sample points with a total observation time of more than 150 h.
Figure 8b displays a scatter diagram showing the matched data from both radars. The X-axis represents the density from scanning bird radar, while the y-axis is the corresponding mean reflectivity from weather radar. There was an obvious linearity between the two types of data. Through the least square method, we acquired the quantification relation as
where dBscm presents the decibel square centimeter. The R
2 and correlation coefficient were 0.79 and 0.91, respectively, showing the high correlation between the bird density and reflectivity. The intercept of the red line indicates that the average RCS of migrant birds in Jinan was 19.09 dBscm (i.e., 81.19 cm
2; 95% confidence interval, CI: 18.92–19.27 dBscm) for the S-band weather radar. The results of [
13] indicated that the average RCS of migrant birds in Europe was 11 cm
2 for C-band weather radars. The above RCS difference might come from the differences in the radar’s frequency [
9,
17,
19] and body size in different regions. Our work provides a feasible value for retrieving the bird densities from the reflectivity of weather radars in China.
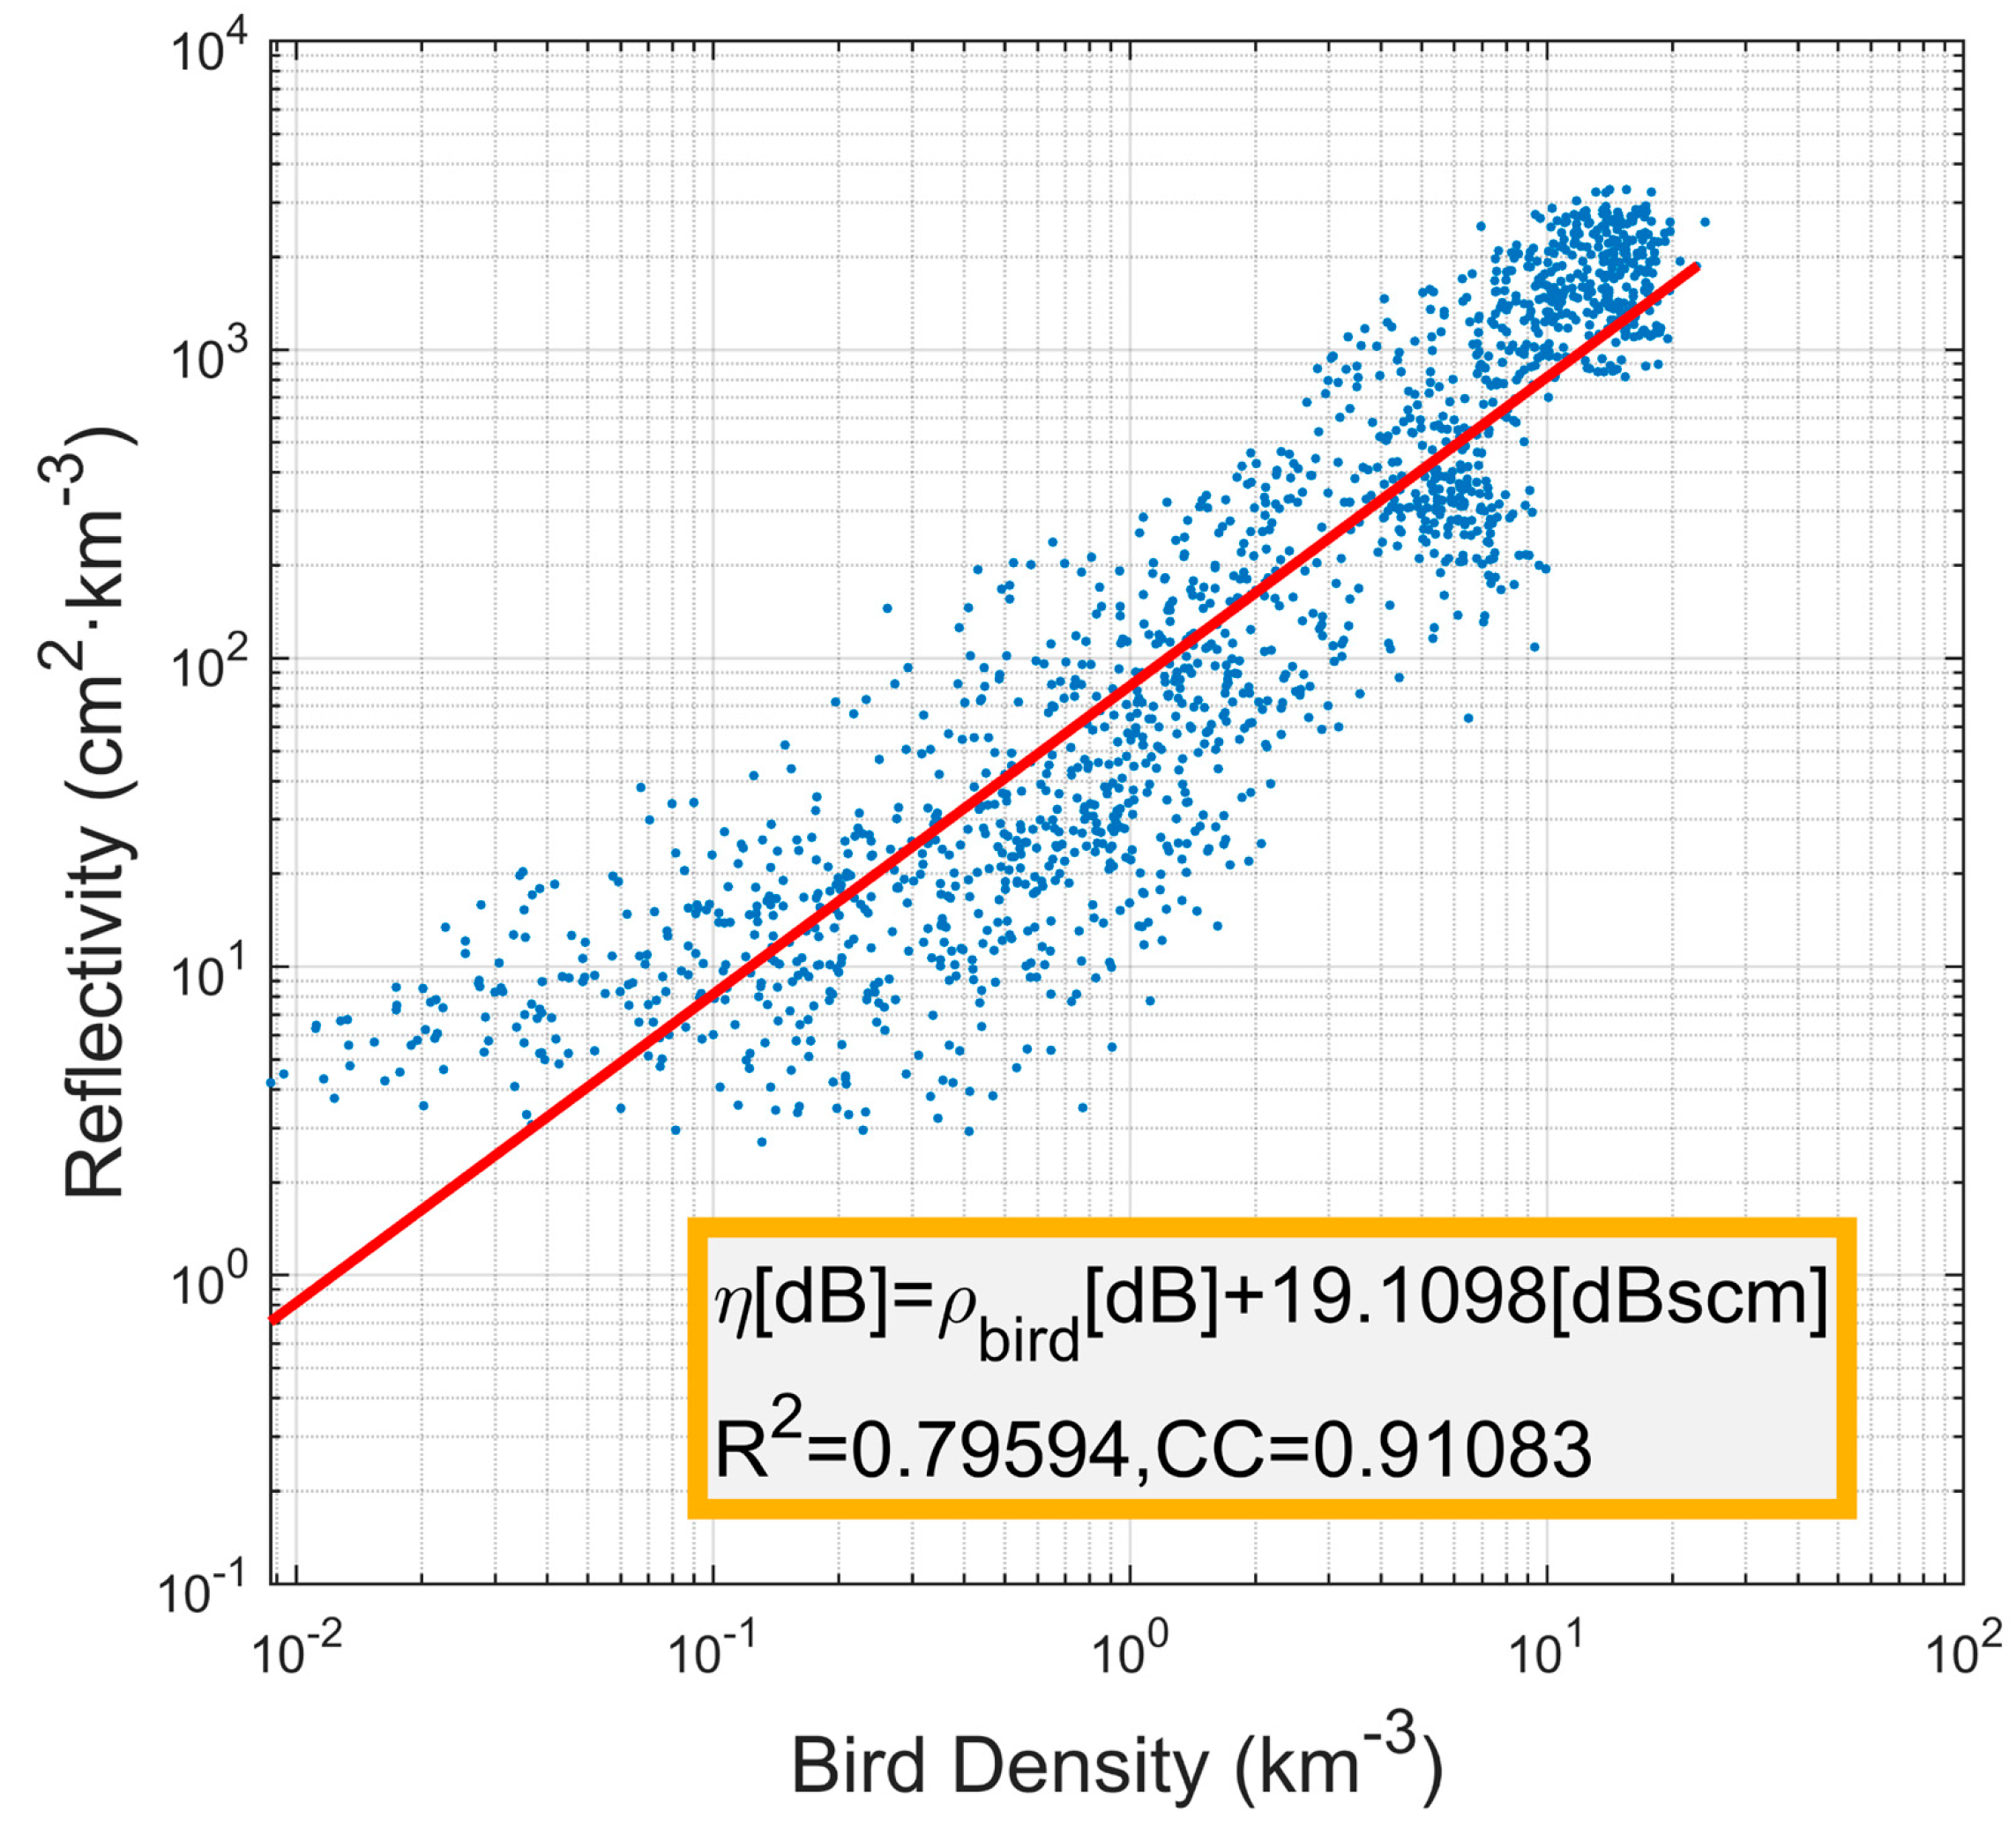
In the above process, we applied the flight capability to roughly distinguish between bird- or insect-dominated echoes in weather radar. The size of insects is much smaller than that of birds, and the insect number in mid-October is low. Even in summer, the reflectivity of insect-dominated echoes accounts for 16% of the total reflectivity [
1]. The influence of insect echoes on these quantification results was limited.
Figure 9 shows the quantification results without excluding insect-dominated echoes. Compared with the results in
Figure 8b, there was little difference between the two.
4. Discussion
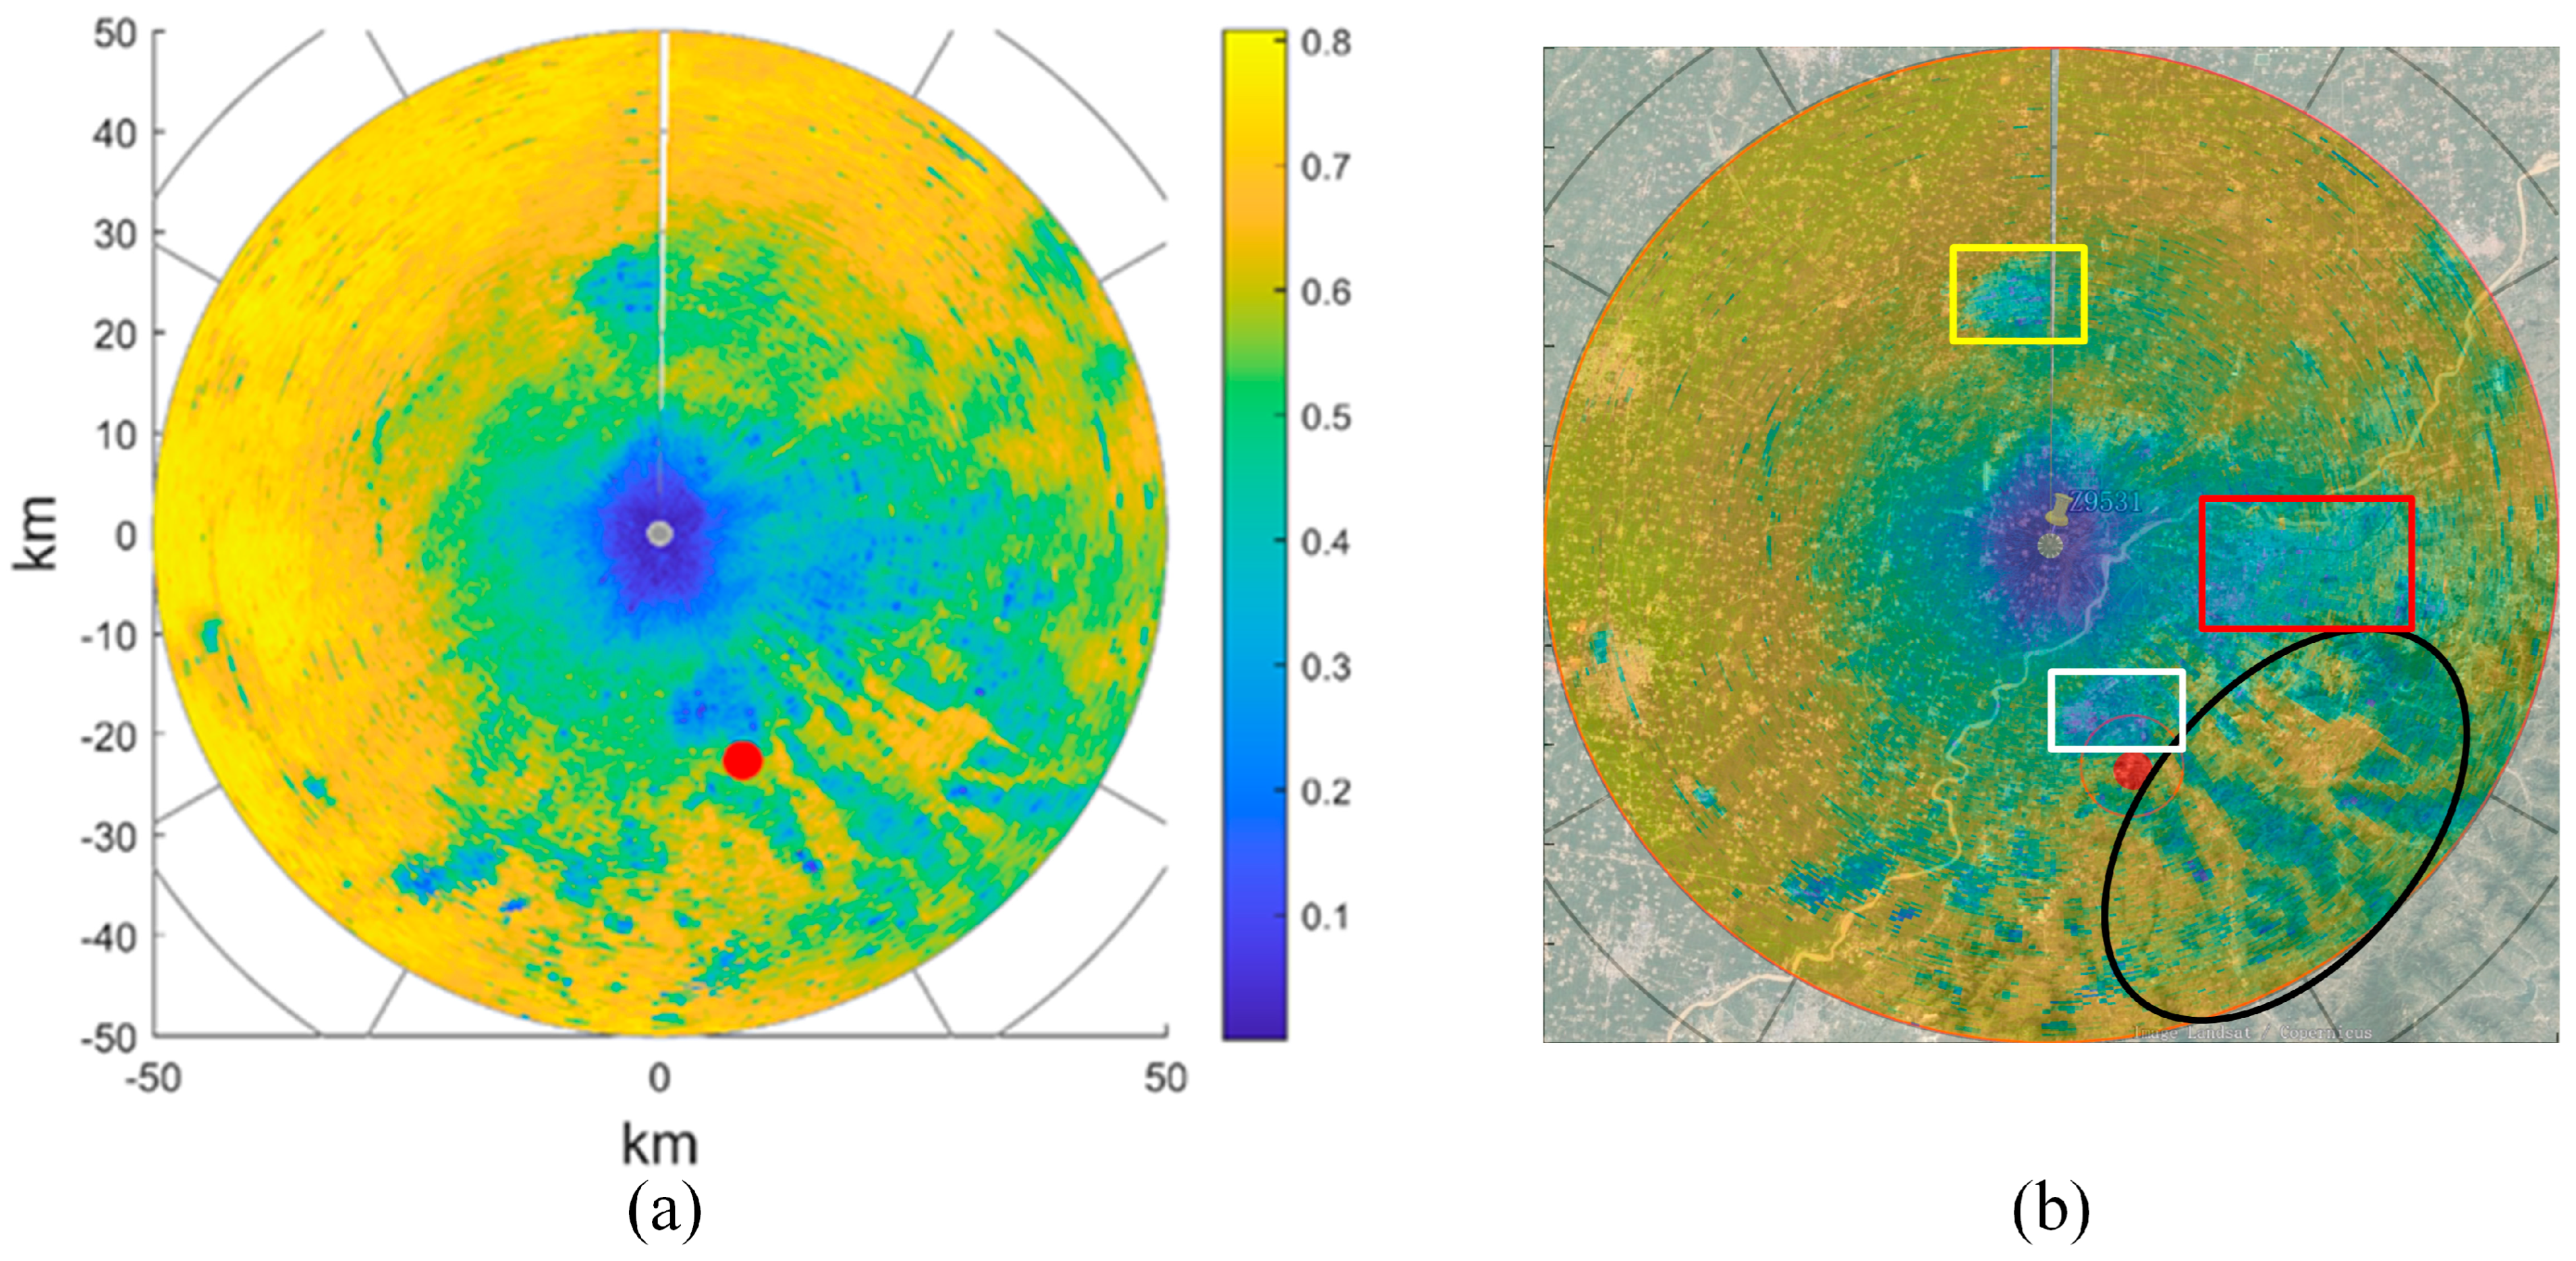
To further analysis the bird distribution pattern, we calculated the correlation coefficient between bird density and reflectivity in different regions, as shown in
Figure 10a. We calculated the correlation coefficient at each pixel based on the mean bird density (between 600 m and 800 m) sequence and the reflectivity sequence (from second elevation) at the corresponding pixel in the weather radar. The correlation in the high-altitude region (with large slant range) was higher than that in the low-altitude region (with small slant range), caused by altitude range mismatch. For the same range gate, the correlation coefficients at different azimuths were similar, indicating that the bird densities in different regions were similar at the same altitude layer. However, it can also be found that significant fluctuations existed to the southeast of the weather radar.
Therefore, the correlation coefficients are mapped onto the topographical map, as shown in
Figure 10b. There are many mountains to the southeast of the weather radar, and the texture features of the correlation coefficient highly coincide with the terrain features, indicated by the black oval. The areas with high correlation coefficients are mostly valleys, while the areas with low correlation coefficients are mountain ridges. In addition, there are some areas with lower coefficients than adjacent areas, indicated by the red (Jinan urban), white (Changqing district of Jinan) and yellow (Yucheng) boxes, respectively. Obviously, urban development and mountainous terrain significantly affect the distribution of aerial migratory birds.
Large common monitoring areas can improve the accuracy and reliability of the quantitative relationship. However, due to the high cost and limited detection range of scanning bird radar, the sampling areas in the experiment are limited, which could introduce some estimate errors. The RCS of birds also fluctuates with the aspect angle, which further adds to the complexity of the measurements. To mitigate these issues, collecting data over a long period of time can help to improve accuracy and reliability by capturing a broader range of bird behaviors and aspects. In the next stage of research, it would be beneficial to consider the use of additional scanning bird radars or more powerful radars to extend the coverage to a larger area. This would allow for a more comprehensive and representative sampling of bird populations and migratory patterns.
Combining other observations is beneficial for the quantification and analysis of animal migration. For example, we can evaluate the migration rate of different birds with the help of eBird data [
27]; using data from wind radar, the flight strategies of birds under different meteorological conditions can be explored. Fusion and analysis of information from different sensors or data sources can provide a more comprehensive and accurate analysis and judgment of animal migration. In future animal migration monitoring, a greater number and variety of sensors will be used, resulting in a large amount of monitoring data, and multimodal methods [
28,
29] that integrate different types of data will receive increasing attention.
5. Conclusions
Weather radars have a significant advantage in monitoring flying animal migration, aiding our understanding of migration process [
30,
31]. However, the application of weather radar in studying animal migration in China is still in the early stages, and requires further investment in related research.
The establishment of a quantification model is crucial for retrieving bird numbers using weather radar. We analyzed the reflection model for birds in weather radar, and provided an effective method to establish a quantification model based on field experiments in China. The quantitative relationship was acquired with an R2 of 0.79, and the average bird RCS in Jinan was 19.09 dBscm (i.e., 81.19 cm2; 95% confidence interval, CI: 18.92–19.27) for the S-band weather radar, which is meaningful for bird migration studies based on weather radars in China. In addition, through the correlation analysis, we found that the aerial distribution of birds was impacted by ground terrain.


