Article

Mapping Soybean Maturity and Biochemical Traits Using UAV-Based Hyperspectral Images

1
College of Information and Management Science, Henan Agricultural University, Zhengzhou 450002, China
2
Key Laboratory of Quantitative Remote Sensing in Agriculture of Ministry of Agriculture, Beijing Research Center for Information Technology in Agriculture, Beijing 100097, China
3
School of Surveying and Land Information Engineering, Henan Polytechnic University, Jiaozuo 454000, China
4
Institute of Quantitative Remote Sensing and Smart Agriculture, Henan Polytechnic University, Jiaozuo 454000, China
5
Key Lab of Smart Agriculture System, Ministry of Education, China Agricultural University, Beijing 100083, China
6
Key Research Institute of Yellow River Civilization and Sustainable Development & Collaborative Innovation Center on Yellow River Civilization of Henan Province, Henan University, Kaifeng 475001, China
*
Author to whom correspondence should be addressed.
These authors contributed equally to this work.
Remote Sens. 2023, 15(19), 4807; https://doi.org/10.3390/rs15194807
Submission received: 25 August 2023 / Revised: 1 October 2023 / Accepted: 2 October 2023 / Published: 3 October 2023
(This article belongs to the Special Issue Synergy of UAV Imagery and Artificial Intelligence for Agriculture)

Abstract

:
Soybeans are rich in high-quality protein and raw materials for producing hundreds of chemical products. Consequently, soybean cultivation has gained widespread prevalence across diverse geographic regions. Soybean breeding necessitates the development of early-, standard-, and late-maturing cultivars to accommodate cultivation at various latitudes, thereby optimizing the utilization of solar radiation. In the practical process of determining the maturity of soybean breeding materials within the breeding field, the ripeness is assessed based on three critical criteria: pod moisture content, leaf color, and the degree of leaf shedding. These parameters reflect the crown structure, physicochemical parameters, and reproductive organ changes in soybeans during the maturation process. Therefore, methods for analyzing soybean maturity at the breeding plot scale should match the standards of agricultural experts to the maximum possible extent. This study presents a hyperspectral remote sensing approach for monitoring soybean maturity. We collected five periods of unmanned aerial vehicle (UAV)-based soybean canopy hyperspectral digital orthophoto maps (DOMs) and ground-level measurements of leaf chlorophyll content (LCC), flavonoids (Flav), and the nitrogen balance index (NBI) from a breeding farm. This study explores the following aspects: (1) the correlations between soybean LCC, NBI, Flav, and maturity; (2) the estimation of soybean LCC, NBI, and Flav using Gaussian process regression (GPR), partial least squares regression (PLSR), and random forest (RF) regression techniques; and (3) the application of threshold-based methods in conjunction with normalized difference vegetation index (NDVI)+LCC and NDVI+NBI for soybean maturity monitoring. The results of this study indicate the following: (1) Soybean LCC, NBI, and Flav are associated with maturity. LCC increases during the beginning bloom period (P1) to the beginning seed period (P3) and sharply decreases during the beginning maturity period (P4) stage. Flav continues to increase from P1 to P4. NBI remains relatively consistent from P1 to P3 and then drops rapidly during the P4 stage. (2) The GPR, PLSR, and RF methodologies yield comparable accuracy in estimating soybean LCC (coefficient of determination (R2): 0.737–0.832, root mean square error (RMSE): 3.35–4.202 Dualex readings), Flav (R2: 0.321–0.461, RMSE: 0.13–0.145 Dualex readings), and NBI (R2: 0.758–0.797, RMSE: 2.922–3.229 Dualex readings). (3) The combination of the threshold method with NDVI < 0.55 and NBI < 8.2 achieves the highest classification accuracy (accuracy = 0.934). Further experiments should explore the relationships between crop NDVI, the Chlorophyll Index, LCC, Flav, and NBI and crop maturity for different crops and ecological areas.

1. Introduction

Soybeans are rich in high-quality protein and raw materials for producing hundreds of chemical products; thus, they are widely grown around the world [1]. In China, soybean cultivation spans from the northernmost grain-producing areas in the northeast to the southernmost subtropical region of Guangdong (across latitudes ranging from approximately 20°N to 48°N) [2]. This geographic range necessitates soybean breeding efforts to develop early-, standard-, and late-maturing varieties that are capable of thriving at diverse latitudes, thereby optimizing the utilization of solar radiation [3]. Hence, the development of a rapid and efficient crop key indicator monitoring system is of paramount importance for soybean breeding decisions and production management [2,4].
A typical soybean breeding site involves thousands of soybean breeding materials. To determine these materials’ early-, standard-, and late-maturing characteristics, breeding workers need to traverse experimental fields during the maturity period to conduct frequent assessments and document soybean maturity information [5]. This is a time-consuming and labor-intensive method, making it difficult for conventional survey methods to efficiently record the maturity date for all materials within a short timeframe [5]. Furthermore, these labor-intensive methods inevitably lead to the personal biases of numerous breeding workers influencing the collected information.
Over the past two decades, low-altitude unmanned aerial vehicle (UAV) remote sensing technology has found widespread use in agricultural crop parameter monitoring [6,7,8,9]. Compared with aerial and space-borne remote sensing, UAV remote sensing exhibits reduced requirements for takeoff and landing conditions, lower costs, and enhanced flexibility [10]. Most importantly, when combined with high-definition digital cameras, multispectral cameras, and hyperspectral cameras, low-altitude UAV remote sensing can acquire high-resolution texture remote sensing images that exceed those collected using traditional aerial and space-borne remote sensing techniques. As a result, UAV remote sensing technology has been effectively used in monitoring studies of crop phenotypic parameters such as nitrogen content [11], leaf chlorophyll content [9,12,13], above-ground biomass [6,7,8], the leaf area index [14,15], irrigated areas [16], and more. Presently, existing research on the extraction of crop maturity information from remote sensing data primarily falls into three categories: (1) time series vegetation index analysis [17,18], (2) crop model and data assimilation [19,20], and (3) machine learning methods [12,21,22].
Time series vegetation index analysis is a widely employed traditional approach in remote sensing-based crop maturity assessments [23]. Various remote sensing vegetation index curve feature-detection algorithms (e.g., inflection points and transition points) can be utilized to identify crop phenological stages [17]. The primary process within time series vegetation index curve analysis involves selecting various filtering algorithms to construct time series vegetation index curves. Examples of these algorithms include Fourier filters [23], Savitzky–Golay filters [17], asymmetric Gaussian functions [24], and double logistic functions [18]. These filtering algorithms smooth noise and fluctuations in the raw time series vegetation index data and subsequently identify crops’ sowing and harvesting periods through threshold inflection points on the time series vegetation index curves, thus revealing crop phenological stages [17,18]. This implies that the detection and determination of crop phenological features from vegetation index curves is often possible sometime after the actual phenological events. Additionally, vegetation index time series are susceptible to the influence of observation noise in the vegetation growth curve, underscoring the requirements for both the temporal and spectral resolutions of remote sensing imagery.
The crop model and data assimilation approach rely more on crop models and meteorological data as the primary components [19,20]. The remote sensing-estimated crop parameters serve as auxiliary variables to calibrate the crop model, thereby providing a maturity date prediction based on the crop model [20,25]. Such methods are more commonly validated at a large regional scale primarily due to the distinct differences in meteorology and crop types at the regional level [26], leading to significant variations in crop maturity periods. In contrast, there is generally a sufficient nutrient and water supply within breeding fields. Nevertheless, the variations among different varieties of the same crop type (such as differences in traits, including the accumulated temperature for maturity) are difficult for crop models to capture. Consequently, widely used crop models are rarely used to predict crop maturity within breeding fields.
Machine learning techniques have been widely used in agricultural crop parameter monitoring and phenological information extraction in the last two decades [12,21,22]. Commonly used machine learning methods include traditional techniques such as neural networks [27] and random forest (RF) regression [28] and contemporary deep learning technologies [29] such as AlexNet, very deep convolutional networks, and residual network. Machine learning has yielded significant achievements in crop classification [10]. However, machine learning models cannot interpret crop maturity judgments, a common challenge associated with black-box models [30,31]. Despite this limitation, deep learning models continue to be extensively applied in estimating crop trait parameters [32].
Soybean pod moisture content, leaf color, and leaf shedding degree are crucial indicators for marking soybean maturity in the breeding field [33]. Soybean leaf color can be characterized using the leaf chlorophyll content (LCC) [34] or nitrogen balance index (NBI) [35], while leaf shedding can be represented by the normalized difference vegetation index (NDVI). Hence, a technology that analyzes the soybeans’ intrinsic spectral properties (via NDVI) [36], LCC, NBI, and flavonoids (Flav), in a time series context, offers a more theoretically grounded and operationally feasible approach to soybean maturity monitoring.
This study aims to propose a UAV-based hyperspectral remote sensing method for monitoring soybean maturity. Four key tasks were undertaken. First, this research study involved collecting five periods of soybean canopy hyperspectral digital orthophoto maps (DOM) and ground-level measurements of LCC, NBI, and Flav from a breeding farm. Subsequently, our analysis explored the correlation between soybean LCC, NBI, Flav, and the five growth stages. Then, soybean LCC, NBI, and Flav estimations were derived through UAV-based remote sensing. Lastly, soybean maturity monitoring was carried out using UAV-based hyperspectral remote sensing.
This study aimed to address three key research questions:
(1)
What are the variations in soybean LCC, NBI, and Flav across the five growth stages and how are they related to soybean maturity?
(2)
Can methodologies combining remote sensing (RS) with Gaussian process regression (GPR), partial least squares regression (PLSR), and RF provide accurate estimations of soybean LCC, NBI, and Flav?
(3)
Can a threshold-based approach combined with NDVI+LCC and NDVI+NBI facilitate the remote sensing monitoring of soybean maturity?

2. Materials and Methods

2.1. Field Experimentation

2.1.1. Design of Field Experiments

The experimental site is located in Jiaxiang County, Jining City, Shandong Province, China (Figure 1). Jiaxiang County lies within the geographical coordinates of 116°22′10″–116°22′20″E longitude and 35°25′50″–35°26′10″N latitude. It falls within a warm temperate monsoon region with a continental climate. The annual average temperature is 13.9 °C, with a daily minimum of −4 °C and a daily maximum of 32 °C. The average elevation ranges from 35 to 39 m, and the annual rainfall is approximately 701.8 mm. Ground-level measurements of NBI and Flav, along with UAV-based hyperspectral imagery, were collected across five periods: 29 July 2015 (beginning bloom period, P1), 13 August 2015 (beginning pod period, P2), 31 August 2015 (beginning seed period, P3), 17 September 2015 (beginning maturity period, P4), and 28 September 2015 (full maturity period, P5).

2.1.2. Field LCC, Flav, and NBI Measurements

Field LCC, Flav, and NBI measurements were obtained using a portable sensor, namely, the Dualex 4 from Force-A (Orsay, France). The procedure involved measuring the chlorophyll content of the uppermost two leaves of the soybean plants. This measurement process was repeated five times at the center of each soybean plot, and the average of these five measurements was calculated to obtain the LCC for that specific area of soybean growth. The results of our analysis of the soybean canopy chlorophyll dataset are presented in Table 1. The results reveal that, over the entire period, the minimum NBI value for soybeans occurred at P4, registering 4.66 Dualex readings, while the maximum value was recorded at P3, reaching 34.67 Dualex readings. Furthermore, the maximum Flav value for soybeans occurred at P4 (1.882 Dualex readings), whereas the minimum value appeared at P2, (0.933 Dualex readings).

2.2. Hyperspectral DOM

2.2.1. UAV Flights

We used a Cubert ultra-high-definition (UHD) 185 snapshot hyperspectral spectrometer (Cubert GmbH Inc., Ulm, Germany) mounted on a DJI S1000 UAV to collect soybean canopy hyperspectral images. The UAV was operated at a flight altitude of 50 m and a speed of 2 m per second. The Cubert UHD 185 spectrometer has a weight of 0.47 kg and dimensions of 195 × 67 × 60 mm³. The spectrometer covers a wavelength range of 450–950 nm. After each exposure and following image fusion, a hyperspectral image (1000 × 1000 × 125 bands, spectral resampling: 4 nm) was generated. An image stitching process was employed to combine all images together.

2.2.2. UAV DOM Stitching

After image acquisition and stitching, a high-resolution hyperspectral DOM of the canopy was generated. To accurately identify soybean plots, regions of interest (ROIs) were selected based on the hyperspectral DOM. The central rectangular area of each image was chosen as an ROI (Figure 1). Subsequently, we used the ROI tool in ENVI software (Exelis Visual Information Solutions, Boulder, CO, USA) to extract the soybean canopy spectral reflectance from the high-resolution hyperspectral DOM.

2.3. Vegetation Index and Statistical Regression Techniques

Table 2 presents the widely used vegetation indices and the first derivative (FD) of canopy hyperspectral reflectance. These spectral vegetation indices are established using mathematical operations to enhance the vegetation information, most of which are constructed based on the red, green, blue, and near-infrared bands’ reflectance.
In this study, we used GPR [48], RF [21,49], and PLSR [50,51] techniques to estimate soybean LCC, Flav, and NBI. These techniques have been extensively applied in agricultural crop parameter estimation studies.
GPR is a supervised learning method that can be understood as a form of regression wherein data are fitted to a Gaussian process to enable predictions [48]. GPR can be viewed from two perspectives: the weight space view and the function space view, both achieving the same outcomes. GPR is also used when tuning the hyperparameters of machine learning models and is more efficient than a grid search or random search. Therefore, GPR is a versatile and interpretable probabilistic model.
PLSR is a statistical method that seeks to identify a linear regression model by projecting predictor variables and response variables into a new space [51]. PLSR is used to determine the fundamental relationship between two matrices, X and Y, utilizing a latent variable approach that models the covariance structure between these two spaces.
RF regression is an ensemble learning method that combines multiple decision tree models to address regression problems [21,49]. Its fundamental principle is that each tree is built by randomly selecting a subset of features from the samples and constructing decision trees based on the training data. Finally, the results of all decision trees are combined to produce the final prediction. The advantages of random forest regression include its ability to handle complex regression problems and improve prediction accuracy. However, its disadvantages include its higher degree of computational complexity and longer processing times.

2.4. Methods for Soybean Maturity Assessment

2.4.1. Artificial Methods for Determining Soybean Maturity

This study shows notable variations in the maturity stages of the soybean materials, including normal-, early-maturing, and late-maturing varieties. The maturity stages of these materials fall between stages P4 and P5. During field measurements at stages P4 and P5, the maturity status of these soybean materials was manually annotated. In the practical process of determining the maturity of soybean materials within the breeding field, ripeness is assessed based on three critical criteria: pod moisture content, leaf color, and the degree of leaf shedding. During the on-site marking of soybean maturity, breeding personnel assessed the maturity status of each planting plot’s soybean materials based on their specific characteristics.

2.4.2. Histogram and Box Plot Analysis Techniques for Determining the Range of LCC and NBI in Mature Soybeans

A histogram is a graphical representation of data distribution; it is used to depict how data are distributed across various intervals [52]. The horizontal axis of a histogram represents data intervals, while the vertical axis represents either the frequency or the relative frequency of the data within those intervals. Histograms aid in analyzing the data’s central tendency, dispersion, and shape.
A box plot, also known as a box-and-whisker plot, is a statistical diagram that displays the distribution of a dataset’s variability [53]. It is widely employed to depict the original data distribution characteristics and can be used to compare distribution features across multiple datasets. Box plots reveal various key summary statistics of a dataset, such as the maximum value, minimum value, median, and upper and lower quartiles. As a result, they are beneficial for analyzing multi-temporal variations in LCC, Flav, and NBI during the soybean crop maturation process.

2.4.3. Optimal Threshold Determination for Soybean Maturation Based on NDVI+NBI and NDVI+LCC

The direct cause of soybean leaves turning yellow is the continuous decrease in LCC during the soybean crop maturation process [54]. Additionally, the Flav in the canopy leaves continues to increase. Therefore, both LCC and NBI have the potential to serve as criteria for determining the maturity of soybean materials. Furthermore, significant leaf shedding can be reflected in the NDVI of soybean materials [55]. Analyzing the multi-temporal variations and spatial distribution of LCC, Flav, and NBI in different planting zones of soybean materials contributes to developing a soybean maturation monitoring method.
Suppose that the LCC, NBI, and Flav of mature and green soybean crops follow a normal distribution. In that case, it is possible to use histogram analysis and box plot analysis to determine the potential threshold range for distinguishing mature and immature soybean crops based on the maximum possible limits of NBI and Flav for mature and green soybean crops.
Therefore, in this study, the maturity assessment of soybean materials was conducted using a threshold method with two assessment indicators: (1) NDVI+NBI and (2) NDVI+LCC. The determination of threshold values was aided by the histogram and box plot analysis techniques, followed by an exhaustive search method to narrow the threshold search range. Specifically, during the maturity period, if NDVI fell below the threshold limit or LCC (and NBI) fell below the threshold limit, the soybean material was classified as mature.

2.5. Accuracy Evaluation Techniques

A total of 206 sample sets were collected in this study, from which 137 sets were used to construct the NBI and Flav models, while the remaining 69 sets were reserved for model validation. The accuracy of the models and methods presented in this study was assessed using the coefficient of determination (R2) and the root mean square error (RMSE). A confusion matrix (Table 3), also known as an error matrix, was used to reflect the accuracy of image classification.
The confusion matrix-based approach allowed us to calculate the model’s overall accuracy, producer accuracy, and user accuracy [56]. The calculation of accuracy was carried out as follows:
o v e r   a l l a c c u r a c y = T I + T M H T I + T M H + F I + F M H p r o d u c e r   a c c u r a c y = T I T I + F I u s e r   a c c u r a c y = T I T I + F M H
where TI and TMH represent the number of mature and immature samples that are correctly classified as immature and mature, respectively. FI and FMH indicate the number of immature samples in the confusion matrix that are incorrectly classified as mature and the number of mature/harvested samples that are incorrectly classified as immature, respectively.

3. Results

3.1. Assessment of Soil and Soybean Canopy Spectral and Physiological Characteristics

3.1.1. Analysis of Physiological Parameters in the Soybean Canopy

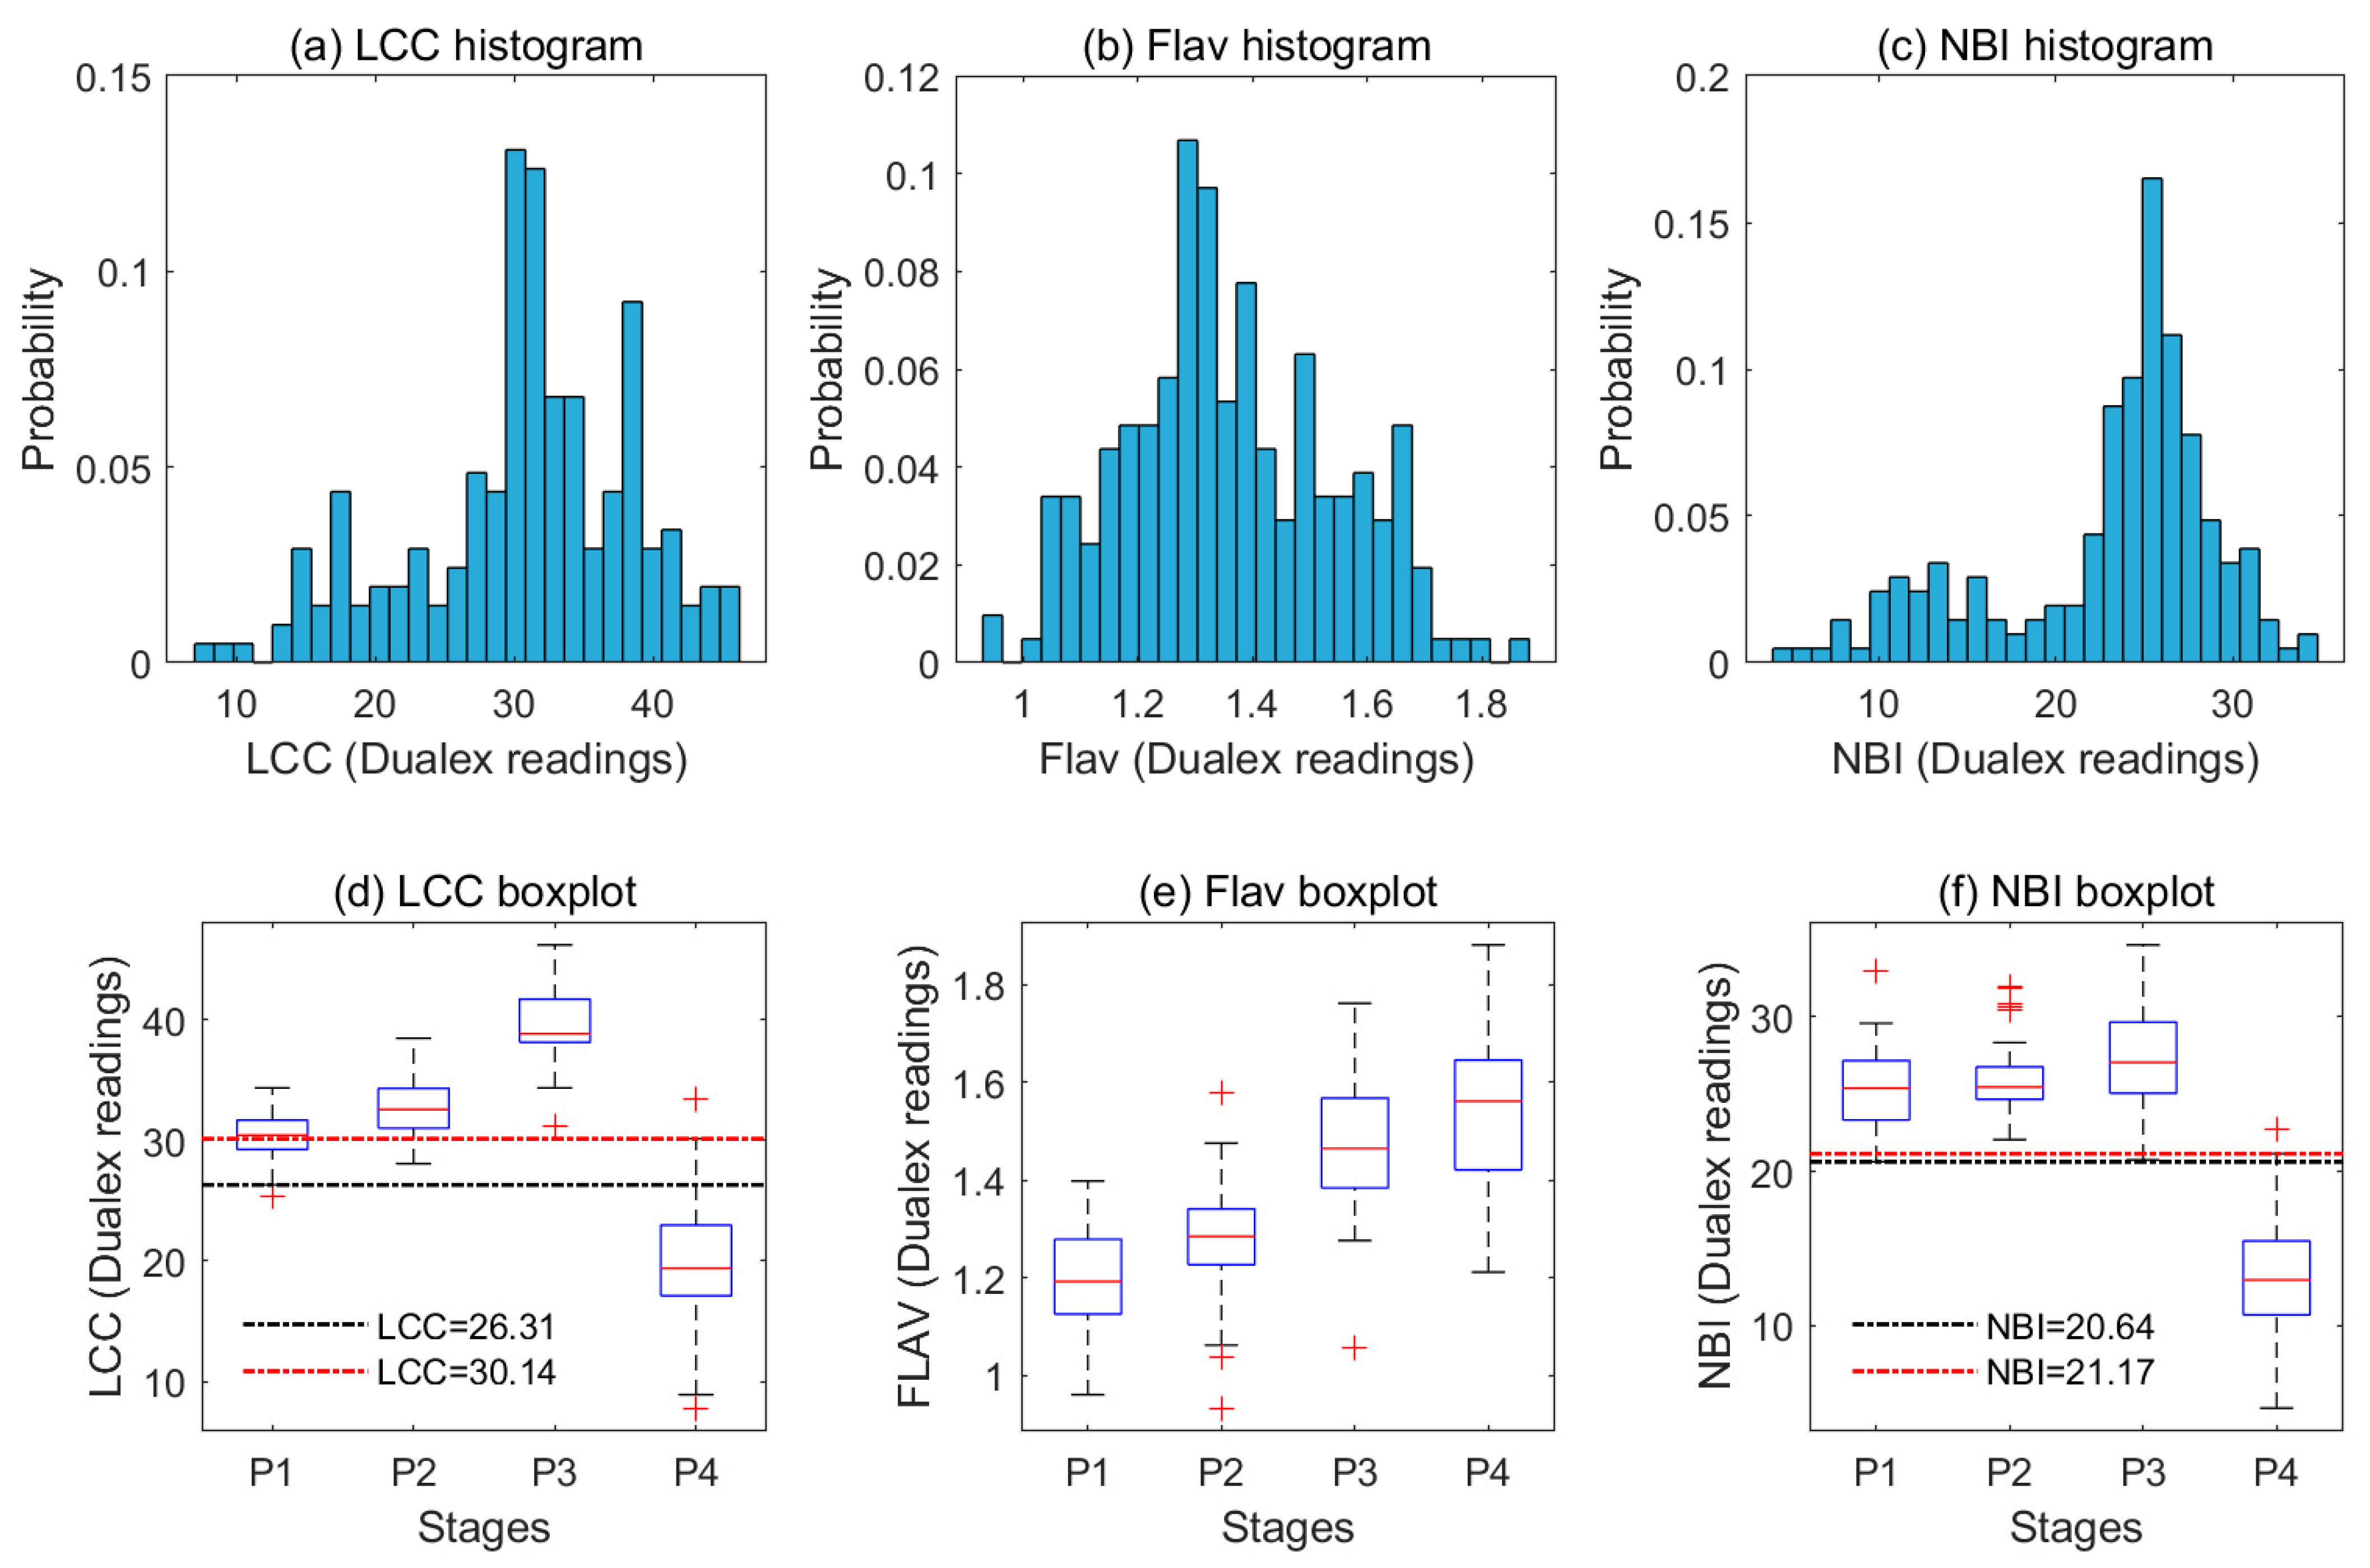
We conducted a histogram analysis of ground-based LCC, Flav, and NBI measurements, and our results reveal (Figure 2) that the LCC distribution of soybeans in the five time periods exhibited an approximately normal distribution, with the majority of samples falling within the range of 25 to 40. On the other hand, Flav samples were mainly within the range of 1.2 to 1.6 Dualex readings. The NBI grayscale histogram displayed a distribution that combined two overlapping normal distributions (P1 to P3 and P4, see Figure 2c,f).
Furthermore, we utilized box plot analysis to examine the distribution of soybean LCC, Flav, and NBI measurements during the P1 to P4 stages. Due to the scarcity of samples during the P5 stage, a separate box plot analysis was not conducted. Our findings reveal that LCC exhibited a continuous increase from the P1 to P3 stages before experiencing a rapid decrease in the P4 stage. Soybean flavonoid content showed a consistent increase from the P1 stage to the P4 stage.
Figure 2c,f show histograms and box plots that correspond to the soybean samples, including the immature (P1 to P3), near-mature, and mature samples (P4). As per our analysis of the histogram results (Figure 2c), NBI data roughly follow a normal distribution during the P1 to P3 period (NBI > 20.64, in Figure 2c,f), with an average value of 25.41–27.24 (Table 1). Our study suggests that NBI rapidly decreases during soybean maturation. The soybean samples from the P4 period indicate that the NBI values of near-mature or mature crops (P4, NBI < 21.17, in Figure 2f) are notably lower than those of green soybeans (P1 to P3, in Figure 2f), with an average value of 13.23 (Table 1). Figure 2c,f show notable differences in NBI values between immature (P1 to P3), near-mature, and mature samples (P4). This characteristic indicates that NBI may be an effective indicator for extracting crop maturity information.

3.1.2. Analysis of Soil and Soybean Canopy Spectra, FD Spectra, and Vegetation Indices

Figure 3a–c show the spectral curves of immature soybeans, a mature soybean canopy, and the soil, respectively. Our findings indicate that green soybeans exhibit distinct vegetation spectral curve characteristics, with prominent absorption features in the red and blue regions and strong reflection in the near-infrared area. In contrast, mature soybeans show fewer distinct peaks in green and near-infrared reflections, which can be attributed to decreased LCC during the mature stage, weakening the green vegetation feature. The spectral curve of the soil appears smoother, with the main differences from mature soybean occurring around the 660–700 nm mark.
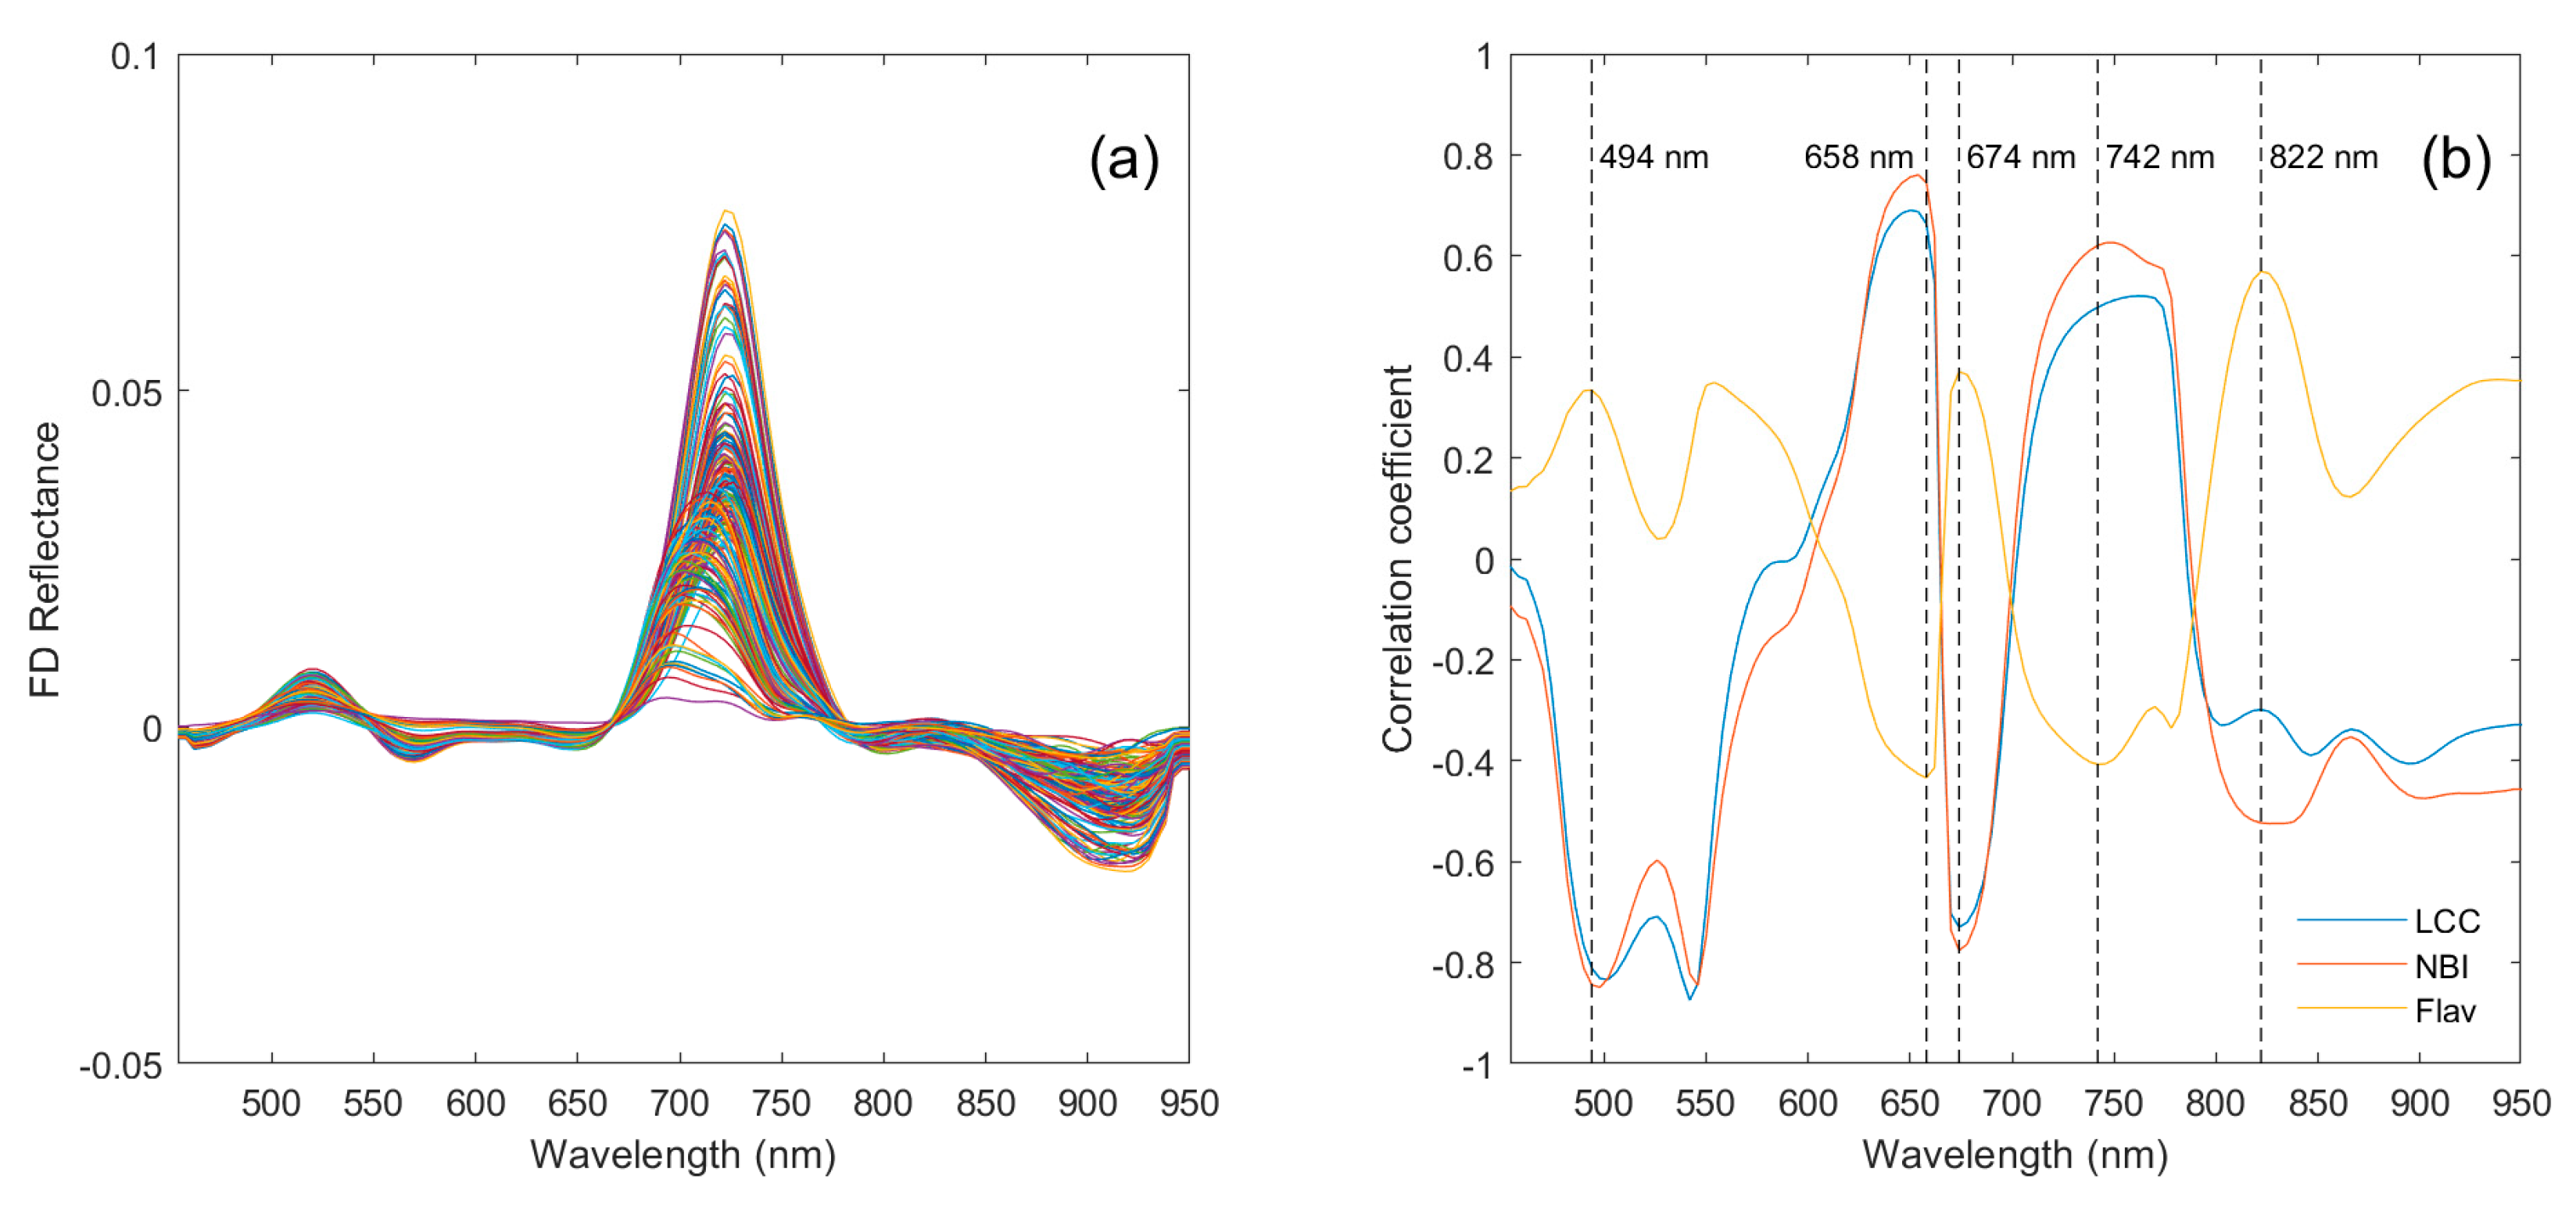
We conducted a correlation analysis between soybean LCC, NBI, Flav, and the calculated FD spectra. The correlation analysis results for soybean FD spectra (and vegetation indices) with LCC are similar to those with NBI (Figure 4b) and Flav (Figure 5). Our analysis reveals that the FD spectra in the red, red-edge, and other wavelength bands exhibit higher correlations with LCC, NBI, and Flav. Therefore, the FD spectra at FD506 nm, FD638 nm, FD682 nm, FD742 nm, and FD882 nm were selected to build the LCC, Flav, and NBI estimation models. We also analyzed the correlation between the selected vegetation indices and soybean NBI and Flav. The results indicate that most of the chosen vegetation indices positively correlate with NBI (and LCC), except for the ratio of transformed chlorophyll absorption in reflectance index (TCARI) and optimized soil-adjusted vegetation index (OSAVI) (TCARI/OSAVI) and red-edge-based TCARI/OSAVI (TCARI/OSAVIRE). Conversely, most are negatively correlated with Flav (except for TCARI/OSAVI and TCARI/OSAVIRE).

3.2. Estimation of LCC, Flav, and NBI Indices

3.2.1. Remote Sensing Estimation of LCC, Flav, and NBI Indices

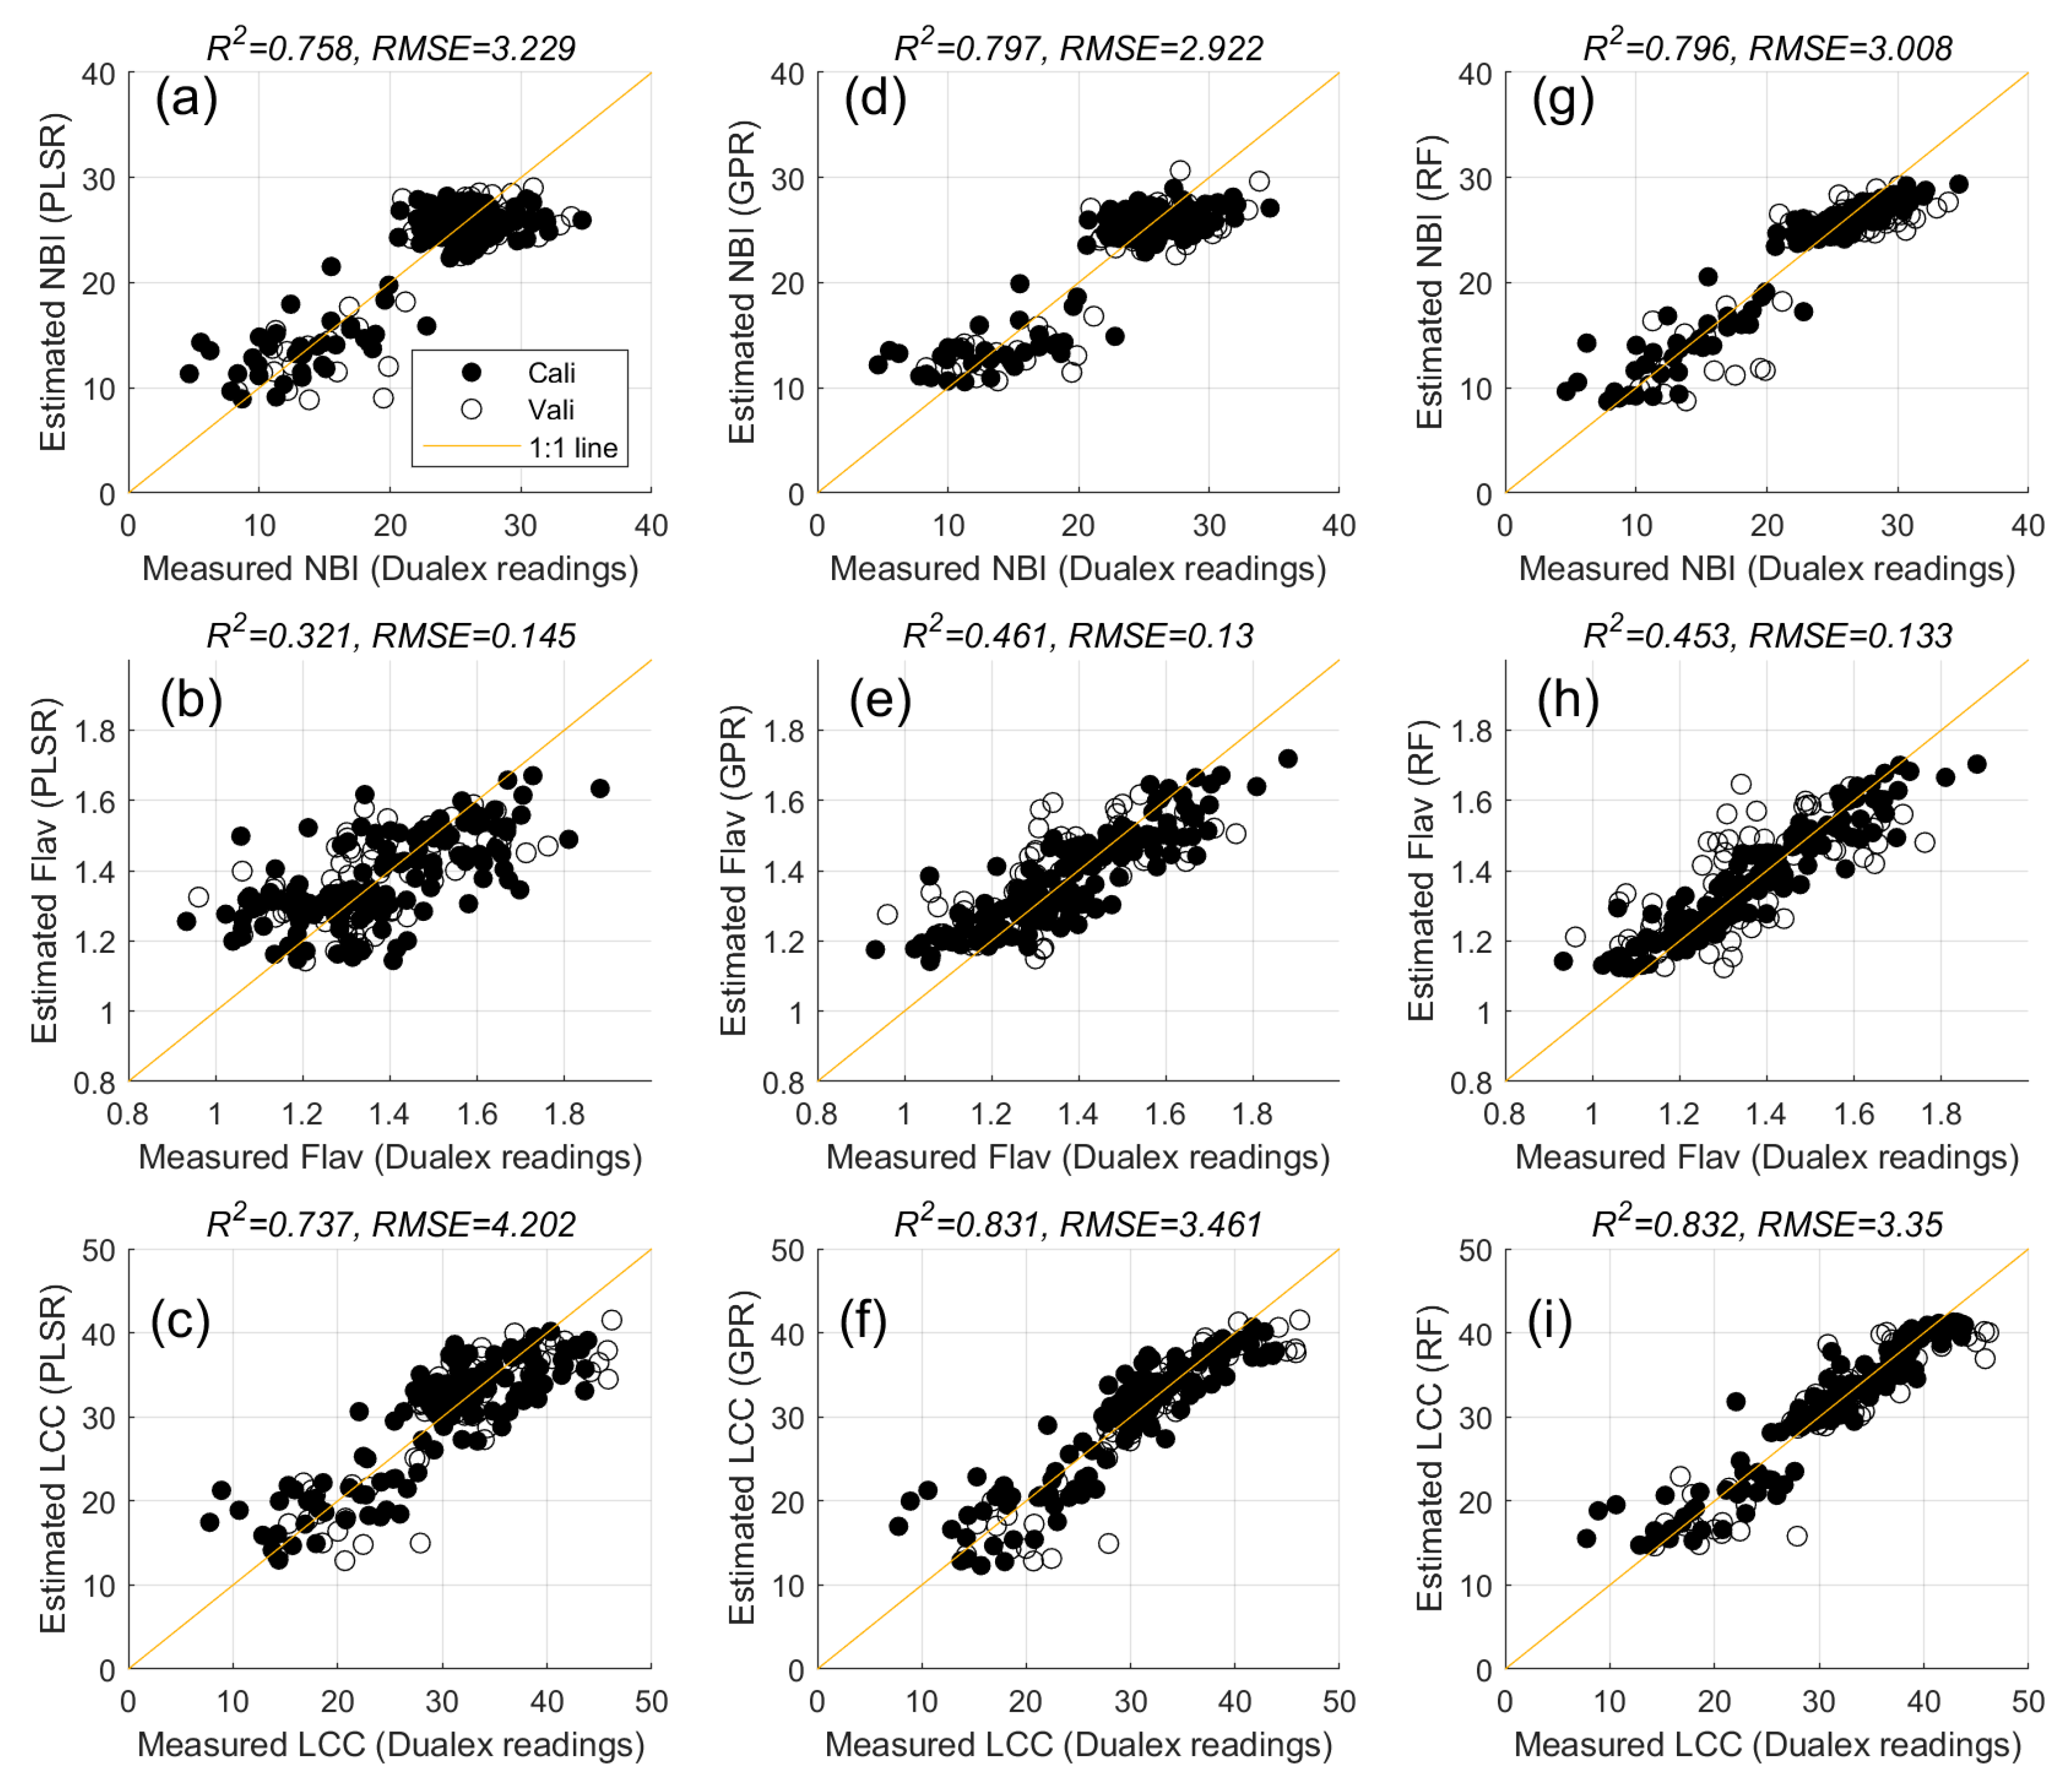
We calibrated and validated the LCC, Flav, and NBI estimation models using the selected FD spectra, vegetation indices, and three statistical regression techniques: PLSR, GPR, and RF. Figure 6 illustrates the performance of the PLSR, GPR, and RF models based on the calibration and validation datasets. Our results demonstrate that the three estimation techniques yielded similar results for LCC (R2: 0.737–0.832, RMSE: 3.35–4.202 Dualex readings), Flav (R2: 0.321–0.461, RMSE: 0.13–0.145 Dualex readings), and NBI (R2: 0.758–0.797, RMSE: 2.922–3.229 Dualex readings). Overall, the GPR technique achieved the best estimation accuracy, particularly excelling in estimating NBI and Flav.

3.2.2. Remote Sensing Mapping of LCC, Flav, and NBI Indices

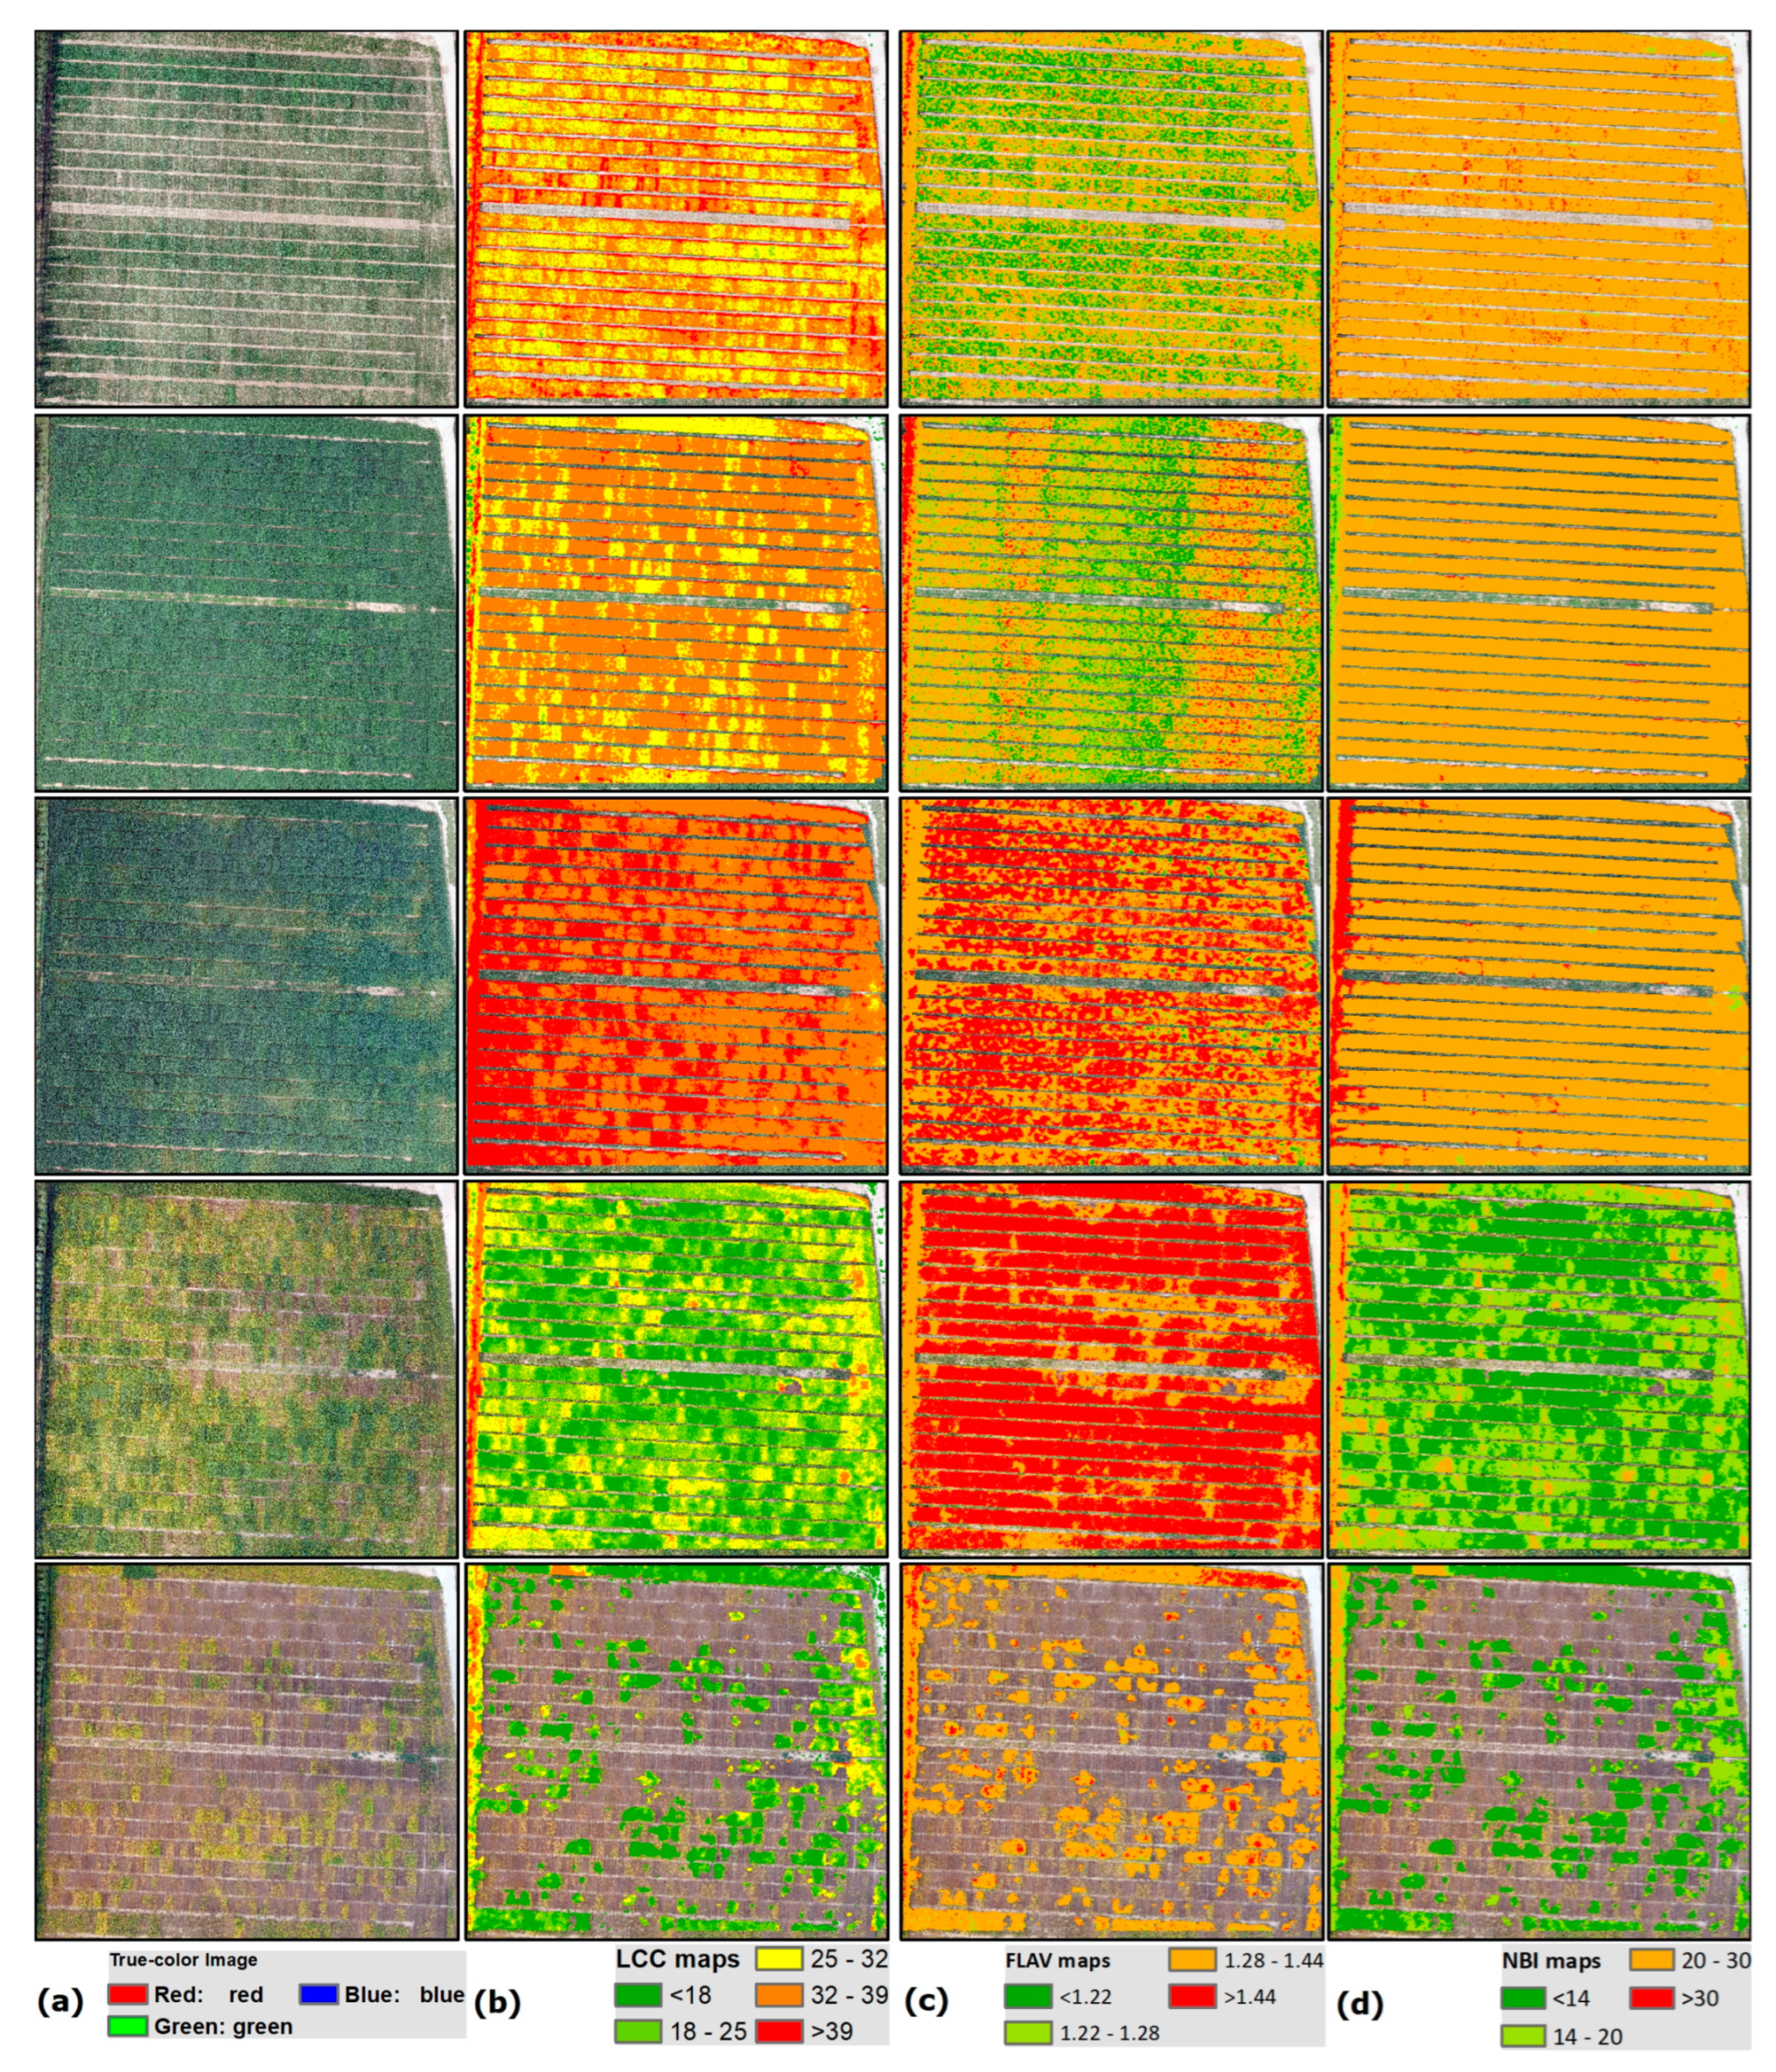
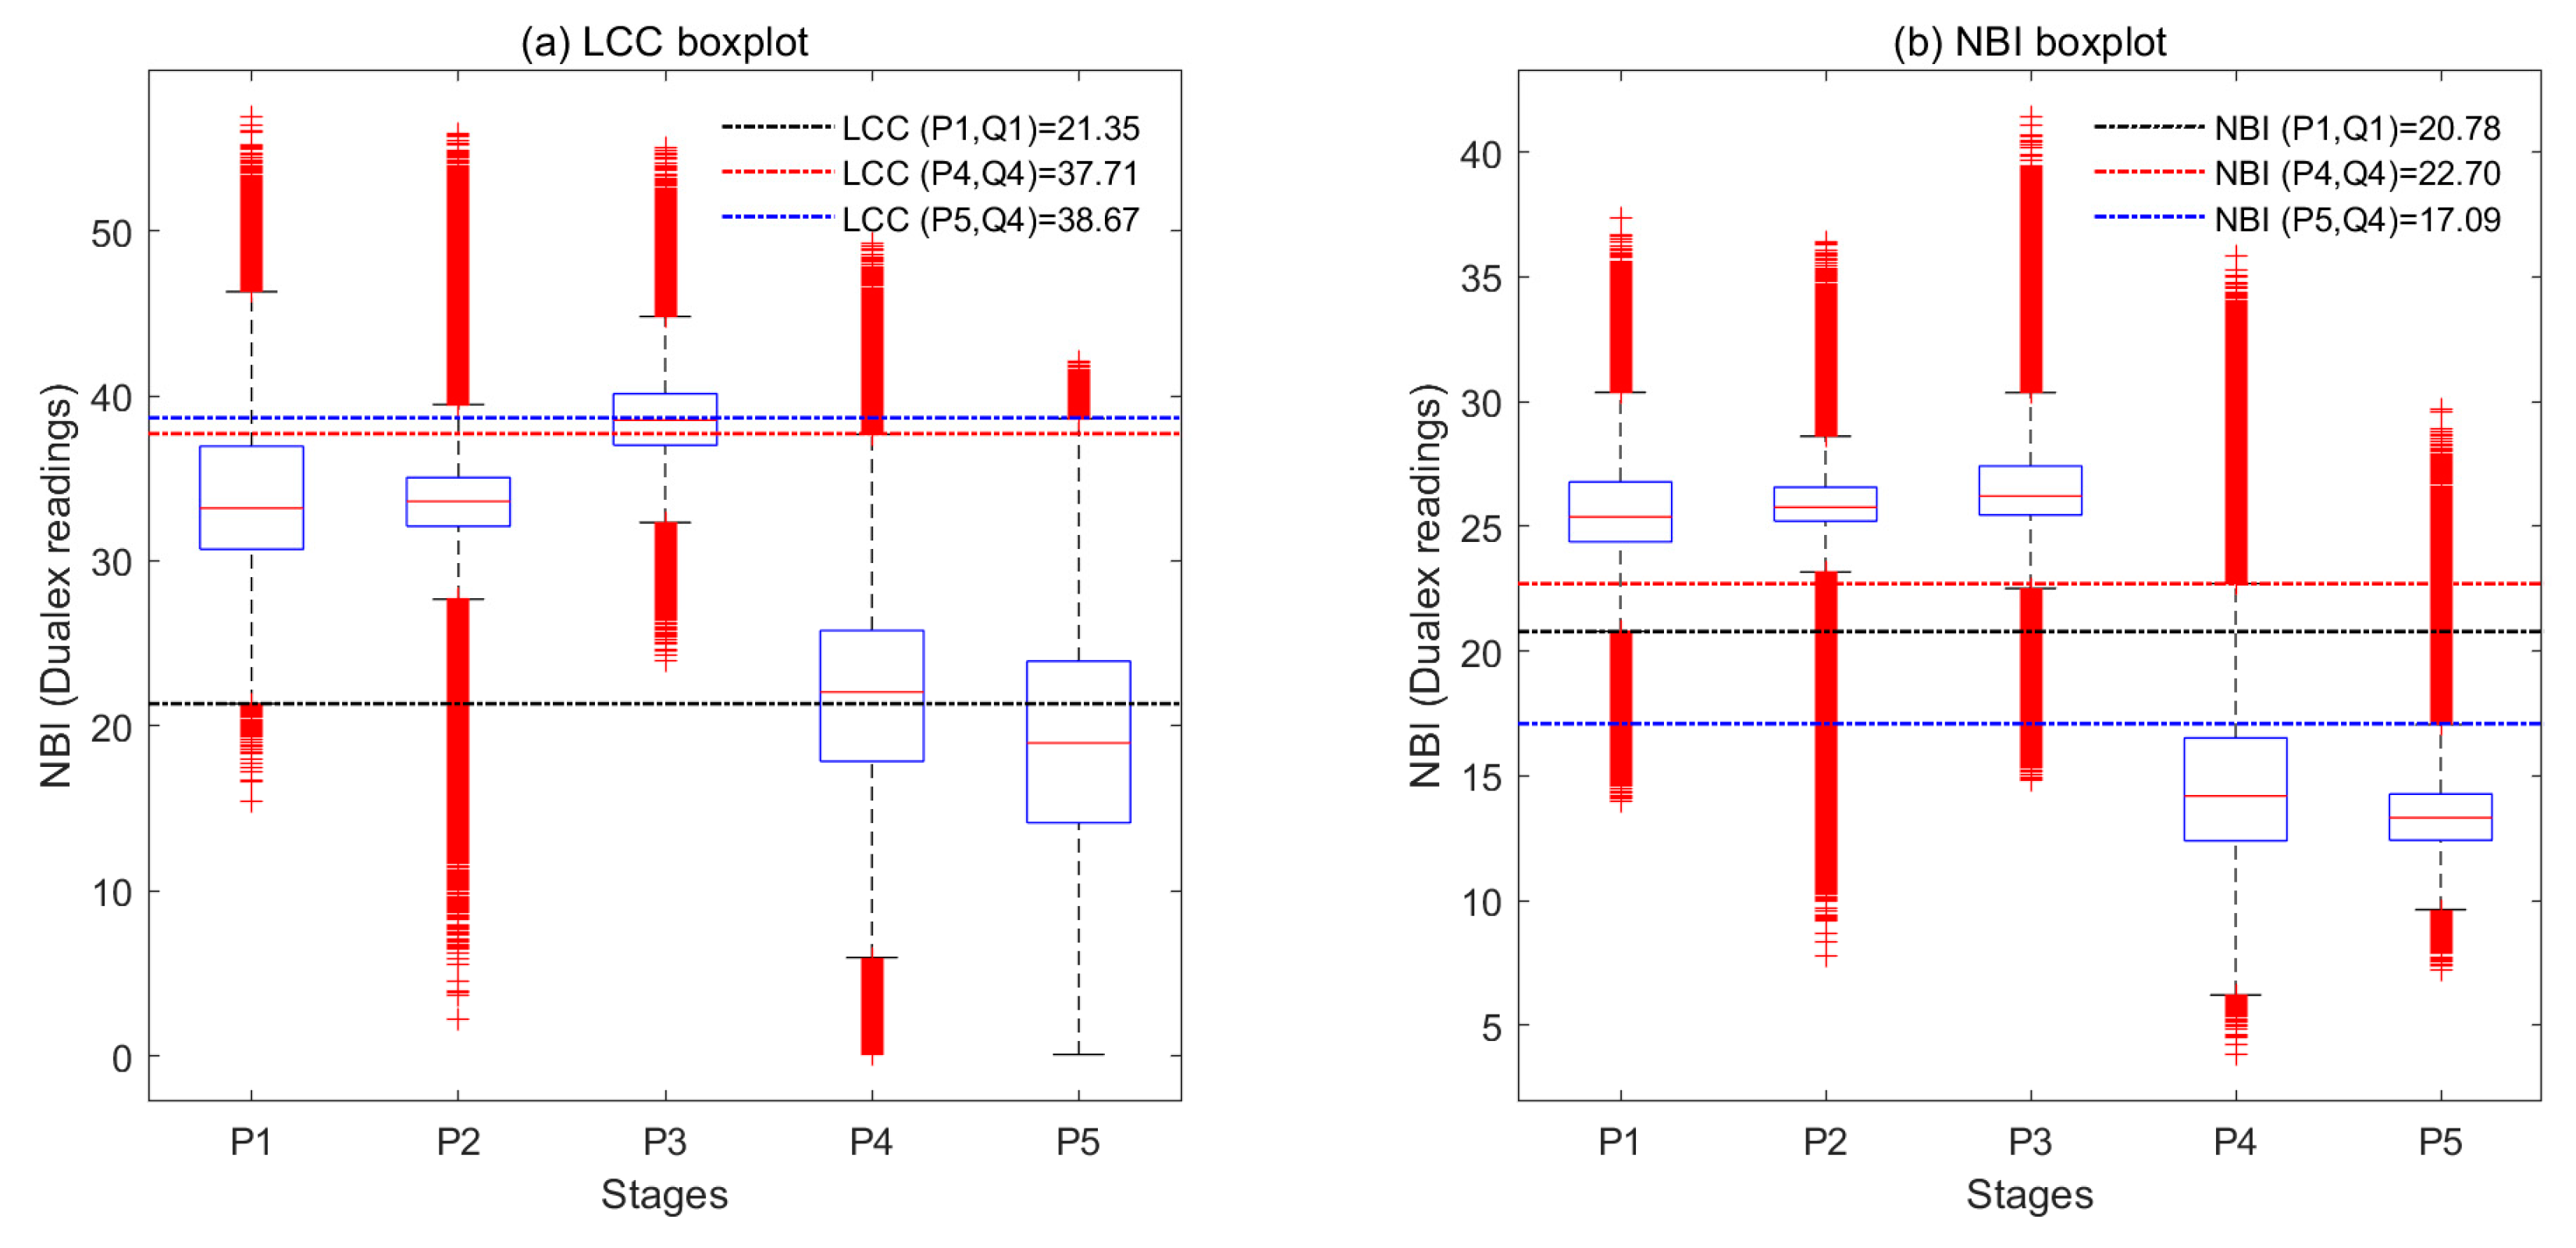
We used the GPR-based LCC, Flav, and NBI estimation models, and the soybean canopy DOMs, for LCC, Flav, and NBI mapping. Figure 7 illustrates the LCC, Flav, and NBI maps for the five stages. Figure 8 presents the results of the histogram analysis for the LCC and NBI distributions. Our findings indicate that (1) LCC first increases and then decreases, (2) Flav steadily increases from P1 to P4, and (3) NBI is relatively constant from P1 to P3 but drops notably in P4. These results are consistent with the field measurement analysis shown in Figure 2. Additionally, the box plots reveal that the Q4 quartile LCC values for the P4 and P5 stages (37.71 and 38.67 Dualex readings, respectively) are notably higher than the Q1 quartile LCC value for the P1 stage (21.35 Dualex readings). Conversely, the Q4 quartile NBI value for the P5 stage (17.09 Dualex readings) is lower than the Q1 quartile NBI values for the P1, P2, and P3 stages.

3.3. Estimation and Evaluation of Crop Maturity Calculation and Mapping

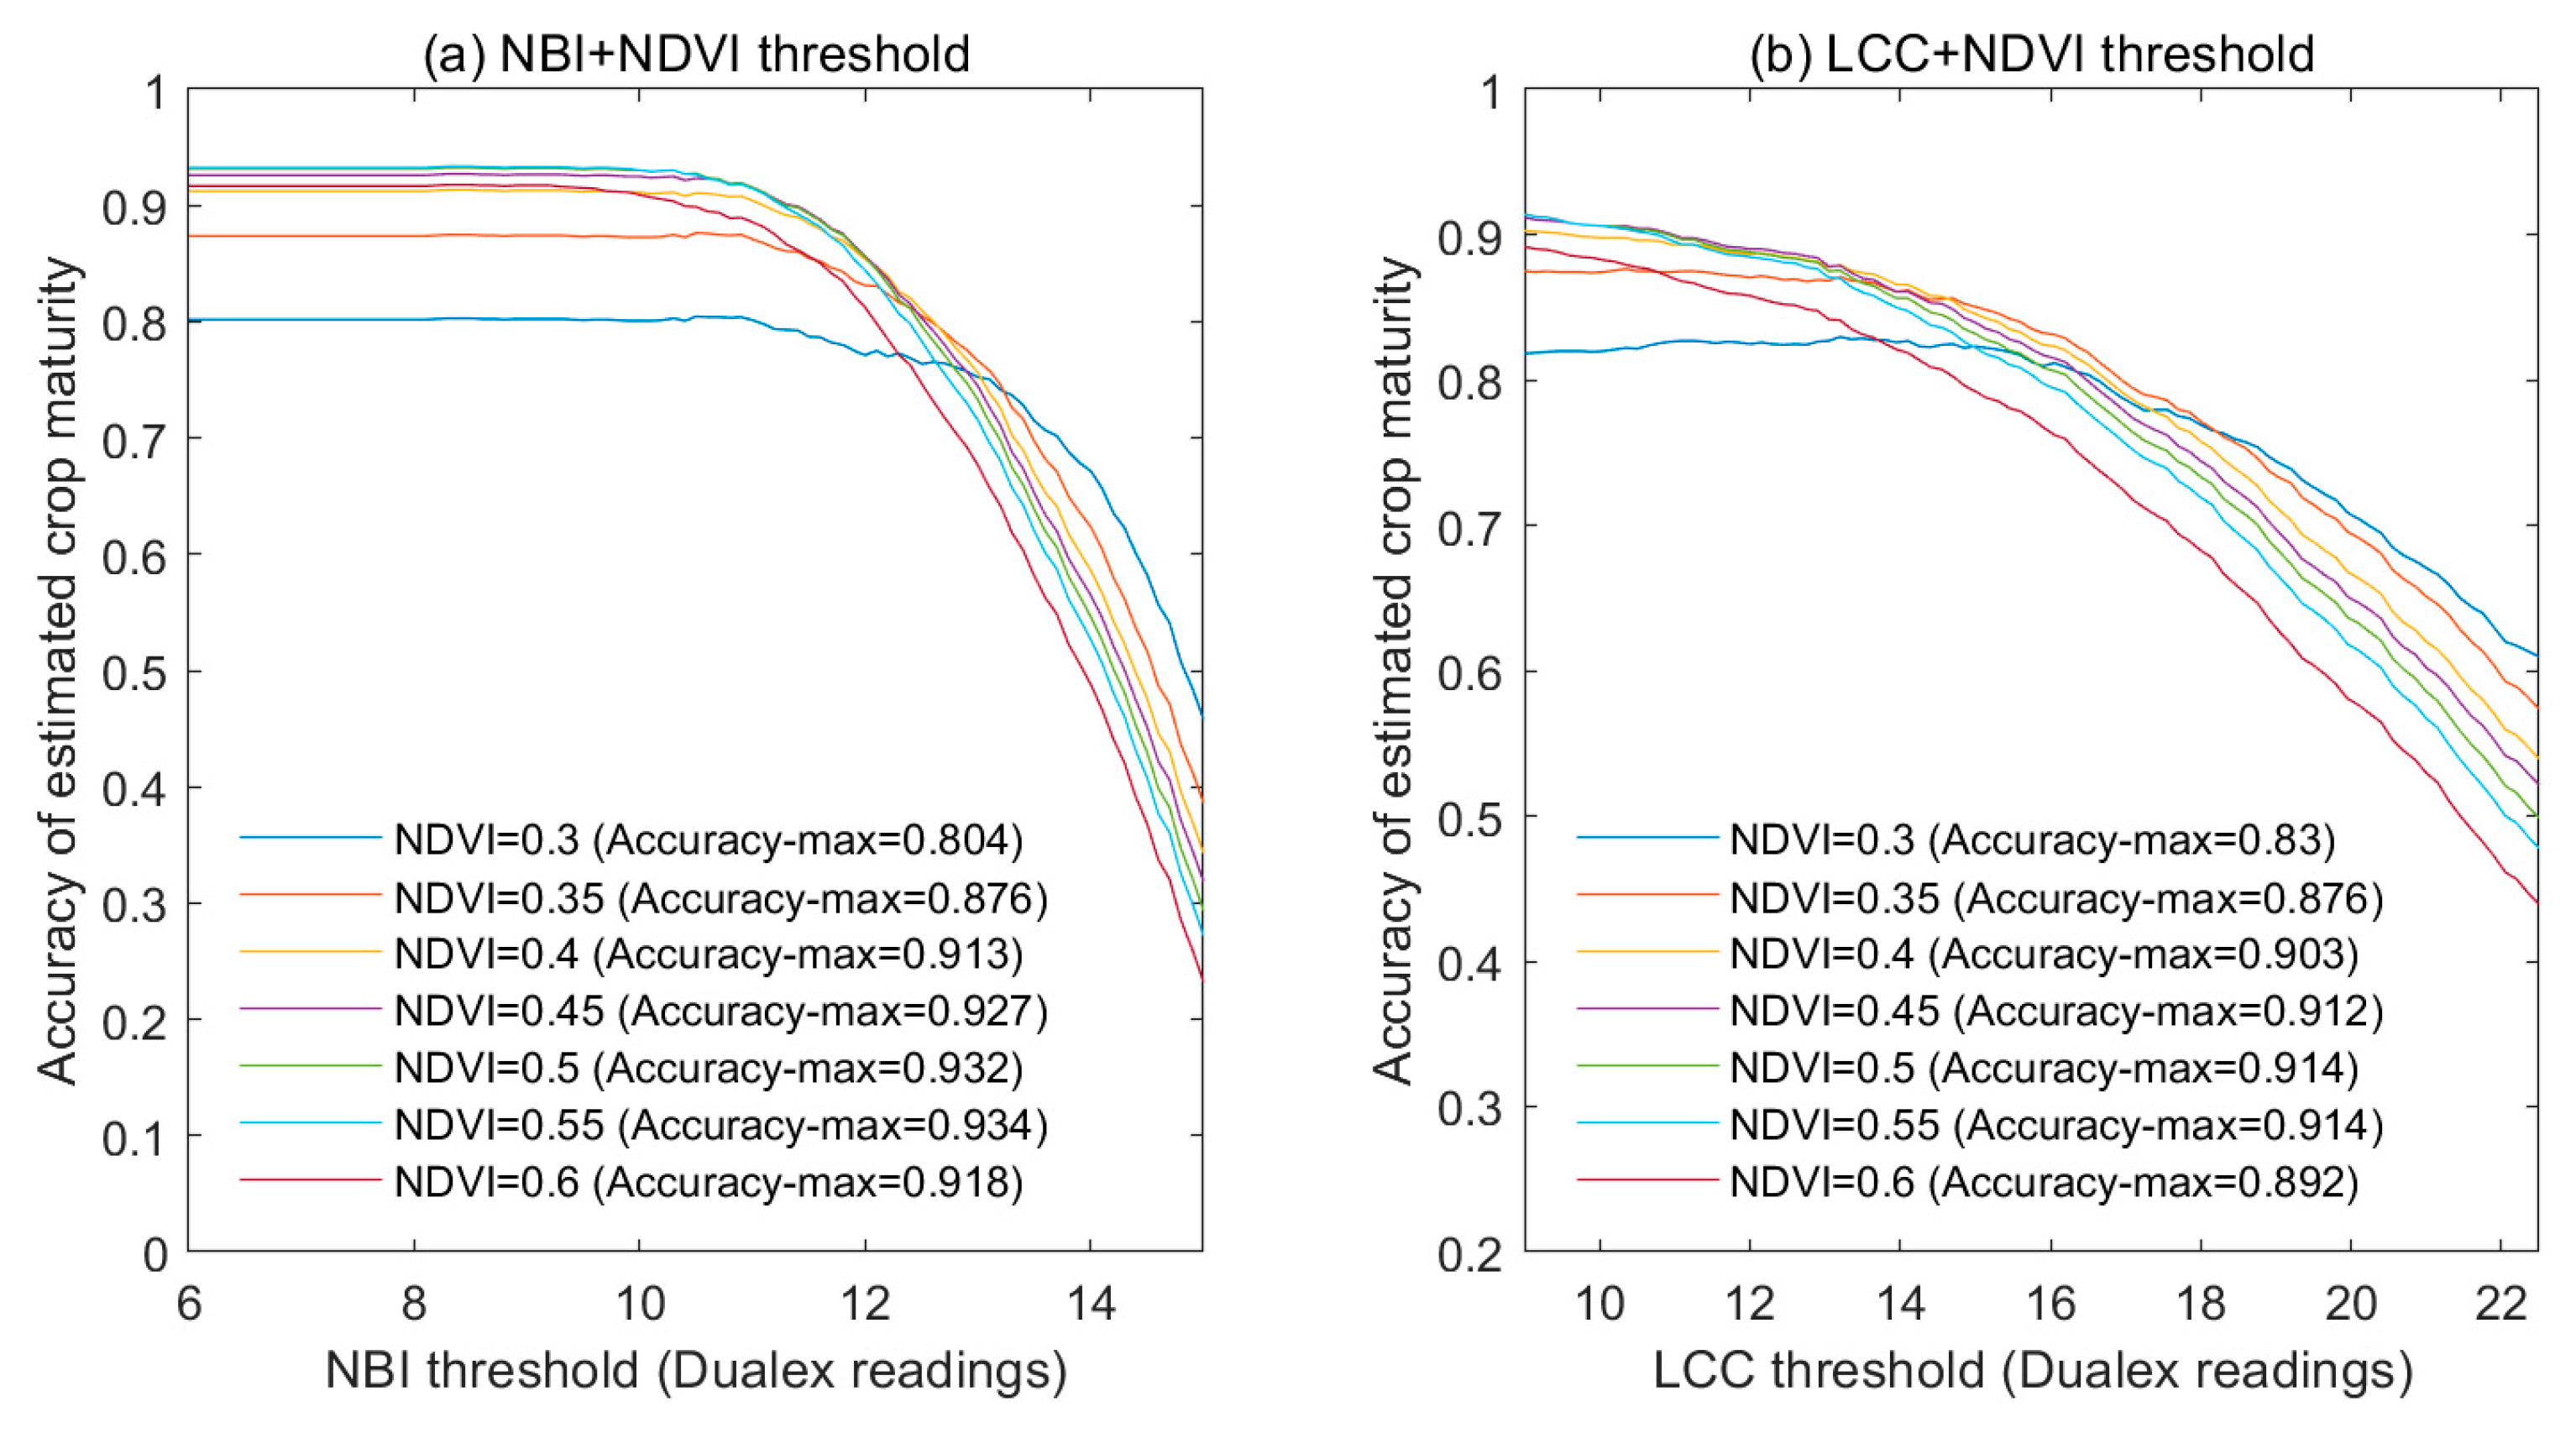
We tested two strategies for soybean maturity mapping: LCC+NDVI and NBI+NDVI. The threshold values for NBI and NDVI were set as 6:0.1:15 and 0.3:0.05:0.6, respectively. The threshold values for LCC and NDVI were set as 9:0.15:22.5 and 0.3:0.05:0.6, respectively. Figure 9 shows the overall accuracy curves for different combinations. Our results (Figure 9 and Table 4) indicate that the NDVI < 0.55 + NBI < 8.2 combination achieved the highest overall classification accuracy, with an accuracy value of 0.934. For the NDVI+LCC method, the NDVI < 0.55 + NBI < 9 combination achieved the highest overall classification accuracy, with an accuracy value of 0.914. Figure 10 presents the classification results for maturity (using NDVI < 0.55 + NBI < 8.2), demonstrating good consistency between the mature classification results and the true-color images.

4. Discussion

4.1. Multi-Temporal LCC, NBI, and Flav Features and Soybean Maturity

The temporal changes in crops’ physiological and biochemical parameters are vital for accurately understanding their phenological information. The transfer of nitrogen within various organs of crops throughout their growth cycle has long been of interest to both agricultural and remote sensing researchers [57]. On the one hand, nitrogen transfer is crucial for agricultural grain production management, while, on the other hand, it can serve as an indicator of crop phenology [58]. Previous studies have shown that, as crops enter the reproductive growth stage, the competition for carbon assimilates and nutrients between grain development and vegetative organs accelerates nitrogen’s outward transfer and senescence in organs such as leaves and roots. This study’s analysis of multiple temporal LCC, NBI, and Flav features of soybeans contributes to our understanding of the physiochemical parameter indicators during soybean maturation. The features of LCC, NBI, and Flav in crops are widely believed to be related to the transfer of nitrogen within the various organs of the plants (Figure 2).
LCC is one of the most important indicators in quantifying the crop photosynthesis rate [34]. LCC is also a sensitive parameter affecting the visible–near-infrared canopy spectra [59]. In our study, the results (Figure 2) showed that soybean LCC increases continuously during the vegetative growth stages (P1 to P3) but gradually decreases during the reproductive growth stages (P4 to P5). Matured soybean leaves turn yellow due to a decrease in LCC; the underlying reason for this is the nitrogen transfer within various plant organs. Therefore, LCC could be an effective indicator for monitoring soybean maturation. Our ground measurements (Figure 2) revealed that the Q4 quantile value of LCC in the P4 stage is similar to the Q2 quantile value of the P1 stage and close to the Q1 quantile value of the P2 stage. Therefore, using only LCC for maturation monitoring might lead to low-LCC immature soybeans being misclassified as mature ones.
Soybean Flav content increases consistently from the vegetative growth stage to the reproductive growth stage (P1 to P4, Table 1, Figure 2) [60]. This suggests that higher Flav contents might signify closer proximity to maturation. Therefore, Flav could serve as an important physiological indicator during soybean maturation. Interestingly, after soybeans mature, their Flav content decreases (Table 1, P5), implying that the Flav variation during the reproductive growth period is more complex. Considering that the P5 stage only includes 11 ground-truth samples (Table 1, P5), the changes in Flav content during maturation need to be confirmed through additional experiments in the future. This is also why our study did not use Flav as an indicator for determining maturity.
NBI is a crucial indicator for characterizing the internal nitrogen balance of crops [35]. NBI is obtained by calculating the ratio NBI = LCC/Flav. Our analysis of ground measurements and the spatial distribution of NBI maps revealed the relative stability of NBI during the vegetative growth stages. The NBI values during the P1 to P3 stages exhibited a closely aligned range (Table 1, Figure 2), suggesting that the observed variations could be attributed to distinct phenotypic differences between different soybean genotypes. However, a rapid decrease in NBI was observed during the reproductive growth stages (P4 to P5). Our findings were further supported by the outcomes of our box plot analysis (Figure 2), where the Q4 quartile value for the P4 stage significantly decreased compared to the Q1 quartile of the P1 to P3 stages. This confirms the notable decline in nitrogen content within the canopy leaves during the reproductive period and underscores the role of nitrogen redistribution as a potential indicator of crop aging and maturation. Compared to the LCC measurements (Figure 2 and Figure 7), NBI emerges as a promising indicator for nitrogen transfer. Its potential to effectively mark the movement of nitrogen could make it a valuable metric for monitoring crop phenology.

4.2. Advantages and Uncertainty of this Work

Crop defoliation is a change in crop crown structure information during crop maturation, while crop NBI is a change in physicochemical information during crop maturation. Our study provides a new approach for monitoring soybean maturity using hyperspectral remote sensing, which involves evaluating crop maturity by combining crop defoliation information (based on NDVI) and crop NBI information. We conducted soybean LCC, Flav, and NBI estimations using hyperspectral DOMs (Figure 6 and Figure 7). This study confirms the feasibility of using hyperspectral remote sensing and GPR models to monitor Flav and NBI traits (Figure 6 and Figure 7). The estimated LCC, Flav, and NBI distributions are similar to ground-truth LCC, Flav, and NBI measurements (Figure 8). This study formally demonstrates that crop maturity can be accurately evaluated through combining UAV hyperspectral, GPR, and threshold methods.
Pod moisture content, leaf color, and the degree of leaf senescence are three important criteria for determining soybean maturity [33]. In this study, the UAV remote sensing data lack the shortwave infrared (SWIR) bands that are sensitive to water absorption (approximately 1300–2500 nm) [61], rendering the dataset unsuitable for estimating canopy moisture content. Leaf color and leaf senescence were two pivotal indicators for this study’s maturity assessment through UAV remote sensing. We utilized NDVI to characterize the degree of leaf senescence while employing LCC and NBI synergistically for soybean maturity remote sensing.
When conducting soybean maturity monitoring using the NDVI+NBI approach, we classified soybean materials as mature if they met the criteria of NDVI < 0.55 or NBI < 8.2. It is important to note that the area covered by the UAV monitoring includes 918 soybean materials with significant morphological differences during maturity. For instance, while most soybean materials exhibit decreased LCC and yellowing leaves as signs of maturity, there are cases where many of the leaves fall off during maturation, leaving some plants still green even when nearly half of their leaves have dropped. Consequently, the uncertainty in soybean maturity morphology creates difficulties in applying this method in monitoring soybean maturity.
In addition to the uncertainties in soybean maturity morphology, there are several other factors that constrain the accuracy of soybean maturity monitoring in this study, such as the consistency of the multi-temporal hyperspectral data and the method used for determining thresholds. The span of approximately 60 days between the P1 and P5 stages in this study implies significant variations in solar zenith angles during the ground measurements. Additionally, UAV data collection is inevitably affected by atmospheric conditions and cloud cover. In this research, we employed an exhaustive method to explore the potential of using NDVI+LCC and NDVI+NBI for maturity monitoring, revealing that the selection of thresholds significantly impacts the monitoring accuracy (Figure 9 and Table 4). Finally, NDVI is inherently influenced by both LCC and vegetation cover [9]; thus, using the combinations of NDVI+NBI and NDVI+LCC directly could introduce errors in the results.
This study used the combinations of NDVI+NBI and NDVI+LCC for maturity monitoring due to the clear correlation between (i) the NDVI, LCC, and NBI and (ii) the criteria for determining soybean maturity. Future research should consider using the combinations of NDVI+Chlorophyll Index for soybean maturity monitoring, which could potentially reduce the intensity of the ground NBI and LCC measurements. Therefore, further experiments should explore the relationships between crop NDVI, the Chlorophyll Index, LCC, Flav, and NBI and crop maturity. Further studies are required to verify the use of a combination of NDVI, the Chlorophyll Index, LCC, Flav, and NBI to monitor crop maturity for more crops and regions.

5. Conclusions

This study presented a UAV-based hyperspectral remote sensing approach for monitoring soybean maturity. The study explored the following aspects: (1) the correlations between soybean LCC, NBI, Flav, and maturity; (2) the estimation of soybean LCC, NBI, and Flav using GPR, PLSR, and RF techniques; and (3) the application of threshold-based methods in conjunction with NDVI+LCC and NDVI+NBI for soybean maturity monitoring. Our results have led to the following conclusions:
(1)
Our results demonstrate that a direct relationship exists between (i) soybean LCC, NBI, Flav, and (ii) maturity (Figure 7 and Figure 8). During the P1 to P3 stages, LCC consistently increases, followed by a rapid decline during the P4 stage. Flav showed a consistent increase from the P1 to P4 stages. NBI shows relatively consistent levels during the P1 to P3 stages, followed by a rapid decrease during the P4 (mature) stage.
(2)
The soybean LCC, Flav, and NBI can be properly estimated using (a) UAV hyperspectral and (b) GPR, PLSR, and RF models. The GPR, PLSR, and RF models yield similar soybean LCC (R2: 0.737–0.832, RMSE: 3.35–4.202 Dualex readings), Flav (R2: 0.321–0.461, RMSE: 0.13–0.145 Dualex readings), and NBI (R2: 0.758–0.797, RMSE: 2.922–3.229 Dualex readings) estimates (Figure 6). The LCC, Flav, and NBI maps based on the GPR model (Figure 7 and Figure 8) are consistent with the field measurement analysis shown in Figure 2.
(3)
This study demonstrates that crop maturity can be accurately evaluated through combining UAV hyperspectral, GPR, and threshold methods. For the NDVI+NBI method, the combination of NDVI < 0.55 + NBI < 8.2 achieved the highest overall accuracy in monitoring soybean maturity (overall accuracy = 0.934, producer accuracy = 0.934, user accuracy = 0.915, Figure 10 and Table 4). For the NDVI+LCC method, the combination of NDVI < 0.55 + NBI < 9 achieved the highest overall soybean maturity monitoring accuracy (overall accuracy = 0.914, producer accuracy = 0.929, user accuracy = 0.881, Table 4).

Author Contributions

Conceptualization, methodology, J.Y.; software, R.G., L.W. and J.W.; validation, R.G., Y.L., J.Y. and L.W.; investigation, H.F., Y.L., J.Y. and L.W.; writing—original draft preparation, J.Y. and L.W.; writing—review and editing, B.L., C.L., J.H., H.Q. and J.W.; funding acquisition, J.Y. All authors have read and agreed to the published version of the manuscript.

Funding

This study was supported by the Henan Province Science and Technology Research Project (232102111123) and the National Natural Science Foundation of China (grant number 42101362).

Data Availability Statement

The data that support the findings of this study are available from the corresponding author, J.Y., upon reasonable request.

Conflicts of Interest

The authors declare no conflict of interest.

References

  1. Qin, P.; Wang, T.; Luo, Y. A Review on Plant-Based Proteins from Soybean: Health Benefits and Soy Product Development. J. Agric. Food Res. 2022, 7, 100265. [Google Scholar] [CrossRef]
  2. Vogel, J.T.; Liu, W.; Olhoft, P.; Crafts-Brandner, S.J.; Pennycooke, J.C.; Christiansen, N. Soybean Yield Formation Physiology—A Foundation for Precision Breeding Based Improvement. Front. Plant Sci. 2021, 12, 719706. [Google Scholar] [CrossRef] [PubMed]
  3. Zhang, Y.M.; Li, Y.; Chen, W.F.; Wang, E.T.; Tian, C.F.; Li, Q.Q.; Zhang, Y.Z.; Sui, X.H.; Chen, W.X. Biodiversity and Biogeography of Rhizobia Associated with Soybean Plants Grown in the North China Plain. Appl. Environ. Microbiol. 2011, 77, 6331–6342. [Google Scholar] [CrossRef] [PubMed]
  4. Volpato, L.; Dobbels, A.; Borem, A.; Lorenz, A.J. Optimization of Temporal UAS-Based Imagery Analysis to Estimate Plant Maturity Date for Soybean Breeding. Plant Phenome J. 2021, 4, e20018. [Google Scholar] [CrossRef]
  5. Yue, J.; Yang, H.; Yang, G.; Fu, Y.; Wang, H.; Zhou, C. Estimating Vertically Growing Crop Above-Ground Biomass Based on UAV Remote Sensing. Comput. Electron. Agric. 2023, 205, 107627. [Google Scholar] [CrossRef]
  6. Yue, J.; Yang, G.; Tian, Q.; Feng, H.; Xu, K.; Zhou, C. Estimate of Winter-Wheat above-Ground Biomass Based on UAV Ultrahigh-Ground-Resolution Image Textures and Vegetation Indices. ISPRS J. Photogramm. Remote Sens. 2019, 150, 226–244. [Google Scholar] [CrossRef]
  7. Yue, J.; Yang, G.; Li, C.; Li, Z.; Wang, Y.; Feng, H.; Xu, B. Estimation of Winter Wheat Above-Ground Biomass Using Unmanned Aerial Vehicle-Based Snapshot Hyperspectral Sensor and Crop Height Improved Models. Remote Sens. 2017, 9, 708. [Google Scholar] [CrossRef]
  8. Yue, J.; Tian, J.; Philpot, W.; Tian, Q.; Feng, H.; Fu, Y. VNAI-NDVI-Space and Polar Coordinate Method for Assessing Crop Leaf Chlorophyll Content and Fractional Cover. Comput. Electron. Agric. 2023, 207, 107758. [Google Scholar] [CrossRef]
  9. Zhang, S.; Feng, H.; Han, S.; Shi, Z.; Xu, H.; Liu, Y.; Feng, H.; Zhou, C.; Yue, J. Monitoring of Soybean Maturity Using UAV Remote Sensing and Deep Learning. Agriculture 2022, 13, 110. [Google Scholar] [CrossRef]
  10. Akhtman, Y.; Golubeva, E.I.; Tutubalina, O.V.; Zimin, M. Application of Hyperspectural Images and Ground Data for Precision Farming. Geogr. Environ. Sustain. 2017, 10, 117–128. [Google Scholar] [CrossRef]
  11. Yue, J.; Yang, H.; Feng, H.; Han, S.; Zhou, C.; Fu, Y.; Guo, W.; Ma, X.; Qiao, H.; Yang, G. Hyperspectral-to-Image Transform and CNN Transfer Learning Enhancing Soybean LCC Estimation. Comput. Electron. Agric. 2023, 211, 108011. [Google Scholar] [CrossRef]
  12. Yu, F.H.; Xu, T.Y.; Du, W.; Ma, H.; Zhang, G.S.; Chen, C.L. Radiative Transfer Models (RTMs) for Field Phenotyping Inversion of Rice Based on UAV Hyperspectral Remote Sensing. Int. J. Agric. Biol. Eng. 2017, 10, 150–157. [Google Scholar] [CrossRef]
  13. Zhang, Y.; Ta, N.; Guo, S.; Chen, Q.; Zhao, L.; Li, F.; Chang, Q. Combining Spectral and Textural Information from UAV RGB Images for Leaf Area Index Monitoring in Kiwifruit Orchard. Remote Sens. 2022, 14, 1063. [Google Scholar] [CrossRef]
  14. Yang, J.; Xing, M.; Tan, Q.; Shang, J.; Song, Y.; Ni, X.; Wang, J.; Xu, M. Estimating Effective Leaf Area Index of Winter Wheat Based on UAV Point Cloud Data. Drones 2023, 7, 299. [Google Scholar] [CrossRef]
  15. Santos-Rufo, A.; Mesas-Carrascosa, F.J.; García-Ferrer, A.; Meroño-Larriva, J.E. Wavelength Selection Method Based on Partial Least Square from Hyperspectral Unmanned Aerial Vehicle Orthomosaic of Irrigated Olive Orchards. Remote Sens. 2020, 12, 3426. [Google Scholar] [CrossRef]
  16. White, M.A.; de Beurs, K.M.; Didan, K.; Inouye, D.W.; Richardson, A.D.; Jensen, O.P.; O’Keefe, J.; Zhang, G.; Nemani, R.R.; van Leeuwen, W.J.D.; et al. Intercomparison, Interpretation, and Assessment of Spring Phenology in North America Estimated from Remote Sensing for 1982-2006. Glob. Chang. Biol. 2009, 15, 2335–2359. [Google Scholar] [CrossRef]
  17. Zhang, X.; Friedl, M.A.; Schaaf, C.B.; Strahler, A.H.; Hodges, J.C.F.; Gao, F.; Reed, B.C.; Huete, A. Monitoring Vegetation Phenology Using MODIS. Remote Sens. Environ. 2003, 84, 471–475. [Google Scholar] [CrossRef]
  18. Yue, J.; Feng, H.; Li, Z.; Zhou, C.; Xu, K. Mapping Winter-Wheat Biomass and Grain Yield Based on a Crop Model and UAV Remote Sensing. Int. J. Remote Sens. 2021, 42, 1577–1601. [Google Scholar] [CrossRef]
  19. Curnel, Y.; de Wit, A.J.W.; Duveiller, G.; Defourny, P. Potential Performances of Remotely Sensed LAI Assimilation in WOFOST Model Based on an OSS Experiment. Agric. For. Meteorol. 2011, 151, 1843–1855. [Google Scholar] [CrossRef]
  20. Yue, J.; Feng, H.; Yang, G.; Li, Z. A Comparison of Regression Techniques for Estimation of Above-Ground Winter Wheat Biomass Using Near-Surface Spectroscopy. Remote Sens. 2018, 10, 66. [Google Scholar] [CrossRef]
  21. Wang, J.; Si, H.; Gao, Z.; Shi, L. Winter Wheat Yield Prediction Using an LSTM Model from MODIS LAI Products. Agric. 2022, 12, 1707. [Google Scholar] [CrossRef]
  22. Rogge, D.; Rivard, B.; Zhang, J.; Feng, J. Iterative Spectral Unmixing for Optimizing Per-Pixel Endmember Sets. IEEE Trans. Geosci. Remote Sens. 2006, 44, 3725–3736. [Google Scholar] [CrossRef]
  23. Cong, N.; Piao, S.; Chen, A.; Wang, X.; Lin, X.; Chen, S.; Han, S.; Zhou, G.; Zhang, X. Spring Vegetation Green-up Date in China Inferred from SPOT NDVI Data: A Multiple Model Analysis. Agric. For. Meteorol. 2012, 165, 104–113. [Google Scholar] [CrossRef]
  24. Jin, X.; Li, Z.; Yang, G.; Yang, H.; Feng, H.; Xu, X.; Wang, J.; Li, X.; Luo, J. Winter Wheat Yield Estimation Based on Multi-Source Medium Resolution Optical and Radar Imaging Data and the AquaCrop Model Using the Particle Swarm Optimization Algorithm. ISPRS J. Photogramm. Remote Sens. 2017, 126, 24–37. [Google Scholar] [CrossRef]
  25. Lorite, I.J.; García-Vila, M.; Santos, C.; Ruiz-Ramos, M.; Fereres, E. AquaData and AquaGIS: Two Computer Utilities for Temporal and Spatial Simulations of Water-Limited Yield with AquaCrop. Comput. Electron. Agric. 2013, 96, 227–237. [Google Scholar] [CrossRef]
  26. Xu, K.; Tian, Q.; Yang, Y.; Yue, J.; Tang, S. How Up-Scaling of Remote-Sensing Images Affects Land-Cover Classification by Comparison with Multiscale Satellite Images. Int. J. Remote Sens. 2019, 40, 2784–2810. [Google Scholar] [CrossRef]
  27. Zhou, C.; Ye, H.; Xu, Z.; Hu, J.; Shi, X.; Hua, S.; Yue, J.; Yang, G. Estimating Maize-Leaf Coverage in Field Conditions by Applying a Machine Learning Algorithm to UAV Remote Sensing Images. Appl. Sci. 2019, 9, 2389. [Google Scholar] [CrossRef]
  28. Zhou, C.; Hu, J.; Xu, Z.; Yue, J.; Ye, H.; Yang, G. A Monitoring System for the Segmentation and Grading of Broccoli Head Based on Deep Learning and Neural Networks. Front. Plant Sci. 2020, 11, 402. [Google Scholar] [CrossRef]
  29. Sahu, P.; Chug, A.; Singh, A.P.; Singh, D.; Singh, R.P. Deep Learning Models for Beans Crop Diseases: Classification and Visualization Techniques. Int. J. Mod. Agric. 2021, 10, 796–812. [Google Scholar]
  30. Zhong, L.; Hu, L.; Zhou, H. Deep Learning Based Multi-Temporal Crop Classification. Remote Sens. Environ. 2019, 221, 430–443. [Google Scholar] [CrossRef]
  31. Osco, L.P.; Marcato Junior, J.; Marques Ramos, A.P.; de Castro Jorge, L.A.; Fatholahi, S.N.; de Andrade Silva, J.; Matsubara, E.T.; Pistori, H.; Gonçalves, W.N.; Li, J. A Review on Deep Learning in UAV Remote Sensing. Int. J. Appl. Earth Obs. Geoinf. 2021, 102, 102456. [Google Scholar] [CrossRef]
  32. Wang, J.; Zhao, C.; Huang, W. Fundamental and Application of Quantitative Remote Sensing in Agriculture; Science China Press: Beijing, China, 2008. [Google Scholar]
  33. Nürnberg, D.J.; Morton, J.; Santabarbara, S.; Telfer, A.; Joliot, P.; Antonaru, L.A.; Ruban, A.V.; Cardona, T.; Krausz, E.; Boussac, A.; et al. Photochemistry beyond the Red Limit in Chlorophyll f–Containing Photosystems. Science 2018, 360, 1210–1213. [Google Scholar] [CrossRef]
  34. Li, J.; Zhang, F.; Qian, X.; Zhu, Y.; Shen, G. Quantification of Rice Canopy Nitrogen Balance Index with Digital Imagery from Unmanned Aerial Vehicle. Remote Sens. Lett. 2015, 6, 183–189. [Google Scholar] [CrossRef]
  35. Gutman, G.; Ignatov, A. The Derivation of the Green Vegetation Fraction from NOAA/AVHRR Data for Use in Numerical Weather Prediction Models. Int. J. Remote Sens. 1998, 19, 1533–1543. [Google Scholar] [CrossRef]
  36. Rouse, J.W.; Haas, R.H.; Schell, J.A.; Deering, D.W. Monitoring Vegetation Systems in the Great Okains with ERTS. Third Earth Resour. Technol. Satell. Symp. 1973, 1, 325–333. [Google Scholar]
  37. Roujean, J.L.; Breon, F.M. Estimating PAR Absorbed by Vegetation from Bidirectional Reflectance Measurements. Remote Sens. Environ. 1995, 51, 375–384. [Google Scholar] [CrossRef]
  38. Qi, J.; Chehbouni, A.; Huete, A.R.; Kerr, Y.H.; Sorooshian, S. A Modified Adjusted Vegetation Index (MSAVI). Remote Sens. Environ. 1994, 48, 119–126. [Google Scholar] [CrossRef]
  39. Rondeaux, G.; Steven, M.; Baret, F. Optimization of Soil-Adjusted Vegetation Indices. Remote Sens. Environ. 1996, 55, 95–107. [Google Scholar] [CrossRef]
  40. Hunt, E.R.; Dean Hively, W.; Fujikawa, S.J.; Linden, D.S.; Daughtry, C.S.T.; McCarty, G.W. Acquisition of NIR-Green-Blue Digital Photographs from Unmanned Aircraft for Crop Monitoring. Remote Sens. 2010, 2, 290–305. [Google Scholar] [CrossRef]
  41. Haboudane, D.; Miller, J.R.; Tremblay, N.; Zarco-Tejada, P.J.; Dextraze, L. Integrated Narrow-Band Vegetation Indices for Prediction of Crop Chlorophyll Content for Application to Precision Agriculture. Remote Sens. Environ. 2002, 81, 416–426. [Google Scholar] [CrossRef]
  42. Gitelson, A.A.; Gritz, Y.; Merzlyak, M.N. Relationships between Leaf Chlorophyll Content and Spectral Reflectance and Algorithms for Non-Destructive Chlorophyll Assessment in Higher Plant Leaves. J. Plant Physiol. 2003, 160, 271–282. [Google Scholar] [CrossRef]
  43. Gitelson, A.; Merzlyak, M.N. Spectral Reflectance Changes Associated with Autumn Senescence of Aesculus Hippocastanum L. and Acer Platanoides L. Leaves. Spectral Features and Relation to Chlorophyll Estimation. J. Plant Physiol. 1994, 143, 286–292. [Google Scholar] [CrossRef]
  44. Barnes, E.M.; Clarke, T.R.; Richards, S.E.; Colaizzi, P.D.; Haberland, J.; Kostrzewski, M.; Waller, P.; Choi, C.R.E.; Thompson, T.; Lascano, R.J.; et al. Coincident Detection of Crop Water Stress, Nitrogen Status and Canopy Density Using Ground Based Multispectral Data. In Proceedings of the 5th International Conference on Precision Agriculture, Bloomington, MN, USA, 16–19 July 2000. [Google Scholar]
  45. Daughtry, C.S.T.; Walthall, C.L.; Kim, M.S.; De Colstoun, E.B.; McMurtrey, J.E. Estimating Corn Leaf Chlorophyll Concentration from Leaf and Canopy Reflectance. Remote Sens. Environ. 2000, 74, 229–239. [Google Scholar] [CrossRef]
  46. Tsai, F.; Philpot, W. Derivative Analysis of Hyperspectral Data. Remote Sens. Environ. 1998, 66, 41–51. [Google Scholar] [CrossRef]
  47. Estévez, J.; Salinero-Delgado, M.; Berger, K.; Pipia, L.; Rivera-Caicedo, J.P.; Wocher, M.; Reyes-Muñoz, P.; Tagliabue, G.; Boschetti, M.; Verrelst, J. Gaussian Processes Retrieval of Crop Traits in Google Earth Engine Based on Sentinel-2 Top-of-Atmosphere Data. Remote Sens. Environ. 2022, 273, 112958. [Google Scholar] [CrossRef] [PubMed]
  48. Breiman, L. Random Forests. Mach. Learn. 2001, 45, 5–32. [Google Scholar] [CrossRef]
  49. Maraphum, K.; Saengprachatanarug, K.; Wongpichet, S.; Phuphuphud, A.; Posom, J. Achieving Robustness across Different Ages and Cultivars for an NIRS-PLSR Model of Fresh Cassava Root Starch and Dry Matter Content. Comput. Electron. Agric. 2022, 196, 106872. [Google Scholar] [CrossRef]
  50. Wold, H. Estimation of Principal Components and Related Models by Iterative Least Squares In Multivariate Analysis. Multivar. Anal. 1966, 23, 391–420. [Google Scholar]
  51. Scott, D.W. Histogram. Wiley Interdiscip. Rev. Comput. Stat. 2010, 2, 44–48. [Google Scholar] [CrossRef]
  52. Williamson, D.F.; Parker, R.A.; Kendrick, J.S. The Box Plot: A Simple Visual Method to Interpret Data. Ann. Intern. Med. 1989, 110, 916–921. [Google Scholar] [CrossRef]
  53. NING, H.-X. Deducing Maturity Genotype of the Chinese Soybean Varieties. Acta Agron. Sin. 2008, 34, 382–388. [Google Scholar] [CrossRef]
  54. Yue, J.; Guo, W.; Yang, G.; Zhou, C.; Feng, H.; Qiao, H. Method for Accurate Multi-Growth-Stage Estimation of Fractional Vegetation Cover Using Unmanned Aerial Vehicle Remote Sensing. Plant Methods 2021, 17, 51. [Google Scholar] [CrossRef]
  55. Sajid, M.; Mohsin, M.; Jamal, T.; Mobeen, M.; Rehman, A.; Rafique, A. Impact of Land-Use Change on Agricultural Production & Accuracy Assessment through Confusion Matrix. Int. J. Innov. Sci. Technol. 2022, 4, 233–245. [Google Scholar] [CrossRef]
  56. Li, F.; Miao, Y.; Feng, G.; Yuan, F.; Yue, S.; Gao, X.; Liu, Y.; Liu, B.; Ustin, S.L.; Chen, X. Improving Estimation of Summer Maize Nitrogen Status with Red Edge-Based Spectral Vegetation Indices. F. Crop. Res. 2014, 157, 111–123. [Google Scholar] [CrossRef]
  57. Fan, Y.; Feng, H.; Yue, J.; Jin, X.; Liu, Y.; Chen, R.; Bian, M.; Ma, Y.; Song, X.; Yang, G. Using an Optimized Texture Index to Monitor the Nitrogen Content of Potato Plants over Multiple Growth Stages. Comput. Electron. Agric. 2023, 212, 108147. [Google Scholar] [CrossRef]
  58. Féret, J.B.; Gitelson, A.A.; Noble, S.D.; Jacquemoud, S. PROSPECT-D: Towards Modeling Leaf Optical Properties through a Complete Lifecycle. Remote Sens. Environ. 2017, 193, 204–215. [Google Scholar] [CrossRef]
  59. Zhou, K.; Cao, L.; Yin, S.; Wang, G.; Cao, F. An Advanced Bidirectional Reflectance Factor (BRF) Spectral Approach for Estimating Flavonoid Content in Leaves of Ginkgo Plantations. ISPRS J. Photogramm. Remote Sens. 2022, 193, 1–16. [Google Scholar] [CrossRef]
  60. Yue, J.; Tian, J.; Tian, Q.; Xu, K.; Xu, N. Development of Soil Moisture Indices from Differences in Water Absorption between Shortwave-Infrared Bands. ISPRS J. Photogramm. Remote Sens. 2019, 154, 216–230. [Google Scholar] [CrossRef]
  61. Mishra, T.; Rabha, A.; Kumar, U.; Arunachalam, K.; Sridhar, V. Assessment of Solar Power Potential in a Hill State of India Using Remote Sensing and Geographic Information System. Remote Sens. Appl. Soc. Environ. 2020, 19, 100370. [Google Scholar] [CrossRef]
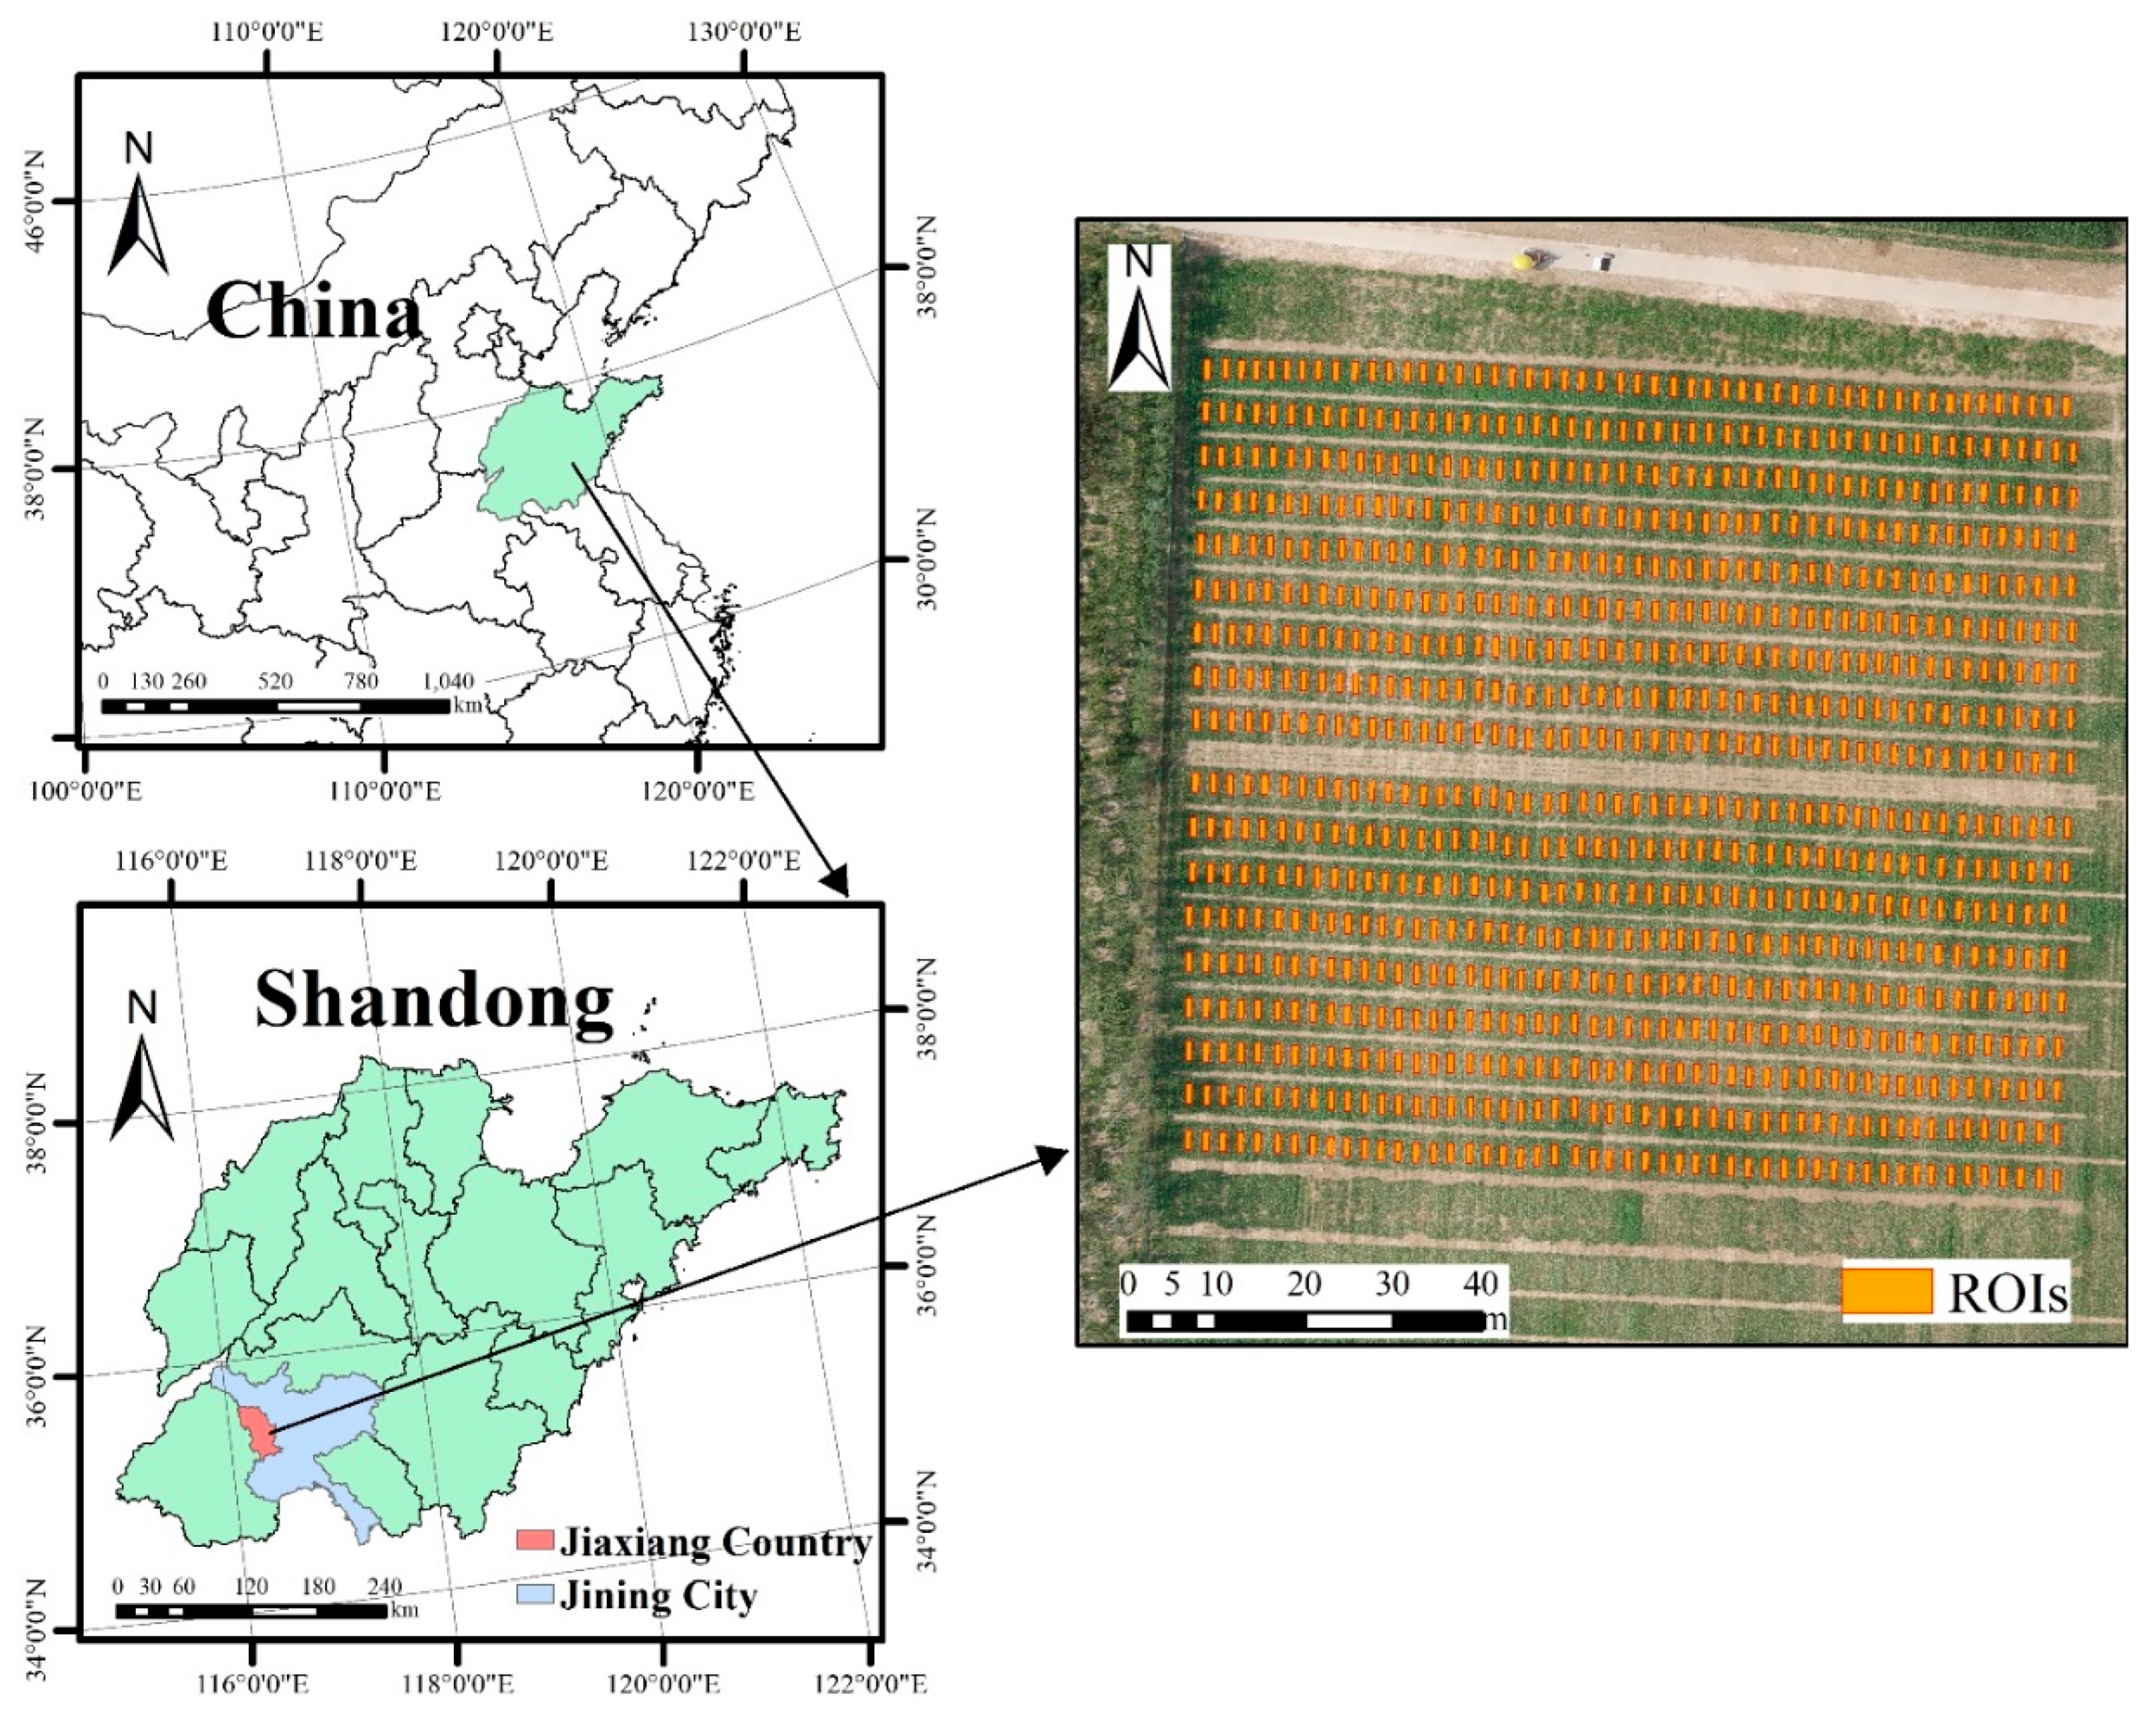
Figure 1. Study area and soybean experimental field.
Remotesensing 15 04807 g001
Figure 2. Histograms of field LCC (a), Flav (b), and NBI (c) measurements. Box plots of field LCC (d), Flav (e), and NBI (f) measurements.
Remotesensing 15 04807 g002
Figure 3. (a) Immature soybean spectra; (b) matured soybean spectra; (c) soil spectra.
Remotesensing 15 04807 g003
Figure 4. (a) FD spectra; (b) correlation analysis results for Flav, NBI, and FD spectra.
Remotesensing 15 04807 g004
Figure 5. Correlation analysis results for Flav, NBI, and SIs.
Remotesensing 15 04807 g005
Figure 6. Relationship between predicted and measured soybean Flav and NBI. (ac) PLSR; (df) GPR; (gi) RF.
Remotesensing 15 04807 g006
Figure 7. True-color images and (a) LCC (b), Flav (c), and NBI (d) maps for the five stages based on GPR. The LCC, Flav, and NBI maps were masked using NDVI > 0.3.
Remotesensing 15 04807 g007
Figure 8. Histogram of LCC (a) and NBI (b) maps. LCC and NBI data were masked using NDVI > 0.3.
Remotesensing 15 04807 g008
Figure 9. Overall accuracy of estimated crop maturity based on NDVI+NBI (a), NDVI+LCC (b), and the threshold method. Best NDVI+NBI combination: NDVI < 0.55, NBI < 8.3. Best NDVI+LCC combination: NDVI < 0.55, LCC < 9.
Remotesensing 15 04807 g009
Figure 10. True-color maps for the P4 (a) and P5 (b) stages; maturity and harvest maps for the P4 (c) and P5 (d) stages.
Remotesensing 15 04807 g010
Table 1. Field LCC, Flav, and NBI measurements (Dualex readings).
Stage/AbbreviationNumberLCCFlavNBI
MinMaxMeanMinMaxMeanMinMaxMean
Beginning bloom period (P1)5125.4134.3230.240.9611.3991.19720.6532.9825.41
Beginning pod period (P2)5128.0738.4332.860.9331.5801.28022.0831.9725.80
Beginning seed period (P3)5131.1846.1839.791.0581.7621.47120.7634.6727.24
Beginning maturity period (P4)427.7833.3420.071.2121.8821.5414.6622.8013.23
Full maturity period (P5)1110.5927.8919.771.0611.6971.3226.2419.8815.22
Total2067.7846.1830.620.9331.8821.3624.6634.6722.93
Note—Beginning bloom period (P1): one open flower at any node on the main stem. Beginning pod period (P2): three-sixteenth-inch-long pod at one of the four uppermost nodes on the main stem with a fully developed leaf. Beginning seed period (P3): one-eighth-inch-long seed in a pod at one of the four uppermost nodes on the main stem with a fully developed leaf. Beginning maturity period (P4): one normal pod on the main stem that has reached its mature pod color. Full maturity period (P5): 95% of the pods have reached their mature pod color.
Table 2. Vegetation indices.
TypeNameCalculationReference
Vegetation SIsNDVI(NIR − R)/(NIR + R)[37]
NDVI2NDVI × NDVI-
RDVI(NIR − R)/(NIR + R)0.5[38]
SAVI1.5 (NIR − R)/(NIR + R + 0.5)[39]
OSAVI1.16 (NIR − R)/(NIR + R + 0.16)[40]
GNDVI(NIR − G)/(NIR + G)[41]
TCARI/OSAVI3((NIR − R) − 0.2(NIR − G)(NIR/R))/OSAVI[42]
Red-edge SIsCIRERE3/RE1 − 1[43]
NDRE1(RE2 − RE1)/(RE2 + RE1)[44]
NDRE2(RE3 − RE1)/(RE3 + RE1)[45]
TCARI/OSAVIRE3((RE1 − R) − 0.2(RE1 − G)(RE1/R))/OSAVI[46]
Hyperspectral
derivative
FD + band numberFirst derivative (FD) of canopy
hyperspectral reflectance
[47]
Note: G, R, RE1, RE2, RE3, and NIR refer to the wavelengths of 558, 662, 706, 742, 782, and 830 nm, respectively, in UAV-based UHD 185 images. NDVI: normalized difference vegetation index. NDVI: NDVI × NDVI. RDVI: renormalized difference vegetation index. SAVI: soil-adjusted vegetation index. OSAVI: optimized soil-adjusted vegetation index. GNDVI: green normalized difference vegetation index. TCARI/OSAVI: the ratio of transformed chlorophyll absorption in reflectance index (TCARI) and OSAVI. CIRE: red-edge chlorophyll index. NDRE1: normalized difference red-edge version. NDRE2: normalized difference red-edge version 2. TCARI/OSAVIRE: red-edge-based TCARI/OSAVI.
Table 3. Confusion matrix.
Confusion MatrixPredicted Condition
ImmatureMatured/Harvested (MH)
Actual conditionImmatureTrue immature (TI)False immature (FI)
Matured/harvestedFalse MH (FMH)True MH (TMH)
Table 4. Confusion matrix for the best NBI+NDVI and LCC+NDVI combinations.
TypeNBI+NDVIPredicted ConditionLCC+NDVIPredicted Condition
ImmatureMHTotalImmatureMHTotal
Actual conditionImmature74653799Immature74257799
MH699681037MH1009371037
Total81510211836Total8429941836
Note—NBI+NDVI: overall accuracy = 0.934; producer accuracy = 0.934; user accuracy = 0.915. LCC+NDVI: overall accuracy = 0.914; producer accuracy = 0.929; user accuracy = 0.881.
Disclaimer/Publisher’s Note: The statements, opinions and data contained in all publications are solely those of the individual author(s) and contributor(s) and not of MDPI and/or the editor(s). MDPI and/or the editor(s) disclaim responsibility for any injury to people or property resulting from any ideas, methods, instructions or products referred to in the content.