
Monitoring the Thermal Activity of Kamchatkan Volcanoes during 2015–2022 Using Remote Sensing

 ,
,  ,
,  ,
,
Abstract

1. Introduction
2. Methods
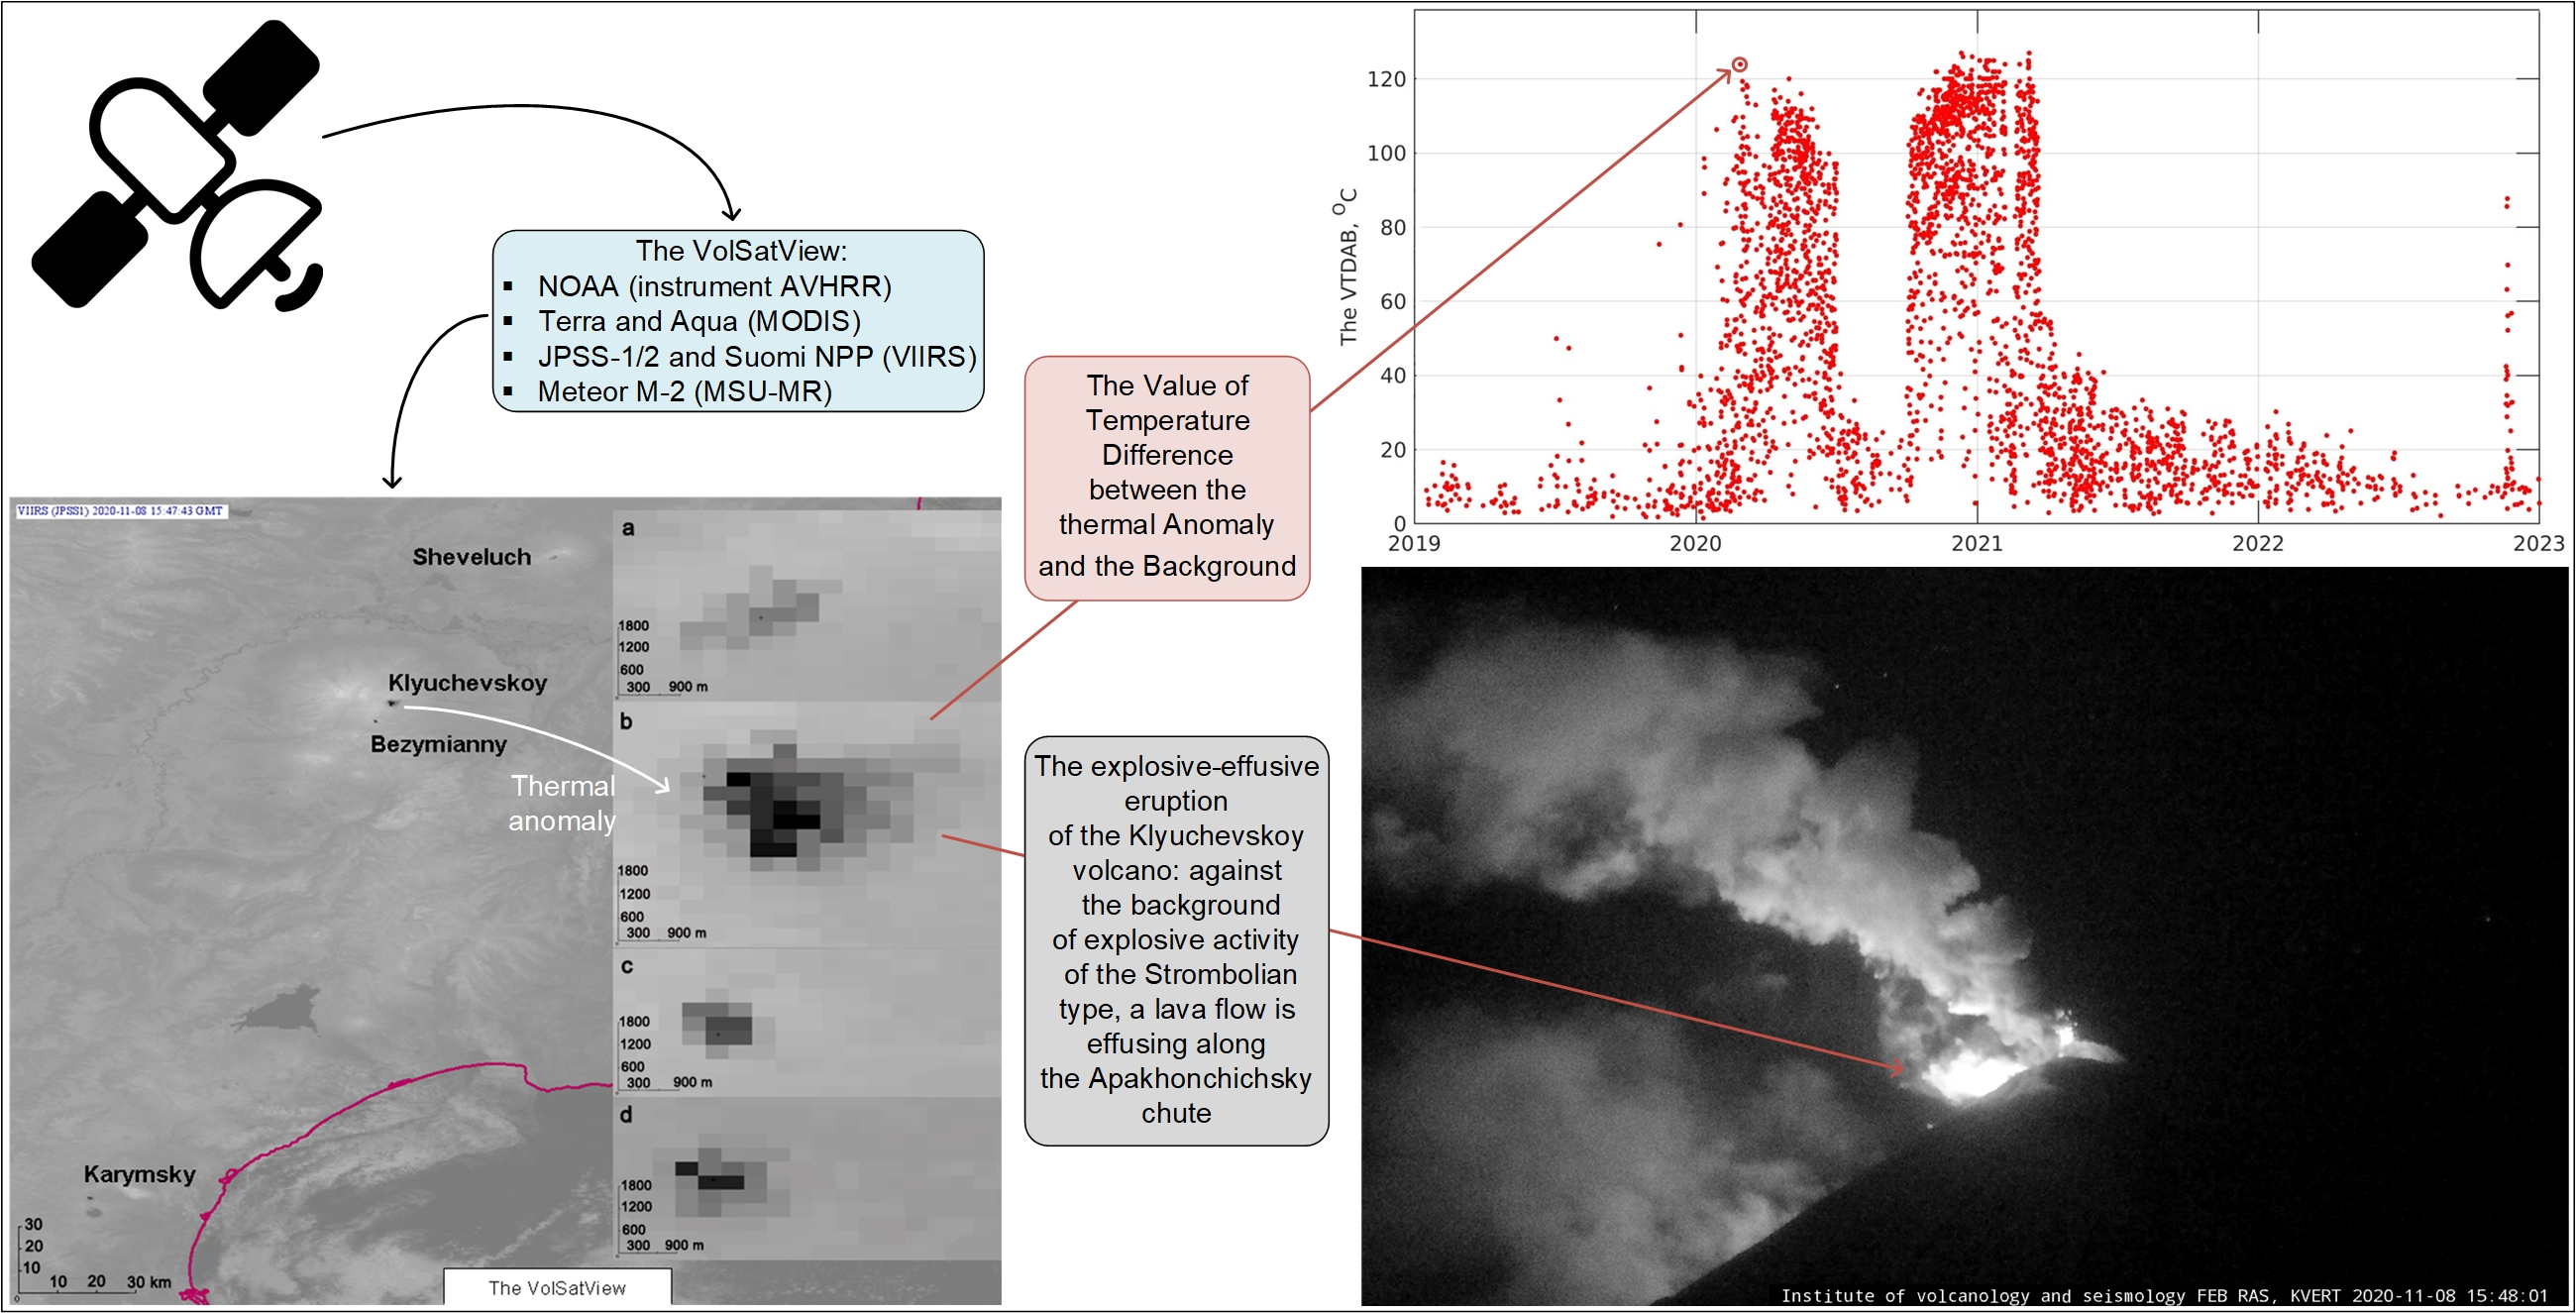
2.1. The VolSatView Information System
2.2. The Analysis of a Thermal Anomaly in the Volcano Area
2.3. Video and Visual Observation
3. Results
3.1. The Background Activity of the Volcano
4. Discussion
4.1. Sheveluch Volcano Activity in 2015–2022
4.2. Bezymianny Volcano Activity in 2015–2022
4.3. Klyuchevskoy Volcano Activity in 2015–2022
4.4. Karymsky Volcano Activity in 2015–2022
4.5. Summary of Volcanoes Activity in 2015–2022
4.6. The Relationship of the Volcano Activity of the Northern Group of Kamchatka in 2015–2022
- A vivid response to each other’s explosive events was observed in June 2017 [96]. Against the background of moderate explosive activity of the Klyuchevskoy volcano with ash removal up to 7–8 km a.s.l. on 12–20 June, strong explosions of the Sheveluch volcano raised ash to 12 km a.s.l. on 14 June, strong explosions of the Bezymianny volcano also sent ash up to 12 km a.s.l. on 16 June, and then the explosions of the Sheveluch volcano raised ash to 10 km a.s.l. on 18 June (Table 2, Table 3 and Table 4). Similar events were observed in December 2017: the Bezymianny volcano explosions raised ash to 15 km a.s.l. on 20 December, the Klyuchevskoy volcano sent ash up to 7 km a.s.l. on 21 December, and the explosions of the Sheveluch volcano raised ash to 8 km a.s.l. on 26 December (Table 2, Table 3 and Table 4).
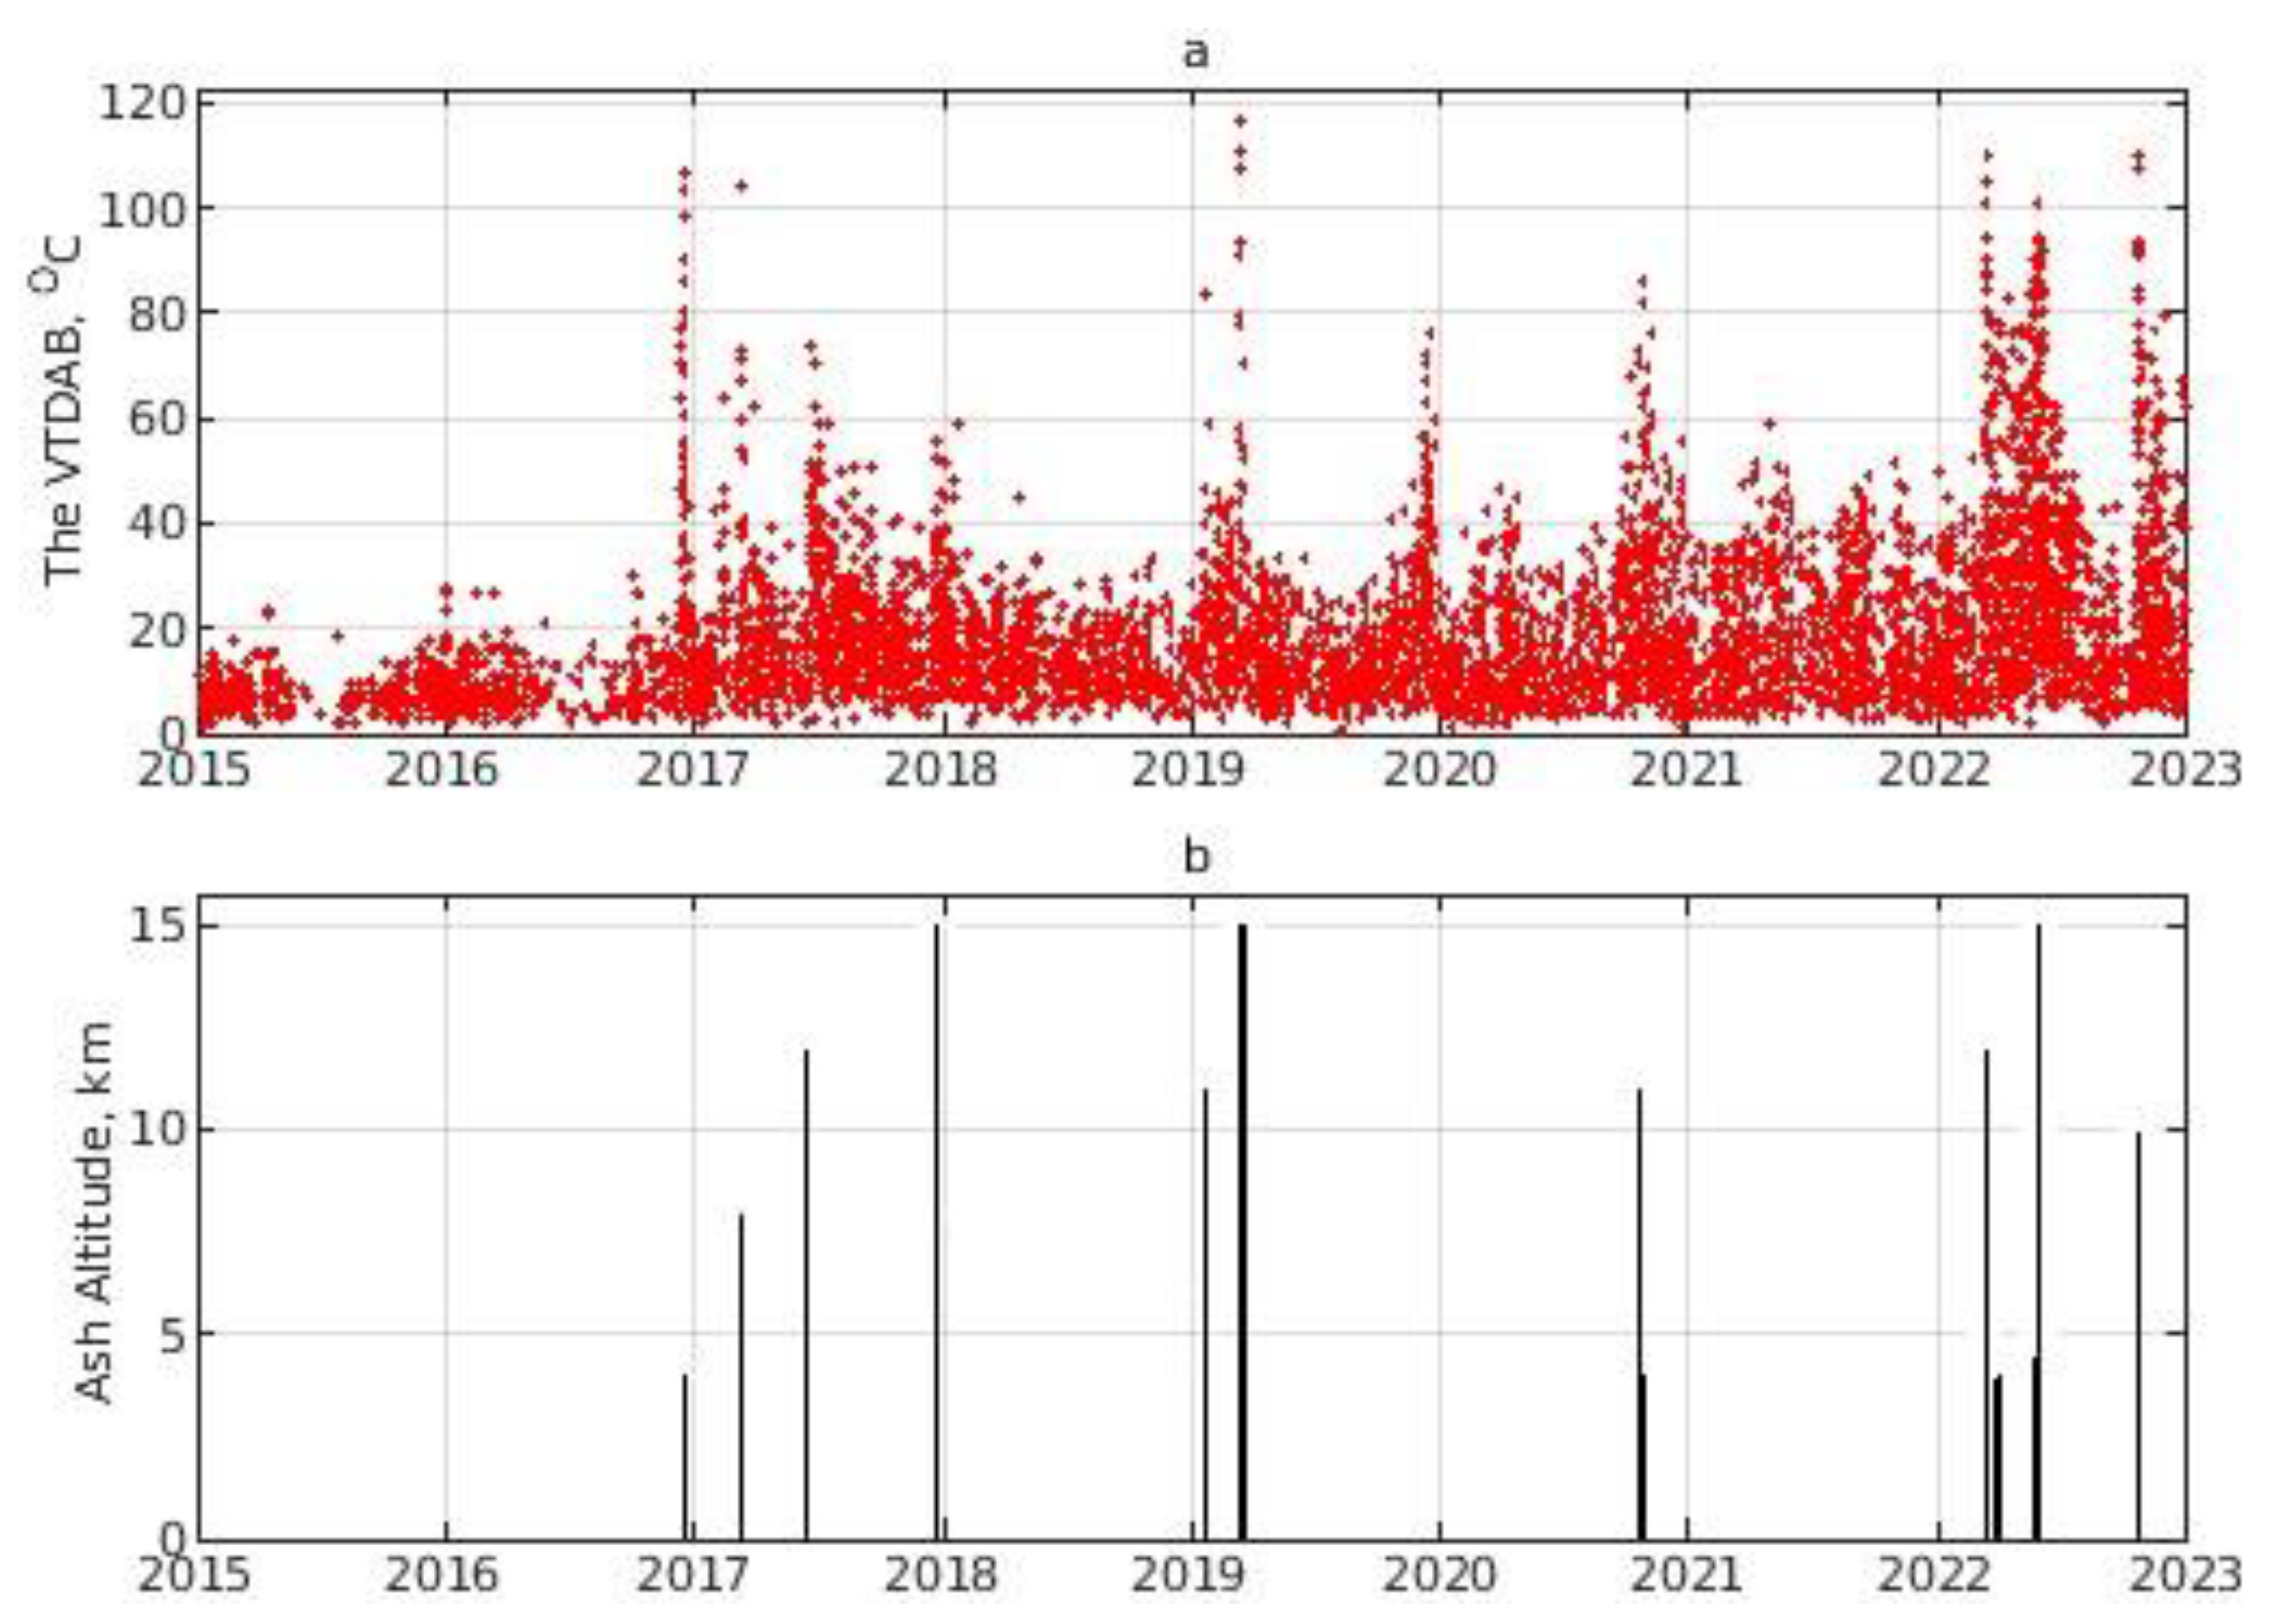
- Paroxysmal explosive eruptions of the Bezymianny volcano occurred more often against the background of high activity at the Sheveluch volcano (for example, in 2016 and 2019–2020), but sometimes they happened against the background of a decrease in its activity (for example, on 15 and 28 May 2022). Explosive events of Bezymianny and Sheveluch with ash removal up to 4 and 7.5 km a.s.l. sometimes occurred close to each other: for example, on 15 and 16 December 2016, respectively (Table 2 and Table 3).
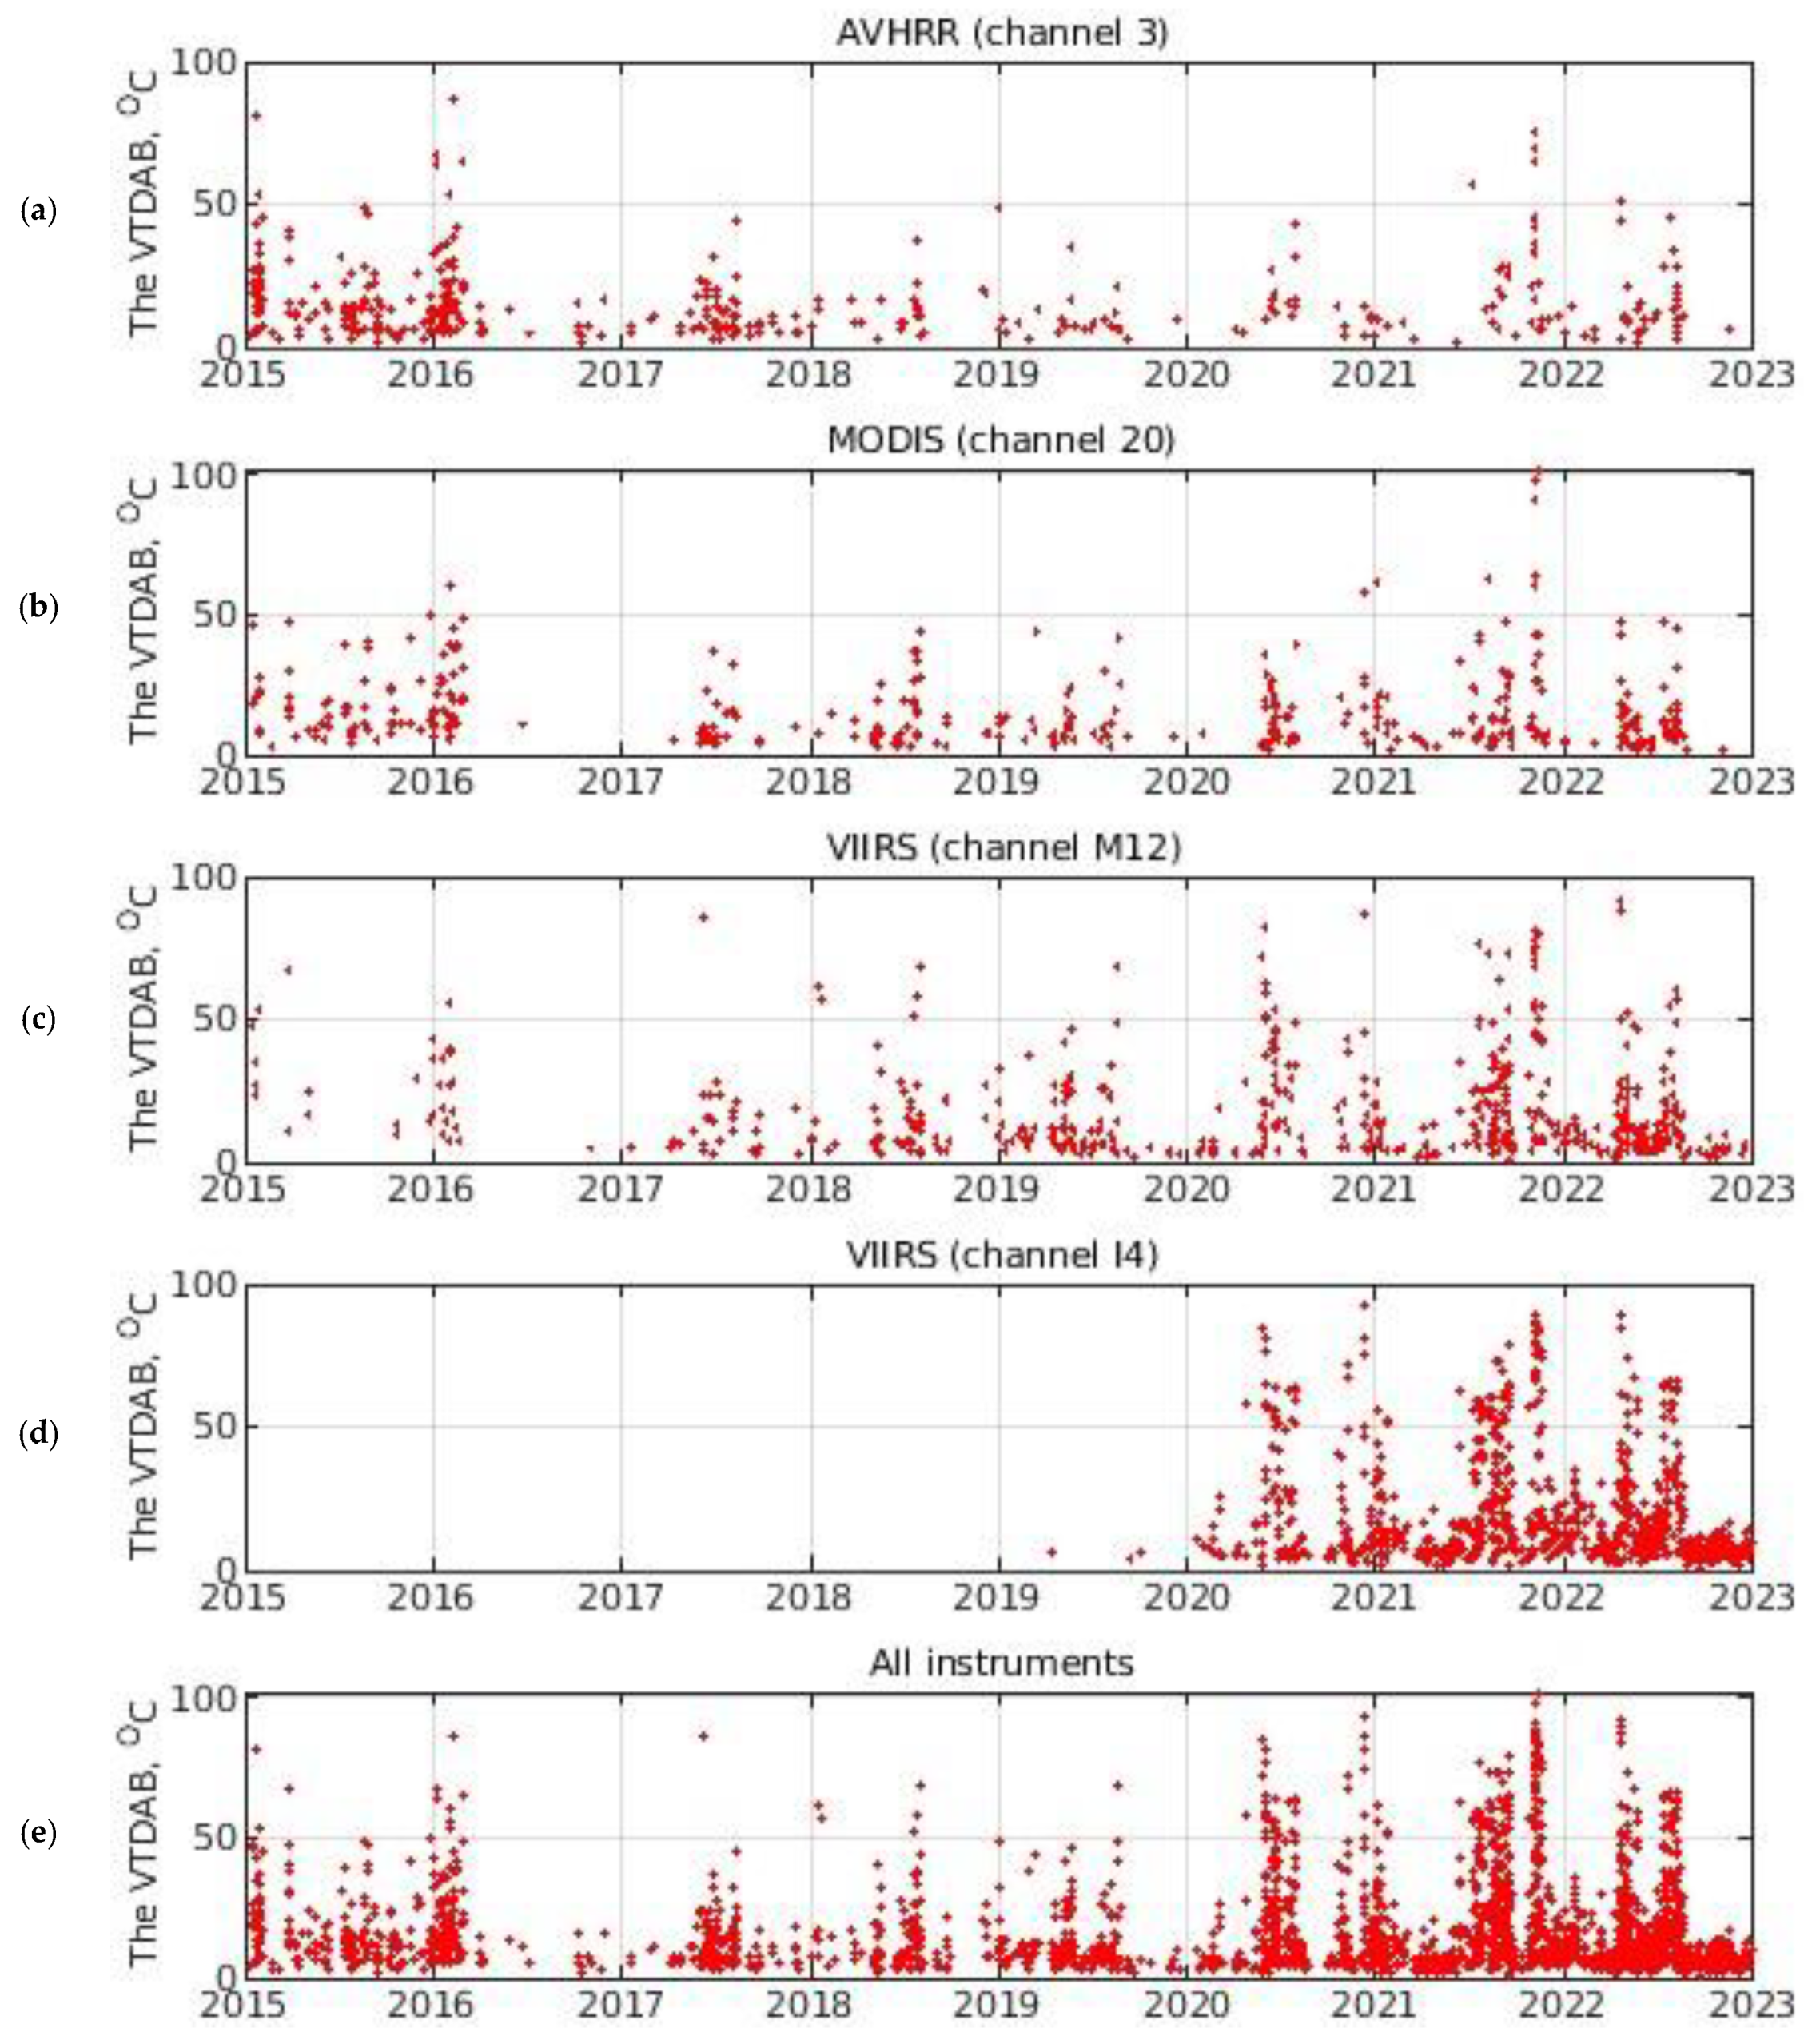
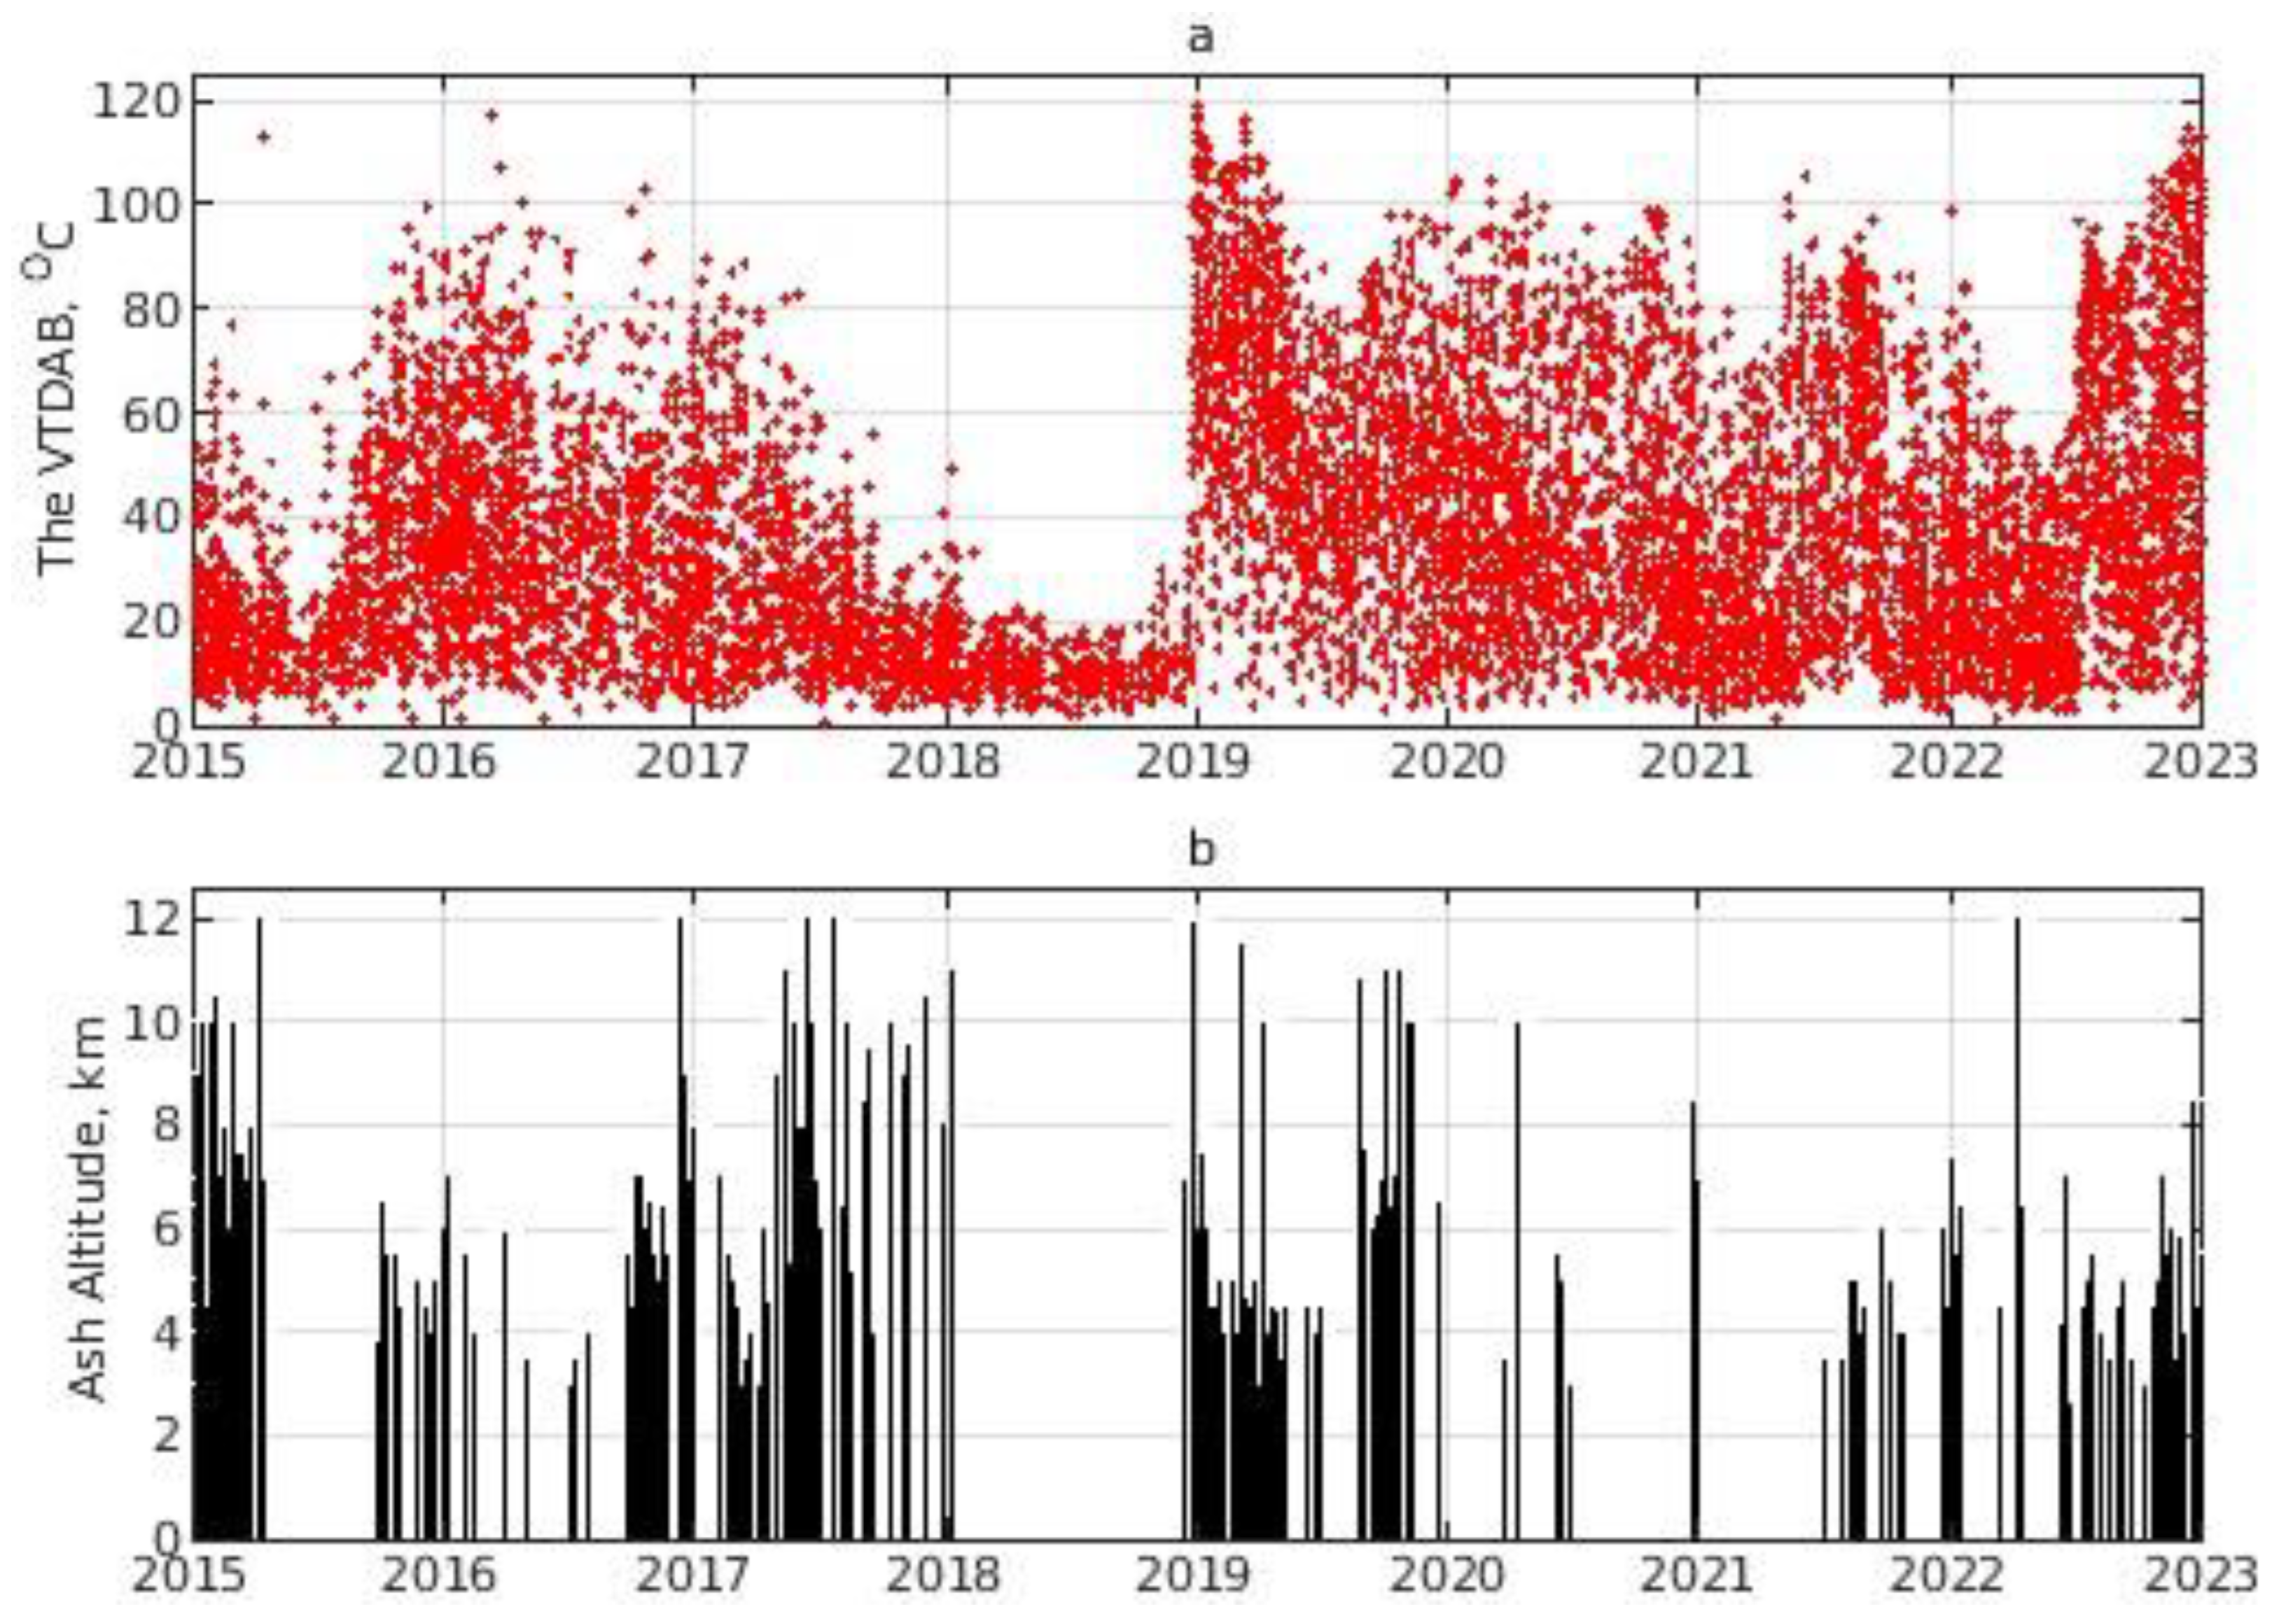
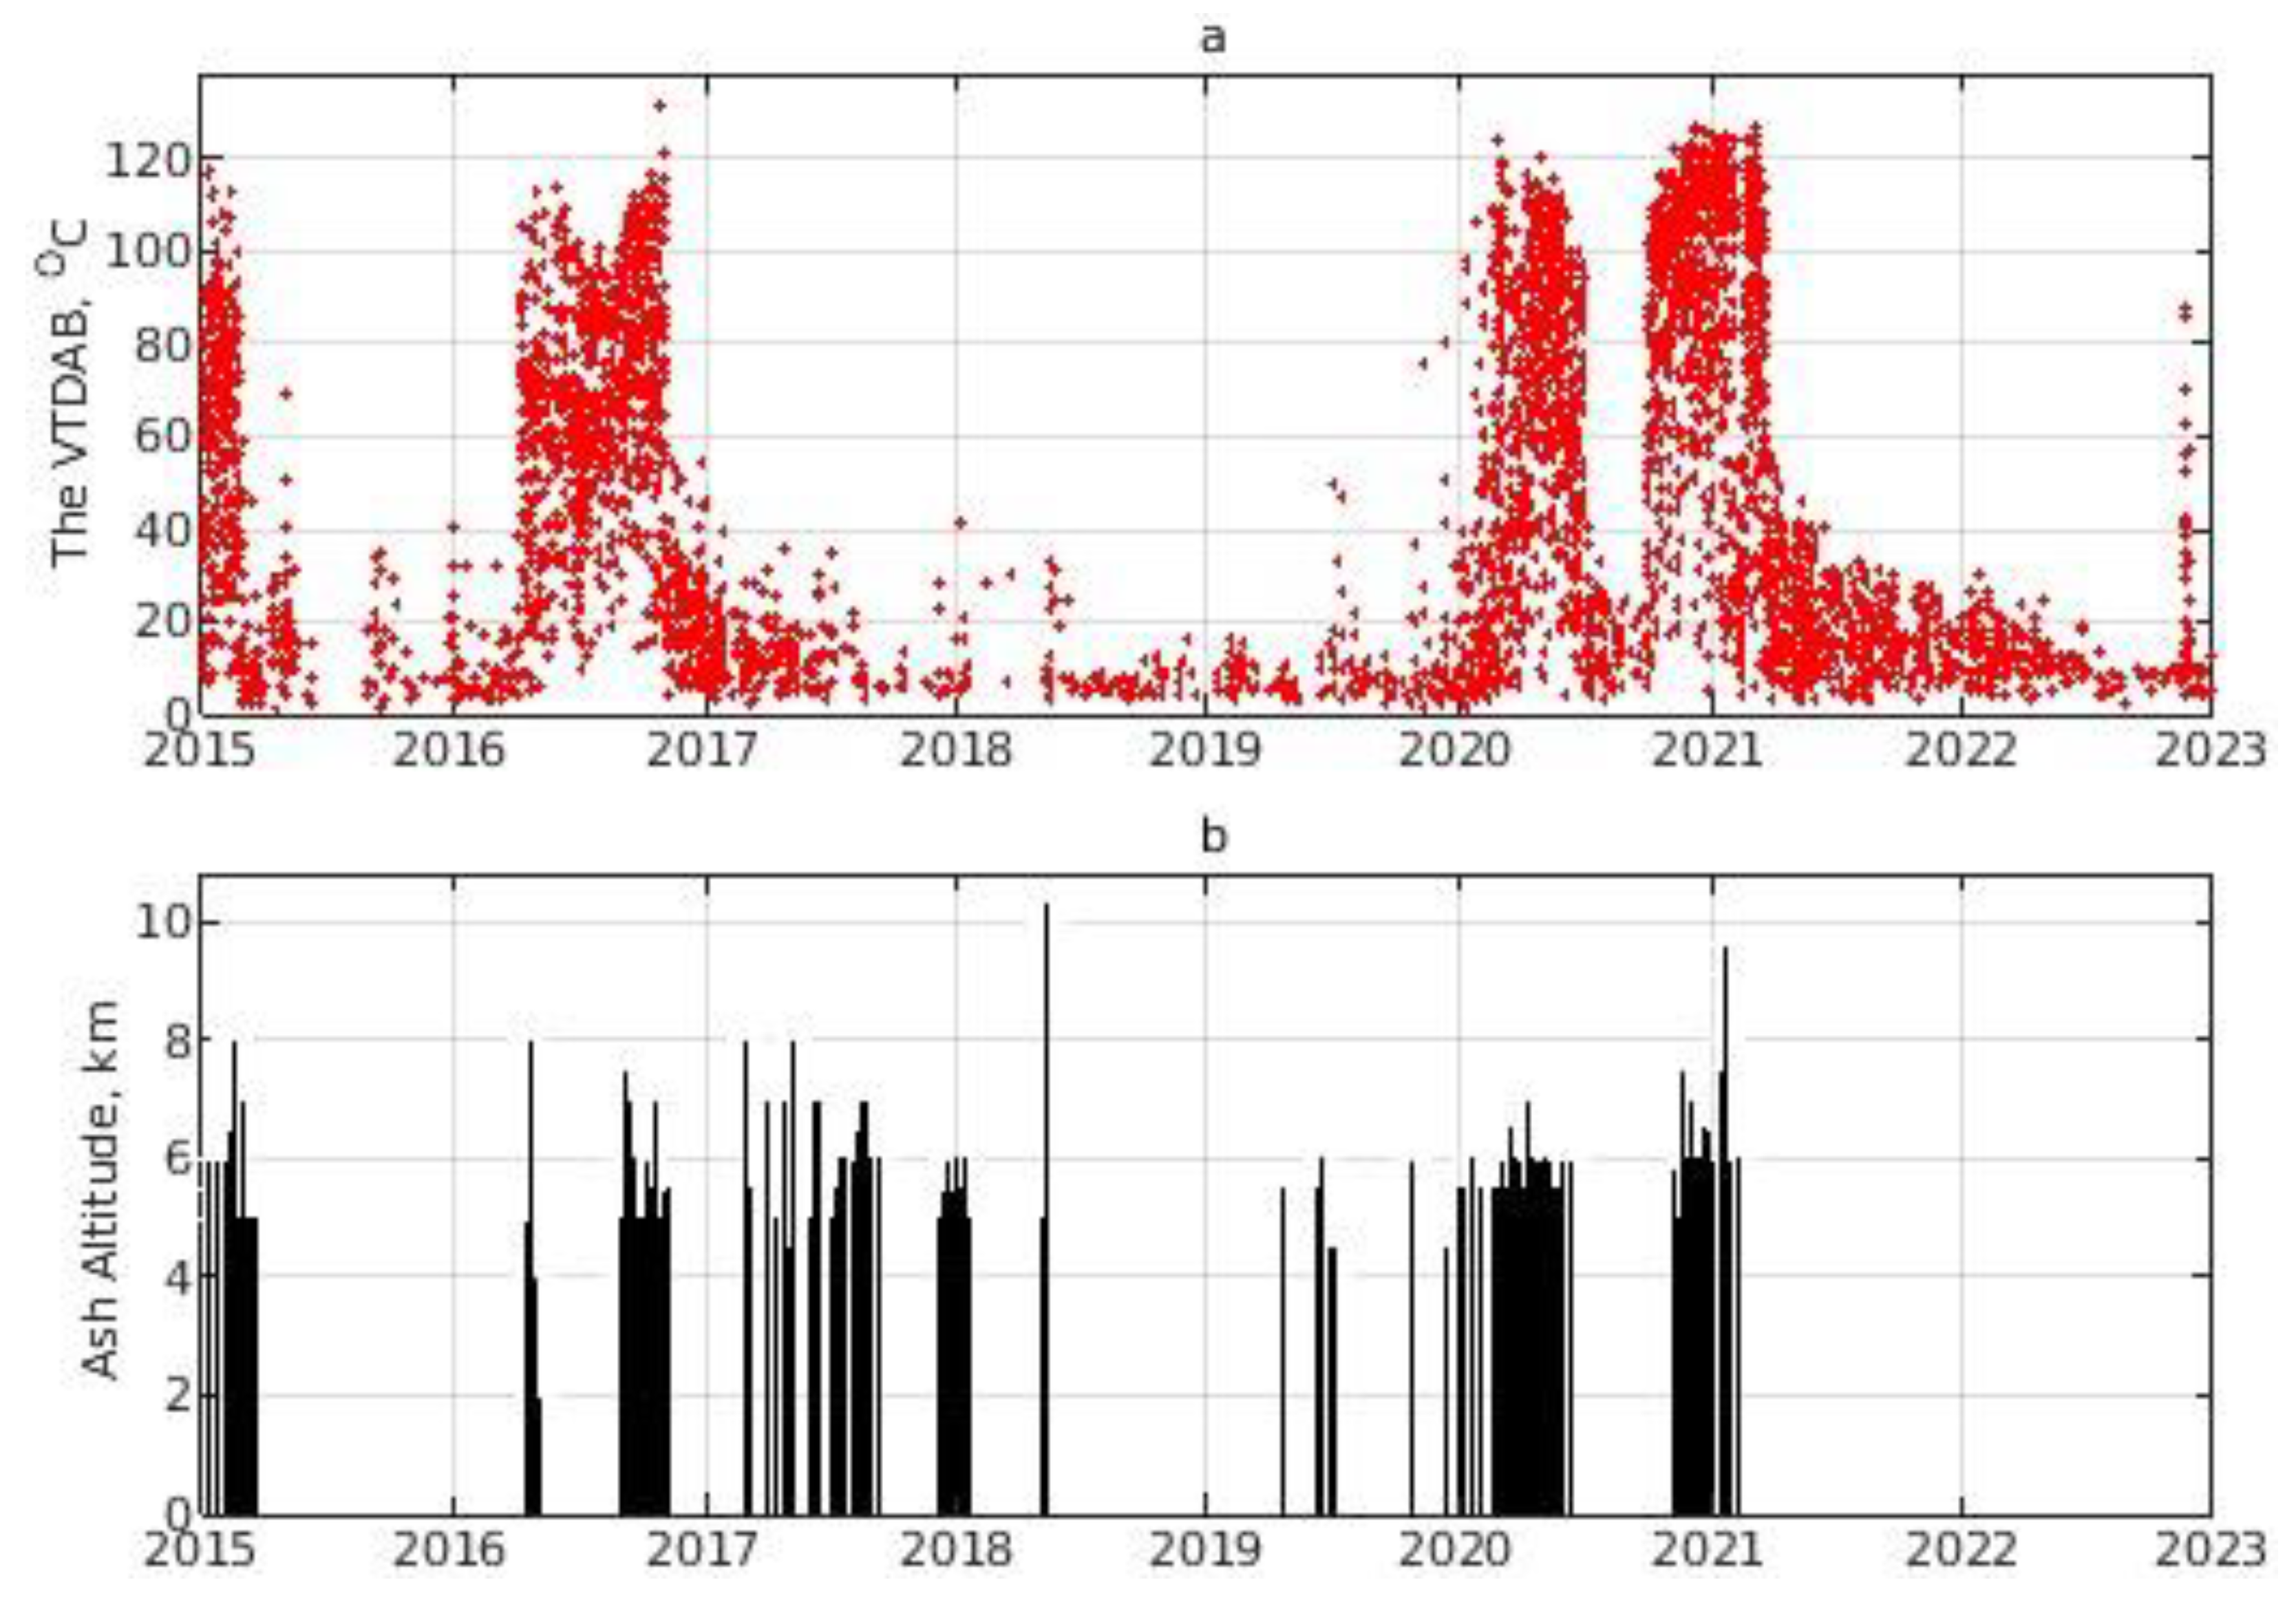
- The explosive eruption of the Bezymianny volcano sometimes began after the end of the explosive-effusive eruption of Klyuchevskoy (for example, on 15 December and 6 November 2016, respectively). Moreover, sometimes the explosive eruption of Bezymianny (on 21 October 2020) occurred against the background of the explosive-effusive eruption of Klyuchevskoy (from 30 September, 2020, to 8 February 2021). The cases of a simultaneous increase in the VTDAB for the Bezymianny and Klyuchevskoy volcanoes were registered, for example: the VTDAB was 27.4 and 40.6 °C, respectively, on 1 January 2016; it was 39.2 and 41.4 °C, respectively, on 3 January 2018; and it was 77.2 and 87.8 °C, respectively, on 20 November 2022 (Figure 6a and Figure 7a).
- Analysis of the data showed that during the eruption of the Klyuchevskoy volcano, the VTDAB of the Sheveluch volcano slightly decreased. The Sheveluch had the highest VTDAB when the Klyuchevskoy was quiet.
- In 2017–2019, volcanoes of the Northern group of the Kamchatka were in a state of relative rest: the Sheveluch volcano—from 10 February 2018 to 1 November 2019; the Klyuchevskoy volcano − from 16 June 2018 to 13 June 2019; and the Bezymianny volcano—from 20 December 2017 to 20 January 2019. Therefore, all active volcanoes in the Northern group of Kamchatka were quiet from 16 June to 1 November 2018 (Figure 5, Figure 6 and Figure 7).
5. Conclusions
Supplementary Materials
Author Contributions
Funding
Data Availability Statement
Acknowledgments
Conflicts of Interest
References
- Miller, T.P.; Casadevall, T.J. Volcanic ash hazards to aviation. In Encyclopedia of Volcanoes; Sigurdsson, H., Ed.; Academic Press: London, UK; San Diego, CA, USA, 2000; pp. 915–930. [Google Scholar]
- Prata, A.; Rose, W. Volcanic ash hazard to aviation. In Encyclopedia of Volcanoes, 2nd ed.; Sigurdsson, H., Houghton, B., McNutt, S., Rymer, H., Stix, J., Eds.; Academic Press: London, UK; San Diego, CA, USA; Waltham, MA, USA, 2015; pp. 911–934. [Google Scholar]
- Lechner, P.; Tupper, A.; Guffanti, M.; Loughlin, S.; Casadevall, T. Volcanic Ash and Aviation—The Challenges of Real-Time, Global Communication of a Natural Hazard. In Observing the Volcano World. Advances in Volcanology; Fearnley, C.J., Bird, D.K., Haynes, K., McGuire, W.J., Jolly, G., Eds.; Springer: Cham, Switzerland, 2017; pp. 51–64. [Google Scholar] [CrossRef]
- Kirianov, V.Y. Assessment of Kamchatkan Ash Hazard to Airlines. Volcanol. Seismol. 1993, 14, 246–269. [Google Scholar]
- Kirianov, V.Y. Volcanic ash in Kamchatka as a Source of Potential Hazard to Air Traffic. In Volcanic Ash and Aviation Safety: Proceedings of the First International Symposium on Volcanic Ash and Aviation Safety; Casadevall, T.J., Ed.; United States Government Printing Office: Washington, WA, USA, 1994; pp. 57–64. [Google Scholar]
- Neal, C.A.; Girina, O.A.; Senyukov, S.L.; Rybin, A.V.; Osiensky, J.; Izbekov, P.; Ferguson, G. Russian Eruption Warning Systems for Aviation. Nat. Hazards 2009, 51, 245–262. [Google Scholar] [CrossRef]
- Gordeev, E.I.; Girina, O.A. Volcanoes and Their Hazard to Aviation. Her. Russ. Acad. Sci. 2014, 84, 1–8. [Google Scholar] [CrossRef]
- Igarashi, Y.; Girina, O.A.; Osiensky, J.; Moore, D. International Coordination in Managing Airborne Ash Hazards: Lessons from the Northern Pacific. In Observing the Volcano World. Advances in Volcanology; Fearnley, C.J., Bird, D.K., Haynes, K., McGuire, W.J., Jolly, G., Eds.; Springer: Cham, Switzerland, 2017; pp. 529–547. [Google Scholar] [CrossRef]
- Girina, O.A.; Gordeev, E.I. KVERT Project: Reduction of volcanic hazards for aviation from explosive eruptions of Kamchatka and Northern Kuriles volcanoes. Bull. East. Br. Russ. Acad. Sci. 2007, 2, 100–109. Available online: http://elibrary.ru/item.asp?id=10082046 (accessed on 10 July 2023).
- Girina, O.A.; Loupian, E.A.; Sorokin, A.A.; Melnikov, D.V.; Romanova, I.M.; Kashnitskii, A.V.; Uvarov, I.A.; Malkovsky, S.I.; Korolev, S.P.; Manevich, A.G.; et al. Comprehensive Monitoring of Explosive Volcanic Eruptions of Kamchatka; Girina, O.A., Ed.; IVS FEB RAS: Petropavlovsk-Kamchatsky, Russia, 2018; 192p, Available online: https://elibrary.ru/item.asp?id=37061627 (accessed on 10 July 2023). (In Russian)
- Glaze, L.; Francis, P.W.; Rothery, D.A. Measuring Thermal Budgets of Active Volcanoes by Satellite Remote Sensing. Nature 1989, 338, 144–146. [Google Scholar] [CrossRef]
- Dehn, J.; Dean, K.; Engle, K. Thermal Monitoring of North Pacific Volcanoes from Space. Geology 2000, 28, 755–758. [Google Scholar] [CrossRef]
- Dehn, J.; Dean, K.G.; Engle, K.; Izbekov, P. Thermal Precursors in Satellite Images of the 1999 Eruption of Shishaldin Volcano. Bull. Volcanol. 2002, 64, 525–534. [Google Scholar] [CrossRef]
- Girina, O.A. On Precursor of Kamchatkan Volcanoes Eruptions Based on Data from Satellite Monitoring. J. Volcanolog. Seismol. 2012, 6, 142–149. [Google Scholar] [CrossRef]
- Reath, K.A.; Ramsey, M.S.; Dehn, J.; Webley, P.W. Predicting eruptions from precursory activity using remote sensing data hybridization. J. Volcanol. Geotherm. Res. 2016, 321, 18–30. [Google Scholar] [CrossRef]
- Gorshkov, G.S. Gigantic Eruption of the Volcano Bezymianny. Bull. Volcanol. 1959, 20, 77–109. [Google Scholar] [CrossRef]
- Gorshkov, G.S.; Bogoyavlenskaya, G.E. Bezymianny Volcano and Peculiarities of Its Last Eruptions in 1955–1963; Piip, B.I., Ed.; Nauka: Moscow, Russia, 1965; 172p. (In Russian) [Google Scholar]
- Gorshkov, G.S.; Doubik, Y.M. A Directed Explosion at Sheveluch volcano. In Volcanoes and Eruptions; Gorshkov, G.S., Ed.; Nauka: Moscow, Russia, 1969; pp. 3–37. (In Russian) [Google Scholar]
- Girina, O.A. Chronology of Bezymianny Volcano activity, 1956–2010. J. Volcanol. Geoth. Res. 2013, 263, 22–41. [Google Scholar] [CrossRef]
- Girina, O.A.; Malkovsky, S.I.; Sorokin, A.A.; Loupian, E.A.; Korolev, S.P. Numerical Modeling of the Ash Cloud Movement from the Catastrophic Eruption of the Sheveluch Volcano in November 1964. Remote Sens. 2022, 14, 3449. [Google Scholar] [CrossRef]
- Fedotov, S.A.; Masurenkov, Y.P. (Eds.) Active Volcanoes of Kamchatka; Nauka: Moscow, Russia, 1991; Volume 2, 717p. [Google Scholar]
- Girina, O.A.; Manevich, A.G.; Malik, N.A.; Melnikov, D.V.; Ushakov, S.V.; Demyanchuk, Y.V.; Kotenko, L.V. Active Volcanoes of Kamchatka and Northern Kurils in 2005. J. Volcanol. Seismol. 2007, 1, 237–247. [Google Scholar] [CrossRef]
- Carter, A.J.; Girina, O.A.; Ramsey, M.S.; Demyanchuk, Y.V. ASTER and Field Observations of the 24 December 2006 Eruption of Bezymianny Volcano, Russia. Remote Sens. Environ. 2008, 112, 2569–2577. [Google Scholar] [CrossRef]
- Girina, O.A.; Ushakov, S.V.; Malik, N.A.; Manevich, A.G.; Melnikov, D.V.; Nuzhdaev, A.A.; Demyanchuk, Y.V.; Kotenko, L.V. The Active Volcanoes of Kamchatka and Paramushir Island, North Kurils in 2007. J. Volcanol. Seismol. 2009, 3, 1–17. [Google Scholar] [CrossRef]
- Ozerov, A.Y.; Girina, O.A.; Zharinov, N.A.; Belousov, A.B.; Demyanchuk, Y.V. Eruptions in the Northern Group of Volcanoes, in Kamchatka, during the Early 21st Century. J. Volcanolog. Seismol. 2020, 14, 1–17. [Google Scholar] [CrossRef]
- Girina, O.A.; Loupian, E.A.; Sorokin, A.A.; Melnikov, D.V.; Manevich, A.G.; Manevich, T.M. Satellite and Ground-Based Observations of Explosive Eruptions on Zhupanovsky Volcano, Kamchatka, Russia in 2013 and in 2014–2016. J. Volcanolog. Seismol. 2018, 12, 1–15. [Google Scholar] [CrossRef]
- Girina, O.A.; Manevich, A.G.; Melnikov, D.V.; Nuzhdaev, A.A.; Petrova, E.G. The 2016 Eruptions in Kamchatka and on the North Kuril Islands: The Hazard to Aviation. J. Volcanolog. Seismol. 2019, 13, 157–171. [Google Scholar] [CrossRef]
- Horváth, Á.; Girina, O.A.; Carr, J.L.; Wu, D.L.; Bril, A.A.; Mazurov, A.A.; Melnikov, D.V.; Hoshyaripour, G.A.; Buehler, S.A. Geometric estimation of volcanic eruption column height from GOES-R near-limb imagery—Part 2: Case studies. Atmos. Chem. Phys. 2021, 21, 12207–12226. [Google Scholar] [CrossRef]
- Ivanov, B.V.; Chirkov, A.M.; Dubik, Y.M.; Gavrilov, V.A.; Stepanov, V.V.; Rulenko, O.P. The State of the Kamchatka and the Kuril Islands volcanoes in 1980. Volcanolog. Seismol. 1981, 3, 99–104. (In Russian) [Google Scholar]
- Girina, O.A.; Loupian, E.A.; Horvath, A.; Melnikov, D.V.; Manevich, A.G.; Nuzhdaev, A.A.; Bril, A.A.; Ozerov, A.Y.; Kramareva, L.S.; Sorokin, A.A. Analysis of the development of the paroxysmal eruption of Sheveluch volcano on April 10–13, 2023, based on data from various satellite systems. Sovrem. Probl. Distantsionnogo Zondirovaniya Zeml. Kosm. 2023, 20, 283–291. (In Russian) [Google Scholar] [CrossRef]
- Piip, B.I. Klyuchevskoy Volcano and Its Eruptions in 1944–1945 and in the Past; Vlodavets, V.I., Ed.; AS USSR: Moscow, Russia, 1956; 312p. (In Russian) [Google Scholar]
- Ermakov, V.A. Formational Subdivision of Quaternary Volcanic Rocks; Nedra: Moscow, Russia, 1977; 224p. (In Russian) [Google Scholar]
- Calvari, S.; Lodato, L.; Steffke, A.; Cristaldi, A.; Harris, A.J.L.; Spampinato, L.; Boschi, E. The 2007 Stromboli eruption: Event chronology and effusion rates using thermal infrared data. J. Geophys. Res. 2010, 115, B0421. [Google Scholar] [CrossRef]
- Burgi, P.-Y.; Darrah, T.H.; Tedesco, D.; Eymold, W.K. Dynamics of the Mount Nyiragongo lava lake. J. Geophys. Res. Solid Earth 2014, 119, 4106–4122. [Google Scholar] [CrossRef]
- Mouginis-Mark, P.J.; Garbeil, H.; Flament, P. Effects of Viewing Geometry on AVHRR Observations of Volcanic Thermal Anomalies. Remote Sens. Environ. 1994, 48, 51–60. [Google Scholar] [CrossRef]
- Rose, S.; Ramsey, M. The 2005 eruption of Kliuchevskoi volcano: Chronology and processes derived from ASTER spaceborne and field-based data. J. Volcanol. Geother. Res. 2009, 184, 367–380. [Google Scholar] [CrossRef]
- Wooster, M.J.; Kaneko, T.; Nakada, S.; Shimizu, H. Discrimination of lava dome activity styles using satellite-derived thermal structures. J. Volcanol. Geother. Res. 2000, 102, 97–118. [Google Scholar] [CrossRef]
- Vaughan, R.G.; Hook, S.J.; Ramsey, M.S.; Realmuto, V.J.; Schneider, D.J. Monitoring eruptive activity at Mount Saint Helens with TIR image data. Geoph. Res. Lett. 2005, 32, L10305. [Google Scholar] [CrossRef]
- Thompson, J.O.; Contreras-Arratia, R.; Befus, K.S.; Ramsey, M. Thermal and seismic precursors to the explosive eruption at La Soufrière Volcano, St. Vincent in April 2021. Earth Planet. Sci. Lett. 2022, 592, 117621. [Google Scholar] [CrossRef]
- Schneider, D.J.; Dean, K.G.; Dehn, J.; Miller, T.P.; Kirianov, V.U. Monitoring and analyses of volcanic activity using remote sensing data at the Alaska Volcano Observatory: Case study for Kamchatka, Russia, December 1997. In Remote Sensing of Active Volcanism, Geophysical Monograph; Mouginis-Mark, P.J., Crisp, J.A., Fink, J.H., Eds.; American Geophysical Union: Washington, DC, USA, 2000; Volume 116, pp. 65–85. [Google Scholar] [CrossRef]
- Ramsey, M.S.; Dehn, J. Spaceborne observations of the 2000 Bezymianny, Kamchatka eruption: The integration of high-resolution ASTER data into near real-time monitoring using AVHRR. J. Volcanol. Geother. Res. 2004, 135, 127–146. [Google Scholar] [CrossRef]
- Carter, A.J.; Ramsey, M.S. ASTER- and field-based observations at Bezymianny Volcano: Focus on the 11 May 2007 pyroclastic flow deposit. Remote Sens. Environ. 2009, 113, 2142–2151. [Google Scholar] [CrossRef]
- Carter, A.J.; Ramsey, M.S. Long-Term Volcanic Activity at Shiveluch Volcano: Nine Years of ASTER Spaceborne Thermal Infrared Observations. Remote Sens. 2010, 2, 2571–2583. [Google Scholar] [CrossRef]
- Ramsey, M.S.; Wessels, R.L.; Anderson, S.W. Surface textures and dynamics of the 2005 lava dome at Shiveluch volcano, Kamchatka. GSA Bull. 2012, 124, 678–689. [Google Scholar] [CrossRef]
- Corradino, C.; Ramsey, M.S.; Pailot-Bonnétat, S.; Harris, A.J.L.; Del Negro, C. Detection of subtle thermal anomalies: Deep learning applied to the ASTER global volcano dataset. IEEE Transact. Geosc. Remote Sens. 2023, 61, 5000715. [Google Scholar] [CrossRef]
- Van Manen, S.M.; Dehn, J. Satellite remote sensing of thermal activity at Bezymianny and Kliuchevskoi from 1993 to 1998. Geology 2009, 37, 983–986. [Google Scholar] [CrossRef]
- Van Manen, S.M.; Blake, S.; Dehn, J. A near real-time dual-band-spatial approach to determine the source of increased radiance from closely spaced active volcanoes in coarse resolution satellite data. Intern. J. Remote Sens. 2011, 32, 6055–6069. [Google Scholar] [CrossRef]
- Van Manen, S.M.; Blake, S.; Dehn, J. Satellite thermal infrared data of Shiveluch, Kliuchevskoi and Karymsky, 1993-2008: Effusion, explosions and the potential to forecast ash plumes. Bull. Volcanol. 2012, 74, 1313–1335. [Google Scholar] [CrossRef]
- Girina, O.A.; Loupian, E.A.; Melnikov, D.V.; Kashnitskii, A.V.; Uvarov, I.A.; Bril, A.A.; Konstantinova, A.M.; Burtsev, M.A.; Manevich, A.G.; Gordeev, E.I.; et al. Creation and development of the information system “Remote Monitoring of Kamchatka and Kuril Islands Volcanic Activity”. Sovrem. Probl. Distantsionnogo Zondirovaniya Zeml. Kosm. 2019, 16, 249–265. (In Russian) [Google Scholar] [CrossRef]
- Loupian, E.A.; Proshin, A.A.; Burtsev, M.A.; Kashnitskii, A.V.; Balashov, I.V.; Bartalev, S.A.; Konstantinova, A.M.; Kobets, D.A.; Mazurov, A.A.; Marchenkov, V.V.; et al. Experience of development and operation of the IKI-Monitoring center for collective use of systems for archiving, processing and analyzing satellite data. Sovrem. Probl. Distantsionnogo Zondirovaniya Zeml. Kosm. 2019, 16, 151–170. (In Russian) [Google Scholar] [CrossRef]
- Gordeev, E.I.; Girina, O.A.; Lupyan, E.A.; Sorokin, A.A.; Kramareva, L.S.; Efremov, V.Y.; Kashnitskii, A.V.; Uvarov, I.A.; Burtsev, M.A.; Romanova, I.M.; et al. The VolSatView information system for Monitoring the Volcanic Activity in Kamchatka and on the Kuril Islands. J. Volcanol. Seismol. 2016, 10, 382–394. [Google Scholar] [CrossRef]
- Egorov, V.A.; Ilyin, V.O.; Loupian, E.A.; Mazurov, A.A.; Flitman, E.V. Possibilities of building automated systems for processing satellite data on the basis of the XV_SAT software complex. Sovrem. Probl. Distantsionnogo Zondirovaniya Zeml. Kosm. 2004, 1, 431–436. (In Russian) [Google Scholar]
- Loupian, E.A.; Mazurov, A.A.; Nazirov, R.R.; Proshin, A.A.; Flitman, E.V. Technology for building automated information systems for collecting, processing, storing and distributing satellite data for solving scientific and applied problems. Sovrem. Probl. Distantsionnogo Zondirovaniya Zeml. Kosm. 2004, 1, 81–88. (In Russian) [Google Scholar]
- Loupian, E.A.; Mazurov, A.A.; Nazirov, R.R.; Proshin, A.A.; Flitman, E.V.; Krasheninnikova, Y. Technologies for building remote monitoring information systems. Sovrem. Probl. Distantsionnogo Zondirovaniya Zeml. Kosm. 2011, 8, 26–43. (In Russian) [Google Scholar]
- Loupian, E.A.; Balashov, I.V.; Burtsev, M.A.; Efremov, V.Y.; Kashnitskyi, A.V.; Kobets, D.A.; Krasheninnikova, Y.S.; Mazurov, A.A.; Nazirov, R.R.; Proshin, A.A.; et al. Development of information systems design technologies. Sovrem. Probl. Distantsionnogo Zondirovaniya Zeml. Kosm. 2015, 12, 53–75. (In Russian) [Google Scholar]
- Loupian, E.A.; Burtsev, M.A.; Proshin, A.A.; Kobets, D.A. Evolution of remote monitoring information systems development concepts. Sovrem. Probl. Distantsionnogo Zondirovaniya Zeml. Kosm. 2018, 15, 53–66. (In Russian) [Google Scholar] [CrossRef]
- Proshin, A.A.; Loupian, E.A.; Balashov, I.V.; Kashnitskyi, A.V.; Burtsev, M.A. Unified satellite data archive management platform for remote monitoring systems development. Sovrem. Probl. Distantsionnogo Zondirovaniya Zeml. Kosm. 2016, 13, 9–27. (In Russian) [Google Scholar] [CrossRef]
- Korolev, S.P.; Sorokin, A.A.; Verkhoturov, A.L.; Konovalov, A.V.; Shestakov, N.V. Automated information system for instrument-data processing of the regional seismic observation network of FEB RAS. Seism. Instrum. 2015, 51, 209–218. [Google Scholar] [CrossRef]
- Sorokin, A.A.; Korolev, S.P.; Polyakov, A.N. Development of Information Technologies for Storage of Data of Instrumental Observation Networks of the Far Eastern Branch of the Russian Academy of Sciences. Procedia Comput. Sci. 2015, 66, 584–591. [Google Scholar] [CrossRef][Green Version]
- Sorokin, A.A.; Makogonov, S.I.; Korolev, S.P. The Information Infrastructure for Collective Scientific Work in the Far East of Russia. Sci. Tech. Inform. Process. 2017, 4, 302–304. [Google Scholar] [CrossRef]
- Uvarov, I.A.; Khalikova, O.A.; Balashov, I.V.; Burtsev, M.A.; Loupian, E.A.; Matveev, A.A.; Platonov, A.E.; Proshin, A.A.; Tolpin, V.A.; Krasheninnikova, Y.S. Meteorological data management in framework of the satellite monitoring information systems. Sovrem. Probl. Distantsionnogo Zondirovaniya Zeml. Kosm. 2013, 10, 30–45. (In Russian) [Google Scholar]
- Tolpin, V.A.; Balashov, I.V.; Efremov, V.Y.; Loupian, E.A.; Proshin, A.A.; Uvarov, I.A.; Flitman, E.V. The GEOSMIS System: Developing interfaces to operate data in modern remote monitoring systems. Sovrem. Probl. Distantsionnogo Zondirovaniya Zeml. Kosm. 2011, 8, 93–108. (In Russian) [Google Scholar]
- Tolpin, V.A.; Balashov, I.V.; Loupian, E.A.; Savin, I.Y. Satellite service “VEGA-Science”. Earth Space 2011, 9, 32–37. (In Russian) [Google Scholar]
- Harris, A.J.L.; Swabey, S.E.J.; Higgins, J. Automated thresholding of active lavas using AVHRR data. Intern. J. Remote Sens. 1995, 16, 3681–3686. [Google Scholar] [CrossRef]
- Flasse, S.P.; Ceccato, P.S. A contextual algorithm for AVHRR fire detection. Intern. J. Remote Sens. 1996, 17, 419–424. [Google Scholar] [CrossRef]
- Harris, A.J.L.; Flynn, L.P.; Dean, K.; Pilger, E.; Wooster, M.; Okubo, C.; Mouginis-Mark, P.; Garbeil, H.; Thornber, C.; De La Cruz-Reyna, S.; et al. Real-Time Satellite Monitoring of Volcanic Hot Spots. Remote Sens. Act. Volcanism 2000, 116, 139–159. [Google Scholar] [CrossRef]
- Wright, R.; Flynn, L.P.; Garbeil, H.; Harris, A.; Pilger, E. Automated volcanic eruption detection using MODIS. Remote Sens. Environ. 2002, 82, 135–155. [Google Scholar] [CrossRef]
- Pergola, N.; Marchese, F.; Tramutoli, V. Automated detection of thermal features of active volcanoes by means of infrared AVHRR records. Remote Sens. Environ. 2004, 93, 311–327. [Google Scholar] [CrossRef]
- Wright, R.; Flynn, L.P.; Garbeil, H.; Harris, A.; Pilger, E. MODVOLC: Near-real-time thermal monitoring of global volcanism. J. Volcanol. Geoth. Res. 2004, 135, 29–49. [Google Scholar] [CrossRef]
- Coppola, D.; Laiolo, M.; Cigolini, C.; Donne, D.D.; Ripepe, M. Enhanced volcanic hot-spot detection using MODIS IR data: Results from the MIROVA system. Geol. Soc. 2016, 426, 181–205. [Google Scholar] [CrossRef]
- Coppola, D.; Laiolo, M.; Massimetti, F.; Hainzl, S.; Shevchenko, A.V.; Mania, R.; Shapiro, N.M.; Walter, T.R. Thermal remote sensing reveals communication between volcanoes of the Klyuchevskoy Volcanic Group. Sci. Rep. 2021, 11, 13090. [Google Scholar] [CrossRef]
- NOAA KLM User’s Guide. Available online: https://webarchive.library.unt.edu/eot2008/20090506073503/http://www.ncdc.noaa.gov/oa/pod-guide/ncdc/docs/klm/index.htm (accessed on 11 July 2023).
- Worden, A.; Dehn, J.; Webley, P. Frequency based satellite monitoring of small scale explosive activity at remote North Pacific volcanoes. J. Volc. Geoth. Res. 2014, 286, 1–14. [Google Scholar] [CrossRef]
- Melekestsev, I.V.; Volynets, O.N.; Ermakov, V.A.; Kirsanova, T.P.; Masurenkov, Y.P. Sheveluch Volcano. In Active Volcanoes of Kamchatka; Fedotov, S.A., Masurenkov, Y.P., Eds.; Nauka: Moscow, Russia, 1991; Volume 1, pp. 98–103. [Google Scholar]
- Fedotov, S.A.; Zharinov, N.A.; Dvigalo, V.N.; Seliverstov, N.I.; Khubunaya, S.A. The 2001–2004 eruptive cycle of Shiveluch volcano. Volcanol. Seismol. 2004, 6, 3–14. Available online: http://elibrary.ru/item.asp?id=17338146 (accessed on 10 July 2023). (In Russian).
- Girina, O.A.; Ushakov, S.V.; Demyanchuk, Y.V. The paroxysmal eruption of the Young Sheveluch volcano, Kamchatka on May 10, 2004. Bull. Kamchatka Reg. Assoc. Educ. Sci. Cent. Earth Sci. 2007, 10, 65–73. Available online: http://www.kscnet.ru/kraesc/2007/2007_10/art9.pdf (accessed on 9 July 2023). (In Russian).
- Girina, O.A.; Demyanchuk, Y.V.; Melnikov, D.V.; Ushakov, S.V.; Ovsyannikov, A.A.; Sokorenko, A.V. The paroxysmal phase of the February 27, 2005 eruption of Young Shiveluch volcano, Kamchatka. A preliminary report. Volcanol. Seismol. 2006, 1, 16–23. Available online: https://www.elibrary.ru/item.asp?id=9188257 (accessed on 9 July 2023). (In Russian).
- Ovsyannikov, A.A.; Manevich, A.G. The October 2010 eruption of Sheveluch Volcano. Bull. Kamchatka Reg. Assoc. «Educ. Sci. Cent.» Earth Sci. 2010, 16, 7–9. Available online: http://www.kscnet.ru/journal/kraesc/article/view/446/pdf (accessed on 9 July 2023). (In Russian).
- Girina, O.A.; Melnikov, D.V.; Manevich, A.G.; Demyanchuk, Y.V.; Nuzhdaev, A.A.; Petrova, E. Kamchatka and North Kurile Volcano Explosive Eruptions in 2015 and Danger to Aviation. In Proceedings of the 2016 EGU General Assembly, Viena, Austria, 17–22 April 2016. [Google Scholar] [CrossRef]
- Girina, O.A.; Manevich, A.G.; Melnikov, D.V.; Nuzhdaev, A.A.; Demyanchuk, Y.V. The 2015 activity of Kamchatka and Northern Kuriles volcanoes and their danger to aviation. In Volcanism and Associated Processes, Proceedings of the XIX Scientific Conference, 29–30 March 2016; Gordeev, E.I., Ed.; IVS FEB RAS: Petropavlovsk-Kamchatsky, Russia, 2016; pp. 35–45. Available online: http://www.kscnet.ru/ivs/publication/volc_day/2016/art5.pdf (accessed on 9 July 2023). (In Russian)
- Webley, P.; Girina, O.A.; Shipman, J. Remote Sensing Analysis of the 2015-2016 Sheveluch Volcano Activity. In Understanding Active Subduction Processes in North Pacific Arcs, 9th Biennial Workshop on Japan-Kamchatka-Alaska Subduction Processes (JKASP 2016), 31 May–3 June 2016; UAF: Fairbanks, AK, USA, 2016; pp. 105–106. Available online: http://gps.alaska.edu/JKASP/JKASP2016_Scientific_Program_Abstracts.pdf (accessed on 9 July 2023).
- Gordeev, E.I.; Girina, O.A.; Loupian, E.A.; Sorokin, A.A.; Melnikov, D.V.; Manevich, A.G.; Romanova, I.M.; Kramareva, L.S.; Efremov, V.Y.; Kobets, D.A.; et al. Information system VolSatView for a comprehensive analysis of the Kamchatka volcanoes explosive eruptions data. Vestnik Far East Branch Russ. Acad. Sci. 2016, 189, 120–127. (In Russian) [Google Scholar]
- Gorbach, N.V.; Gavrilenko, M.G.; Philosofova, T.M. The chemical and mineral compositions of the Young Sheveluch volcano products of the eruption in September 2016. In Volcanism and Associated Processes, Proceedings of the XX Scientific Conference, 30–31 March 2017; Gordeev, E.I., Ed.; IVS FEB RAS: Petropavlovsk-Kamchatsky, Russia, 2017; pp. 26–29. Available online: http://www.kscnet.ru/ivs/publication/volc_day/2017/art6.pdf (accessed on 9 July 2023). (In Russian)
- Girina, O.A.; Loupian, E.A.; Melnikov, D.V.; Manevich, A.G.; Kashnitskii, A.V.; Blil, A.A.; Sorokin, A.A. The eruptions of Kamchatka Northern volcanic group on 14–18 June 2017. Sovrem. Probl. Distantsionnogo Zondirovaniya Zeml. Kosm. 2017, 14, 317–323. (In Russian) [Google Scholar] [CrossRef]
- Manevich, A.G.; Girina, O.A.; Melnikov, D.V.; Nuzhdaev, A.A. The 2017 activity of Kamchatka volcanoes according to KVERT data. In Volcanism and Associated Processes, Proceedings of the XXI Scientific Conference, 29–30 March 2018; Gordeev, E.I., Ed.; IVS FEB RAS: Petropavlovsk-Kamchatsky, Russia, 2018; pp. 8–11. Available online: http://www.kscnet.ru/ivs/publication/volc_day/2018/art1.pdf (accessed on 9 July 2023). (In Russian)
- Manevich, A.G.; Girina, O.A.; Melnikov, D.V.; Nuzhdaev, A.A.; Demyanchuk, Y.V.; Kotenko, T.A. The 2018 activity of Kamchatka and Kuriles volcanoes. In Volcanism and Associated Processes, Proceedings of the XXII Scientific Conference, 28–29 March 2019; Ozerov, A.Y., Ed.; IVS FEB RAS: Petropavlovsk-Kamchatsky, Russia, 2019; pp. 28–31. Available online: http://www.kscnet.ru/ivs/publication/volc_day/2019/art7.pdf (accessed on 9 July 2023). (In Russian)
- Girina, O.A.; Manevich, A.G.; Melnikov, D.V.; Nuzhdaev, A.A.; Loupian, E.A. The 2019 activity of Kamchatka and Kurile Islands volcanoes and their danger to aviation. In Volcanism and Associated Processes, Proceedings of the XXIII Scientific Conference, 28–29 March 2020; Ozerov, A.Y., Ed.; IVS FEB RAS: Petropavlovsk-Kamchatsky, Russia, 2020; pp. 11–14. Available online: http://www.kscnet.ru/ivs/publication/volc_day/2020/art2.pdf (accessed on 9 July 2023). (In Russian)
- Girina, O.A.; Ozerov, A.Y.; Tsvetkov, V.A.; Demyanchuk, Y.V. Squeezing out plastic lava blocks on Young Shiveluch volcano (Kamchatka) in 2020-2–021. Bull. Kamchatka Reg. Assoc. Educ. Sci. Cent. Earth Sci. 2021, 51, 77–83. (In Russian) [Google Scholar] [CrossRef]
- Girina, O.; Melnikov, D.; Manevich, A.; Nuzhdaev, A.; Romanova, I.; Loupian, E.; Sorokin, A. The 2020 Activity of Kamchatkan Volcanoes and Danger to Aviation. In Proceedings of the EGU General Assembly, Vienna, Austria, 19–30 April 2021. [Google Scholar] [CrossRef]
- Girina, O.A.; Manevich, A.G.; Melnikov, D.V.; Nuzhdaev, A.A.; Romanova, I.M.; Loupian, E.A.; Sorokin, A.A. The 2021 Activity of Kamchatkan Volcanoes and Danger to Aviation. In Proceedings of the EGU General Assembly, Vienna, Austria, 23–27 May 2022. [Google Scholar] [CrossRef]
- Girina, O.A.; Manevich, A.G.; Melnikov, D.V.; Nuzhdaev, A.A.; Romanova, I.M.; Loupian, E.A.; Sorokin, A.A.; Kramareva, L.S.; Demyanchuk, Y.V. The 2021 activity of Kamchatka and Kurile Islands volcanoes and their danger to aviation. In Volcanism and Associated Processes, Proceedings of the XXV Scientific Conference, 30–31 March 2022; Ozerov, A.Y., Ed.; IVS FEB RAS: Petropavlovsk-Kamchatsky, Russia, 2022; pp. 26–29. Available online: http://www.kscnet.ru/ivs/publication/volc_day/2022/art5.pdf (accessed on 9 July 2023). (In Russian)
- Girina, O.A.; Melnikov, D.V.; Manevich, A.G.; Romanova, I.M.; Loupian, E.A.; Sorokin, A.A.; Kramareva, L.S.; Tsvetkov, V.A.; Demyanchuk, Y.V. The 2022 activity of Kamchatka and Kurile Islands volcanoes and their danger to aviation. In Volcanism and Associated Processes, Proceedings of the XXVI Scientific Conference, 30–31 March 2023; Ozerov, A.Y., Ed.; IVS FEB RAS: Petropavlovsk-Kamchatsky, Russia, 2023; pp. 38–41. Available online: http://www.kscnet.ru/ivs/publication/volc_day/2023/art8.pdf (accessed on 9 July 2023). (In Russian)
- Girina, O.A.; Melnikov, D.V.; Manevich, A.G.; Kashnitskii, A.V.; Kramareva, L.S.; Nuzhdaev, A.A. Analysis of the events of the explosive eruption of Bezymianny volcano on October 21, 2020, based on satellite data. Sovrem. Probl. Distantsionnogo Zondirovaniya Zeml. Kosm. 2020, 17, 297–303. (In Russian) [Google Scholar] [CrossRef]
- Girina, O.A.; Melnikov, D.V.; Manevich, A.G.; Romanova, I.M.; Loupian, E.A.; Sorokin, A.A.; Kramareva, L.S.; Tsvetkov, V.A.; Demyanchuk, Y.V. The 2022 paroxysmal explosive eruptions of Bezymianny volcano and their danger to aviation. In Volcanism and Associated Processes, Proceedings of the XXVI Regional Scientific Conference, 30–31 March 2023; Ozerov, A.Y., Ed.; IVS FEB RAS: Petropavlovsk-Kamchatsky, Russia, 2023; pp. 42–45. Available online: http://www.kscnet.ru/ivs/publication/volc_day/2023/art9.pdf (accessed on 9 July 2023). (In Russian)
- Girina, O.A.; Gorbach, N.V. The January 11, 2005 Eruption of Bezymianny volcano. In Problems of Explosive Volcanism (To the 50th Anniversary of the Catastrophic Eruption of Bezymianny Volcano), Proceedings of the International Symposium, 25–30 March 2006; Gordeev, E.I., Ed.; IVS FEB RAS: Petropavlovsk-Kamchatsky, Russia, 2006; pp. 85–94. Available online: http://www.kscnet.ru/ivs/publication/volc_day/2006/art12.pdf (accessed on 9 July 2023). (In Russian)
- Girina, O.A. Satellite high-resolution data used to clarify the position of fault zones within the Klyuchevskaya volcanic group of Kamchatka. Sovrem. Probl. Distantsionnogo Zondirovaniya Zeml. Kosm. 2016, 13, 148–156. (In Russian) [Google Scholar] [CrossRef]
- Girina, O.A.; Melnikov, D.V.; Demyanchuk, Y.V.; Manevich, A.G. The 2016–2017 Bezymianny volcano eruption according to KVERT data. In Volcanism and Associated Processes, Proceedings of the XX Scientific Conference, 30–31 March 2017; Gordeev, E.I., Ed.; IVS FEB RAS: Petropavlovsk-Kamchatsky, Russia, 2017; pp. 14–17. Available online: http://www.kscnet.ru/ivs/publication/volc_day/2017/art3.pdf (accessed on 9 July 2023). (In Russian)
- Girina, O.A.; Melnikov, D.V.; Manevich, A.G.; Demyanchuk, Y.V.; Nuzhdaev, A.A. Volcano Bezymianny in 2016–2018 according to KVERT data. In Volcanism and Associated Processes, Proceedings of the XXI Scientific Conference, 29–30 March 2018; Gordeev, E.I., Ed.; IVS FEB RAS: Petropavlovsk-Kamchatsky, Russia, 2018; pp. 28–31. Available online: http://www.kscnet.ru/ivs/publication/volc_day/2018/art6.pdf (accessed on 9 July 2023). (In Russian)
- Girina, O.A.; Loupian, E.A.; Melnikov, D.V.; Manevich, A.G.; Sorokin, A.A.; Kramareva, L.S.; Uvarov, I.A.; Kashnitskii, A.V. The Bezymianny volcano eruption on December 20, 2017. Sovrem. Probl. Distantsionnogo Zondirovaniya Zeml. Kosm. 2018, 15, 88–99. (In Russian) [Google Scholar] [CrossRef]
- Girina, O.A.; Gorbach, N.V.; Davydova, V.O.; Melnikov, D.V.; Manevich, T.M.; Manevich, A.G.; Demyanchuk, Y.V. The 15 March 2019 Bezymianny Volcano Explosive Eruption and Its Products. J. Volcanol. Seismol. 2020, 14, 394–409. [Google Scholar] [CrossRef]
- Girina, O.A.; Melnikov, D.V.; Manevich, A.G.; Loupian, E.A.; Kramareva, L.S. The characteristics of Bezymianny volcano explosive eruption events on March 15, 2019, inferred from satellite data. Sovrem. Probl. Distantsionnogo Zondirovaniya Zemli Kosm. 2020, 17, 102–114. (In Russian) [Google Scholar] [CrossRef]
- Khrenov, A.P.; Dvigalo, V.N.; Kirsanov, I.T.; Fedotov, S.A.; Gorelchik, V.I.; Zharinov, N.A. Klyuchevskoy Volcano. In Active Volcanoes of Kamchatka; Fedotov, S.A., Masurenkov, Y.P., Eds.; Nauka: Moscow, Russia, 1991; Volume 1, pp. 106–153. [Google Scholar]
- Girina, O.A.; Loupian, E.A.; Manevich, A.G.; Melnikov, D.V.; Sorokin, A.A.; Kramareva, L.S.; Romanova, I.M.; Nuzhdaev, A.A.; Uvarov, I.A.; Malkovsky, S.I.; et al. Remote monitoring of the 2020–2021 summit and lateral eruptions of Klyuchevskoy volcano, Kamchatka. Sovrem. Probl. Distantsionnogo Zondirovaniya Zeml. Kosm. 2022, 19, 153–161. (In Russian) [Google Scholar] [CrossRef]
- Girina, O.A.; Demyanchuk, Y.V.; Melnikov, D.V.; Manevich, A.G.; Manevich, T.M.; Nuzhdaev, A.A.; Muraviev, Y.D. The eruption of the Klyuchevskoy volcano in 2015 and its danger to aviation. In Volcanism and Associated Processes, Proceedings of the XVIII Scientific Conference, 30 March–1 April 2015; Gordeev, E.I., Ed.; IVS FEB RAS: Petropavlovsk-Kamchatsky, Russia, 2015; pp. 16–20. Available online: http://www.kscnet.ru/ivs/publication/volc_day/2015/art3.pdf (accessed on 9 July 2023). (In Russian)
- Girina, O.A.; Melnikov, D.V.; Manevich, A.G.; Nuzhdaev, A.A.; Demyanchuk, Y.V. Chronology of the events of the Klyuchevskoy volcano eruption in 2016 according to KVERT data. In Volcanism and Associated Processes, Proceedings of the XX Scientific Conference, 30–31 March 2017; Gordeev, E.I., Ed.; IVS FEB RAS: Petropavlovsk-Kamchatsky, Russia, 2017; pp. 18–21. Available online: http://www.kscnet.ru/ivs/publication/volc_day/2017/art4.pdf (accessed on 9 July 2023). (In Russian)
- Girina, O.A.; Melnikov, D.V.; Manevich, A.G.; Nuzhdaev, A.A.; Demyanchuk, Y.V. Kamchatka Volcano Explosive Eruptions in 2017 and Danger to Aviation. In Proceedings of the EGU General Assembly, Vienna, Austria, 8–13 April 2018; p. 3805. Available online: http://repo.kscnet.ru/3220/1/EGU2018-3805.pdf (accessed on 10 July 2023).
- Girina, O.A.; Loupian, E.A.; Manevich, A.G.; Melnikov, D.V.; Sorokin, A.A.; Kramareva, L.S.; Romanova, I.M.; Nuzhdaev, A.A.; Kashnitskyi, A.V.; Marchenkov, V.V.; et al. Remote observations of the 2019–2020 explosive-effusive eruption of Klyuchevskoy volcano. Sovrem. Probl. Distantsionnogo Zondirovaniya Zeml. Kosm. 2021, 18, 81–91. (In Russian) [Google Scholar] [CrossRef]
- Girina, O.A.; Melnikov, D.V.; Loupian, E.A.; Manevich, A.G.; Sorokin, A.A.; Kramareva, L.S. Continuous multi-satellite monitoring of volcanoes to detect eruptions using the example of Klyuchevskoy volcano flank eruption in February 2021. Sovrem. Probl. Distantsionnogo Zondirovaniya Zeml. Kosm. 2021, 18, 261–267. (In Russian) [Google Scholar] [CrossRef]
- Ozerov, A.Y.; Girina, O.A.; Melnikov, D.V.; Nuzhdaev, I.A.; Cherkashin, R.I.; Demyanchuk, Y.V.; Tsvetkov, V.A. Klyuchevskoy Volcano: New flank eruption named after G.S. Gorshkov, 2021 (Kamchatka). Bull. Kamchatka Reg. Assoc. Educ. Sci. Cent. Earth Sci. 2021, 49, 5–9. [Google Scholar] [CrossRef]
- Ivanov, B.V.; Braitseva, O.A.; Zubin, M.I. Karymsky Volcano. In Active Volcanoes of Kamchatka; Fedotov, S.A., Masurenkov, Y.P., Eds.; Nauka: Moscow, Russia, 1991; Volume 2, pp. 202–203. [Google Scholar]
- Girina, O.A.; Konstantinova, A.M.; Kramareva, L.S.; Sorokin, A.A.; Manevich, A.G.; Melnikov, D.V.; Romanova, I.M.; Uvarov, I.A.; Malkovsky, S.I.; Korolev, S.P. The April 19, 2022, explosive event at Karymsky volcano (Kamchatka) from satellite data. Sovrem. Probl. Distantsionnogo Zondirovaniya Zeml. Kosm. 2022, 19, 255–260. (In Russian) [Google Scholar] [CrossRef]


| Volcano | Quantity | VTDAB, °C | ||
|---|---|---|---|---|
| Min | Max | Mean | ||
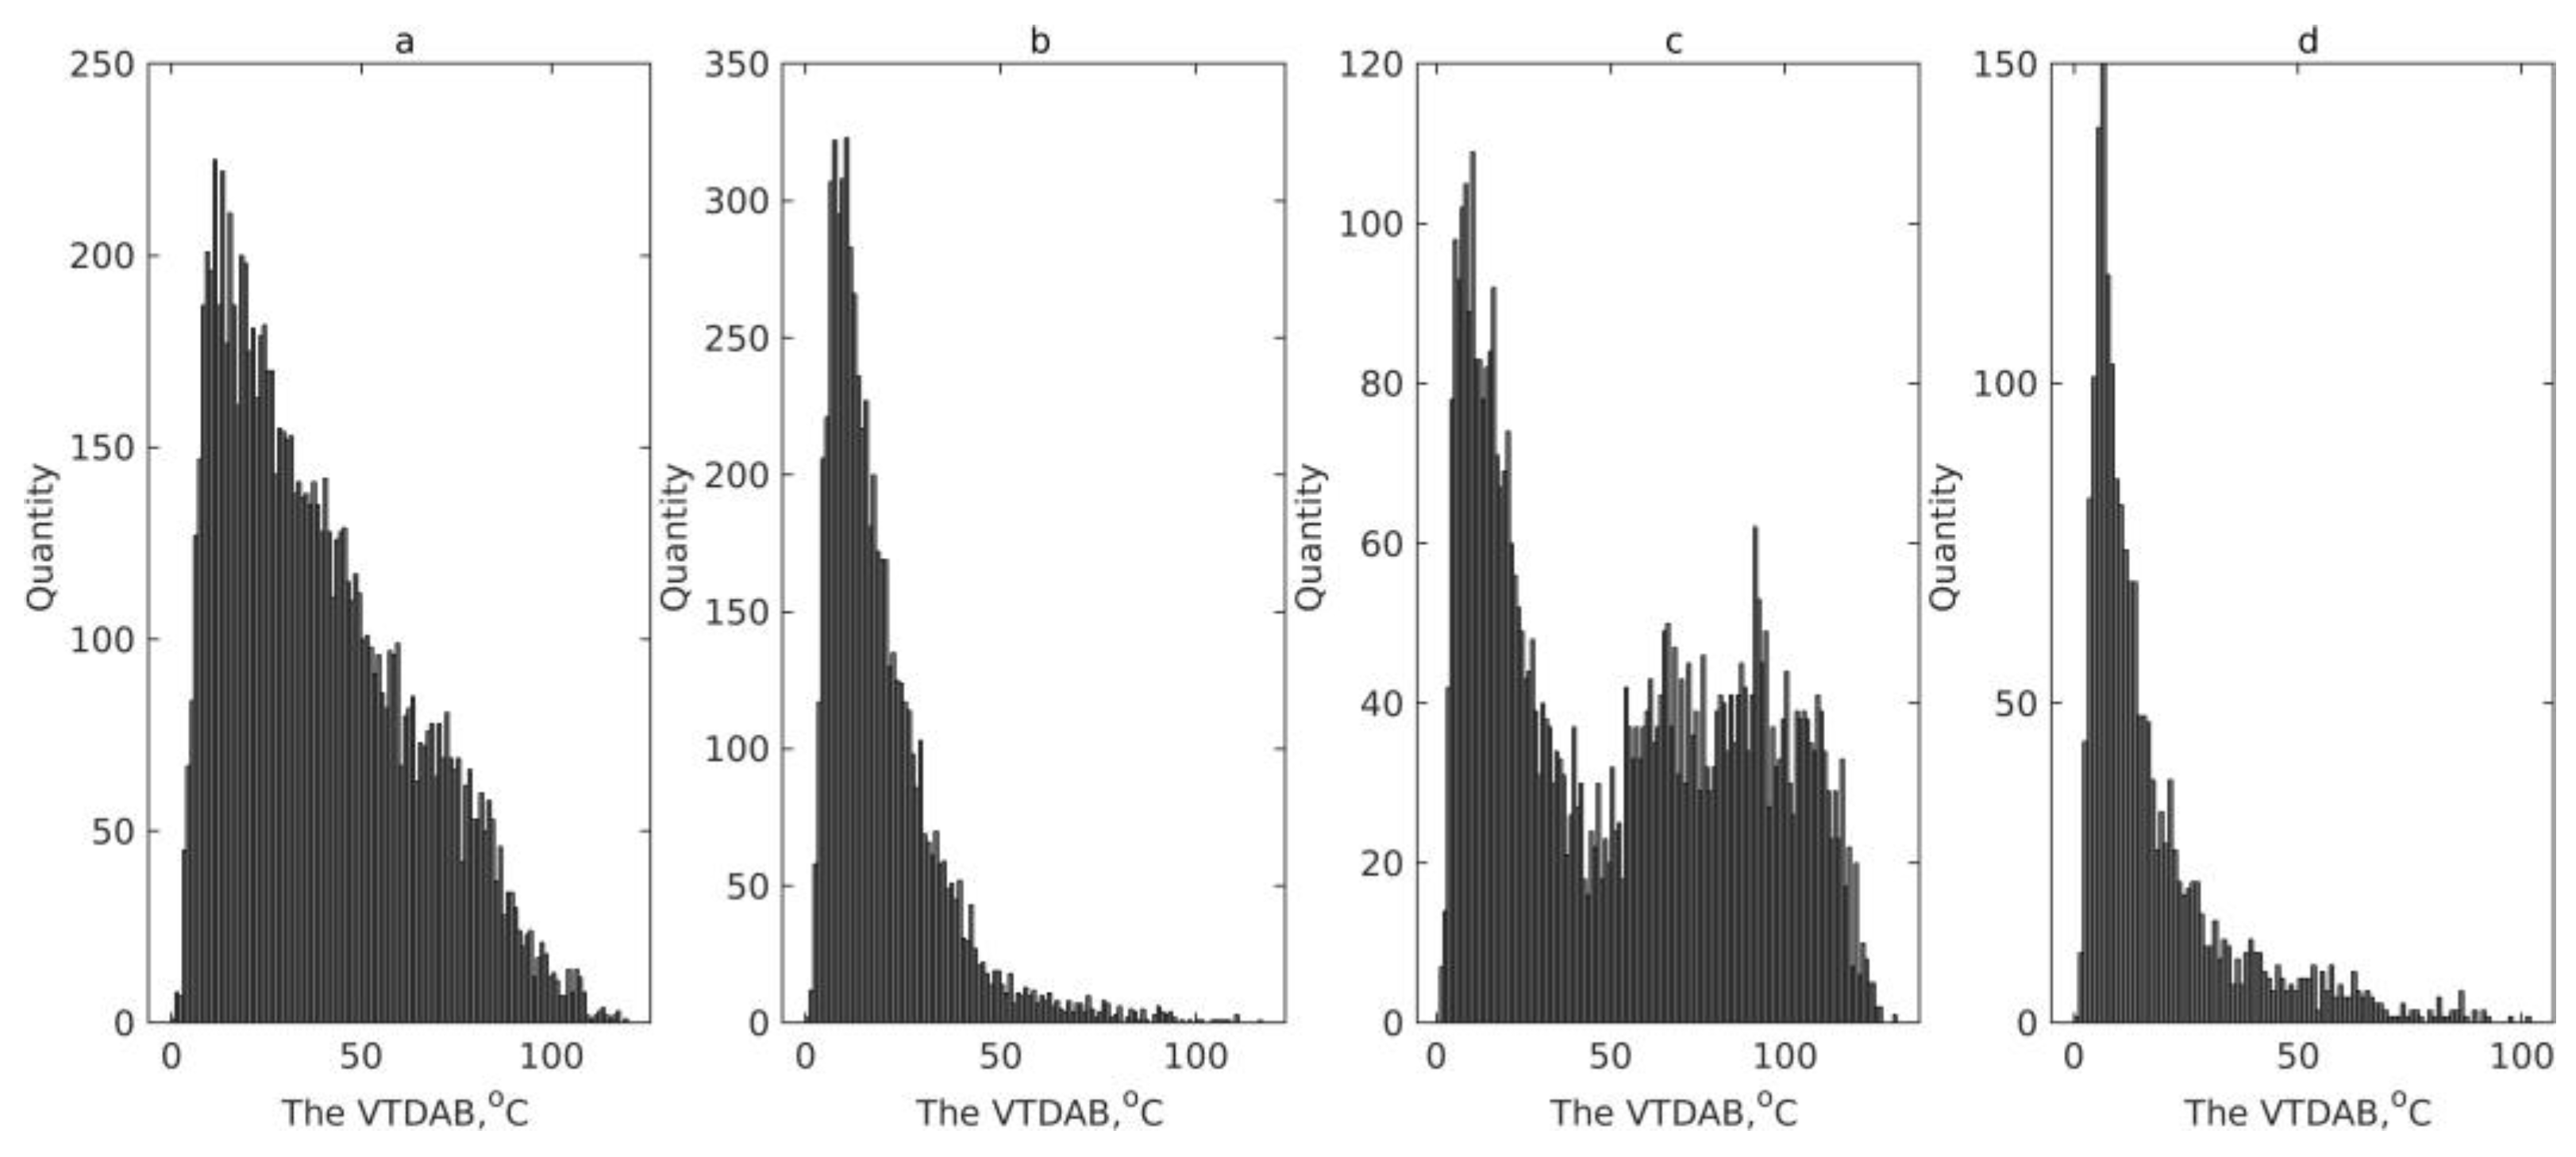
| Sheveluch | 10,236 | 0.8 | 119 | 39 |
| Bezymianny | 6442 | 0.3 | 117 | 19.5 |
| Klyuchevskoy | 5073 | 1.5 | 132 | 52.9 |
| Karymsky | 1924 | 0.7 | 102 | 17.9 |
| Date of Explosive Event | UTC | Ash Altitude, km | Length, km | Direction of Ash Plume |
|---|---|---|---|---|
| 7 January 2015 | 01:42 | 9 | 325 | NW |
| 12 January 2015 | 15:42 | 7 | 178 | WSW |
| 15 January 2015 | 18:06 | 10 | 180 | W |
| 26 January 2015 | 06:28 | 10 | 360 | ESE |
| 1 February 2015 | 15:12 | 10.5 | 780 | ENE |
| 8 February 2015 | 04:33 | 7 | 180 | NW |
| 17 February 2015 | 18:30 | 8 | 840 | SE |
| 28 February 2015 | 01:10 | 10 | 460 | ENE |
| 4 March 2015 | 00:53 | 7 | 607 | NE |
| 8 March 2015 | 04:20 | 7.5 | 790 | E |
| 16 March 2015 | 15:00 | 7.5 | 190 | SE |
| 21 March 2015 | 04:30 | 7 | 225 | NE |
| 26 March 2015 | 00:17 | 8 | 610 | SW |
| 7 April 2015 | 14:20 | 12 | 430 | NE |
| 12 April 2015 | 04:23 | 7 | 480 | E |
| 15 April 2015 | 03:14 | 7 | 216 | E |
| 9 January 2016 | 21:53 | 7 | 190 | W |
| 10 October 2016 | 20:42 | 7 | 55 | E |
| 14 October 2016 | 05:22 | 7 | 206 | NW |
| 17 October 2016 | 02:45 | 7 | 60 | W |
| 9 December 2016 | 21:40 | 12 | 910 | NNE |
| 16 December 2016 | 23:20 | 7.5 | 190 | W |
| 19 December 2016 | 07:52 | 9 | 315 | NE |
| 24 December 2016 | 04:20 | 7 | 60 | SW |
| 30 December 2016 | 15:55 | 7 | 100 | NE |
| 31 December 2016 | 07:14 | 8 | 100 | N |
| 4 February 2017 | 23:00 | 7 | 112 | NW |
| 2 May 2017 | 23:30 | 9 | 342 | NW |
| 11 May 2017 | 20:30 | 10 | 980 | NW |
| 16 May 2017 | 07:44 | 11 | 146 | E |
| 24 May 2017 | 20:30 | 10 | 544 | ESE |
| 31 May 2017 | 02:30 | 8 | 650 | SW |
| 3 June 2017 | 01:00 | 8 | 1300 | SE |
| 7 June 2017 | 02:30 | 7.5 | 338 | SW |
| 8 June 2017 | 00:20 | 8 | 1554 | SW |
| 10 June 2017 | 02:12 | 8 | 328 | SW |
| 11 June 2017 | 04:50 | 7 | 466 | SW |
| 14 June 2017 | 16:30 | 12 | 3000 | N, E |
| 18 June 2017 | 16:59 | 10 | 1430 | SE |
| 27 June 2017 | 01:20 | 7 | 1380 | SE |
| 23 July 2017 | 18:00 | 12 | 1400 | E |
| 8 August 2017 | 16:31 | 10 | 530 | S |
| 7 September 2017 | 13:30 | 8.5 | 115 | SE |
| 7 September 2017 | 21:30 | 8 | 1666 | E |
| 8 September 2017 | 10:35 | 9.5 | 240 | N |
| 11 September 2017 | 19:09 | 9 | 210 | E |
| 12 September 2017 | 20:27 | 9.5 | 113 | SE |
| 13 September 2017 | 00:30 | 9 | 390 | SE |
| 11 October 2017 | 00:01 | 10 | 252 | N |
| 2 November 2017 | 06:00 | 9 | 995 | NE |
| 7 November 2017 | 19:10 | 9.6 | 990 | ENE |
| 4 December 2017 | 21:06 | 10.5 | 500 | ENE |
| 26 December 2017 | 02:10 | 8 | 302 | NE |
| 9 January 2018 | 22:40 | 11 | 2000 | E |
| 26 December 2018 | 20:30 | 12 | 420 | NW |
| 29 December 2018 | 21:30 | 8 | 400 | SW |
| 30 December 2018 | 00:50 | 12 | 340 | SE |
| 9 January 2019 | 23:50 | 7 | 528 | W |
| 10 January 2019 | 07:50 | 7.5 | 110 | W |
| 9 March 2019 | 05:55 | 12 | 380 | N |
| 5 April 2019 | 22:30 | 7.5 | 550 | NW |
| 10 April 2019 | 04:40 | 10 | 1280 | S |
| 29 August 2019 | 05:54 | 11 | 520 | SW |
| 30 August 2019 | 07:57 | 7.5 | 125 | SE |
| 26 September 2019 | 21:20 | 7 | 170 | SE |
| 2 October 2019 | 00:05 | 9 | 1400 | E |
| 6 October 2019 | 01:36 | 11 | 1100 | ENE |
| 13 October 2019 | 12:50 | 7 | 400 | ENE |
| 21 October 2019 | 12:30 | 11 | 1234 | SE |
| 3 November 2019 | 05:10 | 10 | 640 | WNW |
| 5 November 2019 | 19:20 | 7 | 500 | WNW |
| 11 November 2019 | 18:53 | 10 | 1300 | SE |
| 8 April 2020 | 19:30 | 10 | 530 | SE |
| 22 December 2020 | 00:20 | 8 | 623 | ESE |
| 29 December 2020 | 00:10 | 7 | 254 | W |
| 9 April 2022 | 11:00 | 12 | 1980 | NE |
| 19 June 2022 | 20:47 | 7 | 255 | NE |
| 7 November 2022 | 07:20 | 7 | 60 | N |
| 16 December 2022 | 00:20 | 8.5 | 110 | NE |
| Date of Explosive Paroxysm | UTC | Ash Altitude, km | Length of Ash Plume, km | Direction of Ash Plume | Maximal VTDAB, °C | Days before Previous Paroxysm |
|---|---|---|---|---|---|---|
| 15 December 2016 | 10:00 | 4 | 120 | W | 106.4 | 1566 |
| 9 March 2017 | 03:23 | 8 | 442 | NW | 104.6 | 83 |
| 16 June 2017 | 04:53 | 12 | 620 | E | cloudy | 98 |
| 20 December 2017 | 03:40 | 15 | 320 | NE | 56, cloudy | 188 |
| 20 January 2019 | 16:10 | 11 | 870 | NW | 83.9 | 394 |
| 15 March 2019 | 17:30 | 15 | 1300 | E | 117 | 63 |
| 21 October 2020 | 20:22 | 11 | 1160 | SE | 72.9 | 584 |
| 15 March 2022 | 12:53 | 12 | 1310 | ENE | 105.5 | 509 |
| 28 May 2022 | 08:15 | 15 | 3040 | SE | 101 | 72 |
| 23 October 2022 | 11:40 | 10 | 1860 | NE | 110 | 147 |
| Date of Explosive Event | UTC | Ash Altitude, km | Length of Ash Plume, km | Direction of Ash Plume |
|---|---|---|---|---|
| 15 February 2015 | 03:24 | 8 | 1000 | SE |
| 1 March 2015 | 02:30 | 7 | 450 | SE |
| 23 April 2016 | 14:35 | 8 | 522 | SW |
| 6 July 2016 | 10:40 | 7.5 | 400 | E |
| 9 August 2016 | 17:55 | 7 | 264 | ESE |
| 7 September 2016 | 03:29 | 7.5 | 40 | ESE |
| 15 September 2016 | 21:40 | 7 | 40 | NE |
| 20 September 2016 | 21:27 | 8 | 50 | ENE |
| 14 October 2016 | 04:32 | 7 | 40 | NW |
| 21 October 2016 | 01:11 | 7 | 60 | NW |
| 30 October 2016 | 00:36 | 8 | 60 | NE |
| 2 March 2017 | 02:05 | 9 | 25 | NE |
| 29 March 2017 | 20:58 | 7.5 | 312 | SE |
| 30 March 2017 | 03:20 | 7 | 65 | NNW |
| 23 April 2017 | 21:07 | 7 | 72 | WSW |
| 6 May 2017 | 04:31 | 8 | 85 | E |
| 10 June 2017 | 00:23 | 7 | 162 | WSW |
| 11 June 2017 | 21:20 | 7 | 584 | ESE |
| 12 June 2017 | 05:35 | 8 | 130 | SE |
| 15 June 2017 | 06:40 | 7 | 85 | WSW |
| 17 August 2017 | 22:03 | 7 | 55 | NW |
| 20 August 2017 | 04:42 | 7 | 252 | WNW |
| 21 December 2017 | 04:16 | 7 | 68 | E |
| 6 January 2018 | 01:33 | 7 | 20 | SW |
| 14 May 2018 | 16:00 | 10.5 | 45 | NE |
| 13 April 2020 | 02:17 | 7 | 155 | SE |
| 30 April 2020 | 21:50 | 7 | 210 | NW |
| 18 November 2020 | 21:00 | 7.5 | 50 | S |
| 19 November 2020 | 00:38 | 7 | 104 | SE |
| 29 November 2020 | 20:50 | 7 | 50 | NE |
| 5 December 2020 | 02:10 | 7 | 103 | NE |
| 20 December 2020 | 21:50 | 7.5 | 154 | SSE |
| 18 January 2021 | 11:20 | 7.5 | 490 | W |
| 24 January 2021 | 06:00 | 9.6 | 42 | NNE |
| Date of Explosive Event | UTC | Ash Altitude, km | Length of Ash Plume, km | Direction of Ash Plume |
|---|---|---|---|---|
| 15 November 2015 | 23:00 | 7 | 15 | E |
| 30 November 2015 | 03:55 | 7.5 | 80 | ESE |
| 8 November 2020 | 14:08 | 8 | 27 | NE |
| 9 December 2020 | 22:30 | 7.5 | 60 | NW |
| 3 April 2021 | 23:30 | 8.5 | 255 | ENE |
| 10 September 2021 | 15:10 | 7 | 75 | E |
| 3 November 2021 | 07:48 | 11 | 1250 | E |
| 6 November 2021 | 03:40 | 8 | 61 | ENE |
| 14 November 2021 | 03:30 | 7.5 | 22 | NE |
| 18 November 2021 | 09:00 | 8 | 368 | NE |
| 12 January 2022 | 12:00 | 7 | 172 | W |
| 14 April 2022 | 12:50 | 7 | 78 | N |
| 19 April 2022 | 20:10 | 11 | 2000 | NE |
| 28 April 2022 | 02:10 | 10 | 722 | W |
| 14 May 2022 | 01:08 | 8 | 264 | ENE |
| 18 May 2022 | 16:13 | 9.5 | 252 | E |
| 19 May 2022 | 00:37 | 8.5 | 463 | ENE |
| 13 July 2022 | 10:50 | 11 | 346 | SW |
| 31 July 2022 | 01:30 | 8 | 57 | E |
Disclaimer/Publisher’s Note: The statements, opinions and data contained in all publications are solely those of the individual author(s) and contributor(s) and not of MDPI and/or the editor(s). MDPI and/or the editor(s) disclaim responsibility for any injury to people or property resulting from any ideas, methods, instructions or products referred to in the content. |
© 2023 by the authors. Licensee MDPI, Basel, Switzerland. This article is an open access article distributed under the terms and conditions of the Creative Commons Attribution (CC BY) license (https://creativecommons.org/licenses/by/4.0/).
Share and Cite
Girina, O.; Manevich, A.; Loupian, E.; Uvarov, I.; Korolev, S.; Sorokin, A.; Romanova, I.; Kramareva, L.; Burtsev, M. Monitoring the Thermal Activity of Kamchatkan Volcanoes during 2015–2022 Using Remote Sensing. Remote Sens. 2023, 15, 4775. https://doi.org/10.3390/rs15194775
Girina O, Manevich A, Loupian E, Uvarov I, Korolev S, Sorokin A, Romanova I, Kramareva L, Burtsev M. Monitoring the Thermal Activity of Kamchatkan Volcanoes during 2015–2022 Using Remote Sensing. Remote Sensing. 2023; 15(19):4775. https://doi.org/10.3390/rs15194775
Chicago/Turabian StyleGirina, Olga, Alexander Manevich, Evgeny Loupian, Ivan Uvarov, Sergey Korolev, Aleksei Sorokin, Iraida Romanova, Lubov Kramareva, and Mikhail Burtsev. 2023. "Monitoring the Thermal Activity of Kamchatkan Volcanoes during 2015–2022 Using Remote Sensing" Remote Sensing 15, no. 19: 4775. https://doi.org/10.3390/rs15194775
APA StyleGirina, O., Manevich, A., Loupian, E., Uvarov, I., Korolev, S., Sorokin, A., Romanova, I., Kramareva, L., & Burtsev, M. (2023). Monitoring the Thermal Activity of Kamchatkan Volcanoes during 2015–2022 Using Remote Sensing. Remote Sensing, 15(19), 4775. https://doi.org/10.3390/rs15194775