Technical Note

Initial Growth of Gmelina arborea and Efficacy of RGB Image to Capture Canopy Area in a Large Range of Stockings

by
Rodrigo Hakamada
1,2,3,
Jesus Prados-Coronado
4,
Cassiano Lages
5,
Arthur Vrechi
6,
Virgilio Zuñiga-Grajeda
3,
Freddy Hernan Villota-Gonzalez
3 and
Belkis Sulbaran-Rangel
3,*
1
Department of Forest Science, Federal Rural University of Pernambuco, Recife 52171-900, Brazil
2
Department Ecosystem Science and Sustainability, Colorado State University, Fort Collins, CO 80523, USA
3
Campus Tonala, University of Guadalajara, Tonalá 45425, Mexico
4
Instituto Tecnológico Las Choapas, Veracruz 96980, Mexico
5
Postgraduate Program in Forestry Science, Sao Paulo State University, Botucatu 18610-034, Brazil
6
Geplant Technology, Piracicaba 13418-360, Brazil
*
Author to whom correspondence should be addressed.
Remote Sens. 2023, 15(19), 4751; https://doi.org/10.3390/rs15194751
Submission received: 5 August 2023 / Revised: 19 September 2023 / Accepted: 25 September 2023 / Published: 28 September 2023
(This article belongs to the Section Forest Remote Sensing)

Abstract

:
At present, there is a high demand for carbon (C) sequestration alternatives; thus, understanding tree growth and the efficacy of remote sensing techniques to capture forest plantation ecophysiology is crucial. This study evaluated the effect of contrasting stockings of Gmelina arborea on its initial growth and aboveground Carbon stock, and the efficacy of aerial images obtained using drones to capture the crown cover at different stockings. The results indicated that denser stockings showed greater tree heights and stem diameter increments, contrary to traditional measurements. The C storage capacity of Gmelina arborea was promising, with an aboveground estimated C stock of about 13 Mg ha−1 in 9 months, making it a valuable and promising species for CO2 sequestration under the context of climate change. The use of simple Red-Green-Blue (RGB) cameras and drones to detect and estimate crown areas in young plantations was mainly viable within the commercial range of stockings (500–2000 trees ha−1), and can be used as a powerful tool to better understand tree initial growth. The results showed effective discrimination without weeds independently of the stocking level; however, when weeds were present, the effectiveness decreased. This research provides valuable insights into forest management and improves the understanding of the silviculture behavior of a potential native species for reforestation in the tropics.

1. Introduction

Forests house staggering amounts of carbon (C)—roughly 662 billion tons—accounting for over half of the global C stock in soils and in vegetations. Therefore, forests represent a cost-effective solution to tackling the issue of climate change as the photosynthesis process remains the most efficient method for sequestering C from the atmosphere, thus mitigating the greenhouse effect worldwide [1].
Forest plantations have become increasingly important for C sequestration and for the supply of forest products. While they account only for 7% of the world’s forest areas, with approximately 300 million ha, forest plantations supply roughly 50% of the wood demands of the entire world [2]. In Mexico, surveys estimate nearly 100,000 ha of forest plantations [3]; however, 70% of forest products are imported [4], thus presenting a great opportunity to expand forest plantation in the country, as there are many regions with a high potential to grow highly productive forest plantations. Commercial forest plantations are booming in Mexico, not only with native species, but also with fast-growing exotic species, such as the Gmelina arborea species [3].
Forest managers require a great deal of information to implement a forest project, such as information on species adaptation and on the number of trees per hectare, which is defined in forestry studies as stocking [5]. Stocking choice is one of the most crucial in silvicultural planning as the stocking influences the tree growth, amount of Carbon stocked in stand biomass, silvicultural practices, water consumption at planting, and cutting age [6]. The choice depends on the purpose of the plantation, on the availability of water, light, and nutrients, and on the genetic material being planted. It is important to understand the interaction of the stocking with the site and genotype, as the same combination of stocking and genotype in a different region can lead to a high mortality or to low growth as climate variables such as the water deficit control this interaction [7].
The monitoring of silvicultural aspects, such as the rhythm of tree growth and canopy development, is essential to understanding species adaptation, as well as the ideal stocking for a region. The photosynthetic processes are key to forest plantation yields and are directly influenced by the canopy architecture. Canopies with a central trunk and multiple layers of foliage are more productive and efficient than wide, flat, or hemispherical canopies [8]. The crown diameter is also highly correlated with the stem diameter [9], which influences the plantation yield. In addition, crown development is connected with the sanity and nutritional status of the tree [10], and reveals an interaction with climate variables such as the wind and temperature [11].
The images used to detect and classify vegetations are typically multi-spectral, as spectral bands outside the visible range (RGB) help to distinguish between similar objects under visible radiation [12]. Common cameras are usually used in Remotely Manned Aircrafts (RPAs) due to their low cost; however, they are not effective for identifying and measuring canopies. Some studies have added or removed filters from these cameras to capture near-infrared frequencies [13,14]. However, post-factory altered cameras are preferable for simple RGB images and are inferior in quality to the appropriate multispectral sensors [15].
Tests comparing RBG and multispectral sensors have detected differences in the accuracy of up to 6.9% in native conifer forests with significant surface vegetation [15]. Studies assessing canopy coverage in denser crops also found difficulties when using RGB images, especially in plantations subject to seasonal effects. Ashapure et al. (2019) evaluated cotton plantations and found differences in the 25% canopy coverage estimation between conventional and multispectral cameras [16]. These differences are mainly due to the high contrast provided by near-infrared images, and the fact that they are highly reflected by vegetation and visible red and absorbed by photosynthetically active surfaces [17,18,19].
Despite these limitations, RGB images have shown a promising performance in studies carried out in forest plantations [20] to detect necrotic crowns in eucalyptus using aerial images, and have provided accuracies above 95%. Dendrometric measurements using aerial images obtained accuracies between 0.74 and 0.93 in hybrid eucalyptus plantations [21]. Failure detections in eucalyptus reached results near 95% [22] and 93% in gene identification in mixed cultures [23,24]. A quantitative inventory in a 1.5-year-old Eucalyptus sp. Plantation also obtained a 95% accuracy in the identification of crowns. However, estimates of the tree height underestimated the true values by 6.7%, with an RMSE of 10.9%.
RPAs with high quality image acquisition systems provide high definition images at low costs and at high speed [25]. Pourreza et al. (2021) compared the performance of RPAs in measuring crown height and diameter and obtained results that were comparable to those obtained in the field by flights below 100 m, with differences of less than 5% and an R2 above 0.99 for the correlation equations of linear regression between both measurements [26]. Pre- and post-grazing measurements in intercropped willow and pasture showed similar results [27]. Tests in spruce plantations also validated the use of drones for measuring crown height and diameter, with an R2 of 0.2 in the correlation equations [28]. As the canopy and bole diameters are correlated, RPA images allow field measurements of forest inventory to be complimented or replaced.
These difficulties are augmented in denser areas with low vegetation. Shin (2018) evaluated the methodology of using RPA images in pine forests with dense undergrowth and accurately detected 74% of the trees mapped in the field, with 16% false positives [29]. Iizuka et al. (2017) chose not to map shorter trees due to the difficulties caused by the density of the study site and obtained an RMSE of 1.71 m for measurements of heights between 16 m and 24 m [28].
The Gmelina arborea is an important timber species used in plantations and reforestation in Mexico due to its rapid growth. Although it is an introduced species in Mexico, G. arborea has easily adapted to the humid tropical conditions in the states of Campeche, Tabasco, Veracruz, Quintana Roo, Chiapas, and Oaxaca. Also, it has adapted to the drier tropical conditions in the states of Colima, Guerrero, and Yucatan [3,30]. Therefore, it is necessary to understand the G. arborea characteristics from the first growth stages with the use of drones and RGB images and to assess the efficacy and practicality of this monitoring system. This study aimed to evaluate the effect of stockings of Gmelina arborea on its initial growth and aboveground carbon stock and the efficacy of RGB images to capture crown cover at different stocking rates.

2. Materials and Methods
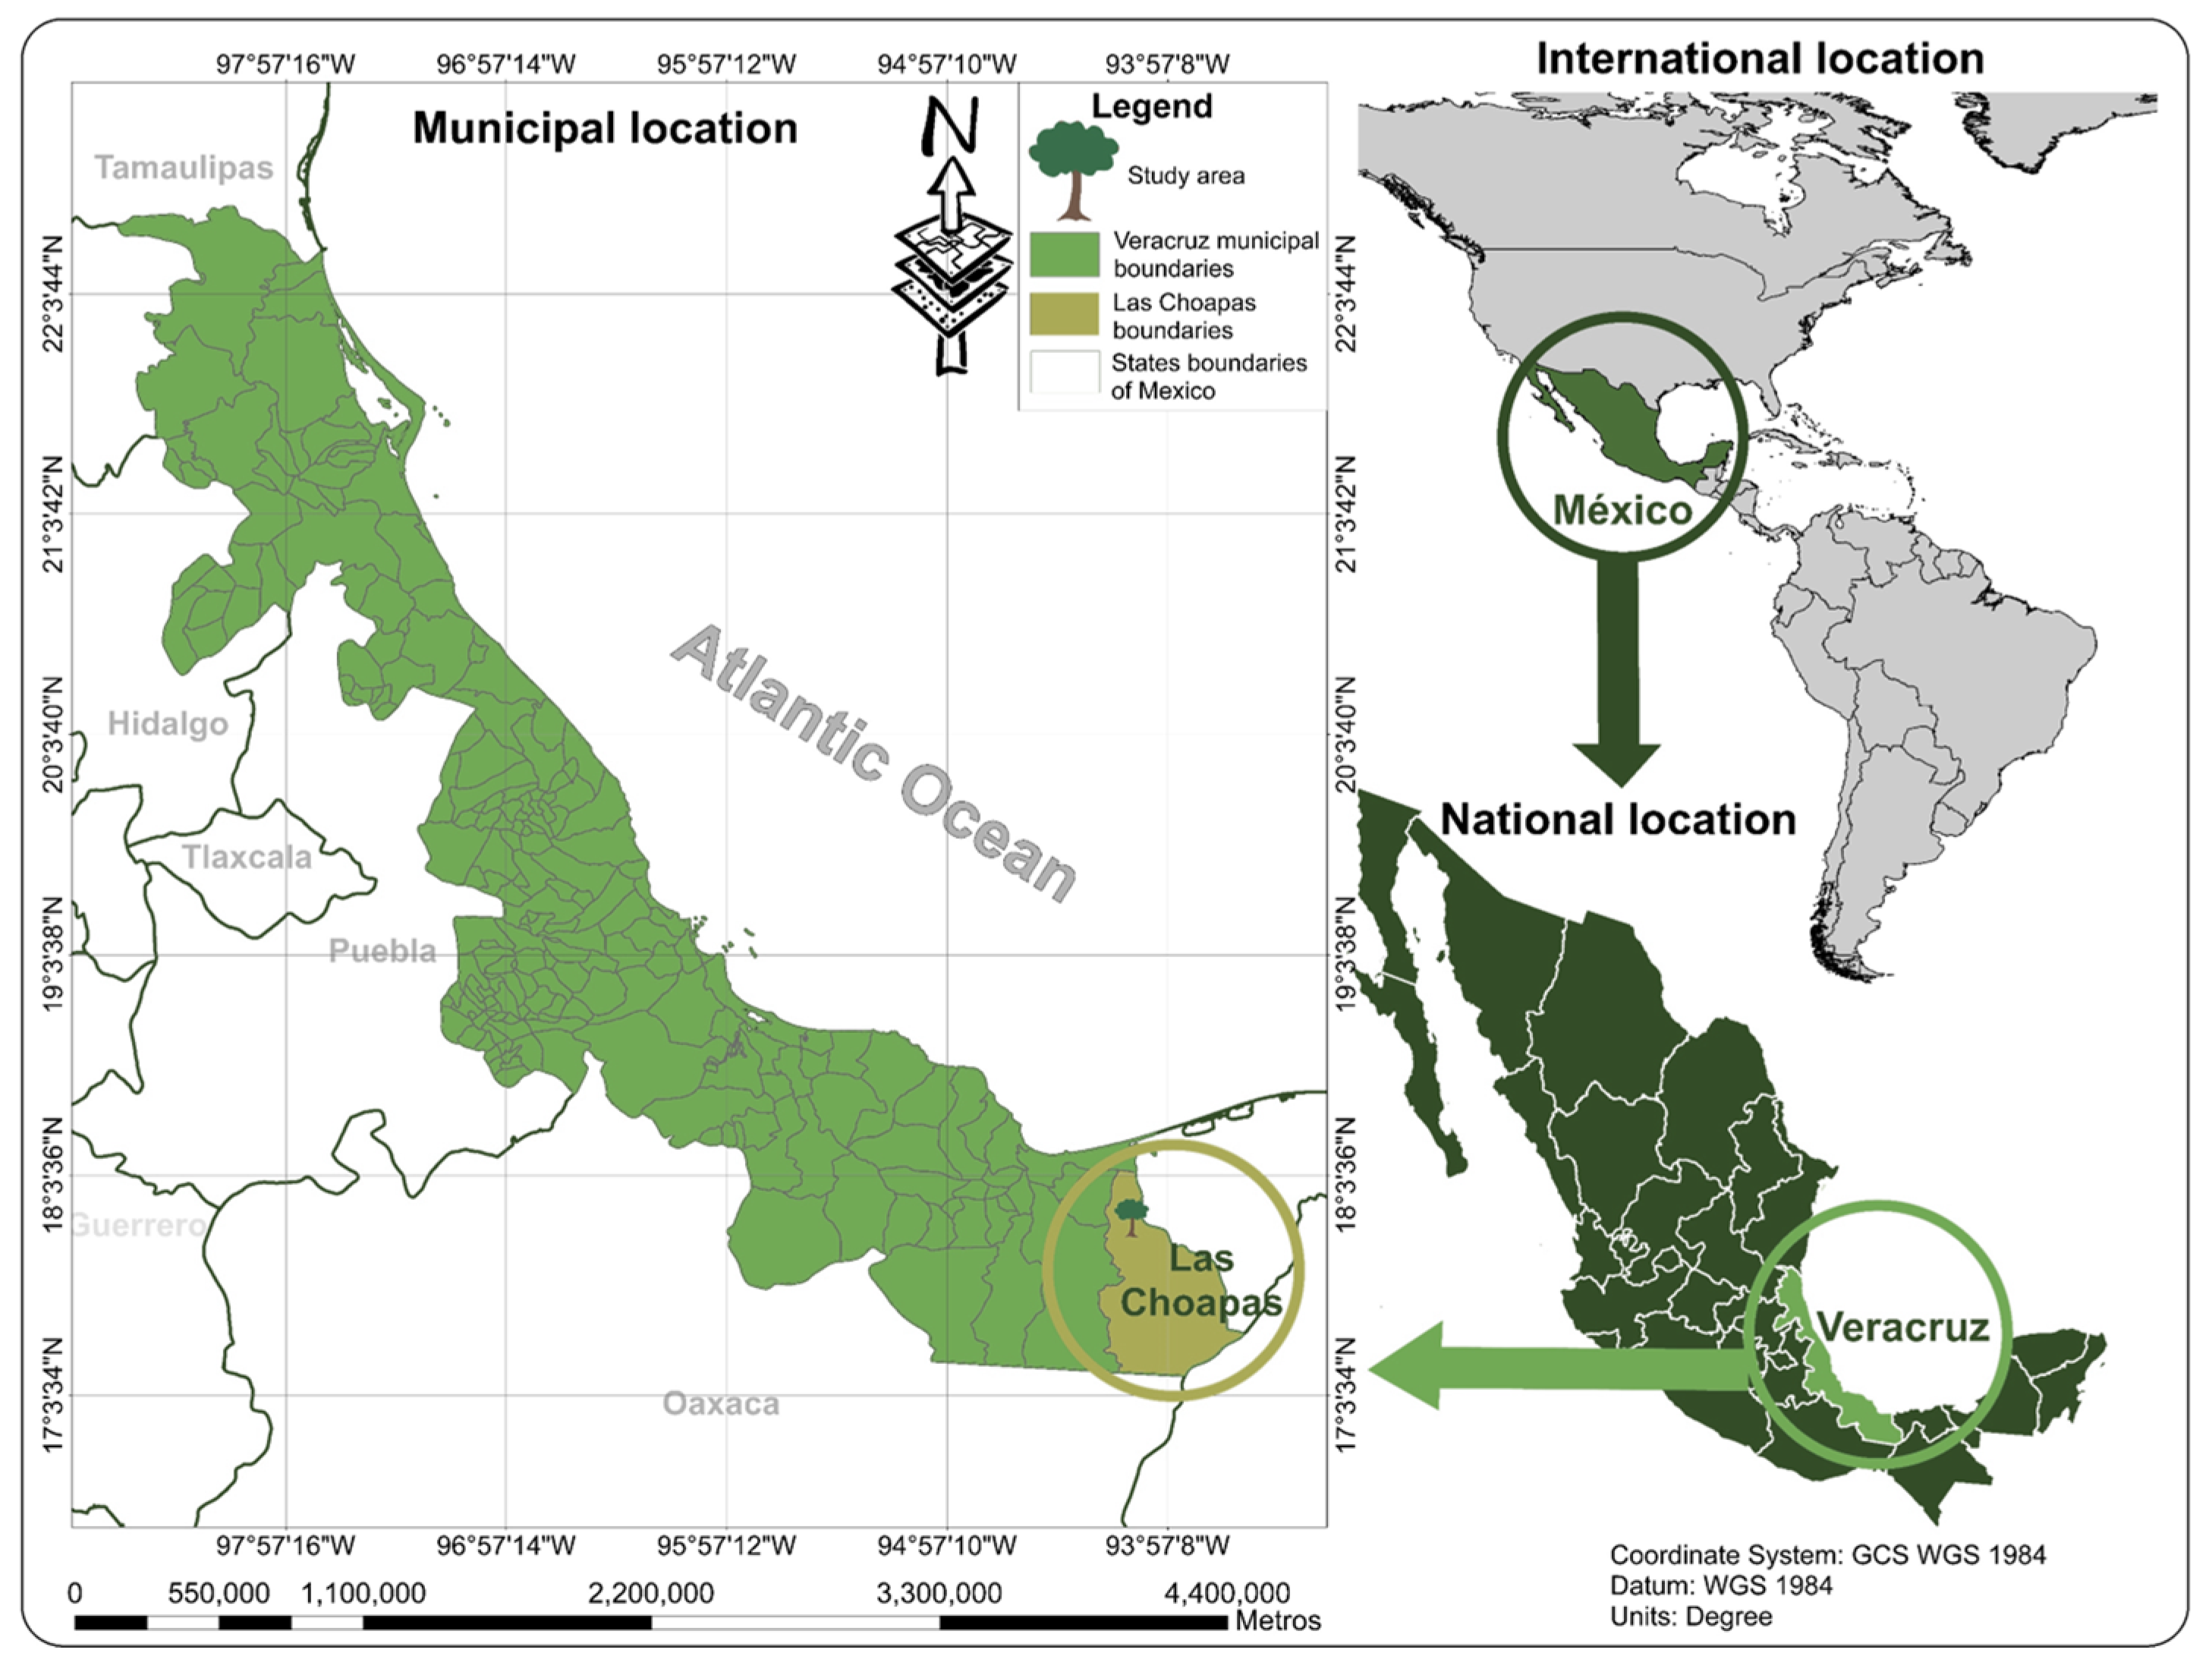
2.1. Study Site

The study was carried out in a highly productive clone plantation of Gmelina arborea, implemented in August 2022. The experiment was carried out in Las Choapas in the state of Veracruz, Mexico, at the geographic coordinates 17°52′N and 94°7′W, with an altitude of 22 m (Figure 1). According to the data from the National Institute of Statistics and Geography [31], the region has a tropical monsoon climate (Am according to Koppen classification). The annual average temperature varies between 29 °C and 32 °C, while the average annual rainfall is 2200 mm. The site was used for livestock activities for 25 years prior to the experiment installation.
The soil analysis was carried out from the surface to 60 cm deep and showed a textural distribution of 47% sand, 33% of clay, and 20% of lime. The soil is uniform in this area and the slope is less than 1%. The soil hydraulic conductivity is 3.50 cm hr−1 and its apparent density is 1.08 g cm−3. The soil pH is acidic, at 5.12 (ratio 1:2 water), with a soil organic matter content of 1.68%, determined using the Walkley-Black method [32]. The P, K, and Ca levels are 1.37, 50, and 500 ppm, respectively. Soil preparation was conducted using a motor manual pitting method, which prepared holes of 80 cm depth by 30 cm large, creating a volume of prepared soil of about 72 L per seedling. Initial fertilization consisted of the application of a commercial formula (12% N, 11% P2O5, 18% K2O, 8% S, 2.7% MgO), applied 15 cm from the base of the tree. Pest attacks were managed with the application of abamectin-based ant killer. Topical pest control was carried out through applications of contact insecticide based on ethyl chlorpyrifos. Initial irrigations were necessary and were carried out manually every 3 days, at a dosage of 10L per plant. Pruning was carried out in November 2022, January 2023, and May 2023 to eliminate forks and remove branches broken by the wind and by storms, respectively. Weed control was carried out manually in a 50 cm radius of the stem, every 3 months or whenever necessary, with the purpose of keeping the area competition free without using inputs that could influence crop development. All these practices are common ones in forest plantation to keep a high growth rate.

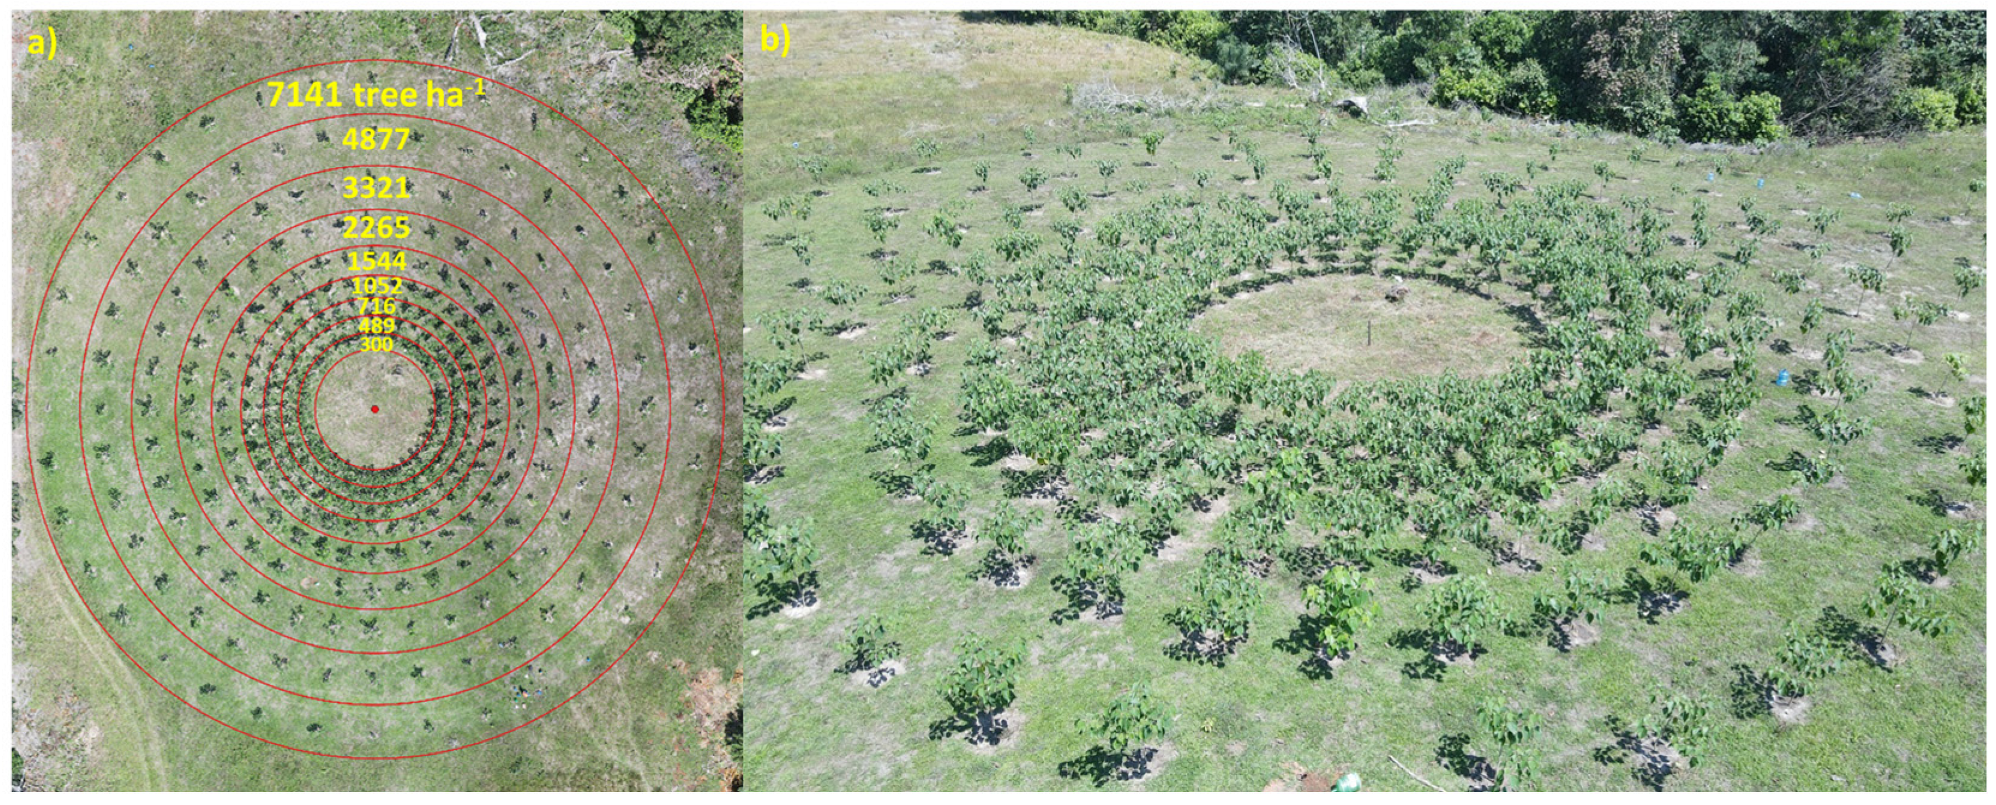
2.2. Nelder Experiment Plantation of Gmelina Arborea

The experiment was deployed in circular Nelder (Figure 2), as conducted by many other researchers with forest cultures [33,34]. Circles of different radii were drawn, starting from a circular point defined in GIS. The culture was implemented at densities detailed in Table 1, where circle 1 is the closest and 9 is the farthest from the center.
The circles were drawn every 10° from the center, generating a total of 36 repetitions per density (Figure 2a). Each of the 324 trees was geologically referenced for a more accurate control. The grid of points was inserted into a high-precision GPS (Emlid Reach RS2+), ensuring the accuracy of the planting points. To evaluate the impact of surface vegetation on the detection of canopies in the images, weed control was suspended by half of the repetitions one month before the collection of the aerial images. One month is sufficient in this tropical wet region to grow some weeds, but tree growth was not affected, captured by the absence of differences between the two areas with and without weeds.

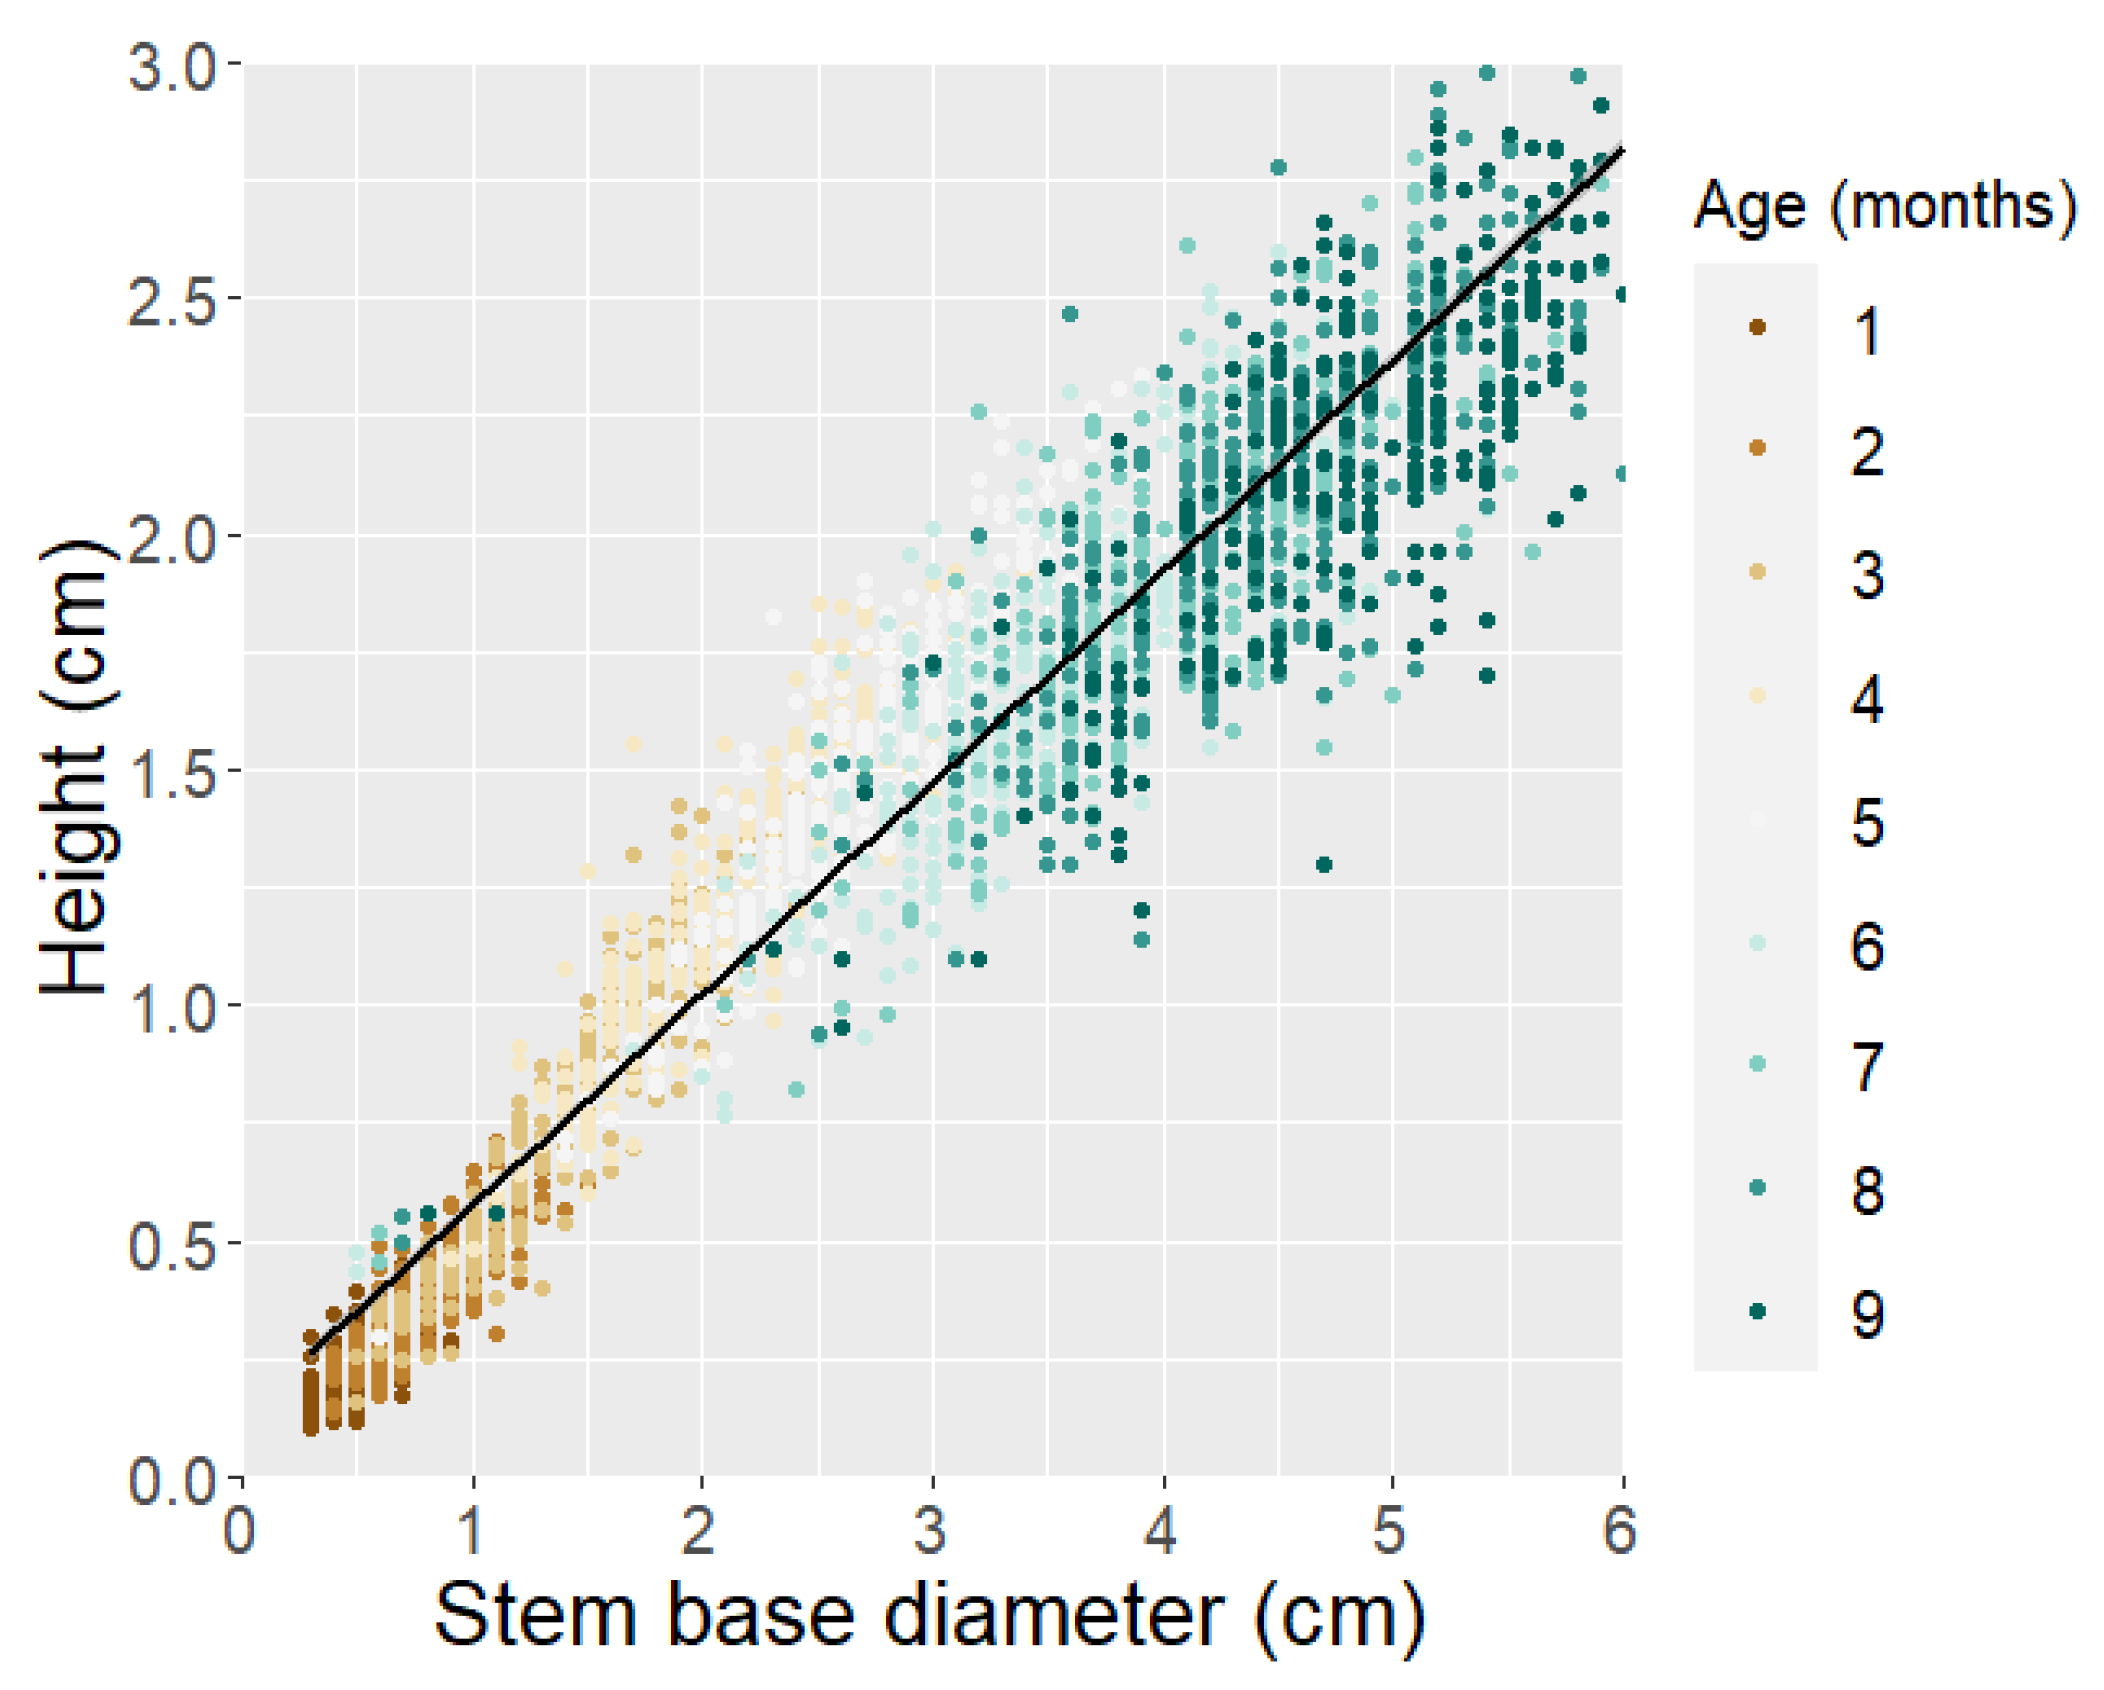
2.3. Tree Measurements in the Field

Measurements of the base diameter (D) and tree height (H)—dendrometric variables normally used to estimate tree growth [35]—were carried out manually in the field every month from 1- to 9-months-old. A team of three people was used: one to measure the diameter with a 0.2 mm precision digital vernier (Adaskala®, Sao Paulo, Brazil), one to measure height with a traditional flexometer (Starrett® KTS 5 m, Saltillo, Mexico), and one to take notes of the D and H values. A biomass equation based on the D and H was applied individually according to Equation (1) with an R2 = 0.99 and an error of 0.087. This equation was built for planted Gmelina arborea in Colombia, and was chosen because of the similar range of diameter compared to the present study [36].
I n d i v i d u a l   a b o v e g r o u n d   b i o m a s s = { 86.2 ( 47.1 l n D ) + ( 15.2 l n D 2   ) [ 19.2 ( l n D H ) ] + ( 19.1 ( H D 2   ) ) }
The average diameter, height, and individual aboveground biomass measurements considered each one of the 36 trees as a repetition. The stand level biomass (Mg ha−1) was estimated using the simple sums of the individual biomass of the 36 trees in each stocking level (Equation (2)).
T o t a l   a b o v e g r o u n d   b i o m a s s   ( Mg   ha 1 ) =   i n d i v i d u a l   a b o v e g r o u n d   b i o m a s s 10000
The aboveground Carbon stocking was estimated by multiplying the aboveground biomass to 0.5 or 50%, which is a mean value of Carbon content in tree biomass used in many studies for tropical species [37].
At 6 months of age, the leaf area was measured directly and indirectly. The direct measurements consisted of measuring the crown height and its diameter in the north–south and east–west directions. In this work, the crown area is defined as the area occupied in a horizontal plane by the tree crown [38]. The crown area was calculated by multiplying the values obtained in both measurements by 25% using parsimony as the crown of this species does not have a circular nor a diamond shape, but rather branches emitted randomly. An orthomosaic of the area was created for the indirect method, where a supervised classification based on the spectral index was applied.

2.4. Red-Green-Blue (RGB) Image Capture

Images of the Nelder experiment plantation of Gmelina arborea were taken using a DJI Mavic Pro drone (DJI, Shenzhen, China) to create the orthomosaic. The drone had a 12-megapixel Sony camera and a half-inch CMS sensor with an electronic shutter. The flight was performed at a height of 30 m, with 90% frontal and lateral overlap, at a speed of 30 km h−1, and with a normal flight pattern. The drone images resulted in a high-resolution RGB orthomosaic with 0.5 cm per pixel. All 1641 photos were loaded into the Agisoft Metashape software (https://www.agisoft.com/, accessed on 28 September 2023), after which we converted the coordinate system of the images from decimal degrees to UTM Zone 15N. Next, we lined up the photos, taking the pixels into account. The quality of this geoprocessing was high for better georeferencing, which allowed us to obtain a dispersed point cloud of our area of study. Next, we created a high-quality dense point cloud, from which a Digital Elevation Model (DEM) was created. Finally, after this process, we created an orthomosaic that allowed us to indirectly measure the canopy area of the trees.
Image processing was performed using the QGIS 3.28.4 software, with the aid of the SCP plugin—Semi-Automatic Classification Plugin [39]. The supervised classification used 92 samples, distributed into 4 classes (soil, tree shade, grass, and canopy). After the classification attempts using the Minimum Distance, Spectral Angle Mapping (SAM), and Maximum Likelihood (MLI) algorithms, the results obtained from algorithms SAM were found to be visually more appropriate for this study, as was found by Ruwaimana et al. (2018) [40]. After training the samples, the classification was performed using the spectral angle mapping algorithm, which calculates the spectral angle between values of a given pixel and the spectral angle of the samples used in the training (RGB in this case). The spectral angle θ is determined using Equation (3) [41].
θ ( x , y ) = c o s 1 ( i = 1 n x i y i ( i = 1 n x i 2 ) 1 2 ( ( i = 1 n y i 2 ) 1 2 ) )
where: X = pixel spectral signature vector, y = training area spectral signature vector, n = number of spectral bands.

2.5. Statistical Analysis
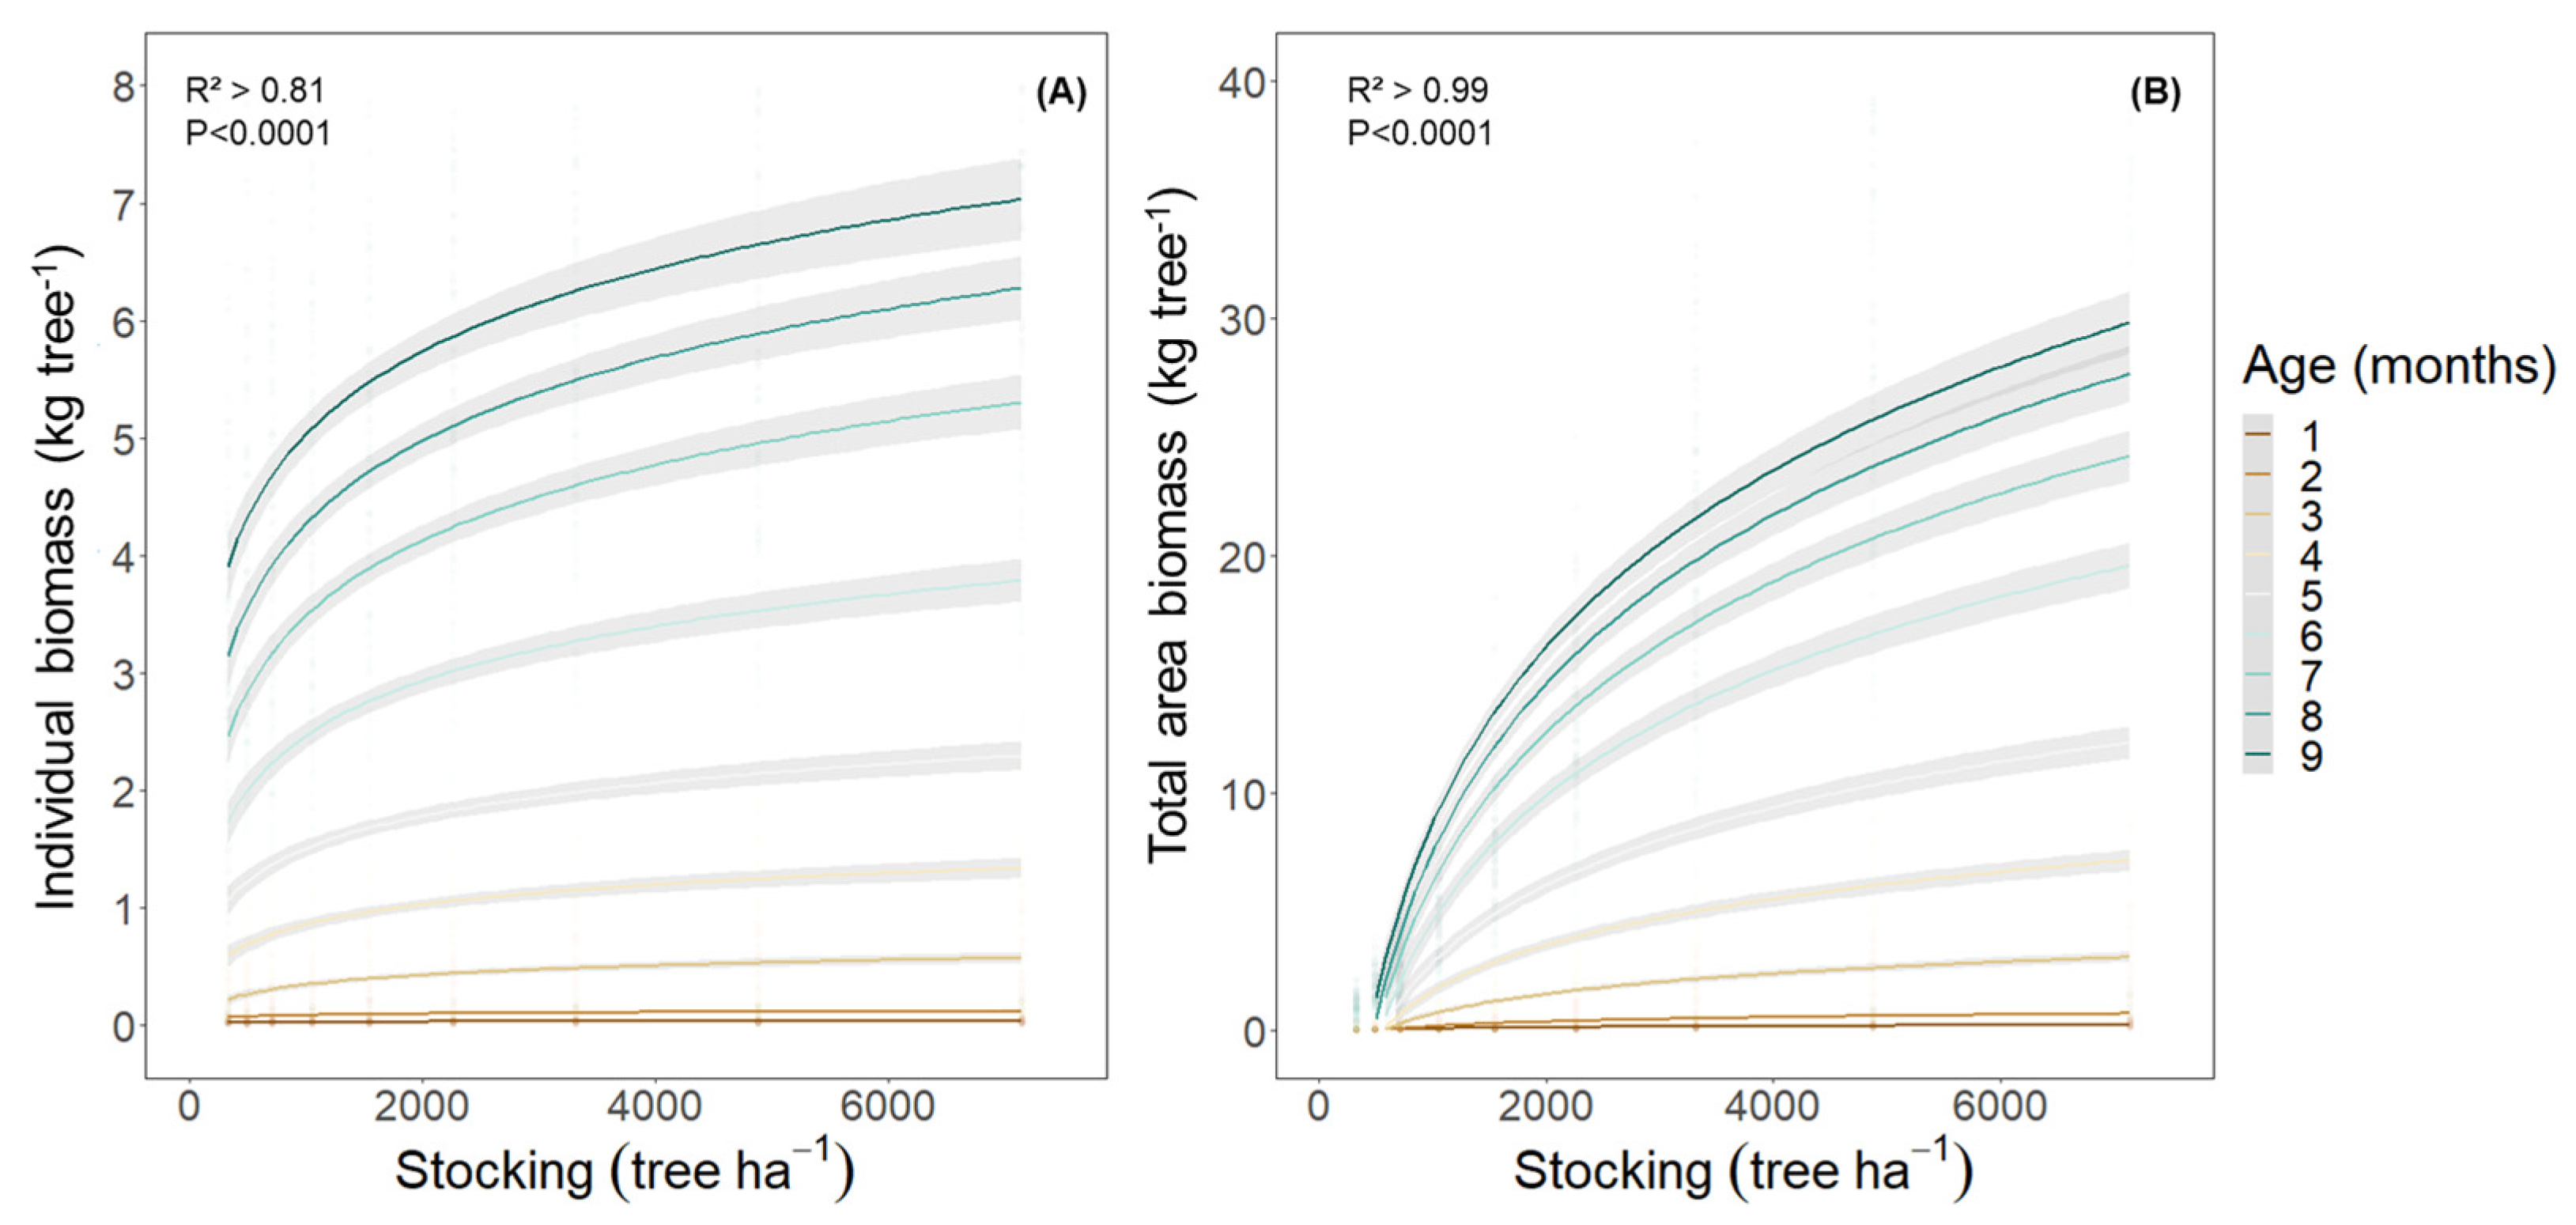
The Curve Expert® Program [42] was used to identify the best model to correlate the variables. Linear regression was applied to correlate the diameter with the height for the nine measurements. To correlate the stocking rates with the diameter, height, biomass at individual and total area, and aboveground C, logarithm models were selected. We also compared the field measurements of the canopy with the ones estimated by the drone and analyzed them using linear regression. Finally, error by stocking was also analyzed by regression using a logarithm regression. Analysis and figures were made in the Microsoft Excel® (https://www.microsoft.com/en-in/microsoft-365/excel, accessed on 28 September 2023) and R software (https://www.r-project.org/, accessed on 28 September 2023).

3. Results

The stem base diameter (D) keeps a linear relationship with the tree height (H), with no influence between both variables (Figure 3). The difference in the distribution between the D (discrete) and H (continuous), shown in Figure 3, is due to the accuracy of the measurements taken.
The canopy diameters are clearly influenced by the density (Figure 4). The maximum diameters at the end of the measurement were around 5.5 cm for denser densities and 4.2 cm for more sparse densities. The influence of the planting density on the diameter at breast height (DBH), which was non-existent at the time of planting, becomes more expressed as the population grows. Similar relationships are found for the tree height, which showed greater variation than the stem diameter, with final values varying between 1.8 cm and 2.4 cm in different densities.
The biomass per tree and per ha showed similar patterns, with final values per tree varying between 4 and 6.5 for less and more dense plantations. The biomass variations per ha were the highest observed, with values slightly above zero in lower densities and approaching 30 Mg ha−1 in denser plots (Figure 5).
The results of the aboveground C stock showed a curve similar to that of the biomass per ha, with maximum values around 12.5 Mg ha−1; the value increased according to the increasing tree stocking (Figure 6). The initial aboveground C stock estimated through Equation (1) is strongly related to the stocking for all ages.
Figure 7 shows the RGP image taken by the drone. The classification algorithm generated four classes: soil, shade, grass, and canopy. The initial observation showed the expressive presence of pixels classified as trees among the planting rows, which result from the inability of classifier algorithms to differentiate between weeds and crops using RGB images.
In Figure 8, we can see the relationship between the canopy area estimated by the aerial images and field measurements. In weedy areas, the estimated canopy area remains within a constant range of between 2000 m2 ha−1 and 3000 m2 ha−1, regardless of its real value, and is therefore not usable. In weed-free areas, the estimated values keep a relatively constant relationship with those measured in the field, at approximately one-third. The regression equations for areas without weeds showed high R2 values and a p value close to zero.
The influence of stocking and weeds on the relative error found between the estimates from the drone images and field measurements was also observed (Figure 9). In the weed-free area, the error remained constant, with its absolute value increasing as the measured areas (larger in denser stocking) increased. In weedy areas, however, the error decreases as the stocking thickens, which can be attributed to the lower presence of weeds, which induce errors in denser treatments.

4. Discussion

The aerial drone images successfully discerned the tree canopy in distinct stockings, which renders the RGB images a powerful tool for forest managers. The definition of the most adequate stocking for each site and species is one of the most important decisions in the silviculture of planted forests [5]. The canopy development, which occurs as a function of tree stockings [7], is directly connected with tree growth [43] and with intraspecific competition—i.e., the competition among trees in a stand. Thus, having a cheaper option to capture this tree feature is relevant for forest science.
A lower error percentage was observed for wider stocking treatments, increasing from 4 to 8% error between the widest and tightest stockings. Iizuka et al. (2017) found similar results when evaluating high-density plantings. The highest error rates in denser stockings are caused by the difficulty in distinguishing soil, shade, and canopy in smaller stockings [28].
The results showed effective discrimination without weeds, independently of the stocking level; however, when weeds were present, the effectiveness decreased. On one hand, this reveals that in the absence of weeds, RGB images are a reliable tool for capturing canopy development. From a practical point of view, this result limits the potential of RGB images in evaluating canopy areas immediately after weed control. On the other hand, it presented a limitation of using the technique in a “real world” scenario, where weeds are often present in the area.
Other researchers have also observed this difficulty when working in similar situations [29], and an option to deal with this issue is the use of images captured with a greater number of spectral bands, which show a better performance. Previous studies have shown that the use of at least four spectral bands generates more accurate results, especially in terms of near-infrared (NIR) information [44,45]. Thus, a first stage is carried out, in which vegetation in the image is detected by calculating a vegetation index and generating a vegetation mask through thresholding. For instance, to separate vegetation images from soil images, the Normalized Difference Vegetation Index (NDVI) is used when near-infrared (NIR) information is available [46]. Another possibility would be the use of hyperspectral images as they provide fine details on the spectral reflectance of each image pixel [15]. This is especially useful for identifying materials with distinctive spectral signatures, such as different vegetation types, including weeds, which sometimes exhibit visual similarities in visible spectrum images [47,48,49]. In addition, the high spectral resolution helps to reduce misclassification and minimizes false positives, increasing the accuracy in weed identification [50]. However, it is important to take into account that acquiring hyperspectral images also presents challenges as specialized sensors and equipment with high economic costs are required [51,52]. Thus, considering that we successfully achieved our goal of accurately detecting canopy areas within distinct stockings with an average error of 5%, alongside the cost-effectiveness of using RGB images, our work draws focus onto a critical aspect, which is the influence of weed presence as a pivotal factor in ensuring the attainment of high-quality assessments.
Regarding tree growth, contrary to expectations, the individual height and diameter increments were greater in denser stockings. The majority of the previous studies on the effect of stocking in tree growth have shown bigger trees in wider stockings [7,53], determined by a lower intraspecific competition—i.e., the competition between trees [33]. The total stand biomass presented the same trend as that in other studies, with higher growth occurring in denser stockings [54]. This distinct result of the individual biomass is possibly due to some environmental stresses presenting a greater impact on the tree growth than competition between individuals, whilst the wind and soil characteristics were the most likely factors to cause this type of response.
High-intensity winds can negatively affect plant growth in forest plantations. By disturbing the transition zone between the leaves and the atmosphere, winds increase the transpiration cost of photosynthesis [55]. Winds can also cause branch breakage and other damage to trees, resulting in biomass loss, a reduced leaf area, and greater exposure to pathogens. [56]. In the present study, as an example of the negative effect of wind on tree growth, two pruning events were carried out due to damage caused by windstorms, mainly at low densities, which could contribute to the observed pattern of the individual biomass increasing according to the increasing stocking. The other physical aspect that could influence tree growth to a greater extent than competition is the density of clayey soil imposing greater resistance to rooting in young plants [57], mainly because of the previous soil-use with cattle livestock, which could have generated high soil compaction [58]. A higher planting density implies a greater volume of prepared soil. For example, comparing the tightest (7141 tree ha−1) with the widest stocking (300 tree ha−1), the soil preparation was 514 vs. 22 m3 per hectare, considering an individual soil preparation volume of 72 L, which could have facilitated root development, and consequently initial growth, in denser stocking [59]. It will be fundamental to follow the experiment growth to see whether this unique behavior of higher individual growth in denser stockings will continue with age.
The aboveground C stock reached values of 13 Mg ha−1 in 9 months in the densest stocking. By converting the Carbon stock in biomass to the CO2 equivalent (conversion rate of 3.66 based on the relative mass of C compared to CO2 mass), the Gmelina plantation would capture about 47 t CO2e ha−1 in the denser stocking. As a comparison of the high potential of the culture in the region to mitigate the negative effects of climate change, our trial showed two-to-three-times higher productivity when compared to other studies evaluating Gmelina arborea [60,61].

5. Conclusions

In this study, the use of simple RGB cameras and drones to detect and estimate crown areas during the initial growth of Gmelina arborea plantations was mainly viable within the commercial range of stockings (500–2000 trees ha−1) and should be investigated for other crops in order to improve forest management and provide a better understanding of the ecophysiological behavior of forests. This methodology of using RGB images improved the management, and it could help to monitor other natural resources like forests, rivers, lakes, and other landscape features.
The C storage capacity of Gmelina arborea was promising, with an aboveground estimated C stock of approximately 13 Mg ha−1 or 47 Mg CO2e ha−1 in 9 months, making it a valuable and promising species for CO2 sequestration under the context of climate change. This research provides valuable insights into forest management and improves the understanding of the silviculture behavior of a potential native species for reforestation in the tropics. The validation of the methodologies for crop remote monitoring in its first month is important as these measurements generate critical recommendations for silvicultural management.

Author Contributions

Conceptualization, R.H. and B.S.-R.; methodology, J.P.-C.; formal analysis, C.L., A.V., V.Z.-G. and F.H.V.-G.; writing—original draft preparation, R.H. and C.L.; writing—review and editing, B.S.-R. and R.H. All authors have read and agreed to the published version of the manuscript.

Funding

This research received no external funding.

Data Availability Statement

The data presented in this study are available on request from the corresponding author. The data are not publicly available due to privacy restrictions.

Acknowledgments

The authors would like to thank all of the students of the Las Choapas Technological Institute of Veracruz México, in particular, Abimelet Teofilo Contreras, Angel Obed Garcia Garduza, and Karen Suancatl Colorado. We also give thanks to the General Collaboration Agreement RG/ACC/429/2022 between the University of Guadalajara and the Las Choapas Technological Institute of Veracruz.

Conflicts of Interest

The authors declare no conflict of interest.

References

  1. Lewis, S.L.; Wheeler, C.E.; Mitchard, E.T.; Koch, A. Restoring natural forests is the best way to remove atmospheric carbon. Nature 2019, 568, 25–28. [Google Scholar] [CrossRef] [PubMed]
  2. Food and Agriculture Organization. Global Forest Resources Assessment 2020. In Key Findings; Food and Agriculture Organization: Rome, Italy, 2020. [Google Scholar] [CrossRef]
  3. Cubbage, F.; Kanieski, B.; Rubilar, R.; Bussoni, A.; Olmos, V.M.; Balmelli, G.; Donagh, P.M.; Lord, R.; Hernández, C.; Zhang, P.; et al. Global timber investments, 2005 to 2017. For. Policy Econ. 2020, 112, 102082. [Google Scholar] [CrossRef]
  4. CONAFOR. Protocolo Para la Definición de Áreas Elegibles 2022 del Componente II. Plantaciones Forestales Comerciales y Sistemas Agroforestales Para el Bienestar (PFC); CONAFOR: Zapopan, Mexico, 2022. [Google Scholar]
  5. Nyland, R.D. Silviculture: Concepts and Applications; Waveland Press: Long Grove, IL, USA, 2016; p. 633. [Google Scholar]
  6. Schönau, A.P.G.; Coetzee, J. Initial spacing, stand density and thinning in eucalypt plantations. For. Ecol. Manag. 1989, 29, 245–266. [Google Scholar] [CrossRef]
  7. Hakamada, R.E.; Binkley, D.; Cegatta, I.; Alvares, C.; Campoe, O.C.; Stape, J.L. Stocking response of Eucalyptus growth depends on site water deficit across a 2100-km gradient in Brazil. For. Ecol. Manag. 2023, 546, 121325. [Google Scholar] [CrossRef]
  8. Pugnaire, F.; Valladares, F. Handbook of Functional Plant Ecology; CRC Press: Boca Raton, FL, USA, 1999; p. 928. [Google Scholar]
  9. Echereme Chidi, B.; Mbaekwe Ebenezer, I.; Ekwealor Kenneth, U. Tree crown architecture: Approach to tree form, structure and performance: A review. Int. J. Sci. Res. Publ. 2015, 5, 1–5. [Google Scholar]
  10. Hakamada, R.; da Silva, R.M.L.; Moreira, G.G.; Teixeira, J.D.S.; Takahashi, S.; Masson, M.V.; Ferreira, K.Z.; Fernandes, P.G.; Martins, S.D.S. Growth and canopy traits affected by myrtle rust (Austropuccinia psidii Winter) in Eucalyptus grandis x Eucalyptus urophylla. For. Pathol. 2022, 52, e12736. [Google Scholar] [CrossRef]
  11. Pook, E. Canopy dynamics of Eucalyptus maculata Hook. III Effects of drought. Aust. J. Bot. 1985, 33, 65–79. [Google Scholar] [CrossRef]
  12. Hernandez-Santin, L.; Rudge, M.L.; Bartolo, R.E.; Erskine, P.D. Identifying species and monitoring understorey from UAS-derived data: A literature review and future directions. Drones 2019, 3, 9. [Google Scholar] [CrossRef]
  13. Müllerová, J.; Brůna, J.; Dvořák, P.; Bartaloš, T.; Vítková, M. Does the data resolution/origin matter? Satellite, airborne and UAV imagery to tackle plant invasions. Int. Arch. Photogramm. Remote Sens. Spat. Inf. Sci. 2016, 41, 903–908. [Google Scholar] [CrossRef]
  14. Jafarbiglu, H.; Pourreza, A. A comprehensive review of remote sensing platforms, sensors, and applications in nut crops. Comput. Electron. Agric. 2022, 197, 106844. [Google Scholar] [CrossRef]
  15. Grybas, H.; Congalton, R.G. A comparison of multi-temporal RGB and multispectral UAS imagery for tree species classification in heterogeneous New Hampshire Forests. Remote Sens. 2021, 13, 2631. [Google Scholar] [CrossRef]
  16. Ashapure, A.; Jung, J.; Chang, A.; Oh, S.; Maeda, M.; Landivar, J. A Comparative Study of RGB and Multispectral Sensor-Based Cotton Canopy Cover Modelling Using Multi-Temporal UAS Data. Remote Sens. 2019, 11, 2757. [Google Scholar] [CrossRef]
  17. Osco, L.P.; Arruda, M.d.S.d.; Marcato Junior, J.; da Silva, N.B.; Ramos, A.P.M.; Moryia, É.A.S.; Imai, N.N.; Pereira, D.R.; Creste, J.E.; Matsubara, E.T.; et al. A convolutional neural network approach for counting and geolocating citrus-trees in UAV multispectral imagery. ISPRS J. Photogramm. Remote Sens. 2020, 160, 97–106. [Google Scholar] [CrossRef]
  18. Xie, Y.; Sha, Z.; Yu, M. Remote sensing imagery in vegetation mapping: A review. J. Plant Ecol. 2008, 1, 9–23. [Google Scholar] [CrossRef]
  19. Zhou, Y.; Lao, C.; Yang, Y.; Zhang, Z.; Chen, H.; Chen, Y.; Chen, J.; Ning, J.; Yang, N. Diagnosis of winter-wheat water stress based on UAV-borne multispectral image texture and vegetation indices. Agric. Water Manag. 2021, 256, 107076. [Google Scholar] [CrossRef]
  20. Dell, M.; Stone, C.; Osborn, J.; Glen, M.; McCoull, C.; Rimbawanto, A.; Tjahyono, B.; Mohammed, C. Detection of necrotic foliage in a young Eucalyptus pellita plantation using unmanned aerial vehicle RGB photography—A demonstration of concept. Aust. For. 2019, 82, 79–88. [Google Scholar] [CrossRef]
  21. Liao, L.; Cao, L.; Xie, Y.; Luo, J.; Wang, G. Phenotypic traits extraction and genetic characteristics assessment of eucalyptus trials based on UAV-borne LiDAR and RGB images. Remote Sens. 2022, 14, 765. [Google Scholar] [CrossRef]
  22. Zhao, H.; Wang, Y.; Sun, Z.; Xu, Q.; Liang, D. Failure Detection in Eucalyptus Plantation Based on UAV Images. Forests 2021, 12, 1250. [Google Scholar] [CrossRef]
  23. Almeida, A.; Gonçalves, F.; Silva, G.; Mendonça, A.; Gonzaga, M.; Silva, J.; Souza, R.; Leite, I.; Neves, K.; Boeno, M.; et al. Individual Tree Detection and Qualitative Inventory of a Eucalyptus sp. Stand Using UAV Photogrammetry Data. Remote Sens. 2021, 13, 3655. [Google Scholar] [CrossRef]
  24. Wolff, F.; Kolari, T.H.M.; Villoslada, M.; Tahvanainen, T.; Korpelainen, P.; Zamboni, P.A.P.; Kumpula, T. RGB vs. Multispectral imagery: Mapping aapa mire plant communities with UAVs. Ecol. Indic. 2023, 148, 110140. [Google Scholar] [CrossRef]
  25. Westoby, M.J.; Brasington, J.; Glasser, N.F.; Hambrey, M.J.; Reynolds, J.M. ‘Structure-from-Motion’ photogrammetry: A low-cost, effective tool for geoscience applications. Geomorphology 2012, 179, 300–314. [Google Scholar] [CrossRef]
  26. Pourreza, M.; Moradi, F.; Khosravi, M.; Deljouei, A.; Vanderhoof, M.K. GCPs-free photogrammetry for estimating tree height and crown diameter in Arizona Cypress plantation using UAV-mounted GNSS RTK. Forests 2022, 13, 1905. [Google Scholar] [CrossRef]
  27. Karl, J.W.; Yelich, J.V.; Ellison, M.J.; Lauritzen, D. Estimates of willow (Salix spp.) canopy volume using unmanned aerial systems. Rangel. Ecol. Manag. 2020, 73, 531–537. [Google Scholar] [CrossRef]
  28. Iizuka, K.; Yonehara, T.; Itoh, M.; Kosugi, Y. Estimating tree height and diameter at breast height (DBH) from digital surface models and orthophotos obtained with an unmanned aerial system for a Japanese cypress (Chamaecyparis obtusa) forest. Remote Sens. 2017, 10, 13. [Google Scholar] [CrossRef]
  29. Shin, P.; Sankey, T.; Moore, M.M.; Thode, A.E. Evaluating Unmanned Aerial Vehicle Images for Estimating Forest Canopy Fuels in a Ponderosa Pine Stand. Remote Sens. 2018, 10, 1266. [Google Scholar] [CrossRef]
  30. Sánchez Rejón, L.A.; Luis Romero, J. Plantations of Gmelina arborea in southern Mexico. New For. 2004, 28, 293–297. [Google Scholar] [CrossRef]
  31. INEGI. Istituro Nacional de Estadistica y Geografía. Available online: https://www.inegi.org.mx/temas/climatologia/ (accessed on 1 August 2023).
  32. Walkley, A.; Black, I.A. An examination of the Degtjareff method for determining soil organic matter, and a proposed modification of the chromic acid titration method. Soil Sci. 1934, 37, 29–38. [Google Scholar] [CrossRef]
  33. Stape, J.L.; Binkley, D. Insights from full-rotation Nelder spacing trials with Eucalyptus in Sao Paulo, Brazil. South. For. 2010, 72, 91–98. [Google Scholar] [CrossRef]
  34. Ruano, I.; Herrero de Aza, C.; Bravo, F. Effect of density on Mediterranean pine seedlings using the Nelder wheel design: Analysis of biomass production. Forestry 2022, 95, 711–726. [Google Scholar] [CrossRef]
  35. Avery, T.E.; Burkhart, H.E. Forest Measurements; Waveland Press: Long Grove, IL, USA, 2015. [Google Scholar]
  36. Melo Cruz, O.A. Modelación del Crecimiento, Acumulación de Biomasa y Captura de Carbono en Árboles de Gmelina Arborea Roxb., Asociados a Sistemas Agroforestales y Plantaciones Homogéneas en Colombia, 3rd ed.; Universidad Nacional de Colombia: Medellín, Colombia, 2015; pp. 154–196. [Google Scholar]
  37. Berenguer, E.; Ferreira, J.; Gardner, T.A.; Aragão, L.E.O.C.; De Camargo, P.B.; Cerri, C.E.; Durigan, M.; Oliveira, R.C.D.; Vieira, I.C.G.; Barlow, J. A large-scale field assessment of carbon stocks in human-modified tropical forests. Glob. Chang. Biol. 2014, 20, 3713–3726. [Google Scholar] [CrossRef]
  38. Sayn-Wittgenstein, L.; Aldred, A.H. Tree size from large-scale photos. Photogramm. Eng. 1972, 38, 971–973. [Google Scholar]
  39. Congedo, L. Semi-automatic classification plugin documentation. Release 2016, 4, 29. [Google Scholar]
  40. Ruwaimana, M.; Satyanarayana, B.; Otero, V.; Muslim, A.M.; Syafiq, A.M.; Ibrahim, S.; Raymaekers, D.; Koedam, N.; Dahdouh-Guehbas, F. The advantages of using drones over space-borne imagery in the mapping of mangrove forests. PLoS ONE 2018, 13, e0200288. [Google Scholar] [CrossRef]
  41. Kruse, F.A.; Lefkoff, A.B.; Boardman, J.W.; Heidebrecht, K.B.; Shapiro, A.T.; Barloon, P.J.; Goetz, A.F.H. The spectral image processing system (SIPS)—Interactive visualization and analysis of imaging spectrometer data. Remote Sens. Environ. 1993, 44, 145–163. [Google Scholar] [CrossRef]
  42. Hyams, D.G. CurveExpert Professional Documentation, 3rd ed.; Release: St. Paul, MN, USA, 2008; pp. 154–196. [Google Scholar]
  43. Hakamada, R.E.; Binkley, D.; Cegatta, I.; Alvares, C.; Campoe, O.C.; Stape, J.L. Validation of an efficient visual method for estimating leaf area index in clonal Eucalyptus plantations. South. For. A J. For. Sci. 2016, 78, 275–281. [Google Scholar] [CrossRef]
  44. Peña, J.M.; Torres Sánchez, J.; Serrano Pérez, A.; De Castro, A.I.; López Granados, F. Quantifying efficacy and limits of unmanned aerial vehicle (UAV) technology for weed seedling detection as affected by sensor resolution. Sensors 2015, 15, 5609–5626. [Google Scholar] [CrossRef]
  45. Torres Sánchez, J.; López Granados, F.; De Castro, A.I.; Peña Barragán, J.M. Configuration and specifications of an unmanned aerial vehicle (UAV) for early site specific weed management. PLoS ONE 2013, 8, e58210. [Google Scholar] [CrossRef]
  46. Ford, J.; Sadgrove, E.; Paul, D. Developing an extreme learning machine based approach to weed segmentation in pastures. Smart Agric. Technol. 2023, 5, 100288. [Google Scholar] [CrossRef]
  47. Woebbecke, D.M.; Meyer, G.E.; Von Bargen, K.; Mortensen, D.A. Color indices for weed identification under various soil, residue, and lighting conditions. Trans. ASAE 1995, 38, 259–269. [Google Scholar] [CrossRef]
  48. López Granados, F.; Torres Sánchez, J.; Serrano Pérez, A.; de Castro, A.I.; Mesas Carrascosa, F.J.; Peña, J.M. Early season weed mapping in sunflower using UAV technology: Variability of herbicide treatment maps against weed thresholds. Precis. Agric. 2016, 17, 183–199. [Google Scholar] [CrossRef]
  49. Torres Sánchez, J.; Peña, J.M.; de Castro, A.I.; López Granados, F. Multi-temporal mapping of the vegetation fraction in early-season wheat fields using images from UAV. Comput. Electron. Agric. 2014, 103, 104–113. [Google Scholar] [CrossRef]
  50. Raymond Hunt, E.; Gillham, J.H.; Daughtry, C.S.T. Improving Potential Geographic Distribution Models for Invasive Plants by Remote Sensing. Rangel. Ecol. Manag. 2010, 63, 505–513. [Google Scholar] [CrossRef]
  51. Louargant, M.; Jones, G.; Faroux, R.; Paoli, J.N.; Maillot, T.; Gée, C.; Villette, S. Unsupervised Classification Algorithm for Early Weed Detection in Row-Crops by Combining Spatial and Spectral Information. Remote Sens. 2018, 10, 761. [Google Scholar] [CrossRef]
  52. Carter, G.A.; Knapp, A.K. Leaf optical properties in higher plants: Linking spectral characteristics to stress and chlorophyll concentration. Am. J. Bot. 2001, 88, 677–684. [Google Scholar] [CrossRef]
  53. Hakamada, R.E.; Hubbard, R.M.; Moreira, G.G.; Stape, J.L.; Campoe, O.; de Barros Ferraz, S.F. Influence of stand density on growth and water use efficiency in Eucalyptus clones. For. Ecol. Manag. 2020, 466, 118125. [Google Scholar] [CrossRef]
  54. Binkley, D.; Campoe, O.C.; Alvares, C.; Carneiro, R.L.; Cegatta, Í.; Stape, J.L. The interactions of climate, spacing and genetics on clonal Eucalyptus plantations across Brazil and Uruguay. For. Ecol. Manag. 2017, 405, 271–283. [Google Scholar] [CrossRef]
  55. Huang, C.-W.; Chu, C.-R.; Hsieh, C.-I.; Palmroth, S.; Katul, G.G. Wind-induced leaf transpiration. Adv. Water Resour. 2015, 86, 240–255. [Google Scholar] [CrossRef]
  56. Gardiner, B.; Byrne, K.; Hale, S.; Kamimura, K.; Mitchell, S.J.; Peltola, H.; Ruel, J.-C. A review of mechanistic modelling of wind damage risk to forests. Forestry 2008, 81, 447–463. [Google Scholar] [CrossRef]
  57. Unger, P.W.; Kaspar, T.C. Soil Compaction and Root Growth: A Review. Agron. J. 1994, 86, 759–766. [Google Scholar] [CrossRef]
  58. Drewry, J.; Cameron, K.; Buchan, G. Pasture yield and soil physical property responses to soil compaction from treading and grazing—A review. Soil Res. 2008, 46, 237–256. [Google Scholar] [CrossRef]
  59. Shao, H.; Xia, T.; Wu, D.; Chen, F.; Mi, G. Root growth and root system architecture of field-grown maize in response to high planting density. Plant Soil 2018, 430, 395–411. [Google Scholar] [CrossRef]
  60. Swamy, S.L.; Puri, S.; Singh, A.K. Growth, biomass, carbon storage and nutrient distribution in Gmelina arborea Roxb. stands on red lateritic soils in central India. Bioresour. Technol. 2003, 90, 109–126. [Google Scholar] [CrossRef] [PubMed]
  61. Rasineni, G.K.; Guha, A.; Reddy, A.R. Elevated CO2 atmosphere significantly increased photosynthesis and productivity in a fast growing tree species, Gmelina arborea Roxb. Clim. Chang. Environ. Sustain. 2013, 1, 81. [Google Scholar] [CrossRef]
Figure 1. Location of the study site in the western portion of Veracruz State, Mexico.
Remotesensing 15 04751 g001
Figure 2. Drone image: (a) Red circles splitting the stocking treatments contained in the Table 1 from 300 to 7141 trees ha−1; (b) General view of the experiment.
Remotesensing 15 04751 g002
Figure 3. Height as a function of stem base diameter had a high relationship regardless of tree age and stocking rates.
Remotesensing 15 04751 g003
Figure 4. Visual illustration of the difference between stockings from 498 to 7144 tree ha−1 (A), average stem base diameter (B) and tree height (C) increased with increasing stocking rates from 1 to 9 months in Gmelina arborea in Veracruz, Mexico.
Remotesensing 15 04751 g004
Figure 5. Individual (kg tree−1) (A) and total area biomass (Mg ha−1) (B) were highly related with stocking rates in Gmelina arborea in Veracruz, Mexico.
Remotesensing 15 04751 g005
Figure 6. Aboveground carbon stock increased with the increasing of tree stocking and age. Equation is presented to the age of 9 months.
Remotesensing 15 04751 g006
Figure 7. Classified image with and without weeds was captured by the RGB image classification.
Remotesensing 15 04751 g007
Figure 8. Relationship between canopy area estimated by drone and field measurements, with no relationship in the area with weeds and a strong relationship in the area without weeds.
Remotesensing 15 04751 g008
Figure 9. Error without (left) and with weeds (right) showing a very high error in areas with less than 2000 trees ha−1.
Remotesensing 15 04751 g009
Table 1. Planting spacing (m2 tree−1) with each corresponding stocking (tree ha−1).
CircleSpacing (m2 tree−1)Stocking (tree ha−1)
16.47141
28.04877
39.53321
411.32265
513.71544
616.81052
720.4716
825.0489
930.0300
Disclaimer/Publisher’s Note: The statements, opinions and data contained in all publications are solely those of the individual author(s) and contributor(s) and not of MDPI and/or the editor(s). MDPI and/or the editor(s) disclaim responsibility for any injury to people or property resulting from any ideas, methods, instructions or products referred to in the content.

