Article

Channel Profiles Reveal Fault Activity along the Longmen Shan, Eastern Tibetan Plateau

1
State Key Laboratory of Earthquake Dynamics, Institute of Geology, China Earthquake Administration, Beijing 100029, China
2
Institute of Surface-Earth System Science, School of Earth System Science, Tianjin University, Tianjin 300072, China
*
Author to whom correspondence should be addressed.
Remote Sens. 2023, 15(19), 4721; https://doi.org/10.3390/rs15194721
Submission received: 10 August 2023 / Revised: 19 September 2023 / Accepted: 25 September 2023 / Published: 27 September 2023

Abstract

:
Assessing fault activity in regions lacking Quaternary sedimentary constraints remains a global challenge. In this study, we used channel slope distribution to examine variations in rock uplift along faults. By comparing channel steepness with published low-temperature thermochronology and paleo-seismic data, we identified deformation changes both perpendicular to and along the Longmen Shan at various time scales. Our data revealed distinct fault segments displaying distinct thrust activities along the Longmen Shan’s strike. In the southern segment, the Dachuan fault exhibited the highest activity, and its movement had persisted for millions of years. In the central segment, the Wenchuan fault was active during theearly Quaternary but has become dormant since the late Pleistocene. Within the past millions of years, the Yingxiu and Pengguan faults displayed significant vertical displacement. Fault activity in the northern Longmen Shan was relatively weak, with the Qingchuan fault transitioning from thrust movement during the Neogene to pure strike-slip activity since the Pleistocene. Overall, the Dachuan and Huya faults exhibited deformation patterns similar to the Yingxiu fault during the Quaternary. Similar to the Yingxiu fault, which triggered the Wenchuan earthquake, the Dachuan and Huya faults possess the capacity to produce significant earthquakes in the future. The variations in deformation perpendicular to and along the Longmen Shan fault system underscore the importance of upper crustal shortening in shaping the rock uplift patterns and topography of the eastern Tibetan Plateau margin.

1. Introduction

In active mountain belts, the evolution of the landscape is influenced by both external denudation processes and internal tectonic processes [1,2]. This idea emphasizes that the topography of the landscape contains valuable information about spatial and temporal patterns of tectonic deformations [3,4]. The increasing availability of open-source Digital Elevation Models (DEMs), such as ASTER, SRTM, and GTOPO, has made it convenient to extract meaningful tectonic signatures directly from the landscape morphology at local, regional, and global scales [5,6,7,8,9,10].
In mountainous regions with ongoing tectonic activity, bedrock channels play a significant role in shaping the topography and provide direct evidence of changes in rock uplift [3,11]. Previous studies have suggested that the longitudinal profiles and slope distribution of channels have the ability to preserve the magnitude and form of variations in rock uplift [12,13,14]. Normalized channel steepness is widely used as a metric for analyzing changes in channel profiles, offering an effective approach to studying the spatial and temporal patterns of tectonic deformations [4,15,16,17]. Unlike low-temperature thermochronology dating, which represents rock uplift on a million-year scale, channel steepness reflects deformation on a timescale of 104–106 years [4,17,18,19,20].
The Longmen Shan range, situated on the eastern margin of the Tibetan Plateau, stands out as one of the most prominent and imposing topographic escarpments worldwide (Figure 1a). It features steep terrain, with the average elevation rising from approximately 600 m in the Sichuan Basin to about 4000 m within the Tibetan Plateau, all within a relatively short horizontal distance of about 70 km [21] (Figure 1b). This range is characterized by deeply dissected landscapes shaped by the tributaries of the Yangtze River. The correlation between high peak elevations and substantial relief along the Longmen Shan has led to several interpretations, including the possibility of lower crustal flow at depth [15], an isostatic response to the erosion of the plateau margin [22], or variations in rock uplift linked to active faults [21,23].
The Longmen Shan range is divided into southern, central, and northern segments based on topography and structural deformation [26,27,28] (Figure 1). The 2008 Mw 7.9 Wenchuan earthquake demonstrated notable variations in both the magnitude and direction of co-seismic slip along the central and northern segments [29,30]. Within the southern segment of the Yingxiu-Beichuan fault, thrusting deformation was the predominant mechanism, while the northern segment was characterized by strike-slip faulting. In the aftermath of the Wenchuan earthquake, numerous studies have examined along-strike variations in the longitudinal activities of the Longmen Shan thrust belt [21,27,31,32,33]. However, aside from the Yingxiu-Beichuan and Pengguan faults, which experienced rupture during the Wenchuan earthquake, evaluating the activity of other faults presents a challenge due to the absence of Quaternary sediment along the Longmen Shan [31,34]. The differences in fault activities, potential seismic hazards, and uplift rates along the strike of each fault also remain unclear.
This study aims to investigate the spatial deformation patterns across the Longmen Shan mountain range using digital topography alongside published low-temperature thermochronology dating and paleo-seismic records. Our analysis involves computing normalized river steepness and exhumation rates for the entire Longmen Shan region. We then present the outcomes through along-strike swath and orogen-perpendicular profiles to discern discrepancies in deformation throughout the mountain range. The primary objective of this study is to establish the lateral scope of structural segments and explore the variations in rock uplift and thrust-related activities along the longitudinal stretch of the Longmen Shan. In pursuing this approach, our aspiration is to garner a deeper understanding of the seismic hazard propensity in East Tibet.

2. Tectonic Setting

2.1. Geology

The basement of the Longmen Shan primarily comprises late Proterozoic metavolcanic and metasediments originating from the Yangtze Craton. This stratum is overlaid by the metamorphosed sedimentary sequence of the Paleozoic passive margin. On its western side, it abuts a substantial Triassic flysch sequence referred to as the Songpan Garze flysch, accompanied by scattered Triassic–Jurassic granitic rocks [35] (Figure 2).
The Longmen Shan has a lengthy history of tectonic deformation. During the late Triassic–Jurassic period, the convergence of South China, North China, and Qiangtang blocks caused intense deformation in the Songpan Garze flysch, leading to the formation of an array of fold-and-thrust belts along the western boundary of the Sichuan basin. Since the Cenozoic era, the geological structures within the Longmen Shan have been reactivated due to the collision between the Indian and Eurasian plates, superimposing their effects onto the pre-existing Mesozoic fold-and-thrust belt [35,36,37].
The intricate tectonic history and limited Cenozoic sedimentation make it a formidable task to ascertain the extent of Cenozoic compression across the Longmen Shan. Earlier investigations have indicated that the deformation of the upper crust within the Longmen Shan was predominantly concentrated during the Mesozoic era, with only minor compression of approximately 10 km occurring during the Cenozoic period [35,37,38]. On the contrary, Hubbard and co-workers [31] assessed Cenozoic compression in the foothills to be around 45 km via the balanced geological cross-section analysis. Studies involving low-temperature thermochronology have documented a significant episode of exhumation within the Longmen Shan since 8–15 million years ago [38,39,40,41], or the occurrence of multiple rapid uplift events commencing around 25–30 million years ago and 10–15 million years ago, respectively [42,43].

2.2. Seismotectonic Activity along the Longmen Shan

Longitudinally, the Longmen Shan can be roughly partitioned into three distinct segments (Figure 1 and Figure 2), each characterized by variations in their structural composition, topographical features, and seismic behavior [26,27,44]. The southern and central Longmen Shan exhibit pronounced steep topography and have been characterized by significant thrust activity during the Quaternary. In contrast, the northern segment displays relatively smoother topography and is predominantly influenced by strike-slip faulting.
The southern segment extends from Tianquan Country to Yingxiu Town and encompasses three parallel thrust faults within the Quaternary structural arrangement, including the Genda, Wulong, and Dachuan faults [45] (Figure 1 and Figure 2). Up to now, there exists no conclusive geological or geomorphological evidence indicating the presence of Holocene activity along the Genda and Wulong faults [46]. In contrast, the Dachuan fault emerged as the most active fault in the southern Longmen Shan during the Holocene, with an average thrust slip rate ranging between 0.2 and 0.6 mm/yr [47,48].
In the central portion of the Longmen Shan, extending from Yingxiu Town to Beichuan Town, the geological formations of the Quaternary era are well documented, which include the parallel Wenchuan, Yingxiu, and Pengguan faults [35,36] (Figure 1 and Figure 2). The Wenchuan fault exhibits a dextral strike-slip behavior, accompanied by a dip-slip component during the early Quaternary period, with subsequent inactivity since the late Pleistocene epoch [49]. Along the Yingxiu fault, distinct geomorphic offsets indicate a throw rate of 0.1–1.1 mm/yr and a dextral slip rate of 0.2–1.0 mm/yr [50,51,52,53]. The seismic event of the 2008 Mw 7.9 Wenchuan earthquake resulted in surface rupture along the Yingxiu fault, causing a peak vertical displacement of ~6.5 m and a dextral displacement of ~4.9 m [29,30]. Regarding the Pengguan fault, it has undergone dextral strike-slip activity ranging from 0.6 to 1.5 mm/yr, with a minor dip-slip component of 0.1–0.6 mm/yr during the Holocene epoch [50,51,52]. This fault was also ruptured during the Wenchuan earthquake, giving rise to a peak vertical displacement of ~3.5 m [29,30].
The northern section of the Longmen Shan, spanning from Beichuan Town to Qingchuan Town, is demarcated from the central segment by the north-trending Minshan Range (bounded by the Minjiang and Huya faults) [36,54]. Within this region, the Cenozoic structures encompass the Qingchuan, Beichuan, and Jiangyou faults [45] (Figure 1 and Figure 2). The Qingchuan fault exhibits distinct topographic offsets that signify its right-lateral strike-slip movement during the Quaternary period. However, there is still ongoing debate regarding its activity during the Holocene era. Sun et al. [55] proposed that the Qingchuan fault may have exhibited activity during the Holocene based on findings from paleoseismological trench excavations. On the other hand, Liang et al. [56] posited that the surface extensional fractures observed within the trench were attributed to gravity collapse rather than fault motion. In contrast, the Beichuan fault experienced rupture during the Wenchuan earthquake and was predominantly characterized by right-lateral slip movement [29,30]. Currently, there remains no conclusive evidence supporting the occurrence of activity along the Jiangyou fault during the late Quaternary period [57].
In the context of the Longmen Shan, previous studies have generally categorized the Genda, Wenchuan, and Qingchuan faults as part of the back mountain fault belt, the Wulong, Yingxiu, and Beichuan faults as components of the central fault belt, and the Dachuan, Pengguan, and Jiangyou faults as constituting the range-front fault belt [36,58]. Nevertheless, the findings from low-temperature thermochronology and topography indices suggest that the Wulong fault might represent the southern continuation of the Wenchuan fault, and at present, the Dachuan fault and Yingxiu fault appear to be interconnected [33,41].

3. Data and Methods

3.1. Data Sources

In this study, we selected the Advanced Spaceborne Thermal Emission and Reflection Radiometer (ASTER) Global Digital Elevation Model Version 2 (GDEM V2) (https://search.earthdata.nasa.gov/search, accessed on 1 February 2023) for analyzing topography. This dataset is a collaboration between Japan’s Ministry of Economy, Trade, and Industry (METI) and NASA. It provides a spatial resolution of 30 m. We have not used SRTM30 and AW3D30 DEMs because they often contain voids in mountainous regions [20]. Considering the size of our study area and the specific geomorphic indices we analyzed, the vertical and horizontal accuracy of ASTER GDEM V2 is sufficient for capturing regional trends in relative tectonic activity. Furthermore, Boulton and Stokes [59] demonstrated that the choice of DEM has minimal impact on the river profile and derivative geomorphic indices.
The precipitation data were obtained from WorldClim 2, which offers global climate data for land areas at a spatial resolution of approximately 1 km2 [60]. WorldClim 2 integrates data from numerous weather stations and satellite observations, all subjected to meticulous quality control procedures. It provides a valuable resource for accessing detailed climate information and is freely accessible for download from the WorldClim website (www.worldclim.org, accessed on 10 September 2023). For our analysis, we specifically extracted monthly precipitation data from 1970 to 2000 in order to calculate the average annual precipitation along the Longmen Shan.

3.2. Normalized Channel Steepness (ksn)

The stream power incision model established a power-law correlation among upstream area (A), channel slope (S), concavity index (θref), and normalized channel steepness (ksn) [61,62]:
S = k s n A θ r e f ,
Numerous observational investigations have consistently affirmed a clear and positive functional association between channel steepness and erosion rate [4,16]. Assuming consistent bedrock resistance and runoff conditions, the spatial arrangement of channel steepness can function as a relative indicator for detecting ongoing deformation and uplift across mountainous regions [15,16,17].
To minimize scatter in pixel–pixel slope estimates, we utilized an integrated approach when calculating the channel steepness [63,64]:
z ( x ) = z ( x b ) + ( U K ) 1 / n x b x d x A ( x ) m / n ,
where U represents rock uplift, K is the erodibility constant, z denotes elevation, x represents the horizontal upstream distance, and xb represents the distance to the base level of the river network, which commonly reflects the downstream end of the analyzed profile. To construct altered river profiles with length units assigned to both axes, it is common practice to introduce an arbitrary reference drainage area A0:
z ( x ) = z ( x b ) + ( U K A 0 m ) 1 / n χ ,
with
χ = x b x ( A 0 A ( x ) ) m / n d x
In this scenario, the elevation z(x) follows a linear equation involving the transformed coordinate χ, which possesses a length dimension. The value of χ is contingent upon the ratio of m to n, while the slope of the χ profile is determined by a function that incorporates the power of 1/n for the uplift-to-erodibility ratio (U/K). In addition, in order to mitigate the influence of climate, we have made a modification to the variable χ. Instead of scaling it with drainage area, we have chosen to scale it with discharge Q that the product of drainage area and mean upstream precipitation [65,66].
χ = x b x ( Q 0 Q ( x ) ) m / n d x
We established a reference drainage area of A0 = 1 m2 to maintain alignment between the gradient of χ and the ksn obtained from the log slope-area analysis [67]. A reference concavity value of θref = 0.4 was adopted, grounded in the area-slope relationship applicable to Eastern Tibet drainages [21]. These computations were executed using the MATLAB-based software package Topo Toolbox version 2.0 [68].
We examined three perpendicular swath profiles, each encompassing a width of 50 km, extending across the northern, central, and southern segments of the Longmen Shan (Figure 1). Additionally, parallel to the fault strike, we acquired swath profiles measuring 10 km in width, spanning both the hanging and footwall sides of each fault. The difference in ksn (△ksn) between catchments located in the foot and hanging walls of each active fault was calculated to gauge the variation in uplift. To mitigate local influences, the strike-parallel values were averaged within 5-km-wide intervals.

4. Results

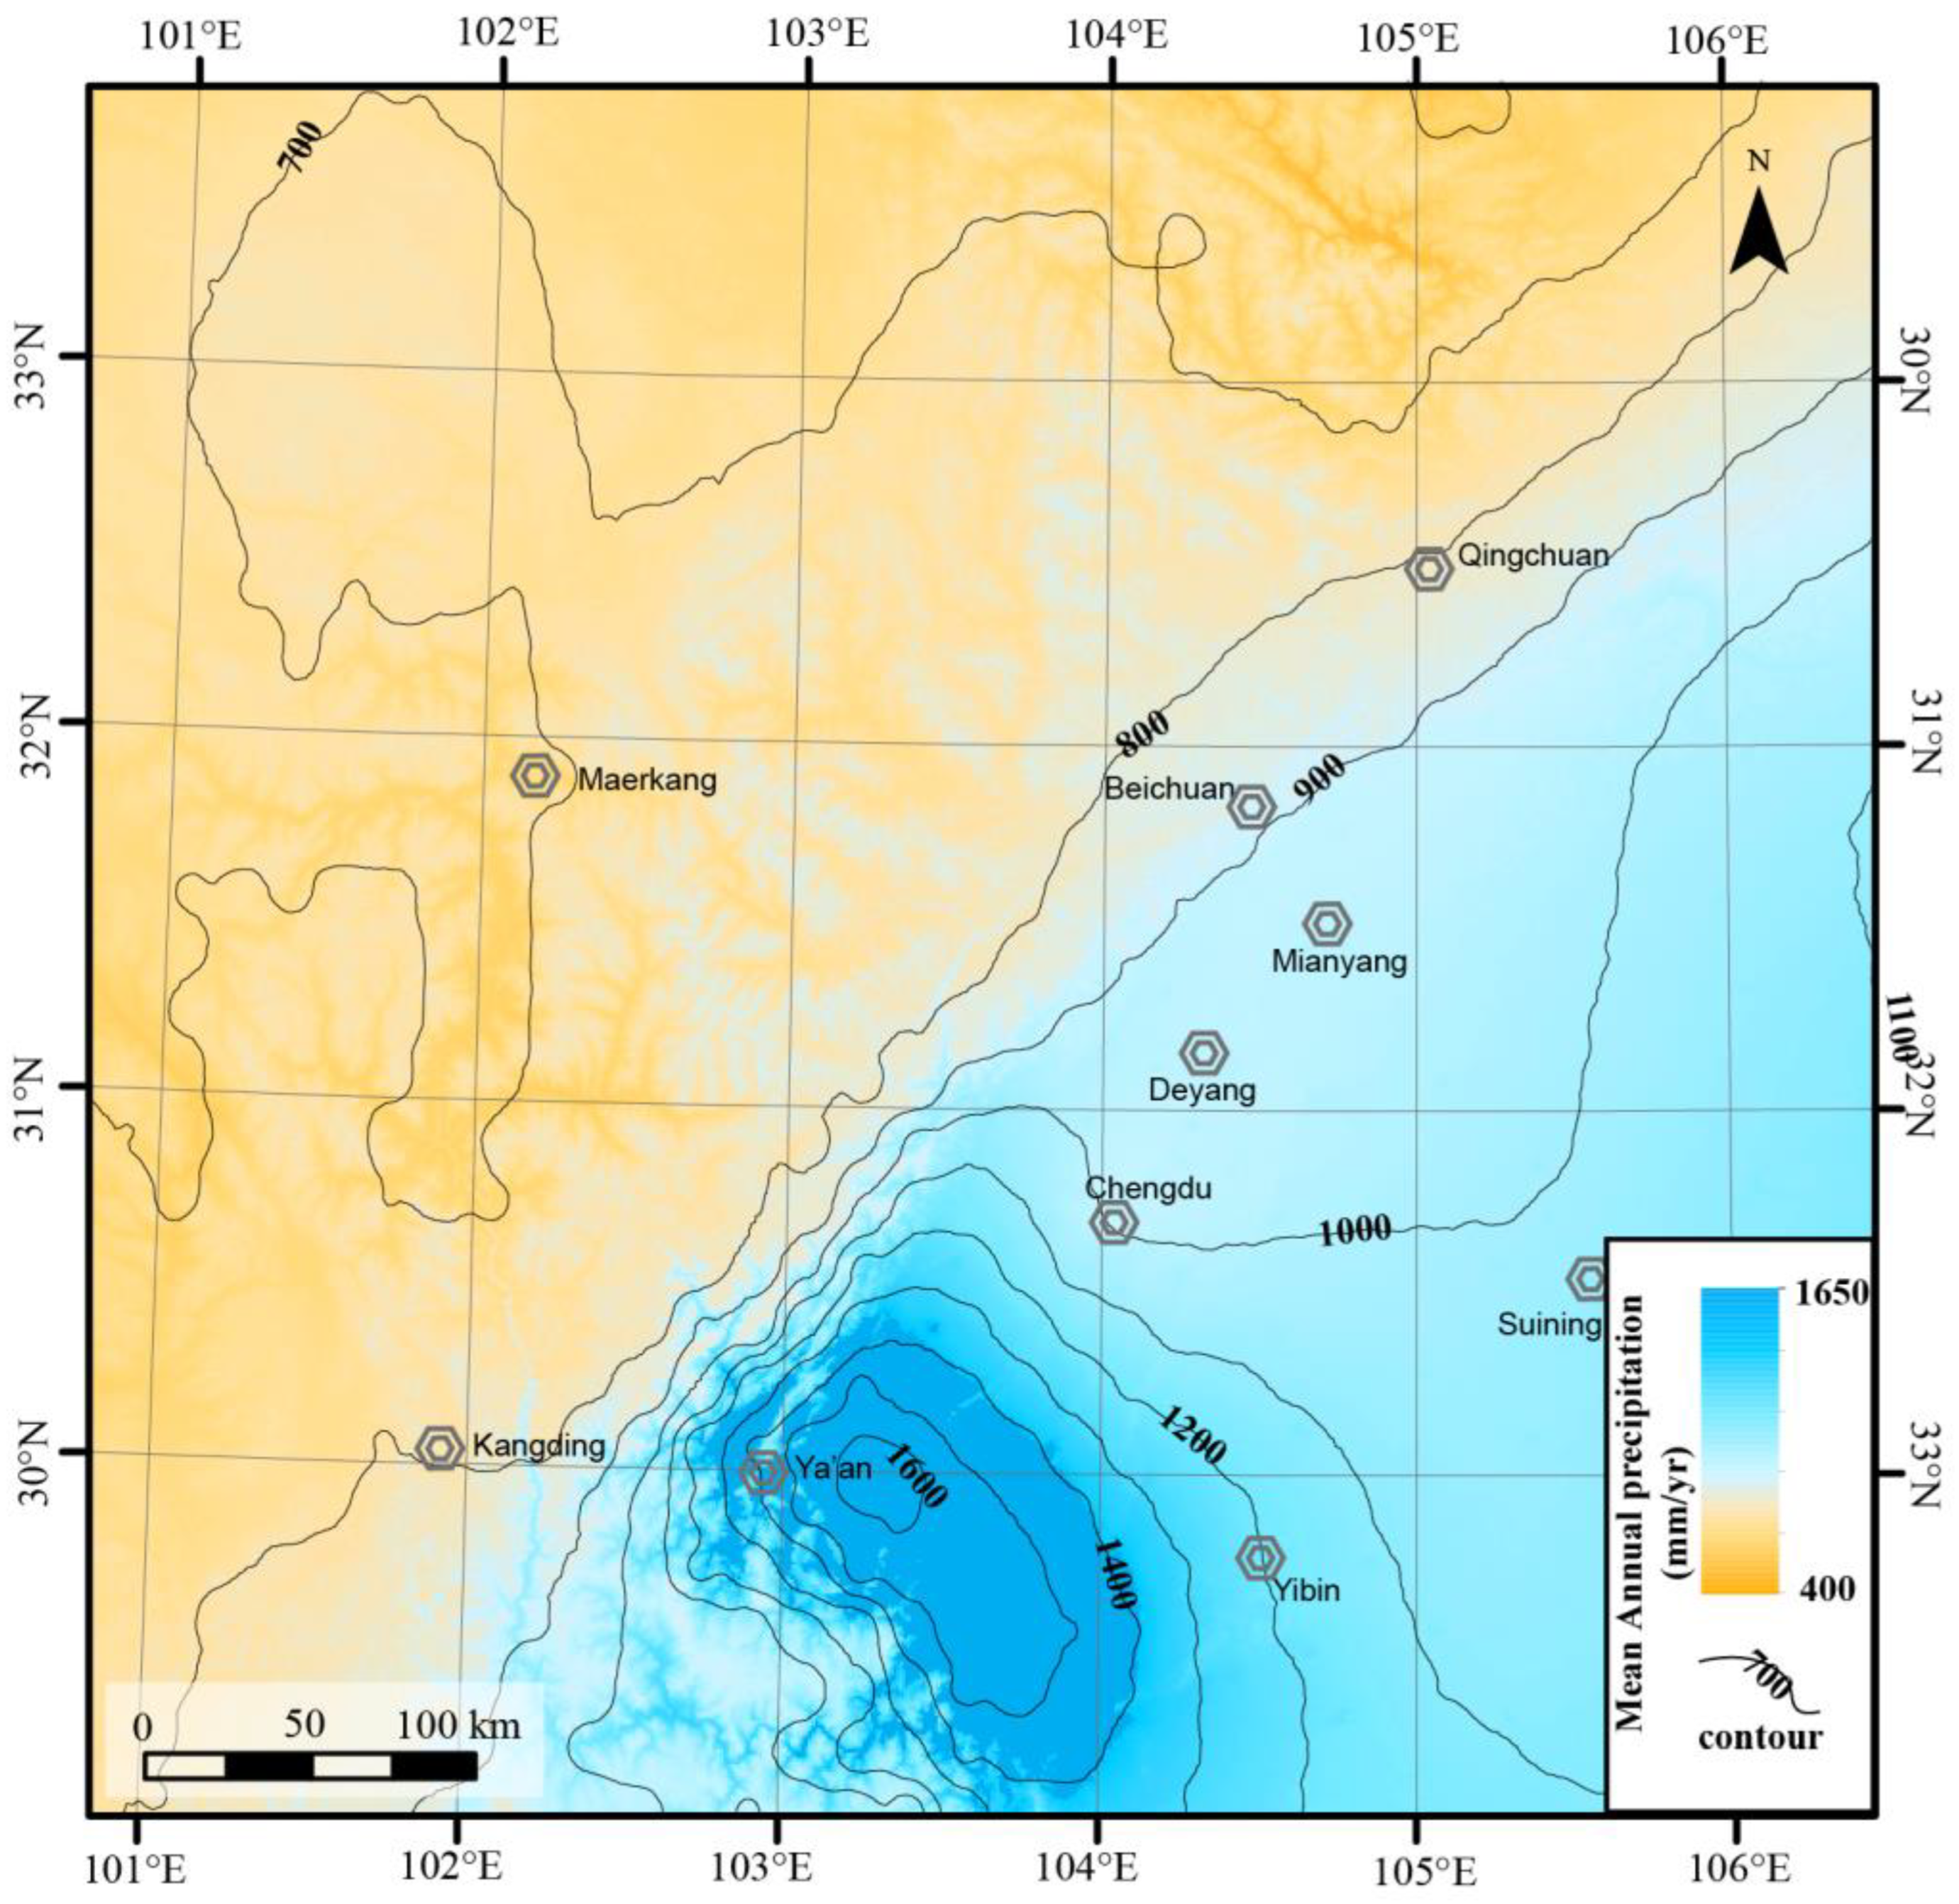
The spatial distribution of annual precipitation shows a northwestward decrease toward the interior of the Tibetan Plateau (Figure 3). Along the western margin of the Sichuan Basin, the average annual precipitation is approximately 1000 mm/yr, gradually decreasing to 600 mm/yr on the high plateau. A distinctive bullseye-shaped region with relatively high precipitation is observed at the southwest corner of the Sichuan Basin, where the annual precipitation rate reaches a maximum of approximately 1600 mm/yr (Figure 3). This phenomenon is attributed to a unique orographic rain effect resulting from the steeply rising topography in the north and west, which effectively traps and lifts moist air masses.
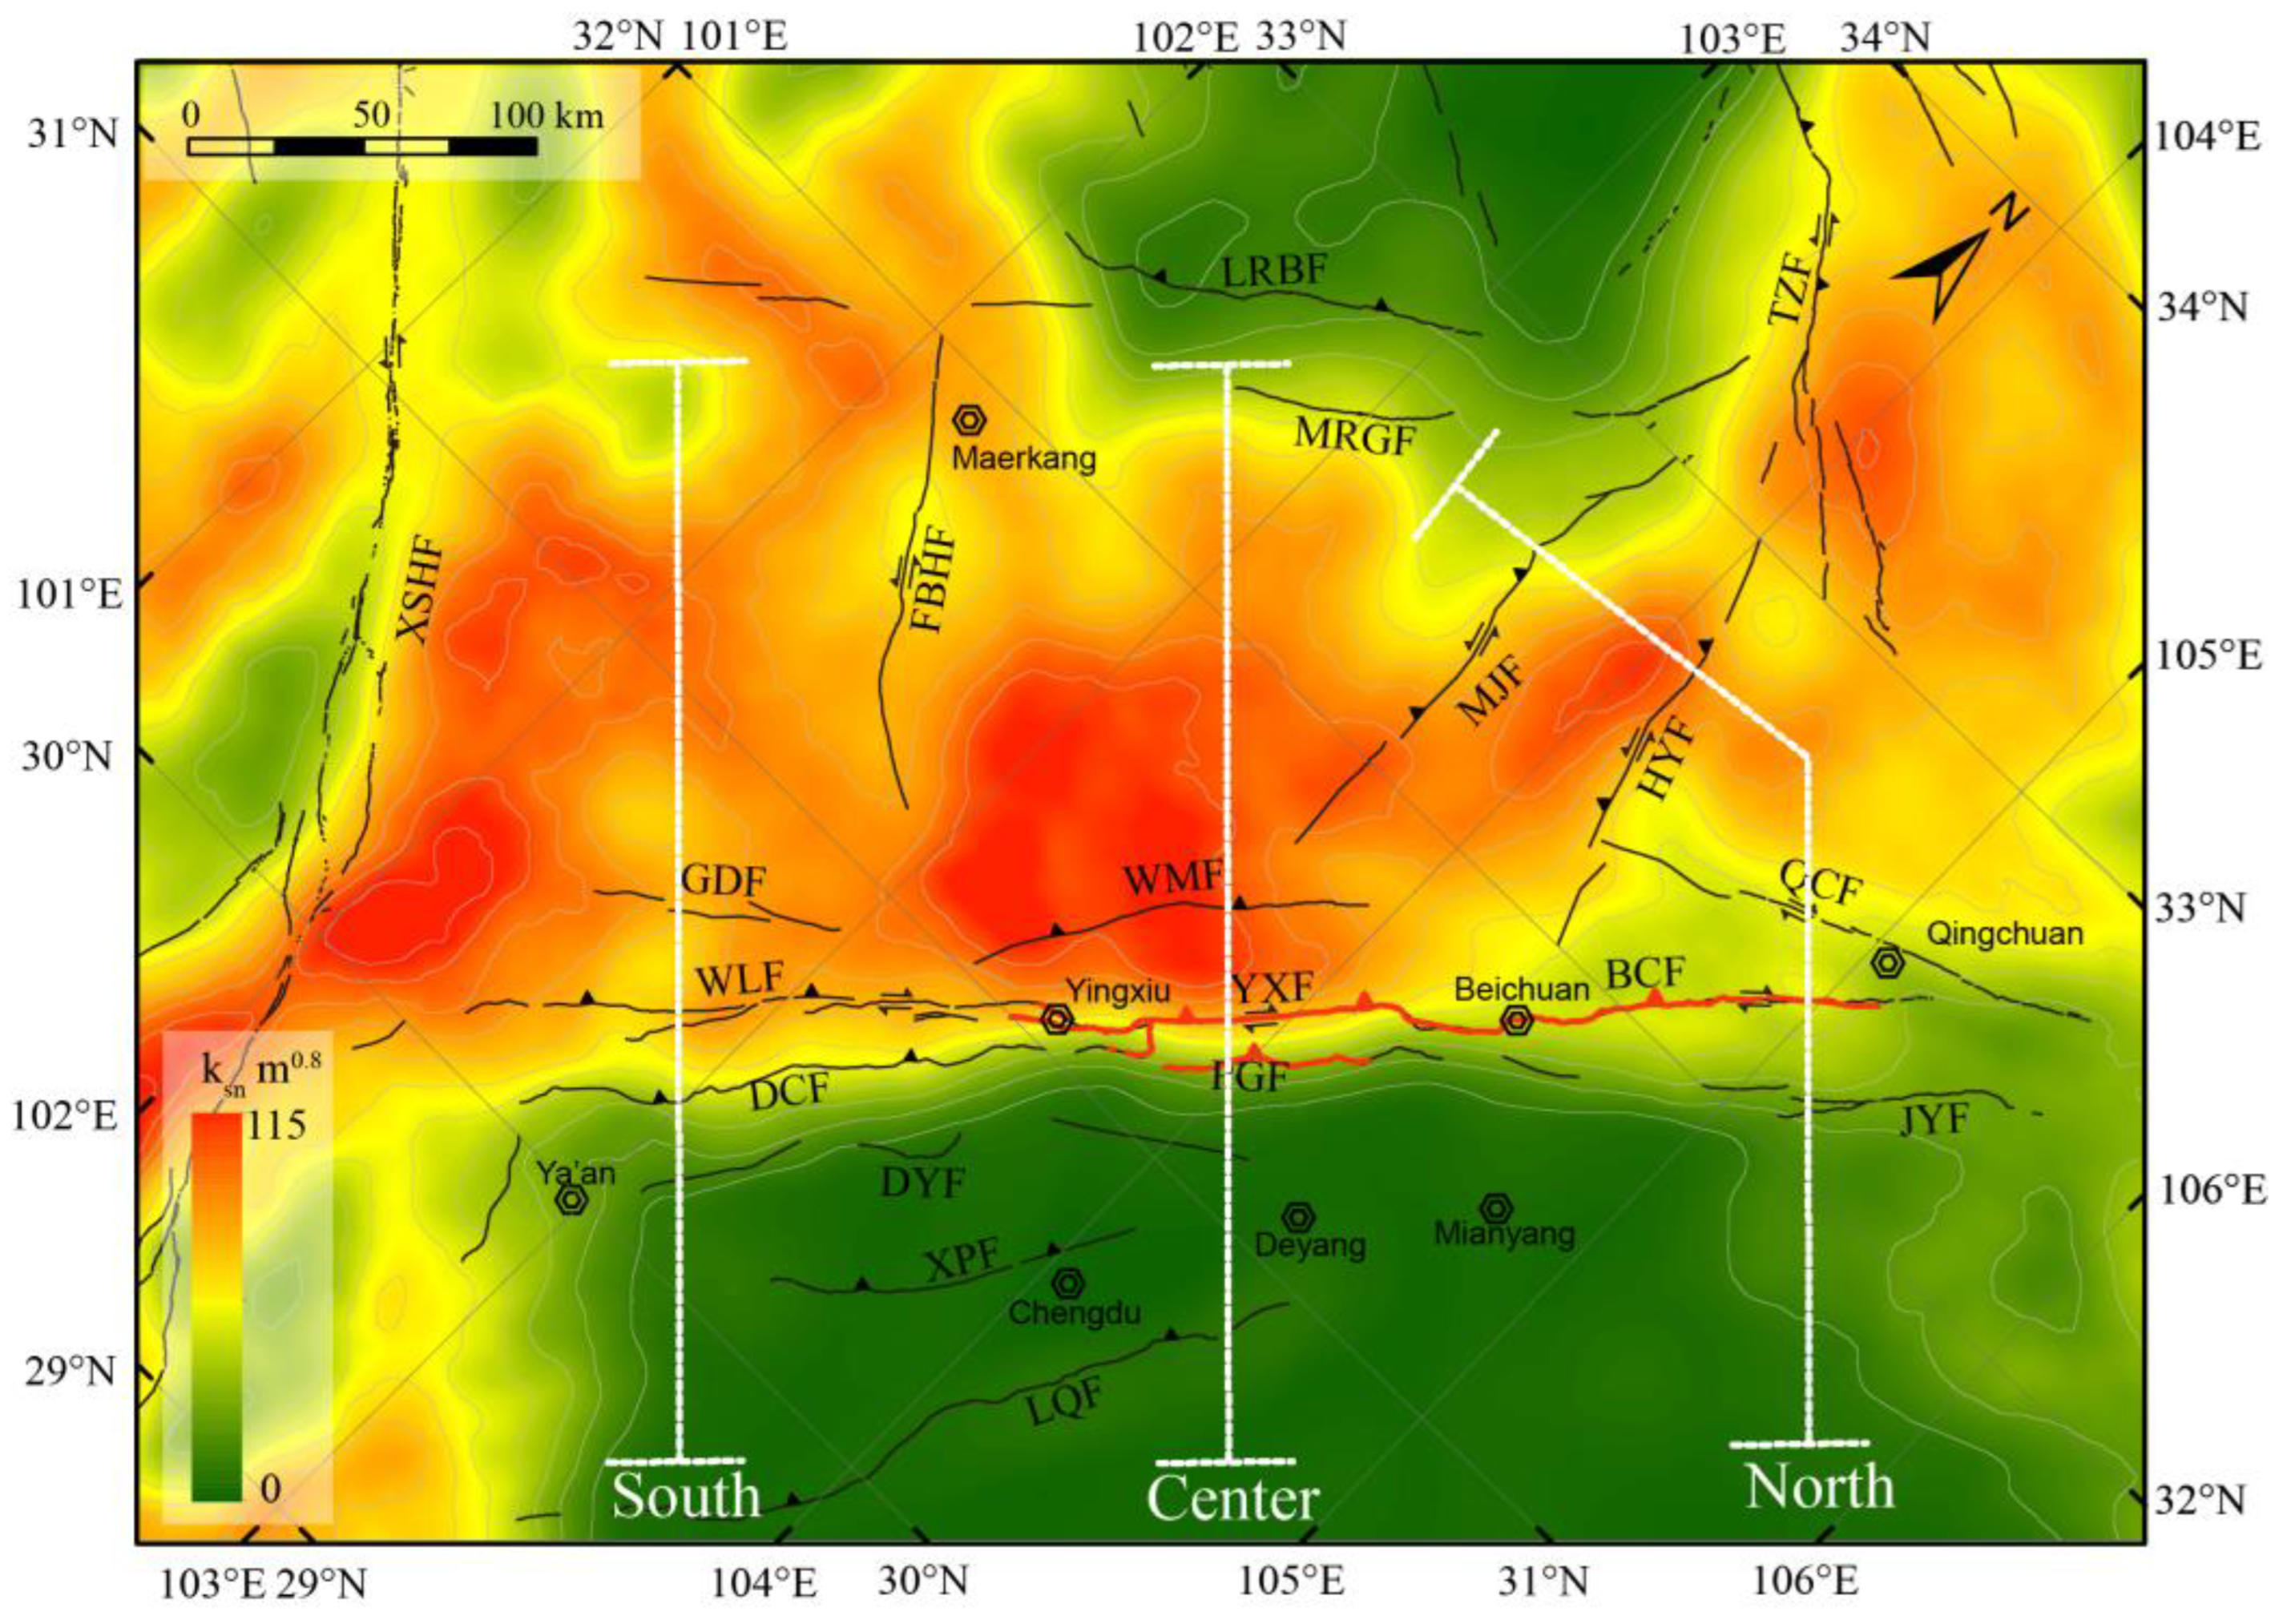
The gradient of the channel exhibits minimal values within the confines of the Sichuan Basin but experiences a swift escalation upon traversing the Longmen Shan thrust fault belt. Furthermore, the magnitude of ksn values undergoes changes along the longitudinal extent of the Longmen Shan (Figure 4).
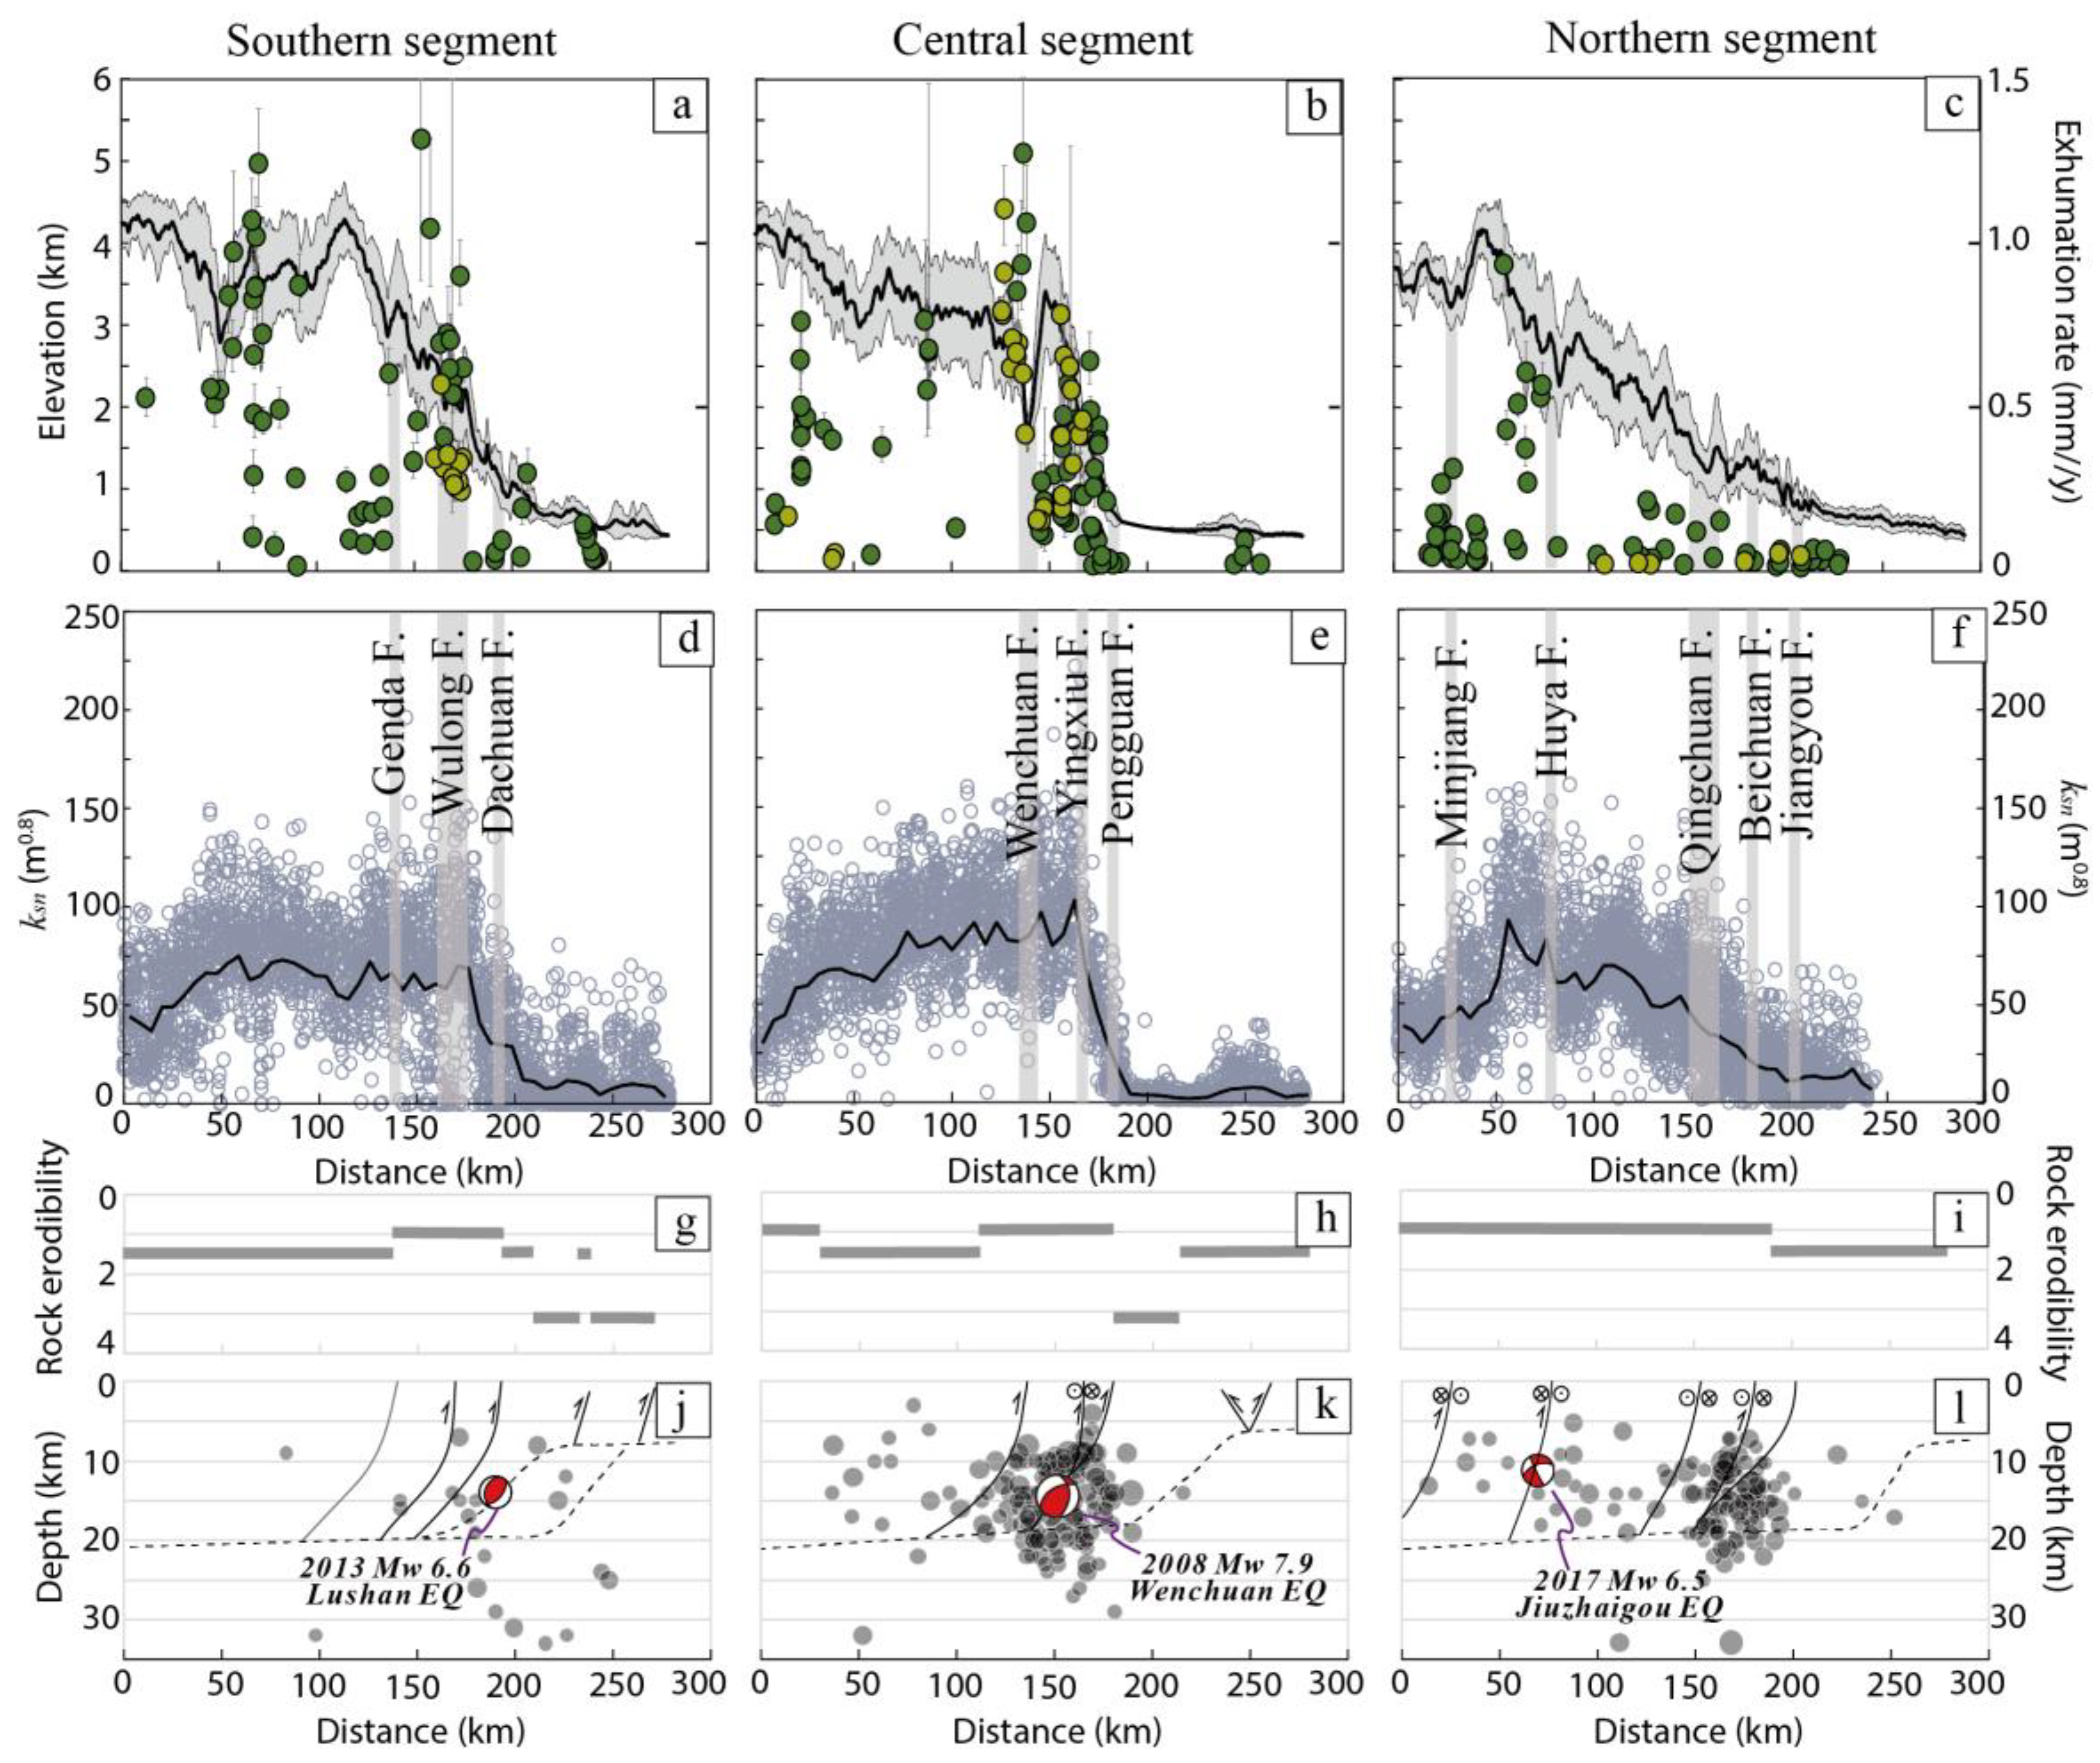
The southern segment of the Longmen Shan displays a more gradual frontal elevation (Figure 5a). The channel steepness ksn (calculated by averaging the values of 2- and 3-order drainage catchments) undergoes a swift surge as it crosses the Dachuan fault, reaching its maximum value of ~75 m0.8. In the region encompassing the Wulong and Genda faults, this metric remains relatively constant (Figure 5d). Conversely, the central segment exhibits the steepest topographical configuration along the Longmen Shan (Figure 5b). Within this expanse, there is an abrupt escalation in channel steepness ksn within the hanging wall regions of the Pengguan and Yingxiu faults, reaching a maximum of ~100 m0.8 (Figure 5e). The northern segment of the range demonstrates a gentler topographical demeanor along the Longmen Shan (Figure 5c). The channel steepness ksn is low in the vicinity of the Jiangyou fault and gradually increases towards the northwest. However, there is a sharp increase in the hanging wall of the Huya fault, reaching an extent of ~90 m0.8 (Figure 5f).
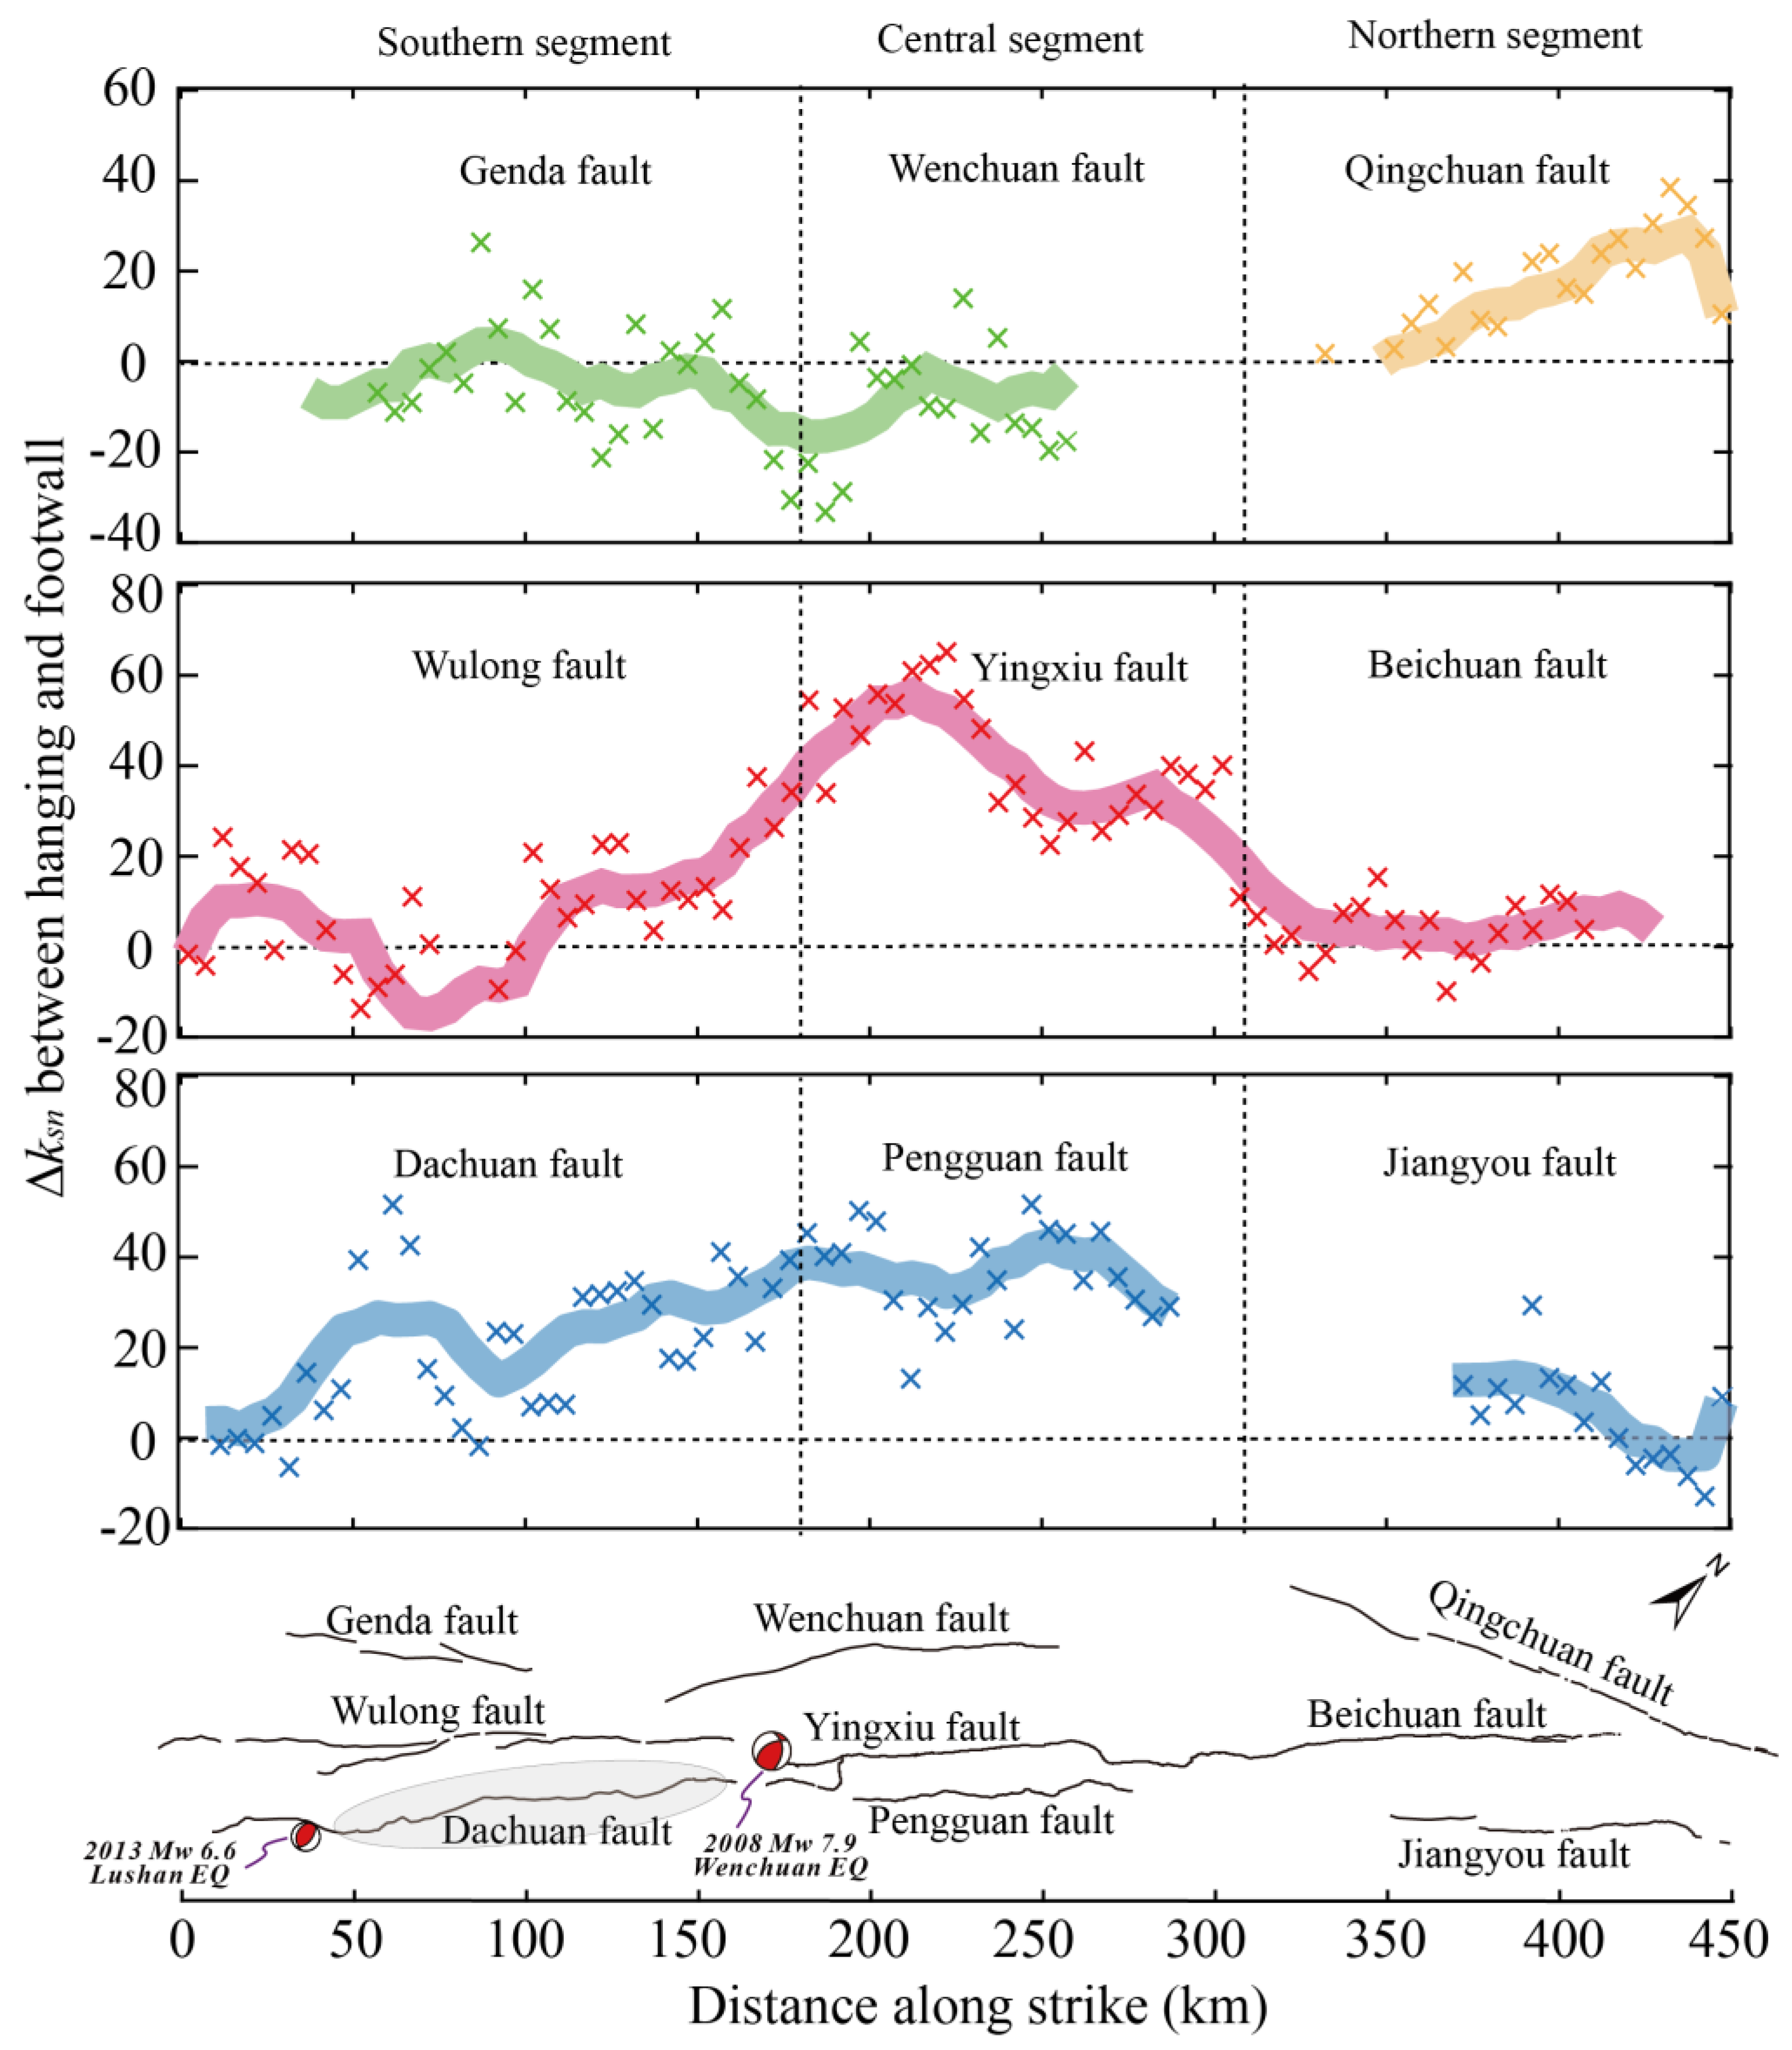
The difference in ksn, denoted by (△ksn), between the catchments located in the foot and hanging walls of each active fault displays significant variations along the strike (Figure 6). Along the back mountain fault belt, the △ksn remains minimal along the Genda and Wenchuan faults and is gradually increased towards the northeast to ~30 m0.8 along the Qingchuan fault. Within the central fault belt, the channel steepness ksn shows little difference across the Wulong and Beichuan faults but exhibits a considerable difference across the Yingxiu fault, with a maximum value of ~60 m0.8. Along the range-front fault belt, the △ksn demonstrates an increasing trend towards the northeast along the Dachuan and Pengguan faults, peaking at approximately 40 m0.8. Across the Jiangyou fault, the △ksn remains minimal, nearly approaching zero.

5. Discussion

5.1. Deformation across Faults at Various Timescales

In East Tibet, the surface erosion and channel profile are minimally affected by lithological variation [21] (Figure 5d–i). Therefore, the channel steepness ksn based on discharge, which eliminates the influence of climate, offers a valuable approach for characterizing rock uplift [66]. Low-temperature thermochronology has been widely used to track the average exhumation rates over extended periods, spanning millions of years, across the Longmen Shan [38,40,74,75,76,77,78,79,82]. Paleoseismology provides documentation of fault activity within a timescale ranging from decades to thousands of years [47,51,52,53]. Comparatively, the geomorphic indices ksn in our study serve to indirectly calibrate uplift rates within a timescale of 104–106 years [4,17,18,19]. Through the integration of channel topography, low-temperature thermochronology, and paleo-seismic assessments, a more intricate deformation pattern along the faults becomes discernible.
In the southern segment of the Longmen Shan, the exhumation rates derived from AHe and AFT methodologies display a sharp increase from ~0.05 mm/yr to ~0.7 mm/yr across the Dachuan and Wulong faults, followed by a decrease in the hanging wall of the Genda fault (Figure 5a). This trend aligns harmoniously with the outcomes from channel ksn values (Figure 5d and Figure 6) and detrital 10Be-derived erosion rates [21], both of which demonstrate a sudden elevation in values upon intersecting the Dachuan fault. Collectively, these observations suggest that the Dachuan and Wulong faults have experienced significant thrust movement, while the Genda fault may have had little to no thrusting activity over the past million years. Furthermore, paleoseismic investigations indicate that the Dachuan fault exhibited robust thrust activity during the Quaternary era, with a vertical slip rate ranging from 0.2 to 0.6 mm/yr [47,48,88]. Therefore, we speculate that the Dachuan fault stands as the most dynamically active fault in the southern section of the Longmen Shan, maintaining its activity for several million years at the very least.
Moving towards the northeastern direction to the central segment, the data from low-temperature thermochronology unveil elevated average exhumation rates, reaching approximately 0.8 mm/yr within the hanging wall zones of the Yingxiu and Wenchuan faults (Figure 5b). This observation points toward substantial uplift taking place over timescales spanning millions of years [76,78,82]. In contrast, the channel profile exhibits noticeable variations across the Pengguan and Yingxiu faults while demonstrating negligible changes across the Wenchuan fault (Figure 5e and Figure 6). This disparity suggests that thrusting activity along the Wenchuan fault may have ceased. On a more immediate scale, results from paleoseismic investigations corroborate the notion that the Wenchuan fault has demonstrated minimal thrust slip since the late Pleistocene [49], while the Yingxiu and Pengguan faults have evidenced substantial vertical displacement [29,30,50,51,52].
In the northern segment of the Longmen Shan, the exhumation rates derived from AHe and AFT methods are significantly lower compared to those observed in the southern and central segments. These rates hover around 0.04 mm/yr in the vicinity of the Jiangyou and Beichuan faults and increase to approximately 0.2 mm/yr near the Qingchuan fault (Figure 5c). Comparatively, the channel ksn displays a gradual increase in the hanging wall of the Jiangyou fault (Figure 5f). Paleoseismic investigations further indicate that the Qingchuan fault may have experienced inactivity or predominantly engaged in strike-slip motion since the late Pleistocene [55,56,89]. As such, a hypothesis emerges suggesting that the Qingchuan fault underwent thrust motion during the Neogene era, transitioning to primarily strike-slip activity since at least the Pleistocene. Conversely, the Beichuan and Jiangyou faults seem to have experienced minimal thrust slip over the past few million years.
In summary, the thrusting dynamics inferred from channel steepness within the Longmen Shan fault system harmonize effectively with the conclusions drawn from low-temperature thermochronology and paleoseismic analyses. Furthermore, a comparative analysis of these outcomes across different time scales underscores the deceleration of thrust activities along specific faults, namely, the Wulong, Wenchuan, and Qingchuan faults, over periods ranging from thousands to millions of years.

5.2. Signal for Seismic Risk along the Longmen Shan

Preceding 2008, both Global Positioning System (GPS) measurements and paleoseismic studies revealed a minimal slip rate along the Longmen Shan [90,91] (Figure 1). This further supports the notion that the Longmen Shan thrust belt possessed a moderate buildup of strain and a gradual accumulation of seismic risk. Nevertheless, the events of the 2008 Wenchuan earthquake, with a magnitude of 7.9, and the 2013 Lushan earthquake, with a magnitude of 6.6, underscored that even with a relatively sluggish slip rate, the potential for catastrophic earthquakes remains.
Zhang [92] highlighted that our false sense of security concerning seismic hazard in the Longmen Shan before the Wenchuan Earthquake stemmed from the lengthy intervals between major earthquakes and the steep configuration of the local thrust faults. In such circumstances, the limited records of geodetic data and seismograms fell short of providing a comprehensive understanding of the seismic features within the Longmen Shan area. Additionally, the seismotectonic activity along the faults in the Longmen Shan was devoid of well-constrained information due to the accelerated rate of erosion, steep relief, and lack of Quaternary sediment. Given the consistent dip-slip of faults observed in the upper crust along the Longmen Shan [85,86,87] (Figure 5j–l), channel topography has the potential to serve as a valuable indicator of tectonic activity over long time scales, ranging from thousands to millions of years [4,17,18,19] (Figure 4, Figure 5 and Figure 6). The effectiveness of this approach is corroborated by the spatial agreement between notable disparities in channel steepness along the Yingxiu and Pengguan faults and the coseismic surface rupture of the Wenchuan Earthquake (Figure 5 and Figure 6).
In southern segments of the Longmen Shan, there exists a seismic gap spanning approximately 50 km between the active segments of the fault associated with the Wenchuan and Lushan earthquakes (Figure 2 and Figure 6). Geoscientists are engaged in a debate regarding whether this gap holds the potential for generating a substantial earthquake in the future [47,93]. Paleoseismic studies have indicated that the Dachuan fault, which constitutes the seismogenic fault within this seismic gap, demonstrates traits of segmented rupturing, thereby indicating relatively weak fault activity [47,94]. However, the historical record of earthquakes with a magnitude equal to or exceeding 3.0 prior to 2022 in this region is sparse, implying an environment where stress accumulates (Figure 2 and Figure 5j). Furthermore, our study also reveals significant thrust movement across the Dachuan fault (Figure 5a,d and Figure 6), indicating that this fault holds the potential for generating substantial earthquakes. Certain seismological investigations have suggested that the observed low shear velocity and elevated Poisson’s ratio within the seismic gap might stem from fluid-bearing ductile flow, potentially inhibiting the accumulation of significant crustal stress [95]. However, Lei et al. [96] argue that the high Poisson ratio could also be indicative of an environment prone to stress accumulation, thereby increasing the potential for seismic risk. Notwithstanding these debates, it is prudent to exercise caution when evaluating the seismic risk along the Dachuan fault, given the marked deformation spanning millions to thousands of years (Figure 5a,d and Figure 6). Furthermore, the estimated changes in Coulomb failure stress resulting from the 2008 Wenchuan and 2013 Lushan earthquakes imply that the seismic gap may be susceptible to an imminent earthquake owing to the heightened stress levels [93].
Despite the joint rupture of the Beichuan and Yingxiu faults during the Wenchuan earthquake [29,30], it is possible that they belong to separate fault systems. Low-temperature thermochronology and channel steepness analyses reveal that the Beichuan fault lacks thrust movement (Figure 5c,f and Figure 6). This observation aligns with the transition from predominantly vertical slip along the Yingxiu fault to a greater lateral component of displacement along the Beichuan fault during the Wenchuan earthquake [29,30]. The low uplift rate and steep dip of the Beichuan fault [86] (Figure 5l) indicate that it undergoes a relatively low rate of shortening and poses a low seismic risk. In contrast, the historical seismicity catalog documents a series of significant earthquakes along the Huya fault in recent decades (Figure 2), including the 1976 Songpan earthquake sequence (comprising of three mainshocks with magnitudes of 7.2, 6.7, and 7.2) [97] and the Jiuzhaigou earthquake with a magnitude of 7.0 [98]. This observation implies that the Huya fault might currently serve as the active boundary of the Bayan Har Block [54]. Furthermore, low-temperature thermochronology and channel steepness analyses also indicate similar slip rates between the Huya fault and the Yingxiu fault, implying a comparable potential for significant earthquake hazards (Figure 5c,f). Therefore, the faults in the northern Longmen Shan are less inclined to generate substantial earthquakes due to the impedance stemming from the uplift of the Minshan Range [56,89].

5.3. Implications for Tectonics and Topographic Evolution in East Tibet

The observed variations in fault activity prompt us to reconsider the relationship between these structures in different segments of the Longmen Shan. In contrast to the conventional classification of the back mountain, central, and range-front fault belts [36,58], we posit an alternative perspective wherein the Wulong fault may connect to the Wenchuan fault, and the Dachuan fault represents the southern extension of the Yingxiu fault [33,41]. Several lines of evidence support this hypothesis. Firstly, it is evident that the Genda fault has remained inactive for millions of years, indicating a distinct tectonic environment compared to the Wenchuan fault. Secondly, the Wulong fault displays a deformation history akin to that of the Wenchuan fault. Both faults have undergone substantial uplifts over millions of years and become quiescent since the late Pleistocene (Figure 5). Thirdly, the sustained vertical motion seen across the Dachuan and Yingxiu faults over extensive periods hints at a closer interconnection between these two faults. Petrological investigations further unveil that the Yingxiu and Dachuan faults demarcate low-grade metamorphic metasedimentary units to the west from non-metamorphic units to the east, thereby lending additional weight to the notion that these two faults might possess structural equivalency [99].
The meticulous analysis of temporal deformation across these faults provides deeper insights into the variation in tectonics and topographic evolution along the Longmen Shan. The faults within the central and southern Longmen Shan have exhibited significant thrust activity over geological timescales, potentially contributing to the persistence of the steep topographical features observable in these regions (Figure 1 and Figure 5). In contrast, the smoother topography and lower channel steepness observed in the northern Longmen Shan can be attributed to the relatively lesser cumulative displacement within its fault system (Figure 1 and Figure 5). Previous research has indicated that the northern Longmen Shan is primarily influenced by the uplift of the Minshan Range [36]. Our study also identifies a zone of high exhumation and channel steepness in the hanging wall of the Huya fault (Figure 4 and Figure 5c,f), which supports the notion that upper crust deformation associated with the plateau margin is concentrated along the Minshan Range.
One of the most notable features of the Longmen Shan range is the existence of a high and steep topographic gradient that has no correlation with a significant crustal shortening rate, characterized by a modest rate of <3 mm/yr [25,90,91]. The hypothesis of lower crustal “channel flow” posits that the flow of weaker crustal material from the interior of the Tibetan Plateau has encountered resistance from the robust and craton-like crust/lithosphere of the Sichuan Basin. This interaction results in the upward swelling of the lower crust and the elevation of the Longmen Shan range, all without necessitating extensive shortening of the upper crust [100,101,102,103]. Nevertheless, our investigation uncovers robust thrusting activities within the upper crust of the Longmen Shan, spanning millions of years, especially in the central and southern segments (Figure 5 and Figure 6). These findings align with outcomes obtained from balanced geologic cross-sections [31,34], which suggests that the deformation of the upper crust plays a vital role in the topographic building of the eastern Tibetan Plateau margin [21,23,31,78].
Our findings demonstrate that the high uplift zone in the southern Longmen Shan is situated in the hanging wall of the Dachuan fault (Figure 5a,d and Figure 6), although it is worth noting that some deformation has extended into the Sichuan Basin [28,35]. In comparison, the central Longmen Shan exhibits two distinct high uplift zones [21] (Figure 5b), with recent uplift primarily concentrated within the hanging walls of the Pengguan and Yingxiu faults (Figure 5e). This variance in uplift patterns along the Longmen Shan, extending from the southern to central portions, contradicts the lower crustal “channel flow” model, which anticipates an extensively spread, uninterrupted deformation across the surface [100,101] or a narrow uplift zone bounded by frontal thrusting and hinterland extension architecture [37,104].

6. Conclusions

Our study provides compelling evidence that channel steepness serves as a valuable indicator for assessing thrust deformation of faults within thousands to millions of years. This becomes particularly valuable when evaluating the vertical motion and activity of faults that lack constraints from Quaternary strata. By combining the channel steepness analysis with low-temperature thermochronology and paleoseismic studies, we have achieved a more intricate deformation pattern across different segments of the Longmen Shan thrust fault belt.
In the southern Longmen Shan, the fault system in the frontal range has undergone a transformation from joint activity involving the Wulong and Dachuan faults spanning millions of years to the current dominance of the Dachuan fault. In the central segment, the activity over millions of years has primarily centered around the Wenchuan and Yingxiu faults, while the activity since the Pleistocene has been dominated by the Yingxiu and Pengguan faults. Comparatively, the thrust activity in the northern segment is relatively weak. The Qingchuan fault experienced a modest uplift a few million years ago, and both the Qingchuan and Beichuan faults have primarily exhibited strike-slip motion since the Pleistocene. Our results indicate that the Dachuan and Huya faults have comparable robust deformation to the Yingxiu fault during the Quaternary, implying their potential to generate significant earthquakes. Consequently, delving into the paleoseismic history of the Dachuan and Huya faults should be prioritized in future research endeavors.

Author Contributions

Conceptualization, W.W. (Wei Wang); methodology, W.W. (Wei Wang) and J.Z.; formal analysis, W.W. (Wei Wang) and Y.S.; investigation, W.W. (Wei Wang); writing—original draft preparation, W.W. (Wei Wang); writing—review and editing, W.W. (Wei Wang), Y.S., J.Z., W.W. (Wenxin Wang), and R.L.; funding acquisition, W.W. (Wei Wang) and Y.S. All authors have read and agreed to the published version of the manuscript.

Funding

This work was supported by the National Natural Science Foundation of China (41902215, 42272242) and the National Nonprofit Fundamental Research Grant of China, Institute of Geology, China Earthquake Administration (Grant No. IGCEA2112).

Data Availability Statement

Not applicable.

Acknowledgments

We are grateful to the China Earthquake Networks Center, National Earthquake Data Center for providing the seismic data, the NSAS science team for providing the DEM data, and the WorldClim team for providing the precipitation data. The authors also thank the editor and two anonymous reviewers for constructive comments and suggestions that improved the quality of this paper.

Conflicts of Interest

The authors declare no conflict of interest.

References

  1. Avouac, J.P. Mountain building, erosion, and the seismic cycle in the Nepal Himalaya. Adv. Geophys. 2003, 46, 1–80. [Google Scholar] [CrossRef]
  2. Willett, S.D.; Brandon, M.T. On steady states in mountain belts. Geology 2002, 30, 175–178. [Google Scholar] [CrossRef]
  3. Kirby, E.; Whipple, K. Quantifying differential rock-uplift rates via stream profile analysis. Geology 2001, 29, 415–418. [Google Scholar] [CrossRef]
  4. Kirby, E.; Whipple, K.X. Expression of active tectonics in erosional landscapes. J. Struct. Geol. 2012, 44, 54–75. [Google Scholar] [CrossRef]
  5. Ahnert, F. Functional relationships between denudation, relief, and uplift in large, mid-latitude drainage basins. Am. J. Sci. 1970, 268, 243–263. [Google Scholar] [CrossRef]
  6. Montgomery, D.R.; Brandon, M.T. Topographic controls on erosion rates in tectonically active mountain ranges. Earth Planet. Sci. Lett. 2002, 201, 481–489. [Google Scholar] [CrossRef]
  7. Liu-Zeng, J.; Tapponnier, P.; Gaudemer, Y.; Ding, L. Quantifying landscape differences across the Tibetan plateau: Implications for topographic relief evolution. J. Geophys. Res. 2008, 113, F04018. [Google Scholar] [CrossRef]
  8. Bello, S.; Lavecchia, G.; Andrenacci, C.; Ercoli, M.; Cirillo, D.; Carboni, F.; Barchi, M.R.; Brozzetti, F. Complex trans-ridge normal faults controlling large earthquakes. Sci. Rep. 2022, 12, 10676. [Google Scholar] [CrossRef]
  9. Bello, S.; Andrenacci, C.; Cirillo, D.; Scott, C.P.; Brozzetti, F.; Arrowsmith, J.R.; Lavecchia, G.; Ao, S. High-detail fault segmentation: Deep insight into the anatomy of the 1983 Borah Peak earthquake rupture zone (Mw 6.9, Idaho, USA). Lithosphere 2022, 1, 8100224. [Google Scholar] [CrossRef]
  10. Johnson, K.; Nissen, E.; Saripalli, S.; Arrowsmith, J.R.; McGarey, P.; Scharer, K.; Williams, P.; Blisniuk, K. Rapid mapping of ultrafine fault zone topography with structure from motion. Geosphere 2014, 10, 969–986. [Google Scholar] [CrossRef]
  11. Zhang, J.; Yang, H.; Liu-Zeng, J.; Ge, Y.; Wang, W.; Yao, W.; Xu, S. Reconstructing the incision of the Lancang River (Upper Mekong) in southeastern Tibet below its prominent knickzone using fluvial terraces and transient tributary profiles. Geomorphology 2020, 376, 107551. [Google Scholar] [CrossRef]
  12. Goren, L.; Fox, M.; Willett, S.D. Tectonics from fluvial topography using formal linear inversion: Theory and applications to the Inyo Mountains, California. J. Geophys. Res. Earth Surf. 2014, 119, 1651–1681. [Google Scholar] [CrossRef]
  13. Snyder, N.P.; Whipple, K.X.; Tucker, G.E.; Merritts, D.J. Landscape response to tectonic forcing: Digital elevation model analysis of stream profiles in the Mendocino triple junction region, northern California. Geol. Soc. Am. Bull. 2000, 112, 1250–1263. [Google Scholar] [CrossRef]
  14. Pritchard, D.; Roberts, G.; White, N.; Richardson, C. Uplift histories from river profiles. Geophys. Res. Lett. 2009, 36, L24301. [Google Scholar] [CrossRef]
  15. Kirby, E.; Whipple, K.X.; Tang, W.; Chen, Z. Distribution of active rock uplift along the eastern margin of the Tibetan Plateau: Inferences from bedrock channel longitudinal profiles. J. Geophys. Res. 2003, 108, 2217. [Google Scholar] [CrossRef]
  16. Wobus, C.; Whipple, K.X.; Kirby, E.; Snyder, N.; Johnson, J.; Spyropolou, K.; Crosby, B.; Sheehan, D. Tectonics from topography: Procedures, promise, and pitfalls. Geol. Soc. Am. Spec. Pap. 2006, 398, 55–74. [Google Scholar]
  17. Nennewitz, M.; Thiede, R.C.; Bookhagen, B. Fault activity, tectonic segmentation, and deformation pattern of the western Himalaya on Ma timescales inferred from landscape morphology. Lithosphere 2018, 10, 632–640. [Google Scholar] [CrossRef]
  18. Baldwin, J.A.; Whipple, K.X.; Tucker, G.E. Implications of the shear stress river incision model for the timescale of postorogenic decay of topography. J. Geophys. Res. Solid Earth 2003, 108, 2158. [Google Scholar] [CrossRef]
  19. Aron, F.; Johnstone, S.A.; Mavrommatis, A.; Sare, R.; Maerten, F.; Loveless, J.P.; Baden, C.W.; Hilley, G.E. Mountain rivers reveal the earthquake hazard of geologic faults in Silicon Valley. Geophys. Res. Lett. 2022, 49, e2022GL099220. [Google Scholar] [CrossRef]
  20. Rimando, J.M.; Schoenbohm, L.M. Regional relative tectonic activity of structures in the Pampean flat slab segment of Argentina from 30 to 32°S. Geomorphology 2020, 350, 106908. [Google Scholar] [CrossRef]
  21. Wang, W.; Godard, V.; Liu-Zeng, J.; Zhang, J.; Li, Z.; Xu, S.; Yao, W.; Yuan, Z.; Aumaître, G.; Bourlès, D.L. Tectonic controls on surface erosion rates in the Longmen Shan, Eastern Tibet. Tectonics 2021, 40, e2020TC006445. [Google Scholar] [CrossRef]
  22. Godard, V.; Cattin, R.; Lavé, J. Erosional control on the dynamics of low-convergence rate continental plateau margins. Geophys. J. Int 2009, 179, 763–777. [Google Scholar] [CrossRef]
  23. Liu-Zeng, J.; Wen, L.; Oskin, M.; Zeng, L. Focused modern denudation of the Longmen Shan margin, eastern Tibetan Plateau. Geochem. Geophys. Geosystems 2011, 12, Q11007. [Google Scholar] [CrossRef]
  24. Xu, X.; Han, Z.; Yang, X.; Zhang, S.; Yu, G.; Zhou, B.; Li, F.; Ma, B.; Chen, G.; Ran, Y. Seismic Structure Map of China and Its Adjacent Areas; Seismological Press (in Chinese): Beijing, China, 2016. [Google Scholar]
  25. Wang, M.; Shen, Z.-K. Present-Day Crustal Deformation of Continental China Derived From GPS and Its Tectonic Implications. J. Geophys. Res. Solid Earth 2020, 125, e2019JB018774. [Google Scholar] [CrossRef]
  26. Jin, W.; Tang, L.; Yang, K.; Wan, G.; Lü, Z. Segmentation of the Longmen Mountains thrust belt, Western Sichuan Foreland Basin, SW China. Tectonophysics 2010, 485, 107–121. [Google Scholar] [CrossRef]
  27. Zhang, H.; Zhang, P.; Kirby, E.; Yin, J.; Liu, C.; Yu, G. Along-strike topographic variation of the Longmen Shan and its significance for landscape evolution along the eastern Tibetan Plateau. J. Asian Earth Sci. 2011, 40, 855–864. [Google Scholar] [CrossRef]
  28. Jia, D.; Li, Y.; Yan, B.; Li, Z.; Wang, M.; Chen, Z.; Zhang, Y. The Cenozoic thrusting sequence of the Longmen Shan fold-and-thrust belt, Eastern margin of the Tibetan plateau: Insights from low-temperature thermochronology. J. Asian Earth Sci. 2020, 198, 104381. [Google Scholar] [CrossRef]
  29. Xu, X.; Wen, X.; Yu, G.; Chen, G.; Klinger, Y.; Hubbard, J.; Shaw, J. Coseismic reverse-and oblique-slip surface faulting generated by the 2008 Mw 7.9 Wenchuan earthquake, China. Geology 2009, 37, 515–518. [Google Scholar] [CrossRef]
  30. Liu-Zeng, J.; Zhang, Z.; Wen, L.; Tapponnier, P.; Sun, J.; Xing, X.; Hu, G.; Xu, Q.; Zeng, L.; Ding, L. Co-seismic ruptures of the 12 May 2008,Ms 8.0 Wenchuan earthquake, Sichuan: East–west crustal shortening on oblique, parallel thrusts along the eastern edge of Tibet. Earth Planet. Sci. Lett. 2009, 286, 355–370. [Google Scholar] [CrossRef]
  31. Hubbard, J.; Shaw, J.H.; Klinger, Y. Structural setting of the 2008 Mw 7.9 Wenchuan, China, earthquake. Bull. Seismol. Soc. Am. 2010, 100, 2713–2735. [Google Scholar] [CrossRef]
  32. Lu, R.; He, D.; John, S.; Ma, Y.; Liu, B.; Chen, Y. Along-strike variation of the frontal zone structural geometry of the Central Longmen Shan thrust belt revealed by seismic reflection profiles. Tectonophysics 2012, 580, 178–191. [Google Scholar] [CrossRef]
  33. Gao, M.; Zeilinger, G.; Xu, X.; Tan, X.; Wang, Q.; Hao, M. Active tectonics evaluation from geomorphic indices for the central and the southern Longmenshan range on the Eastern Tibetan Plateau, China. Tectonics 2016, 35, 1812–1826. [Google Scholar] [CrossRef]
  34. Hubbard, J.; Shaw, J.H. Uplift of the Longmen Shan and Tibetan plateau, and the 2008 Wenchuan (M = 7.9) earthquake. Nature 2009, 458, 194–197. [Google Scholar] [CrossRef] [PubMed]
  35. Burchfiel, B.; Zhiliang, C.; Yupinc, L.; Royden, L. Tectonics of the Longmen Shan and adjacent regions, central China. Int. Geol. Rev. 1995, 37, 661–735. [Google Scholar] [CrossRef]
  36. Deng, Q.; Chen, S.; Zhao, X. Tectonics, seismicity and dynamics of Longmenshan Mountains and its adjacent regions. Seismol. Geol. 1994, 16, 389–403. [Google Scholar]
  37. Burchfiel, B.; Royden, L.; van der Hilst, R.; Hager, B.; Chen, Z.; King, R.; Li, C.; Lü, J.; Yao, H.; Kirby, E. A geological and geophysical context for the Wenchuan earthquake of 12 May 2008, Sichuan, People’s Republic of China. GSA Today 2008, 18, 4–11. [Google Scholar] [CrossRef]
  38. Arne, D.; Worley, B.; Wilson, C.; Chen, S.F.; Foster, D.; Luo, Z.L.; Liu, S.G.; Dirks, P. Differential exhumation in response to episodic thrusting along the eastern margin of the Tibetan Plateau. Tectonophysics 1997, 280, 239–256. [Google Scholar] [CrossRef]
  39. Kirby, E.; Reiners, P.W.; Krol, M.A.; Whipple, K.X.; Hodges, K.V.; Farley, K.A.; Tang, W.; Chen, Z. Late Cenozoic evolution of the eastern margin of the Tibetan Plateau: Inferences from 40Ar/39Ar and (U-Th)/He thermochronology. Tectonics 2002, 21, 1. [Google Scholar] [CrossRef]
  40. Godard, V.; Pik, R.; Lavé, J.; Cattin, R.; Tibari, B.; De Sigoyer, J.; Pubellier, M.; Zhu, J. Late Cenozoic evolution of the central Longmen Shan, eastern Tibet: Insight from (U-Th)/He thermochronometry. Tectonics 2009, 28, TC5009. [Google Scholar] [CrossRef]
  41. Cook, K.; Royden, L.; Burchfiel, B.; Lee, Y.-H.; Tan, X. Constraints on Cenozoic tectonics in the southwestern Longmen Shan from low-temperature thermochronology. Lithosphere 2013, 5, 393–406. [Google Scholar] [CrossRef]
  42. Wang, E.; Kirby, E.; Furlong, K.P.; van Soest, M.; Xu, G.; Shi, X.; Kamp, P.J.; Hodges, K. Two-phase growth of high topography in eastern Tibet during the Cenozoic. Nat. Geosci. 2012, 5, 640–645. [Google Scholar] [CrossRef]
  43. Furlong, K.P.; Kirby, E. Exploiting Thermochronology to Quantify Exhumation Histories and Patterns of Uplift Along the Margins of Tibet. Front. Earth Sci. 2021, 9, 469. [Google Scholar] [CrossRef]
  44. Ran, Y.; Chen, L.; Chen, J.; Wang, H.; Chen, G.; Yin, J.; Shi, X.; Li, C.; Xu, X. Paleoseismic evidence and repeat time of large earthquakes at three sites along the Longmenshan fault zone. Tectonophysics 2010, 491, 141–153. [Google Scholar] [CrossRef]
  45. Xu, X.; Wen, X.; Han, Z. Lushan Ms 7.0 earthquake: A blind reserve-fault event. Chin. Sci. Bull. 2013, 58, 3437–3443. [Google Scholar] [CrossRef]
  46. Yang, X.; Jiang, P.; Song, F.; Liang, X.; Chen, X.; Deng, Z. The evidence of the south Longmenshan fault zones cutting late Quaternary stratum. Seismol. Geol. 1999, 21, 341–345. (In Chinese) [Google Scholar]
  47. Wang, H.; Chen, L.; Ran, Y.; Lei, S.; Li, X. Paleoseismic investigation of the seismic gap between the seismogenic structures of the 2008 Wenchuan and 2013 Lushan earthquakes along the Longmen Shan fault zone at the eastern margin of the Tibetan Plateau. Lithosphere 2015, 7, 14–20. [Google Scholar] [CrossRef]
  48. Dong, S.-p.; Han, Z.-j.; An, Y.-f. Paleoseismological events in the “seismic gap” between the 2008 Wenchuan and the 2013 Lushan earthquakes and implications for future seismic potential. J. Asian Earth Sci. 2017, 135, 1–15. [Google Scholar] [CrossRef]
  49. Wang, X. Analysis of the late Quaternary activity along the Maowen-Wenchuan fault-middle part of the Back-range fault at the Longmenshan fault zone. Master’s Thesis, Institute of Geology, Affiliated to China Earthquake Administration, Beijing, China, 2016. (In Chinese with English abstract). [Google Scholar]
  50. Ma, B.-Q.; Su, G.; Hou, Z.-H.; Shu, S.-b. Late Quaternary slip rate in the central part of the Longmenshan fault zone from terrace deformation along the Minjiang River. Seismol. Geol. 2005, 27, 234–242. (In Chinese) [Google Scholar]
  51. Densmore, A.L.; Ellis, M.A.; Li, Y.; Zhou, R.; Hancock, G.S.; Richardson, N. Active tectonics of the Beichuan and Pengguan faults at the eastern margin of the Tibetan Plateau. Tectonics 2007, 26, TC4005. [Google Scholar] [CrossRef]
  52. Zhou, R.J.; Li, Y.; DENSMORE, A.L.; ELLIS, M.A.; He, Y.L.; Li, Y.Z.; Li, Y.G. Active Tectonics of the Longmen Shan Region on the Eastern Margin of the Tibetan Plateau. Acta Geol. Sin. (Engl. Ed.) 2007, 81, 593–604. [Google Scholar]
  53. Ran, Y.; Chen, W.; Xu, X.; Chen, L.; Wang, H.; Li, Y. Late Quaternary paleoseismic behavior and rupture segmentation of the Yingxiu-Beichuan fault along the Longmen Shan fault zone, China. Tectonics 2014, 33, 2218–2232. [Google Scholar] [CrossRef]
  54. Chen, S.F.; Wilson, C.J.L.; Deng, Q.D.; Zhao, X.L.; Luo, Z.L. Active faulting and block movement associated with large earthquakes in the Min Shan and Longmen Mountains, northeastern Tibetan Plateau. J. Geophys. Res. 1994, 99, 24025–24038. [Google Scholar] [CrossRef]
  55. Sun, H.; He, H.; Ikeda, Y.; Kano, K.i.; Shi, F.; Gao, W.; Echigo, T.; Okada, S. Holocene paleoearthquake history on the Qingchuan fault in the northeastern segment of the Longmenshan Thrust Zone and its implications. Tectonophysics 2015, 660, 92–106. [Google Scholar] [CrossRef]
  56. Liang, M.; Ran, Y.; Wang, H.; Li, Y.; Gao, S. A Possible Tectonic Response Between the Qingchuan Fault and the Beichuan-Yingxiu Fault of the Longmen Shan Fault Zone? Evidence From Geologic Observations by Paleoseismic Trenching and Radiocarbon Dating. Tectonics 2018, 37, 4086–4096. [Google Scholar] [CrossRef]
  57. Chen, G.; Ji, F.; Zhou, R.; Xu, J.; Zhou, B.; Li, X.; Ye, Y. Primary Research of Activity Segmentation of Longmenshan Fault Zone Since Late-Quaternary. Seismol. Geol. 2007, 29, 657–673. (In Chinese) [Google Scholar]
  58. Zhang, P.-Z. A review on active tectonics and deep crustal processes of the Western Sichuan region, eastern margin of the Tibetan Plateau. Tectonophysics 2013, 584, 7–22. [Google Scholar] [CrossRef]
  59. Boulton, S.J.; Stokes, M. Which DEM is best for analyzing fluvial landscape development in mountainous terrains? Geomorphology 2018, 310, 168–187. [Google Scholar] [CrossRef]
  60. Fick, S.E.; Hijmans, R.J. WorldClim 2: New 1-km spatial resolution climate surfaces for global land areas. Int. J. Climatol. 2017, 37, 4302–4315. [Google Scholar] [CrossRef]
  61. Flint, J.J. Stream gradient as a function of order, magnitude, and discharge. Water Resour. Res. 1974, 10, 969–973. [Google Scholar] [CrossRef]
  62. Whipple, K.X.; Tucker, G.E. Dynamics of the stream-power river incision model: Implications for height limits of mountain ranges, landscape response timescales, and research needs. J. Geophys. Res. Solid Earth 1999, 104, 17661–17674. [Google Scholar] [CrossRef]
  63. Royden, L.; Clark, M.; Whipple, K. Evolution of river elevation profiles by bedrock incision: Analytical solutions for transient river profiles related to changing uplift and precipitation rates. Eos Trans. AGU 2000, 81, 48. [Google Scholar]
  64. Perron, J.T.; Royden, L. An integral approach to bedrock river profile analysis. Earth Surf. Process. Landf. 2013, 38, 570–576. [Google Scholar] [CrossRef]
  65. Leonard, J.S.; Whipple, K.X.; Heimsath, A.M. Isolating climatic, tectonic, and lithologic controls on mountain landscape evolution. Sci. Adv. 2023, 9, eadd8915. [Google Scholar] [CrossRef] [PubMed]
  66. Adams, B.; Whipple, K.; Forte, A.; Heimsath, A.; Hodges, K. Climate controls on erosion in tectonically active landscapes. Sci. Adv. 2020, 6, eaaz3166. [Google Scholar] [CrossRef]
  67. Gallen, S.F.; Wegmann, K.W. River profile response to normal fault growth and linkage: An example from the Hellenic forearc of south-central Crete, Greece. Earth Surf. Dyn. 2017, 5, 161. [Google Scholar] [CrossRef]
  68. Schwanghart, W.; Scherler, D. Short Communication: TopoToolbox 2—MATLAB-based software for topographic analysis and modeling in Earth surface sciences. Earth Surf. Dyn. 2014, 2, 1–7. [Google Scholar] [CrossRef]
  69. Ansberque, C.; Godard, V.; Olivetti, V.; Bellier, O.; Sigoyer, J.; Bernet, M.; Stübner, K.; Tan, X.; Xu, X.; Ehlers, T.A. Differential Exhumation Across the Longriba Fault System: Implications for the Eastern Tibetan Plateau. Tectonics 2018, 37, 663–679. [Google Scholar] [CrossRef]
  70. Jolivet, M.; Roger, F.; Xu, Z.; Paquette, J.-L.; Cao, H. Mesozoic–Cenozoic evolution of the Danba dome (Songpan Garzê, East Tibet) as inferred from LA-ICPMS U–Pb and fission-track data. J. Asian Earth Sci. 2015, 102, 180–204. [Google Scholar] [CrossRef]
  71. Richardson, N.J.; Densmore, A.L.; Seward, D.; Fowler, A.; Wipf, M.; Ellis, M.A.; Yong, L.; Zhang, Y. Extraordinary denudation in the Sichuan Basin: Insights from low-temperature thermochronology adjacent to the eastern margin of the Tibetan Plateau. J. Geophys. Res.-Solid Earth 2008, 113, B04409. [Google Scholar] [CrossRef]
  72. Xu, G.; Kamp, P.J.J. Tectonics and denudation adjacent to the Xianshuihe Fault, eastern Tibetan Plateau: Constraints from fission track thermochronology. J. Geophys. Res. Atmos. 2000, 105, 19231–19252. [Google Scholar] [CrossRef]
  73. Wilson, C.J.; Fowler, A.P. Denudational response to surface uplift in east Tibet: Evidence from apatite fission-track thermochronology. Geol. Soc. Am. Bull. 2011, 123, 1966–1987. [Google Scholar] [CrossRef]
  74. Tan, X.-B.; Lee, Y.-H.; Chen, W.-Y.; Cook, K.L.; Xu, X.-W. Exhumation history and faulting activity of the southern segment of the Longmen Shan, eastern Tibet. J. Asian Earth Sci. 2014, 81, 91–104. [Google Scholar] [CrossRef]
  75. Tan, X.-B.; Lee, Y.-H.; Xu, X.-W.; Cook, K.L. Cenozoic exhumation of the Danba antiform, eastern Tibet: Evidence from low-temperature thermochronology. Lithosphere 2017, 9, 534–544. [Google Scholar] [CrossRef]
  76. Tan, X.-B.; Xu, X.-W.; Lee, Y.-H.; Lu, R.-Q.; LIu, Y.; Xu, C.; Li, K.; Yu, G.-H.; Kang, W.-J. Late Cenozoic thrusting of major faults along the central segment of Longmen Shan, eastern Tibet: Evidence from low-temperature thermochronology. Tectonophysics 2017, 712–713, 145–155. [Google Scholar] [CrossRef]
  77. Tan, X.; Liu, Y.; Lee, Y.-H.; Lu, R.; Xu, X.; Suppe, J.; Shi, F.; Xu, C. Parallelism between the maximum exhumation belt and the Moho ramp along the eastern Tibetan Plateau margin: Coincidence or consequence? Earth Planet. Sci. Lett. 2019, 507, 73–84. [Google Scholar] [CrossRef]
  78. Tian, Y.; Kohn, B.P.; Gleadow, A.J.W.; Hu, S. Constructing the Longmen Shan eastern Tibetan Plateau margin: Insights from low-temperature thermochronology. Tectonics 2013, 32, 576–592. [Google Scholar] [CrossRef]
  79. Tian, Y.; Li, R.; Tang, Y.; Xu, X.; Wang, Y.; Zhang, P. Thermochronological Constraints on the Late Cenozoic Morphotectonic Evolution of the Min Shan, the Eastern Margin of the Tibetan Plateau. Tectonics 2018, 37, 1733–1749. [Google Scholar] [CrossRef]
  80. Tian, Y.; Liu, Y.; Li, R.; Sun, X.; Zhang, Z.; Carter, A.; Vermeesch, P. Thermochronological constraints on Eocene deformation regime in the Long-Men Shan: Implications for the eastward growth of the Tibetan Plateau. Glob. Planet. Chang. 2022, 217, 103930. [Google Scholar] [CrossRef]
  81. Yang, Z.; Shen, C.; Ratschbacher, L.; Enkelmann, E.; Jonckheere, R.; Wauschkuhn, B.; Dong, Y. Sichuan Basin and beyond: Eastward foreland growth of the Tibetan Plateau from an integration of Late Cretaceous-Cenozoic fission track and (U-Th)/He ages of the eastern Tibetan Plateau, Qinling, and Daba Shan. J. Geophys. Res. Solid Earth 2017, 122, 4712–4740. [Google Scholar] [CrossRef]
  82. Shen, X.; Tian, Y.; Zhang, G.; Zhang, S.; Carter, A.; Kohn, B.; Vermeesch, P.; Liu, R.; Li, W. Late Miocene hinterland crustal shortening in the Longmen Shan thrust belt, the eastern margin of the Tibetan Plateau. J. Geophys. Res. Solid Earth 2019, 124, 11972–11991. [Google Scholar] [CrossRef]
  83. van der Beek, P.; Schildgen, T.F. Short Communication: age2exhume—A Matlab/Python script to calculate steady-state vertical exhumation rates from thermochronologic ages and application to the Himalaya. Geochronology 2023, 5, 35–49. [Google Scholar] [CrossRef]
  84. Willett, S.D.; Brandon, M.T. Some analytical methods for converting thermochronometric age to erosion rate. Geochem. Geophys. Geosystems 2013, 14, 209–222. [Google Scholar] [CrossRef]
  85. Jia, D.; Li, Y.; Lin, A.; Wang, M.; Chen, W.; Wu, X.; Ren, Z.; Zhao, Y.; Luo, L. Structural model of 2008 Mw7.9 Wenchuan earthquake in the rejuvenated Longmen Shan thrust belt, China. Tectonophysics 2010, 491, 174–184. [Google Scholar] [CrossRef]
  86. Li, Y.; Lu, R.; He, D.; Wang, X.; Liu, Y.; Xu, X.; Tan, X.; Cai, M. Transformation of coseismic faults in the northern Longmenshan tectonic belt, eastern Tibetan Plateau: Implications for potential earthquakes and seismic risks. J. Asian Earth Sci. 2019, 177, 66–75. [Google Scholar] [CrossRef]
  87. Lu, R.; Xu, X.; He, D.; John, S.; Liu, B.; Wang, F.; Tan, X.; Li, Y. Seismotectonics of the 2013 Lushan Mw 6.7 earthquake: Inversion tectonics in the eastern margin of the Tibetan Plateau. Geophys. Res. Lett. 2017, 44, 8236–8243. [Google Scholar] [CrossRef]
  88. Chen, L.C.; Ran, Y.K.; Wang, H.; Li, Y.B.; Ma, X.Q. The Lushan M S 7.0 earthquake and activity of the southern segment of the Longmenshan fault zone. Sci. Bull. 2013, 58, 3475–3482. [Google Scholar] [CrossRef]
  89. Li, C.Y.; Song, F.M.; Ran, Y.K. Late Quaternary activity and age constraint of the northern Longmen Shan Fault zone. Seismol. Geol. 2004, 26, 248–258. (In Chinese) [Google Scholar]
  90. Zhang, P.Z.; Shen, Z.; Wang, M.; Gan, W.; Bürgmann, R.; Molnar, P.; Wang, Q.; Niu, Z.; Sun, J.; Wu, J. Continuous deformation of the Tibetan Plateau from global positioning system data. Geology 2004, 32, 809–812. [Google Scholar] [CrossRef]
  91. Gan, W.; Zhang, P.; Shen, Z.-K.; Niu, Z.; Wang, M.; Wan, Y.; Zhou, D.; Cheng, J. Present-day crustal motion within the Tibetan Plateau inferred from GPS measurements. J. Geophys. Res. 2007, 112, B08416. [Google Scholar] [CrossRef]
  92. Zhang, P.-Z. Beware of slowly slipping faults. Nat. Geosci. 2013, 6, 323–324. [Google Scholar] [CrossRef]
  93. Liu, C.; Zhu, B.; Shi, Y. Do the Two Seismic Gaps in the Southwestern Section of the Longmen Shan Fault Present the Same Seismic Hazard? J. Geophys. Res. Solid Earth 2020, 125, e2019JB018160. [Google Scholar] [CrossRef]
  94. Chen, L.; Wang, H.; Ran, Y.; Lei, S.; Li, X.; Wu, F.; Ma, X.; Liu, C.; Han, F. The 2013 Lushan M S 7.0 earthquake: Varied seismogenic structure from the 2008 Wenchuan earthquake. Seismol. Res. Lett. 2014, 85, 34–39. [Google Scholar]
  95. Wang, Z.; Su, J.; Liu, C.; Cai, X. New insights into the generation of the 2013 Lushan earthquake (Ms 7.0), China. J. Geophys. Res. Solid Earth 2015, 120, 3507–3526. [Google Scholar] [CrossRef]
  96. Lei, J.; Zhang, G.; Xie, F. The 20 April 2013 Lushan, Sichuan, mainshock, and its aftershock sequence: Tectonic implications. Earthq. Sci. 2014, 27, 15–25. [Google Scholar] [CrossRef]
  97. Jones, L.M.; Han, W.; Hauksson, E.; Jin, A.; Zhang, Y.; Luo, Z. Focal mechanisms and aftershock locations of the Songpan earthquakes of August 1976 in Sichuan, China. J. Geophys. Res. Solid Earth 1984, 89, 7697–7707. [Google Scholar] [CrossRef]
  98. Xu, X.-W.; Chen, G.-H.; Wang, Q.-X.; Chen, L.-C.; Ren, Z.-K.; Xu, C.; Wei, Z.-Y.; Lu, R.-Q.; Tan, X.-B.; Dong, S.-P. Discussion on seismogenic structure of Jiuzhaigou earthquake and its implication for current strain state in the southeastern Qinghai-Tibet Plateau. Chin. J. Geophys. 2017, 60, 4018–4026. [Google Scholar]
  99. Airaghi, L.; de Sigoyer, J.; Guillot, S.; Robert, A.; Warren, C.J.; Deldicque, D. The Mesozoic Along-Strike Tectonometamorphic Segmentation of Longmen Shan (Eastern Tibetan Plateau). Tectonics 2018, 37, 4655–4678. [Google Scholar] [CrossRef]
  100. Clark, M.K.; Bush, J.W.; Royden, L.H. Dynamic topography produced by lower crustal flow against rheological strength heterogeneities bordering the Tibetan Plateau. Geophys. J. Int. 2005, 162, 575–590. [Google Scholar] [CrossRef]
  101. Clark, M.K.; Royden, L.H. Topographic ooze: Building the eastern margin of Tibet by lower crustal flow. Geology 2000, 28, 703–706. [Google Scholar] [CrossRef]
  102. Cook, K.L.; Royden, L.H. The role of crustal strength variations in shaping orogenic plateaus, with application to Tibet. J. Geophys. Res. Solid Earth 2008, 113, B08407. [Google Scholar] [CrossRef]
  103. Royden, L.H.; Burchfiel, B.C.; King, R.W.; Wang, E.; Chen, Z.; Shen, F.; Liu, Y. Surface deformation and lower crustal flow in eastern Tibet. Science 1997, 276, 788–790. [Google Scholar] [CrossRef] [PubMed]
  104. Ouimet, W.B. Landslides associated with the May 12, 2008 Wenchuan earthquake: Implications for the erosion and tectonic evolution of the Longmen Shan. Tectonophysics 2010, 491, 244–252. [Google Scholar] [CrossRef]
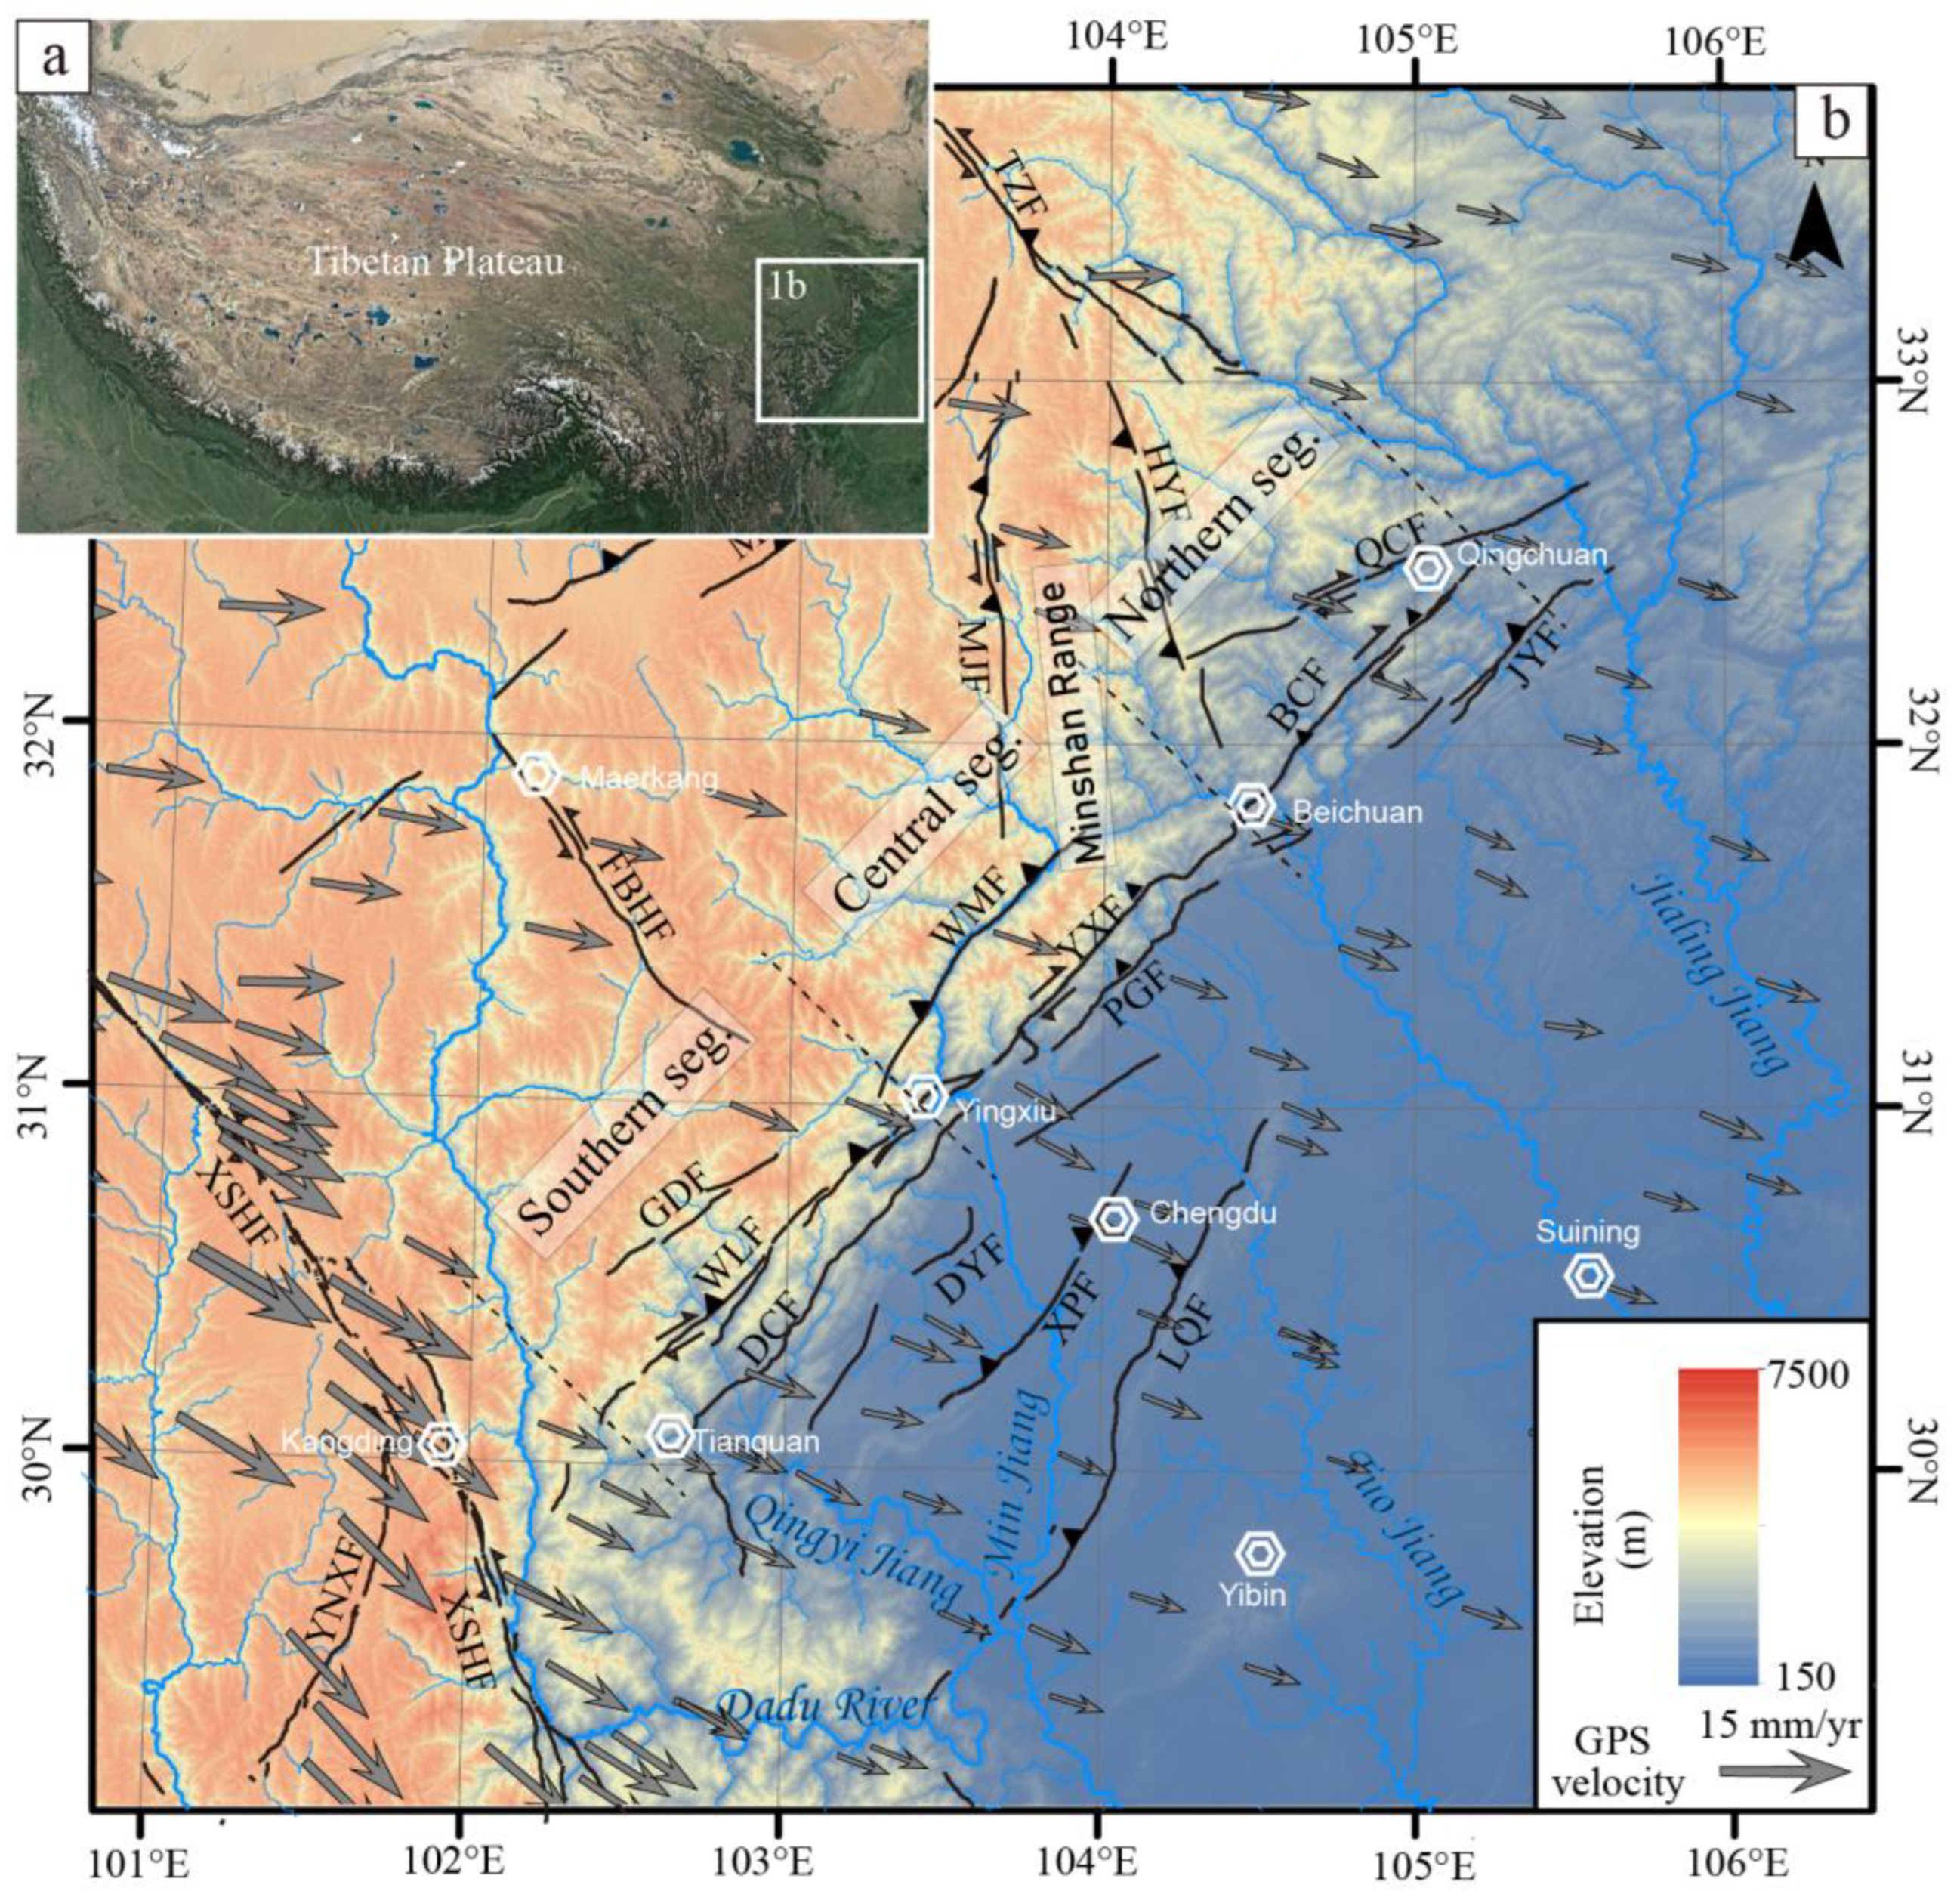
Figure 1. (a) Google Earth image of the Tibetan Plateau and its surrounding area, in which the white polygon indicates the location of Figure 1b. (b) Digital elevation map of the eastern Tibetan Plateau, superimposed with the distribution of active faults and GPS velocity. Active faults are adapted from Xu et al. [24], and GPS velocity filed with respect to the Eurasian plate is from Wang et al. [25]. GDF: Genda fault; WLF: Wulong fault; DCF: Dachuan fault; DXF: Dayi fault; WMF: Wenchuan fault; YXF: Yingxiu fault; PGR: Pengguan fault; QCF: Qingchuan fault; BCF: Beichuan fault; JYF: Jiangyou fault; XPF: Xiongpo fault; LQF: Longquan fault; HYF: Huya fault; MJF: Minjiang fault; MRGF: Maoergai fault; LRBF: Longriba fault; FBHF: Fubianhe fault; XSHF: Xianshuihe fault; YNXF: Yunongxi fault.
Remotesensing 15 04721 g001
Figure 2. Map of the eastern Tibetan Plateau illustrating the distribution of rock types, active faults, and earthquakes. Black lines represent the active faults, as adapted from Xu et al. [24]. Red lines depict the surface rupture location of the 2008 Wenchuan earthquake, as adapted from Liu-Zeng et al. [30]. Yellow circles mark the locations of historical/instrumental earthquakes with M ≥ 3.0, primarily recorded from 624 CE to 2022 (http://data.earthquake.cn, accessed on 1 April 2023). The abbreviation of faults is similar to Figure 1.
Remotesensing 15 04721 g002
Figure 3. Average annual precipitation pattern in the Longmen Shan, which shows a northwestward decrease with a notable concentration of high precipitation observed at the southwest corner of the Sichuan Basin. The precipitation data are sourced from WorldClim 2 (www.worldclim.org, accessed on 10 September 2023).
Remotesensing 15 04721 g003
Figure 4. Channel steepness metrics for the eastern Tibetan Plateau. Channel steepness, represented by ksn, was calculated at 5 km intervals along prominent channels, and an interpolated map illustrating the mean steepness indices was generated using a moving circular window (radius = 15 km). The dashed lines indicate the location of swath profiles perpendicular to the Longmen Shan.
Remotesensing 15 04721 g004
Figure 5. The wide swath profile (with a width of 50 km), illustrating how topographic parameters and exhumation rates are distributed across the northern, central, and southern sections of the Longmen Shan (refer to Figure 4 for exact locations). (ac) Mean topographic data retrieved from 30-m ASTER Global Elevation Maps (gray line: minimum and maximum elevation; black line: mean elevation) and exhumation rates acquired from AFT and AHe dating results [38,39,40,41,42,69,70,71,72,73,74,75,76,77,78,79,80,81,82]. Recently published ‘age2exhume’ thermal model [83] was utilized to transform thermochronometric ages into exhumation rates. Average surface elevations for AFT and AHe were calculated using the method proposed by Willet and Brandon [84]. A geothermal gradient of 25 °C/km is assumed for these calculations [76]. (df) The dispersion of catchment-averaged channel steepness (ksn) is depicted for 3- and 4-order basins along the swath profile. (gi) Rock erodibility calculated based on rock types shown in Figure 2 [21]. A high erodibility indicates both high sensitivity to weathering and low compressive strength. (jl) A simple sketch illustrating the fault geometry across each segment of the Longmen Shan, in which dashed lines indicate the detachment layers [85,86,87]. The distribution of historical seismic activity is denoted by gray circles, accessible through http://data.earthquake.cn (accessed on 1 April 2023). Note that the vertical and horizontal scales in our sketch are not represented in the same scale.
Remotesensing 15 04721 g005
Figure 6. Differences in ksn values (△ksn) between the catchments located in the foot and hanging walls along the Longmen Shan strike. The crosses on the graph indicate the variation in channel steepness averaged within 10 km intervals. A positive disparity in steepness measurements signifies segments along faults that have displayed Quaternary thrust activity. Notably, the dashed area in the lower diagram highlights the seismic gap positioned between the Lushan and Wenchuan earthquakes.
Remotesensing 15 04721 g006
Disclaimer/Publisher’s Note: The statements, opinions and data contained in all publications are solely those of the individual author(s) and contributor(s) and not of MDPI and/or the editor(s). MDPI and/or the editor(s) disclaim responsibility for any injury to people or property resulting from any ideas, methods, instructions or products referred to in the content.