Abstract
Geo-localization has been widely applied as an important technique to get the longitude and latitude for unmanned aerial vehicle (UAV) navigation in outdoor flight. Due to the possible interference and blocking of GPS signals, the method based on image retrieval, which is less likely to be interfered with, has received extensive attention in recent years. The geo-localization of UAVs and satellites can be achieved by querying pre-obtained satellite images with GPS-tagged and drone images from different perspectives. In this paper, an image transformation technique is used to extract cross-view geo-localization information from UAVs and satellites. A single-stage training method in UAV and satellite geo-localization is first proposed, which simultaneously realizes cross-view feature extraction and image retrieval, and achieves higher accuracy than existing multi-stage training techniques. A novel piecewise soft-margin triplet loss function is designed to avoid model parameters being trapped in suboptimal sets caused by the lack of constraint on positive and negative samples. The results illustrate that the proposed loss function enhances image retrieval accuracy and realizes a better convergence. Moreover, a data augmentation method for satellite images is proposed to overcome the disproportionate numbers of image samples. On the benchmark University-1652, the proposed method achieves the state-of-the-art result with a 6.67% improvement in recall rate (R@1) and 6.13% in average precision (AP). All codes will be publicized to promote reproducibility.
1. Introduction
In recent years, UAVs operating in outdoor environments have been widely used in many fields, including search and rescue [1], wildlife surveys [2], firefighting [3,4], precision agriculture [5,6], and geographic mapping [7,8], which results in a strong demand for UAV autonomous localization. Early mainstream localization techniques for drones relied on global navigation satellite systems (GNSS) and inertial navigation systems (INS). However, these approaches may suffer from signal interference and signal occlusion both in rural and urban areas. Therefore, using airborne visual sensors unaffected by signal transmission errors to locate the UAV is a leading solution. Benefiting from free map systems such as Google Earth and geographic information systems (GIS) such as ArcGIS, which provide open APIs, satellite maps of small areas with known latitude and longitude can assist in drone vision localization. Thus, the geo-localization problem can be solved by image retrieval. A UAV image (or satellite image) needs to find corresponding images from multiple satellite images (or UAV images). By retrieving the matching drone and satellite image pairs, geo-localization solves the problem of UAV self-localization when the GPS signal is lost.
Image retrieval methods based on deep learning frameworks are widely used in geo-localization. CNN-based methods for UAV and satellite cross-view image retrieval [9,10,11,12,13] have received wide concern, as these methods extract the invariant information of images from different perspectives through convolution operation. However, the interference features (e.g., buildings with similar colors or shapes) of UAV and satellite images may be incorrectly extracted, as CNN tends to extract local features, which reduces image retrieval accuracy. Moreover, the methods mentioned above rely on the manual geometric segmentation of the image, encountering shortcomings in generalization. To overcome these disadvantages, some Vision-Transformer-based methods [14,15] have been proposed, for the image context information is used in ViT [16] to extract meaningful information with global consistency. However, these methods require multiple stages of network training because the cross-view information is difficult to learn. For example, the method developed in Ref. [14] includes the entire image training stage and cropped image training stage, and the method developed in Ref. [15] includes the classifier training stage and retrieval training stage. The multiple training stages increase the complexity and time consumption of model training.
Although many image retrieval methods have been proposed, UAV and satellite cross-view geo-localization still faces many challenges, mainly due to the specificity of image data in this problem. The most important issue is the inconsistent view angles that increase the difficulty of image retrieval. The drone view is tilted to the ground, while the satellite view is directly above. The difference in perspective will bring about the inconsistency of the size and direction of the image content, as well as the occlusion of buildings and other problems. The time gap between drone and satellite images can cause geo-localization failures since public satellite images are updated infrequently. The scene contents in drone and satellite images (e.g., vegetation, vehicles, and building appearance) have time-variant characteristics. Additionally, these scenes are affected by weather and season. Different visual sensor characteristics can also cause inconsistent color information in satellite and drone images in the same area. As a result, the inconsistency of image contents and color also increases the difficulty of retrieving images. Moreover, the number of drone and satellite images is generally disproportionate, as drone images have a variety of perspectives. The data imbalance will bring difficulties in network training. The unbalanced distribution of samples causes the model to focus mainly on samples with a higher proportion, making it difficult to learn the distribution of the minority classes of images.
A cross-view geo-localization method for satellites and UAVs that utilizes image transformation techniques and Vision Transformer architecture is proposed in this paper. The geo-localization task of UAV and satellite images geo-localization is shown in Figure 1. The image retrieval between a satellite image block and several drone view images needs to be solved in order to accomplish geo-localization. This paper first presents a single-stage training method for this problem, which is inspired by the structure of DeiT [17]. This structure maintains the global consistency of extracted information through a self-attention mechanism that is beneficial to cross-view image retrieval. A piecewise soft-margin triplet loss function is further developed to prevent the model parameters from being trapped in suboptimal sets caused by the lack of constraint on positive samples in the original soft-margin triplet loss function. This novel loss function allows the model to learn as many correct image-retrieving pairs as possible while accomplishing sufficient distinction between correct and incorrect retrieving pairs. To eliminate the interference from the color inconsistency between satellite and UAV images, we modify the color distribution of drone images based on the color distribution of satellite images. The color transfer method reduces the possibility of learning interference information and improves the image retrieval accuracy. Moreover, data augmentation strategies are implemented to overcome the disproportionate numbers of UAV and satellite images for the Unversity-1652 benchmark.
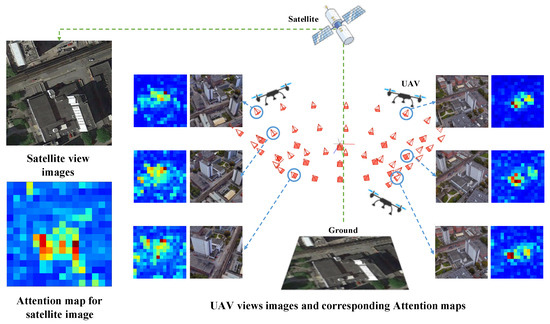
Figure 1.
The samples of UAV and satellite images geo-localization are shown. The image retrieval task is between a satellite image block and several drone view images. Our method achieved image retrieval mainly by obtaining the cross-view consistent attention information.
Our main contributions are summarized as follows:
- In this paper, a single-stage training cross-view geolocation image retrieval method is proposed, which simultaneously extracts cross-view features and accomplishes image retrieval. Our approach achieved the highest retrieval accuracy while reducing the complexity and time consumption of model training among other existing methods.
- A novel piecewise loss function is first proposed. Compared with the loss function used by the existing methods, it can overcome the problem of a small proportion of positive samples in training. The Loss functions, together with the color transfer modules and data augmentation techniques, enable the model to learn drone and satellite image information effectively, contributing to extracting cross-view consistent attention features and improving geo-localization accuracy.
- Our method achieves state-of-the-art results on the benchmark University-1652. All codes will be publicized to promote reproducibility. (https://github.com/zfcui33/CCA (accessed on 14 September 2023)).
2. Related Works
2.1. Image Retrieval Methods for Cross-View Geo-Localization
For geo-localization tasks, vision-based methods that utilize GPS-tagged satellite images to estimate the location of a set of ground-view or aerial-view images by searching for similar images through various retrieval algorithms have gained significant attention [18]. The feature-based method is first proposed to search for similar images in cross-view. Zhang and Kosecka [19] extended the former approach by using SIFT feature descriptors [20], and sorted the images by RANSAC [21]. Johns and Yang [22] improved the Bag-of-Words (BOW) technique [23] by clustering the images for similar landmarks. Roshan Zamir et al. [24] pruned outliers and incorporated approximate feature matching using GMCP, further improving nearest-neighbor matching. Mishkin et al. [25] adopted a BOW method with multiple descriptors. However, these methods encountered difficulties because the same landmarks in cross-view images most likely looked different, leading to feature point matching failure.
Since the convolution operation can automatically extract features without designing feature descriptors manually, many CNN-based geo-localization algorithms have been proposed to overcome the inconsistency of cross-view features. CVM-Net [26] used the fully convolutional layers to extract image features and developed global descriptors for image retrieval using NetVLAD. In Ref. [26], the soft-margin triplet loss function was more effective than adopting the max-margin. The extension work of CVM-Net [27] proposed a Markov localization framework to realize geo-localization in the video stream. Inspired by the spatial localization of humans utilizing orientation information, Liu and Li [28] designed a Siamese network to encode the orientation to reduce the variation of cross-view images. The effectiveness of combined geometric information in geo-localization is verified. Rodrigues and Tani [29] proposed CNN-based image retrieval method combing with a semantically driven data augmentation technique. Shi et al. [30] implemented the CVFT as network layers based on the CNN network, benefiting the comparison between cross-view images. The extension study of CVFT [31] realized an accurate 3-DoF localization of ground-view images. Although CNN-based methods can extract cross-view consistency information, visual disturbances such as long dynamic features (e.g., weather and vegetation) and transient objects (e.g., cars and pedestrians) widely exist in cross-view images, which limit the model performance. Therefore, a more flexible approach for image representation in cross-view is worth studying.
In recent years, the proposed Vision Transformer (ViT) [16] can better learn the context information of images, which is conducive to the global consistency information extraction of images from different perspectives, outperforming the CNN-based methods. Tian et al. [32] used semantic segmentation and generative adversarial networks to process satellite images and ViT to retrieve images. Zhang et al. [33] combined CNN and Transformer to extract the spatial configuration of visual feature layouts. Shi et al. [34] applied regular polar transform to reduce the differences between ground and satellite images. CNN and Transformer structure were also used to extract image features. Yang et al. [35] developed a layer-to-layer Transformer (L2LTR) for geo-localization. The positional encoding of the Transformer is exploited, which benefited from aligning geometric configurations between cross-view images. However, the network structure combined CNN and Transformer, bringing large GPU memory consumption. TransGeo [14] was the first fully Transformer-based geo-localization network architecture. The Transformer encoders were trained with the complete images at the first training stage. The Transformer encoder was trained with cropped images in the second training stage. The requirement for two-stage training in TransGeo makes the training complex and time-consuming.
2.2. UAV to Satellite Geo-Localization
Geo-localization from drones and satellites has also gained attention in recent years. The methods based on CNNs are first studied to match the images between drones and satellites. Zheng et al. [13] proposed a VGG-16 [36] baseline and the most commonly used benchmark, University-1652. Kan et al. [37] used a heat map to find the similarity of cross-view images. LCM [38] simplified the retrieval problem into a classification problem and considered the influence of the feature vector size on the matching accuracy. However, these methods indiscriminately extract all the information in the image, which causes noise information interference.
LPN [9] introduced a network architecture based on ResNet [39], in which the square-ring partition approach was designed for rotation variations. Based on the LPN network, many methods were proposed to improve geo-localization accuracy. Zhuang et al. [12] proposed the MSBA model based on LPN, applying self-attention to promote feature extraction performance. Lin et al. [11] introduced the Unit Subtraction Attention Module (USAM) to the LPN network to focus on salient regions of images. PCL [10], based on the LPN network, utilized perspective projection transformation and CGAN [40] to increase geometric consistency and color consistency. However, these LPN-based methods rely on the manual square-ring partition ratio and lack the universality of practical applications.
Since drone and satellite images have more geometric invariant information than ground and satellite images, Vision Transformers perform better for drone and satellite geo-localization due to their ability to extract contextual information. Dai et al. [15] introduced a Transformer-based structure FSRA and divided regions based on another Transformer-based classifier. This network needed two Transformer models—the image dividing Transformer model and the image retrieving Transformer model—increasing the complexity of training.
2.3. Vision Transformer
Transformer [41], based on the attention mechanism, was first proposed on machine translation, outperforming the RNN and CNN-based methods. ViT [16] divided the input images into several patches, and fixed length vectors are projected onto Transformer for each patch. The procedure of the subsequent encoder is the same as that in the original Transformer. ViT attained competitive results compared with CNNs while requiring substantially fewer computational resources for training. PVT [42] was a Transformer-based architecture that constructed a feature pyramid to learn multi-scale and high-resolution features. Swin Transformer [43] proposed a hierarchical Transformer whose representation is computed with Shifted windows. CvT [44] introduced a hierarchy of Transformers containing the convolutional token embedding. A convolutional Transformer block was used to leverage the convolutional projection. CaiT [45] proposed two Transformer architectures to improve the accuracy of deep Transformers. LV-ViT [46] utilized all the image patch tokens to compute the training loss. When transferred to different downstream tasks, data-efficient image transformers (DeiT) [17] pre-learned on Imagenet were competitive. The distillation and teacher model is adopted to guide the DeiT based on Vision Transformer architecture to perform better. Since the pre-trained DeiT model has fewer parameters and higher training efficiency than the pre-trained ViT model, it is introduced to the pipeline of our method.
3. Proposed Method
3.1. System Overview
Geo-localization of UAV and satellite images can be regarded as a bidirectional image retrieval problem [9]. Given a satellite image, the most similar UAV image should be queried to obtain the current longitude and latitude and realize drone navigation. On the contrary, the satellite image for drone-view target localization is queried when a UAV image is given.
As shown in Figure 2, the proposed method consists of four main parts: color transfer, a Transformer-based module for image retrieving, a piecewise soft-margin triplet loss function, and a similarity calculation module of the test images. In Section 3.3, this method uses the property of orthogonal color space and takes the color distribution of the satellite images as a reference to transfer the color of UAV images. The advantage of color transfer is to overcome the information inconsistency between UAV images and satellite images due to the changing external circumstance, such as seasons, weather, and illumination conditions. In Section 3.2, UAV and satellite images are inputted to two separate Transformer encoders as query and reference and obtain embedded feature vectors, respectively. These embedded feature vectors are used to calculate the similarity of images in different views afterward. In Section 3.4, different similarity calculation methods are compared to calculate the similarity between the cross-view images. A novel piecewise soft-margin triplet loss function is developed in Section 3.5 to overcome the difficulties in network convergence caused by the unmatched numbers of UAV and satellite images. A data augmentation technique for satellite images is proposed in Section 3.6, which benefits the image training stage.
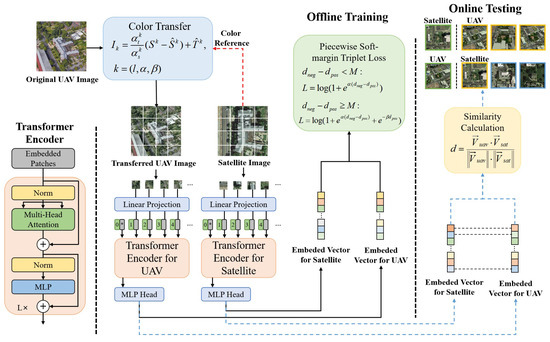
Figure 2.
The proposed method consists of four main parts: a color transfer module, a one-stage training method for image retrieving, a piecewise soft-margin triplet loss function, and a similarity calculation module for the test images.
3.2. Vision Transformer
The features in cross-view images may differ greatly from various perspectives. Although many CNN-based methods can also complete feature extraction, these methods ignore the global context information, encountering many challenges in cross-view image retrieval. The network architecture based on Transformer can encode images using contextual information. This approach allows for better performance in geo-localization tasks across perspectives.
As shown in Figure 2, the transferred UAV images and satellite images are cropped into n image patches with the size of , which are then embedded through linear projection as the input patch tokens. Meanwhile, the class token is a vector inputted into the Transformer block together with the input tokens. As a result, the Transformer takes tokens with D dimensions as input and only the output of the class token is used for embedding the output feature vector. The whole model only outputs the embedding result of the class token, and other patch tokens do not directly output the embedding result. This architecture forces the propagation of information between patch tokens and class tokens.
Since the Transformer block does not consider location information, changing the sequences of image patches has no influence on the result. Positional Encoding is introduced to represent the context information of images, which is added to the input tokens and class tokens before the first transformer block. The method of positional encoding is absolute position encoding, as it can quickly encode the location information of each image block and retain the position relationship between different blocks. Positional Encoding describes positional information, which is beneficial for the model to extract cross-view information. The input tokens and the class token combined with the Positional Encoding are then inputted to the Transformer encoder.
A transformer block consists of Multi-head Self Attention layers (MSA) and Feed-Forward Network (FFN) layers. In the Multi-head Self Attention layers (MSA), the inner product of the query matrix and the key matrix is normalized by the softmax function. The result was multiplied by the Value matrix to get the final output of the attention matrix:
For the Multi-head attention with h heads, the outputs are concatenated to get a sequence, and the final output is obtained through the linear transformation. The Feed-Forward Network (FFN) is added to the MSA layer, composed of two linear layers separated by a GeLu activation function. The first linear layer expands the dimension from to , and the second layer reduces it back from back to . The MSA and FFN layers operate as residual operators thanks to skip connections and layer normalization.
The encoder output of the class token is then inputted in the MLP Head to get the embedded UAV feature vectors and satellite feature vectors, which represent the information of the cross-view images, and are then compared to get the corresponding UAV and satellite image pairs. The dimension of the embedded feature vector is decided by the structure of MLP Head, which impacts the image retrieval result shown in the experiment section.
The DeiT-S [17], pre-trained on ImageNet, is introduced to our method. The DeiT-S structure in this method contains 12 Transformer layers, and the embedded dimension is 384. In each Transformer layer, there are 6 heads in the multi-head attention. Compared with ViT, DeiT-S introduces a new distillation procedure based on a distillation token, which plays the same role as the class token to reproduce the label estimated by the teacher. Benefiting from the knowledge distillation strategy, DeiT has fewer parameters and computation consumption.
3.3. Color Transfer
UAV and satellite image data are often collected at different times, even in different years, which brings great difficulties for image retrieval. Moreover, weather and illumination condition influence the integral color. As a result, the time lag between satellite and UAV images leads to inconsistent scene content. Meanwhile, UAVs and satellites usually equip different sensors. They have different imaging methods and image characteristics, which can also cause color differences between drone and satellite images. Therefore, the model introduces a color transfer module to reduce the differences between satellite and drone images due to other interference reasons. Thus, the model can more accurately extract consistent cross-view feature information. Inspired by existing studies [47,48,49], a color-space-based color transfer is introduced to assimilate drone and satellite images. One satellite image corresponds to multiple drone images in one scene. If the color distribution of the drone image is used as a reference, the satellite image has to be transferred numerous times according to different color distributions. Therefore, the color distribution of the satellite images is the reference for the UAV images.
The original UAV and satellite images are stored in RGB color space. RGB color space is based on three basic colors, R(Red), G(Green), and B(Blue), which are superimposed to produce a rich and wide range of colors. However, customary RGB color space is not orthogonal, and the values in the R, G, and B channels are not independent. As a result, the values of the three channels, assumed to be normally distributed, cannot be transferred independently through the mean and standard deviation of each channel. Therefore, the RGB color space is transferred to the orthogonal color space for each image.
Orthogonal linear transformation is used to transform the red, green, and blue signals perceived by the human visual system into three unrelated color components. It consists of a luminance component ℓ, and two chrominance components and . The satellite image is regarded as the source image , and the UAV image is regarded as the target image . Then, the standard deviation and mean value of the satellite image and the UAV image are calculated on every channel in the color space. The ratio of standard deviation between the drone image and satellite image determines the amplitude of color variation. Therefore, for a transferred UAV image , the formula of color transfer is presented as follows:
Finally, we transfer the drone image to RGB color space for visualization. The samples of color transfer are shown in Figure 3. The color transfer technique is used to remap the brightness of the reference image, as shown in Equation (2). Compared with histogram matching, the color correction technique can prevent color distortion and has stronger adaptability to different images. The disadvantage of this technology is that it does not have a noticeable effect on images with a rich color content. The proposed method transfers image color before training to avoid occupying computing resources during network training. In the testing stage, the color transfer formula is consistent with the color transfer formula in the training stage. Although the real-time satellite images in the testing stage are unknown during the training stage, the UAV images in the testing stage will be transferred to the same color distribution as historical satellite images, thereby avoiding data leakage and unfair comparison.
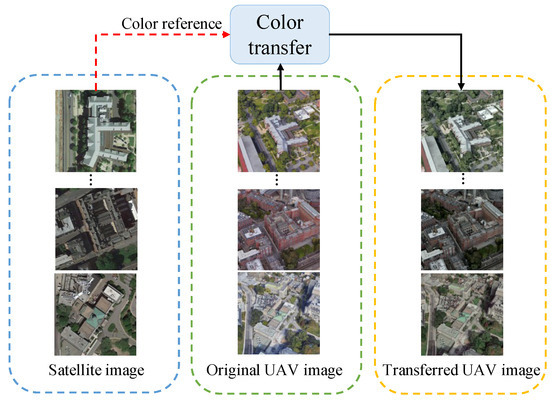
Figure 3.
A color-space-based color transfer function is introduced to assimilate drone and satellite images. The color distribution of satellite is used as the reference for the UAV images.
3.4. Similarity Calculation for Embedded Vectors
Two strategies for similarity calculation are introduced to measure the similarity between the embedded UAV feature vectors and satellite feature vectors. This paper adopts the widely used cosine similarity and Euclidean distance. A comparison of the different similarity calculation strategies is presented in the experiment section. The cosine similarity between the query embedded feature vector for UAV () and the reference embedded feature vector for satellite () is as follows:
The cosine similarity approaching 1, 0, and −1 means a positive correlation, no correlation, and negative correlation between the samples. Due to the disproportion in the numbers of UAV and satellite images, the cosine similarity of positive samples is optimized to 1, and the similarity of negative samples is optimized to 0 during model training.
The Euclidean distance between and can be expressed as the following formula:
The Euclidean distance between a query feature vector and a positive reference feature vector needs to be minimized. The distance to the negative reference feature vector needs to be maximized. The optimization range for cosine similarity is −1 to 1, and the optimization range for Euclidean distance is 0 to positive infinity. Therefore, using Euclidean distance can achieve a larger optimization range.
3.5. Piecewise Soft-Margin Triplet Loss Function
Soft-margin triplet loss [26], a loss function to maximize the similarity between positive and negative samples, has been used as the most common loss function in cross-view image retrieval for geo-localization. Compared with the triplet loss function [15,50], the soft-margin triplet loss function is proved to be smoother and can accelerate the convergence of the algorithm. Some weighted soft-margin triplet loss functions are proposed [51,52] for a one-to-one correspondence dataset CVUSA, which simultaneously restricts the ground view retrieval and the synthesized aerial view retrieval. However, the weighted soft-margin triplet loss is unsuitable for the UAV dataset due to the imbalanced amount of UAV and satellite images. Let us suppose the Euclidean distance of the embedded feature vector space is adopted to measure the similarity between samples. The distance between the queried embedded feature vector and the positive reference feature vector is defined as , and the distance between the queried embedded feature vector and the negative reference feature vector is defined as , where the distance calculation formula is presented in Equation (4). The formula of the soft-margin triplet loss function is as follows:
where is a hyper-parameter. Adopting soft-margin triplet loss can cause many problems in UAV and satellite geo-localization. The model will converge to a local optimum where the distance between positive and negative samples is large enough. However, the distance to the feature vector of the positive reference images can not be guaranteed. The reason is that only the relative gap between and is optimized in Equation (5), which ignores the absolute value of . The unconstrained distance values cause the failure to converge to the optimal solution.
To overcome the shortage of original soft-margin triplet loss function, an improvement to the original loss function is proposed and then a soft constraint for the positive distance is designed. The advanced triplet loss function is defined as follows:
where and are hyper-parameters. As a result, the convergence direction of the model not only ensures the distance between the positive and the negative samples, but also decreases the distance to positive samples. Compared with the original triplet loss function, the effectiveness of the proposed loss function is apparent and the comparison is presented in the experiment section.
However, the advanced triplet loss function, defined as Equation (6), cannot efficiently find the initial convergence direction. To better converge the model and avoid local optimum, a piecewise triplet loss function is further designed. In the first step, the original triplet loss function is used to distinguish the positive samples and negative samples. While the distance between the positive and negative sample reaches a threshold M, the advanced triplet loss function is adopted. The formula of the piecewise triplet loss function is as follows:
where , and threshold M are hyper-parameters. The novel loss function proposed in this paper ensures that the model has enough distinction between positive and negative samples and can jump out of the local optimum by reducing the distance to the positive samples. The piecewise loss function can better converge while ensuring the accuracy of the model, which is an important factor in building the one-stage Transformer architecture.
If the cosine similarity is adopted to measure the similarity of cross-view images, the formula of loss function presented in Equation (7) will be modified as follows:
where , and threshold M are the hyper-parameters.
3.6. Data Augment
Generally, when the numbers of the input data are insufficient for network training, sample diversity needs to be improved to describe the complete sample distribution. The data augmentation technique is introduced to enhance sample diversity, contributing to the generalization ability and robustness of the model [53]. Based on the existing study [11], the three most effective data augmentation techniques are selected, and corresponding improvements are made based on the characteristics of the studied dataset. In this paper, the number of UAV images significantly outweighs that of satellite images, with a ratio of 54:1. This imbalanced proportion of positive and negative samples makes it difficult to learn useful information. Therefore, only the satellite images are augmented to conquer the data disproportion. Random rotation, inversion, and cropping are implemented to ensure the invariance property of geometric structure in the images, such as the building and roads. After data augmentation, the ratio of drone and satellite images reaches 1:1, achieving balance in the number of two types of images. In Section 4, the effectiveness of the data augmentation is verified, and the comparison is presented in the experiment section.
4. Experiments
4.1. Implementation Details
4.1.1. Dataset and Evaluation Metrics
The benchmark University-1652 [13] is widely used to test the method performance of drone and satellite image retrieval for geo-localization. University-1652 consists of UAV and satellite images with different buildings from 72 universities worldwide. The training set and the test set contain 701 image pairs of different buildings. Each image pair has 1 satellite image and 54 corresponding UAV images. When measuring the accuracy of drone-to-satellite image retrieving tasks, the reference database comprises 701 satellite images, while the query database comprises 37,854 UAV images. The reference and query databases are swapped while measuring the accuracy of satellite-to-drone image retrieval.
The evaluation metrics of our experiments are the same as in previous works [10,38]. The top-k recall rate, denoted as R@k, is employed, which measures the rank position of positive samples among all reference samples. R@k can be expressed as the following formula:
where Tp@k represents the true positive samples in first k terms and Fn@k represents the false negative samples in first k terms. The recall rates of k = 1, 5, and 10 are calculated in the experiment. Moreover, AP is used as an evaluation metric for prediction accuracy. AP can be expressed as the following formula:
where N represents the related N images, m represents the total number of all query images, rel(k) indicates whether the kth image is related. If the correlation is positive, the kth will be 1, otherwise it will be 0. The value of AP demonstrates the number of related image in the query database and the rank of the related image.
4.1.2. Model Construction and Pre-Training
Our method is implemented in Pytorch [54]. The transformer architecture is constructed by the deep learning library timm [55]. The transformer encoder, shown in Figure 2, is built by the transformer block, while the network depth is 12. The multi-head attention block consists of 6 heads. The network is pre-trained on ImageNet [56].
4.1.3. Optimizer
The AdamW optimizer [57] is adopted. AdamW proposed weight decay to solve the ineffectiveness of adaptive learning rate optimizer with L2 regularization. In the experiment, the weight decay is 0.0005, and the learning rate is 0.00001. In Table 1, the influence of the learning rate is illustrated.

Table 1.
The comparisons between different hyperparameters. (Bold numbers mean the best results).
4.1.4. Computing Resource
In the experiment, due to limitations in computing resources, some batch sizes are tested to select the parameter with the best performance. The model can complete training on 2080ti with a batch size of 32 and an image size of . The results illustrate that the proposed method reaches the highest accuracy compared to existing methods, even though some previous methods used a higher image resolution. Moreover, the proposed method with the original image size is also tested, i.e., . The batch size is kept the same to ensure that the comparison experiment results are only affected by the image size. The batch size can be adjusted for model training on a GPU with a smaller memory.
4.2. Hyper-Parameters Analysis
The impact of changes in the learning rate, output feature vector dimension, and similarity calculation method is tested, and the results are listed in Table 1.
4.2.1. Compound Impact of Learning Rate and Output Feature Vector Dimensions
The results indicate that the impact of the learning rate and the dimension of the output feature vector on the results is complex. When the learning rate is large, the convergence speed of the model will be faster, but the model accuracy will be worse. The reason is that increasing the MLP output feature vector dimension also increases the number of model parameters, improving the model complexity and convergence difficulty. It can achieve acceptable training results when the learning rate is large. By contrast, the model is relatively hard to be suboptimal when the learning rate is low. Due to feature redundancy caused by an excrescent MLP structure, the optimal model parameters can be obtained in a lower output vector dimension.
Different learning rates and output dimensions are tested to obtain the best model structure and the corresponding learning rate. The learning rate of the AdamW optimizer is confirmed to perform best at 0.00001, while the feature vector dimension is 1000. An excessive learning rate in this model structure will cause training fluctuation, resulting in model instability. In the following experiment, the learning rate is maintained at 0.00001, which is consistent with the learning rate when the model achieves the best performance.
4.2.2. Output Feature Vector Dimensions
In the same learning rate, the embedded output feature vector dimensions of the MLP head in the Vision Transformer network greatly affect the image retrieval accuracy. The embedded feature vector represents the encoding of the image. Therefore, appropriate feature vector dimensions can better compress and convey image information. A small output feature vector dimension may cause meaningful image information to become lost. By contrast, feature redundancy may occur with large feature vector dimensions, which may decrease the accuracy of image retrieval. Therefore, a reasonable feature vector dimension needs to be selected through hyper-parameter experiments. As shown in Figure 4, the model performances under different output dimensions are tested. The results illustrate that the best model performance is achieved when the output dimension is 1000.
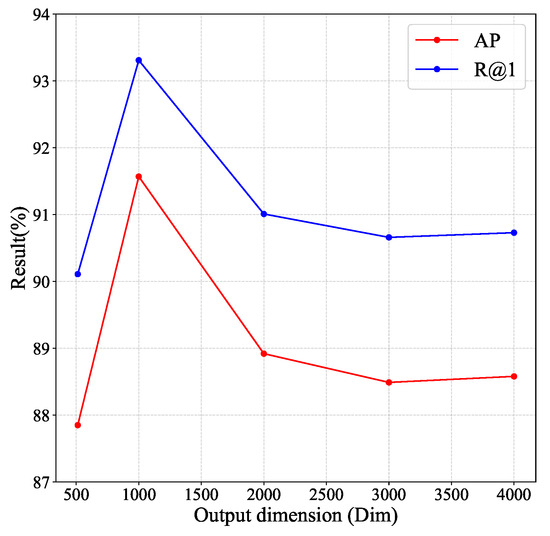
Figure 4.
The influence of the output feature dimension for the model.
4.2.3. Similarity Calculation
Two measurement strategies are introduced in Section 3.4. By adopting these two strategies, the similarity of the query and reference feature vectors is calculated to represent the similarity of the cross-view image pairs. In Table 1, the results demonstrate that employing Euclidean distance can better present the vector similarity, leading to a 5% improvement in accuracy compared to cosine similarity. The reason is that the range of Euclidean distance is larger than the range of cosine similarity, leaving a larger scope for optimization of the distance between positive and negative samples to avoid the model parameters being trapped in suboptimal sets. To ensure the accuracy of the model, Euclidean distance is used to complete the ablation experiments. However, cosine similarity has a faster calculation speed due to its lower computational overhead. The time consumption of inference is shown in Table 2. Although using Euclidean distance can achieve higher accuracy, using cosine similarity for image similarity calculation can reduce inference time, which can apply to UAVs with higher geo-localization inference speed requirement.
Table 2.
Comparison of different similarity calculation methods. The image size is . (Bold numbers mean the best results).
4.2.4. Hyper-Parameters in Piecewise Loss Function
In the soft-margin triplet loss function shown in Equation (5), the hyper-parameter achieved a satisfied effect in the value of 20 in other experiments [14] and ours. The value remains in the piecewise triplet loss for better convergence in early training. In Equation (7), the threshold value M is set to 0.8 to ensure the distinction between positive and negative samples. The hyper-parameter represents the amplitude of the positive sample constraint, which has great influence on model training results. Different values of are tested in Figure 5. The results illustrate that achieves the best effect at 0.01.
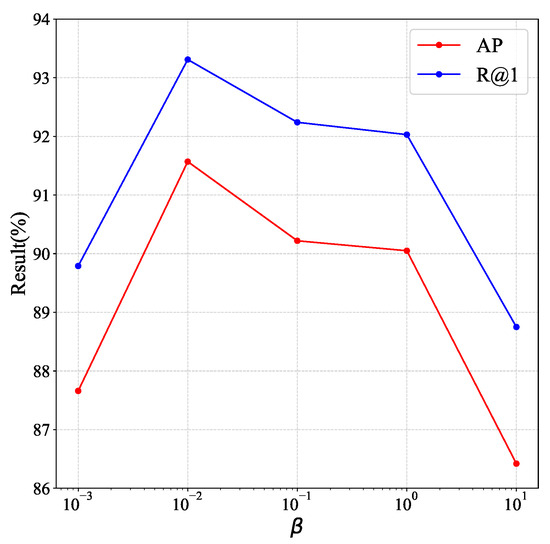
Figure 5.
The influence of hyper-parameter .
4.3. Experiment Results
4.3.1. Comparison with Other Methods
The proposed method is compared with open-source [11] and non-open-source [9,10,13,15,38] methods at different image resolutions. The directions of Drone to Satellite and Satellite to drone are both tested. The color transfer module is applied in both training and testing stage. The evaluation metrics include R@1, R@5, R@10, and AP. The experimental results in Table 3 illustrate that our testing results in the image size of achieve state-of-the-art results with a 6.07% improvement on R@1 and a 5.78% improvement on AP. In Figure 6, some results are shown. The top-k recall rate measures the rank position of positive samples among all reference samples. The positive effect of high-precision resolution images on the experiment results has been verified in previous studies [9,10,15]. Compared with the best CNN-based method PCL [10], the proposed method considers the global positioning through a DeiT structure. Compared with the Transformer-based method FSRA [15], which achieved the previous best performance, the proposed method only trained one image retrieval network and achieved a better result due to the designed loss function and color transfer module. In summary, the method in this paper can realize better results on smaller-resolution images than previous methods, which can further prove the effectiveness of our methods.
Table 3.
The comparisons between the proposed method and the existing open-source [11] and non-open-source [9,10,13,15,38] methods at different image resolutions on the public benchmark University-1652. (Bold numbers mean the best results).
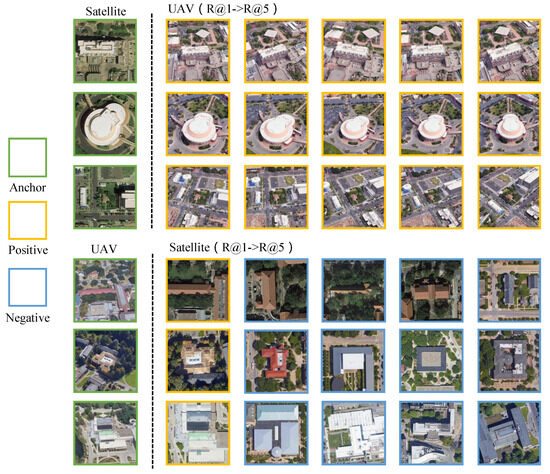
Figure 6.
The top-k recall rate denoted as R@k has been employed, which measures the rank position of positive samples among all reference samples.
Although the results in image resolution have achieved the SOTA results in a lower computation cost, the experiment of the image size in is also tested. The results have a 6.67% improvement in R@1 and a 6.13% improvement in AP, outperforming the previous methods. However, doubling the length and width of the image leads to a four-fold increase in the usage of computing resources. Since the algorithm with a heavy computation consumption is unsuitable for the practical application of UAV, and the gap between and image resolution is acceptable, the image resolution is adopted for the subsequent experiment. In addition, since the similarity calculation matrix of drone-to-satellite and satellite-to-drone is identical, the difference only existed in the calculation of image retrieval accuracy. As a result, only the drone-to-satellite results are calculated in the subsequent experiments to present the results more succinctly. The incorrect retrieval mainly occurs in the case of two buildings with similar shape features. The reason may be the influence of the self-attention mechanism, which mainly focuses on the building areas in the image for feature extraction.
4.3.2. Computation Cost
The computation costs of different models are listed in Table 4. The pipeline in this paper is based on DeiT-S pre-trained on ImageNet. The models based on ResNet-50 and ViT-S can also be implemented in our pipeline. As shown in Table 4, the pipeline based on DeiT-S achieves the highest accuracy with the lowest computation consumption. In TransGeo [14], the GFLOPS is 11.32, the model size is 9.85 GB, and the inference time is 3.093 ms (per image). In the proposed method, the GFLOPS is 11.12, the model size is 8.75 GB, and the inference time is 0.31 ms (per image). The results show that the method proposed in this paper has improved computational efficiency.
Table 4.
The computation cost experiment for different network models. (Bold numbers mean the best results).
4.4. Ablation Study
In the ablation study, the influence of various components on model performance is verified, including the color transfer (in Section 3.3), loss function design (in Section 3.5), and data augmentation (in Section 3.6).
4.4.1. Ablation Study of Color Transfer
In the ablation study of color transfer, the color transfer module is tested and the significant impacts of color transfer are verified (Table 5). Compared with the model without the color transfer, the model with color transfer has an 18.44% increase in R@1, which illustrates a crucial influence on improving the model accuracy. The rationale behind the result is that the image content (e.g., illumination, the appearance of buildings, and vegetation cover) in UAV and satellite pictures are different due to time lag, and the model may incorrectly learn this interference information. The color transfer technique reduces the difference between satellite and drone images for independent attributes of concern for cross-view matching, allowing the model to learn key information. Therefore, the model can neglect the influence of irrelevant information to achieve higher accuracy. Figure 7 demonstrates an example of the attention map of the last layer. The result illustrates that the transformer encoder can perform better for learning correct image information after color transfer.
Table 5.
The ablation study of the color transfer module. (Bold numbers mean the best results).
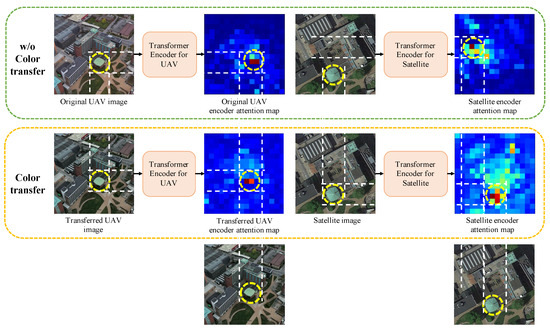
Figure 7.
An example of the attention map of the last layer is demonstrated. The result illustrates that the transformer encoder can perform better for learning correct cross-view consistent image information after color transfer.
4.4.2. Ablation Study of Loss Function
The results of the ablation study of the piecewise loss function are listed in Table 6. The uses of the original triplet loss function, advanced triplet loss function, and piecewise triplet loss function are tested, respectively. In Table 6, “Triplet loss” refers to the original triplet loss in Equation (5). “Advanced triplet loss” refers to the triplet loss function with the positive restriction in Equation (6). “Piecewise triplet loss” refers to the triplet loss function in Equation (7). The testing result of using the advanced triplet loss function is 4.47% higher at R@1 than using the original triplet loss function. However, the convergence speed of the model based on the advanced triplet loss function is quite slow due to the more stringent convergence conditions. The proposed piecewise loss function ensures that the similarity between positive and negative samples is large enough in the early training stage according to the convergence direction of the original triplet loss function. The advanced triplet loss function is used in the later stage, aiming at increasing the convergence difficulty. The proposed loss function ensures convergence speed and accuracy improvement in the late stage of model training. The testing accuracy of using the proposed loss function is 6.97% higher at R@1 than using the original triplet loss function and 2.5% higher than using the improved triplet loss function. The results illustrate that employing the newly proposed loss function is more conducive to UAV-to-satellite geo-localization.
Table 6.
The ablation study of loss function. (Bold numbers mean the best results).
4.4.3. Ablation Study of Data Augmentation
The results of the ablation study of the data augmentation are listed in Table 7. In the University-1652 dataset, there is a disproportion between the number of satellite and drone images, i.e., 1 satellite image corresponds to 54 drone images from different perspectives. If the UAV or satellite images are directly used for model training, the model convergence results will be poor due to an imbalance of samples. Data augmentation techniques are adopted during training to improve the diversity of satellite images to match the larger number of drone images. Previous studies [11,29] for cross-view image data augmentation mainly contain rotation, flipping, and color distortion augmentations. These techniques are tested in this paper to be more suitable for UAV and satellite images. The data augmentation techniques tested in this paper include random edge filling and clipping in image size, random rotation and reversal in image orientation, and random adjustment in image brightness and contrast in image color. Regarding the ratio of data equalization, previous research [11] has shown that 1:1 can achieve the best results. Therefore, in this paper, the data ratio after data augmentation remains 1:1. The results show that the random edge filling and clipping in image size and the orientation augmentation can improve the testing performance by 5.06% at R@1 compared to the trained model without adding data augment. Compared to adding a random color adjustment, the proposed data augmentation method improved the testing performance by 10.17% at R@1. The results illustrate that randomly changing the size and direction of the image would help improve model performance, while randomly changing the color of the images (e.g., brightness and contrast) will seriously degrade the testing performance. The reason is that the original color distribution of drone images is quite different from satellite images. The random color adjustment will only make the difference more obvious, which is not conducive to the model learning the correct matching pattern.
Table 7.
Ablation study of data augmentation techniques. (Bold numbers mean the best results).
4.5. Visualization and Interpretation
In the transformer encoder, each attention block can output an attention map representing attention distribution learning from scene information. The output attention map of the last attention block is obtained and visualized in the UAV and satellite encoder networks. As shown in Figure 7, the networks trained after color transfer can better extract the attention of the mutual landmarks in both UAV and satellite images. For example, there are two green buildings, and the model with a color transfer module can correctly recognize the green building with a dome. In contrast, the attention information of the model without a color transfer module is disturbed by the other green building. The attention maps illustrate that the networks extract the global features with cross-view consistency. As a result, the proposed method can better conduct the image retrieval task.
5. Conclusions
To address the problem of cross-view geo-localization of UAV and satellite images, a method utilizing the Vision Transformer network structure was proposed in this paper to realize cross-view image retrieval. A color transfer module was introduced to reduce the difference between drone and satellite images, which caused the network to learn the correct global information adequately. A novel piecewise loss function was designed to avoid the model parameters being trapped in suboptimal sets. Data augmentation methods, targeting drone and satellite images, were developed to solve the image disproportion. Our method achieved the results of SOTA on the open dataset University-1652.
Moreover, some innovations of this study deserve further attention. First, a single-stage training method was proposed, which can simultaneously extract cross-view feature information and complete image retrieval different from existing methods. Second, the developed piecewise loss function can increase the constraint on the positive sample and avoid the model converging to the local optimum.
In future work, more accurate localization methods are worth studying. For example, methods to estimate the longitude and latitude of drones based on satellite image reference and methods to estimate the position and orientation of drones. Due to the influence of the self-attention mechanism, the feature extraction result mainly focused on the building areas in the image, which may cause the limitation of the proposed method. The lightweight model, which has a less computational burden, deserves further attention to be more widely deployed on UAVs.
Author Contributions
Methodology, Z.C. and X.W.; Software, Z.C.; Validation, Z.C.; Writing—original draft, Z.C. and P.Z.; Writing—review & editing, Z.Z., Y.L., H.L. and Y.Z.; Supervision, H.L.; Funding acquisition, Y.Z. All authors have read and agreed to the published version of the manuscript.
Funding
This work was supported by NSFC 62088101 Autonomous Intelligent Unmanned Systems, in part by STI 2030-Major Projects 2021ZD0201403.
Data Availability Statement
All codes will be publicized to promote reproducibility. https://github.com/zfcui33/CCA accessed on 14 September 2023.
Conflicts of Interest
The authors declare that they have no known competing financial interests or personal relationships that could have appeared to influence the work reported in this paper.
References
- Tomic, T.; Schmid, K.; Lutz, P.; Domel, A.; Kassecker, M.; Mair, E.; Grixa, I.L.; Ruess, F.; Suppa, M.; Burschka, D. Toward a fully autonomous UAV: Research platform for indoor and outdoor urban search and rescue. IEEE Robot. Autom. Mag. 2012, 19, 46–56. [Google Scholar] [CrossRef]
- Filipovs, J.; Berg, A.; Ahlberg, J.; Vecvanags, A.; Brauns, A.; Jakovels, D. UAV areal imagery-based wild animal detection for sustainable wildlife management. In Proceedings of the EGU General Assembly Conference Abstracts, Online, 19–30 April 2021. [Google Scholar]
- Ollero, A.; Merino, L. Unmanned aerial vehicles as tools for forest-fire fighting. For. Ecol. Manag. 2006, 234, S263. [Google Scholar] [CrossRef]
- Sherstjuk, V.; Zharikova, M.; Sokol, I. Forest fire-fighting monitoring system based on UAV team and remote sensing. In Proceedings of the 2018 IEEE 38th International Conference on Electronics and Nanotechnology (ELNANO), Kyiv, Ukraine, 24–26 April 2018; pp. 663–668. [Google Scholar]
- Tsouros, D.C.; Bibi, S.; Sarigiannidis, P.G. A review on UAV-based applications for precision agriculture. Information 2019, 10, 349. [Google Scholar] [CrossRef]
- Radoglou-Grammatikis, P.; Sarigiannidis, P.; Lagkas, T.; Moscholios, I. A compilation of UAV applications for precision agriculture. Comput. Netw. 2020, 172, 107148. [Google Scholar] [CrossRef]
- Pothuganti, K.; Jariso, M.; Kale, P. A review on geo mapping with unmanned aerial vehicles. Int. J. Innov. Res. Comput. Commun. Eng. 2017, 5, 1170–1177. [Google Scholar]
- Samad, A.M.; Kamarulzaman, N.; Hamdani, M.A.; Mastor, T.A.; Hashim, K.A. The potential of Unmanned Aerial Vehicle (UAV) for civilian and mapping application. In Proceedings of the 2013 IEEE 3rd International Conference on System Engineering and Technology, Shah Alam, Malaysia, 19–20 August 2013; pp. 313–318. [Google Scholar]
- Wang, T.; Zheng, Z.; Hamdani, M.A.; Mastor, T.A.; Hashim, K.A.; Yan, C.; Zhang, J.; Sun, Y.; Zheng, B.; Yang, Y. Each part matters: Local patterns facilitate cross-view geo-localization. IEEE Trans. Circuits Syst. Video Technol. 2021, 32, 867–879. [Google Scholar]
- Tian, X.; Shao, J.; Ouyang, D.; Shen, H.T. Uav-satellite view synthesis for cross-view geo-localization. IEEE Trans. Circuits Syst. Video Technol. 2021, 32, 4804–4815. [Google Scholar] [CrossRef]
- Lin, J.; Zheng, Z.; Zhong, Z.; Luo, Z.; Li, S.; Yang, Y.; Sebe, N. Joint Representation Learning and Keypoint Detection for Cross-view Geo-localization. IEEE Trans. Image Process. 2022, 31, 3780–3792. [Google Scholar] [CrossRef]
- Zhuang, J.; Dai, M.; Chen, X.; Zheng, E. A Faster and More Effective Cross-View Matching Method of UAV and Satellite Images for UAV Geolocalization. Remote Sens. 2021, 13, 3979. [Google Scholar] [CrossRef]
- Zheng, Z.; Wei, Y.; Yang, Y. University-1652: A multi-view multi-source benchmark for drone-based geo-localization. In Proceedings of the 28th ACM International Conference on Multimedia, Seattle, WA, USA, 12–16 October 2020; pp. 1395–1403. [Google Scholar]
- Zhu, S.; Shah, M.; Chen, C. Transgeo: Transformer is all you need for cross-view image geo-localization. In Proceedings of the IEEE/CVF Conference on Computer Vision and Pattern Recognition, New Orleans, LA, USA, 18–24 June 2022; pp. 1162–1171. [Google Scholar]
- Dai, M.; Hu, J.; Zhuang, J.; Zheng, E. A transformer-based feature segmentation and region alignment method for uav-view geo-localization. IEEE Trans. Circuits Syst. Video Technol. 2021, 32, 4376–4389. [Google Scholar] [CrossRef]
- Dosovitskiy, A.; Beyer, L.; Kolesnikov, A.; Weissenborn, D.; Zhai, X.; Unterthiner, T.; Dehghani, M.; Minderer, M.; Heigold, G.; Gelly, S.; et al. An image is worth 16x16 words: Transformers for image recognition at scale. arXiv 2020, arXiv:2010.11929. [Google Scholar]
- Touvron, H.; Cord, M.; Douze, M.; Massa, F.; Sablayrolles, A.; Jégou, H. Training data-efficient image transformers & distillation through attention. In Proceedings of the International Conference on Machine Learning, Virtual Event, 18–24 July 2021; pp. 10347–10357. [Google Scholar]
- Brejcha, J.; Čadík, M. State-of-the-art in visual geo-localization. Pattern Anal. Appl. 2017, 20, 613–637. [Google Scholar] [CrossRef]
- Zhang, W.; Kosecka, J. Image based localization in urban environments. In Proceedings of the Third International Symposium on 3D Data Processing, Visualization, and Transmission (3DPVT’06), Chapel Hill, NC, USA, 14–16 June 2006; pp. 33–40. [Google Scholar]
- Lowe, D.G. Distinctive image features from scale-invariant keypoints. Int. J. Comput. Vis. 2004, 60, 91–110. [Google Scholar] [CrossRef]
- Fischler, M.A.; Bolles, R.C. Random sample consensus: A paradigm for model fitting with applications to image analysis and automated cartography. Commun. ACM 1981, 24, 381–395. [Google Scholar] [CrossRef]
- Johns, E.; Yang, G.Z. From images to scenes: Compressing an image cluster into a single scene model for place recognition. In Proceedings of the 2011 International Conference on Computer Vision, Sophia Antipolis, France, 20–22 September 2011; pp. 874–881. [Google Scholar]
- Sivic, J.; Zisserman, A. Video Google: A text retrieval approach to object matching in videos. In Proceedings of the Computer Vision, IEEE International Conference on IEEE Computer Society, Nice, France, 13–16 October 2003; Volume 3, p. 1470. [Google Scholar]
- Roshan Zamir, A.; Ardeshir, S.; Shah, M. Gps-tag refinement using random walks with an adaptive damping factor. In Proceedings of the IEEE Conference on Computer Vision and Pattern Recognition, Columbus, OH, USA, 23–28 June 2014; pp. 4280–4287. [Google Scholar]
- Mishkin, D.; Perdoch, M.; Matas, J. Place recognition with WxBS retrieval. In Proceedings of the CVPR 2015 Workshop on Visual Place Recognition in Changing Environments, Boston, MA, USA, 7–12 June 2015; Volume 30. [Google Scholar]
- Hu, S.; Feng, M.; Nguyen, R.M.; Lee, G.H. Cvm-net: Cross-view matching network for image-based ground-to-aerial geo-localization. In Proceedings of the IEEE Conference on Computer Vision and Pattern Recognition, Salt Lake City, UT, USA, 18–22 June 2018; pp. 7258–7267. [Google Scholar]
- Hu, S.; Lee, G.H. Image-based geo-localization using satellite imagery. Int. J. Comput. Vis. 2020, 128, 1205–1219. [Google Scholar] [CrossRef]
- Liu, L.; Li, H. Lending orientation to neural networks for cross-view geo-localization. In Proceedings of the IEEE/CVF Conference on Computer Vision and Pattern Recognition, Long Beach, CA, USA, 15–20 June 2019; pp. 5624–5633. [Google Scholar]
- Rodrigues, R.; Tani, M. Are these from the same place? seeing the unseen in cross-view image geo-localization. In Proceedings of the IEEE/CVF Winter Conference on Applications of Computer Vision, Virtual, 5–9 January 2021; pp. 3753–3761. [Google Scholar]
- Shi, Y.; Yu, X.; Liu, L.; Zhang, T.; Li, H. Optimal feature transport for cross-view image geo-localization. In Proceedings of the AAAI Conference on Artificial Intelligence, New York, NY, USA, 7–12 February 2020; Volume 34, pp. 11990–11997. [Google Scholar]
- Shi, Y.; Yu, X.; Liu, L.; Campbell, D.; Koniusz, P.; Li, H. Accurate 3-DoF Camera Geo-Localization via Ground-to-Satellite Image Matching. IEEE Trans. Pattern Anal. Mach. Intell. 2022, 45, 2682–2697. [Google Scholar] [CrossRef] [PubMed]
- Tian, X.; Shao, J.; Ouyang, D.; Zhu, A.; Chen, F. SMDT: Cross-View Geo-Localization with Image Alignment and Transformer. In Proceedings of the 2022 IEEE International Conference on Multimedia and Expo (ICME), Taipei, Taiwan, 18–22 July 2022; pp. 1–6. [Google Scholar] [CrossRef]
- Zhang, X.; Li, X.; Sultani, W.; Zhou, Y.; Wshah, S. Cross-View Geo-Localization via Learning Disentangled Geometric Layout Correspondence. Proc. AAAI Conf. Artif. Intell. 2023, 37, 3480–3488. [Google Scholar] [CrossRef]
- Shi, Y.; Liu, L.; Yu, X.; Li, H. Spatial-aware feature aggregation for image based cross-view geo-localization. In Proceedings of the 33rd Conference on Neural Information Processing Systems (NeurIPS 2019), Vancouver, Canada, 8–14 December 2019. [Google Scholar]
- Yang, H.; Lu, X.; Zhu, Y. Cross-view geo-localization with layer-to-layer transformer. Adv. Neural Inf. Process. Syst. 2021, 34, 29009–29020. [Google Scholar]
- Simonyan, K.; Zisserman, A. Very deep convolutional networks for large-scale image recognition. arXiv 2014, arXiv:1409.1556. [Google Scholar]
- Kan, R.; Lei, D.; Minjie, W.; Guohua, G.; Qian, C. Target localization based on cross-view matching between UAV and satellite. Chin. J. Aeronaut. 2022, 35, 333–341. [Google Scholar]
- Ding, L.; Zhou, J.; Meng, L.; Long, Z. A practical cross-view image matching method between UAV and satellite for UAV-based geo-localization. Remote Sens. 2020, 13, 47. [Google Scholar] [CrossRef]
- He, K.; Zhang, X.; Ren, S.; Sun, J. Deep Residual Learning for Image Recognition. In Proceedings of the IEEE Conference on Computer Vision and Pattern Recognition (CVPR), Las Vegas, NV, USA, 27–30 June 2016. [Google Scholar]
- Zhu, J.Y.; Park, T.; Isola, P.; Efros, A.A. Unpaired Image-To-Image Translation Using Cycle-Consistent Adversarial Networks. In Proceedings of the IEEE International Conference on Computer Vision (ICCV), Venice, Italy, 22–29 October 2017. [Google Scholar]
- Vaswani, A.; Shazeer, N.; Parmar, N.; Uszkoreit, J.; Jones, L.; Gomez, A.N.; Kaiser, L.u.; Polosukhin, I. Attention is All you Need. In Advances in Neural Information Processing Systems; Guyon, I., Luxburg, U.V., Bengio, S., Wallach, H., Fergus, R., Vishwanathan, S., Garnett, R., Eds.; Curran Associates, Inc.: San Francisco, CA, USA, 2017; Volume 30. [Google Scholar]
- Wang, W.; Xie, E.; Li, X.; Fan, D.P.; Song, K.; Liang, D.; Lu, T.; Luo, P.; Shao, L. Pyramid Vision Transformer: A Versatile Backbone for Dense Prediction Without Convolutions. In Proceedings of the IEEE/CVF International Conference on Computer Vision (ICCV), Montreal, BC, Canada, 11–17 October 2021; pp. 568–578. [Google Scholar]
- Liu, Z.; Lin, Y.; Cao, Y.; Hu, H.; Wei, Y.; Zhang, Z.; Lin, S.; Guo, B. Swin Transformer: Hierarchical Vision Transformer Using Shifted Windows. In Proceedings of the IEEE/CVF International Conference on Computer Vision (ICCV), Montreal, BC, Canada, 11–17 October 2021; pp. 10012–10022. [Google Scholar]
- Wu, H.; Xiao, B.; Codella, N.; Liu, M.; Dai, X.; Yuan, L.; Zhang, L. CvT: Introducing Convolutions to Vision Transformers. In Proceedings of the IEEE/CVF International Conference on Computer Vision (ICCV), Montreal, BC, Canada, 11–17 October 2021; pp. 22–31. [Google Scholar]
- Touvron, H.; Cord, M.; Sablayrolles, A.; Synnaeve, G.; Jégou, H. Going Deeper With Image Transformers. In Proceedings of the IEEE/CVF International Conference on Computer Vision (ICCV), Montreal, BC, Canada, 11–17 October 2021; pp. 32–42. [Google Scholar]
- Jiang, Z.H.; Hou, Q.; Yuan, L.; Zhou, D.; Shi, Y.; Jin, X.; Wang, A.; Feng, J. All Tokens Matter: Token Labeling for Training Better Vision Transformers. In Proceedings of the Advances in Neural Information Processing Systems; Ranzato, M., Beygelzimer, A., Dauphin, Y., Liang, P., Vaughan, J.W., Eds.; Curran Associates, Inc.: San Francisco, CA, USA, 2021; Volume 34, pp. 18590–18602. [Google Scholar]
- Reinhard, E.; Adhikhmin, M.; Gooch, B.; Shirley, P. Color transfer between images. IEEE Comput. Graph. Appl. 2001, 21, 34–41. [Google Scholar] [CrossRef]
- Thomas, J.; Bowyer, K.W.; Kareem, A. Color balancing for change detection in multitemporal images. In Proceedings of the 2012 IEEE Workshop on the Applications of Computer Vision (WACV), Breckenridge, CO, USA, 9–11 January 2012; pp. 385–390. [Google Scholar] [CrossRef]
- Ugliano, M.; Bianchi, L.; Bottino, A.; Allasia, W. Automatically detecting changes and anomalies in unmanned aerial vehicle images. In Proceedings of the 2015 IEEE 1st International Forum on Research and Technologies for Society and Industry Leveraging a better tomorrow (RTSI), Turin, Italy, 16–18 September 2015; pp. 484–489. [Google Scholar] [CrossRef]
- Chechik, G.; Sharma, V.; Shalit, U.; Bengio, S. Large scale online learning of image similarity through ranking. J. Mach. Learn. Res. 2010, 11, 1109–1135. [Google Scholar]
- Regmi, K.; Shah, M. Bridging the Domain Gap for Ground-to-Aerial Image Matching. In Proceedings of the IEEE/CVF International Conference on Computer Vision (ICCV), Seoul, Republic of Korea, 27 October–2 November 2019. [Google Scholar]
- Cai, S.; Guo, Y.; Khan, S.; Hu, J.; Wen, G. Ground-to-Aerial Image Geo-Localization With a Hard Exemplar Reweighting Triplet Loss. In Proceedings of the IEEE/CVF International Conference on Computer Vision (ICCV), Seoul, Republic of Korea, 27 October–2 November 2019. [Google Scholar]
- Shorten, C.; Khoshgoftaar, T.M. A survey on image data augmentation for deep learning. J. Big Data 2019, 6, 1–48. [Google Scholar] [CrossRef]
- Paszke, A.; Gross, S.; Massa, F.; Lerer, A.; Bradbury, J.; Chanan, G.; Killeen, T.; Lin, Z.; Gimelshein, N.; Antiga, L.; et al. Pytorch: An imperative style, high-performance deep learning library. In Proceedings of the 31st Conference on Neural Information Processing Systems (NIPS 2017), Long Beach, California, USA, 4–9 December 2017. [Google Scholar]
- Wightman, R. PyTorch Image Models. 2019. Available online: https://github.com/rwightman/pytorch-image-models (accessed on 11 August 2023).
- Deng, J.; Dong, W.; Socher, R.; Li, L.J.; Li, K.; Fei-Fei, L. ImageNet: A Large-Scale Hierarchical Image Database. In Proceedings of the CVPR09, Miami, FL, USA, 20–25 June 2009. [Google Scholar]
- Loshchilov, I.; Hutter, F. Fixing Weight Decay Regularization in Adam. arXiv 2017, arXiv:abs/1711.05101. [Google Scholar]
- Lin, T.Y.; Cui, Y.; Belongie, S.; Hays, J. Learning deep representations for ground-to-aerial geolocalization. In Proceedings of the IEEE Conference on Computer Vision and Pattern Recognition, Boston, MA, USA, 7–12 June 2015; pp. 5007–5015. [Google Scholar]
Disclaimer/Publisher’s Note: The statements, opinions and data contained in all publications are solely those of the individual author(s) and contributor(s) and not of MDPI and/or the editor(s). MDPI and/or the editor(s) disclaim responsibility for any injury to people or property resulting from any ideas, methods, instructions or products referred to in the content. |
© 2023 by the authors. Licensee MDPI, Basel, Switzerland. This article is an open access article distributed under the terms and conditions of the Creative Commons Attribution (CC BY) license (https://creativecommons.org/licenses/by/4.0/).