Article

The Effects of Precipitation Event Characteristics and Afforestation on the Greening in Arid Grasslands, China

1
Institute of Geographic Sciences and Natural Resources Research, Chinese Academy of Sciences, Beijing 100101, China
2
College of Resources and Environment, University of Chinese Academy of Sciences, Beijing 100049, China
3
National Ecosystem Science Data Center, Beijing 100101, China
4
Key Laboratory of Agro-Forestry Environmental Processes and Ecological Regulation of Hainan Province, Hainan University, Haikou 570228, China
5
Beijing Academy of Social Sciences, Beijing 100101, China
6
Tongliao Meteorological Bureau of Inner Mongolia, Tongliao 028000, China
*
Author to whom correspondence should be addressed.
Remote Sens. 2023, 15(18), 4621; https://doi.org/10.3390/rs15184621
Submission received: 4 August 2023 / Revised: 15 September 2023 / Accepted: 16 September 2023 / Published: 20 September 2023
(This article belongs to the Special Issue Remote Sensing of the Terrestrial Carbon Cycle)

Abstract

:
Global greening and its relationship with climate change remain the hot topics in recent years, and are of critical importance for understanding the interactions between the terrestrial ecosystem carbon cycle and the climate system. China, especially north China, has contributed a lot to global greening during the past few decades. As a water-limited ecosystem, human activities, not precipitation amount, were thought as the main contributor to the greening of north China. Considering the importance of precipitation event characteristics (PEC) in the altered precipitation regimes, we integrated long-term normalized difference vegetation index (NDVI) and meteorological datasets to reveal the role of precipitation regimes, especially PECs, on vegetation growth across temperate grasslands in north China. Accompanied with a significantly decreased growing season precipitation (GSP), NDVI increased significantly in the largest area of the temperate grasslands during 1982–2015, i.e., greening. We found that 28.44% of the area was explained by PECs, including more heavy or extreme precipitation events, alleviated extreme drought, and fewer light events, while only 0.92% of the area was associated with GSP. NDVI did not always increase over the 30 years and there was a decrease during 1996–2005. Taking afforestation projects in desertified lands into account, we found that precipitation, mainly PECs, explained more the increase and decline of NDVI during 1982–1995 and 1996–2005, respectively, while an equivalent explanatory power of precipitation and afforestation projects to the increase in NDVI after 2005. Our study indicates a possible higher productivity under future precipitation regime scenario (e.g., fewer but larger precipitation events) or intensive afforestation activity, implying more carbon sequestration or livestock production of temperate steppe in the future.

1. Introduction

Dramatic climate change has significantly affected vegetation growth during the past few decades. Global—or at least regional—greening has been observed with vegetation indexes [1,2,3,4,5,6,7,8]. Greening is closely related to carbon sequestration and thus possibly relieves global warming. Arid and semi-arid regions (mainly grasslands) were thought as one of the largest contributors to the temporal variability of carbon sequestration [9], which was also the largest sources of uncertainty for modeling community. Therefore, to quantify and narrow the modeling uncertainty of the carbon sink function, it is vital to clarify the spatio-temporal patterns of vegetation growth and its influencing factors in arid and semi-arid regions.
Precipitation is one of the most important climatic factors in determining the vegetation growth of grasslands [10,11,12,13,14,15]. However, temporal models reported a weakened sensitivity of productivity to precipitation [16,17,18,19,20], and it has been reported that greening was found even without the increase in precipitation [21]. Notably, precipitation in most previous studies refers to annual precipitation amount, while precipitation event characteristics (PEC), also one of the most important forecasts of precipitation regimes in the future by IPCC, have rarely been evaluated. Actually, studies have already clarified the roles that PECs may play in temporal dynamics of productivity. For example, it is reported that less frequent but larger precipitation events (an important projection of PECs in arid regions) may result in higher productivity in arid grasslands but a lower productivity in humid grasslands [22,23,24]. A ‘Bucket Model’ was then formed to explain the effects of PECs on productivity [25]. With the same amount of precipitation, less frequent but larger precipitation events indicate that the soil water bucket will reach to an above-average level after the larger rain pulses but a below-average level during the longer precipitation intervals, which exert different impacts on vegetation in arid and humid grasslands. According to the above-mentioned manipulative rainfall experiments at several grassland stations, there are reasons to believe that PECs will make sense to the regional greening or browning in grasslands, but we still lack analysis based on observed records. As precipitation deluge and extreme drought tend to exert increasing effects on human wellbeing [26,27,28], it is urgent to quantify to what extent PECs will influence grasslands’ productivity dynamics.
The effects of precipitation on greening or browning may be modulated by anthropogenic factors, for example afforestation and land use changes [5,29,30,31]. It was reported that the greening in China or the increased carbon sequestration in Asian terrestrial ecosystems after 1999 were primarily attributed to the implementation of extensive ecological restoration programs [32,33,34,35]. Afforestation is one of the most important methods of ecological programs to control land desertification in north China, e.g., Three-North Shelter Forest Program, the Beijing-Tianjin Sand Source Control Project, and Returning Grazing Land to Grassland Project, which increased vegetation cover and thus greening. Most studies quantify the effects of anthropogenic factors on greening through residual errors, in which the unexplained residual of climate (mainly annual precipitation amount and temperature) was ascribed to anthropogenic factors [29,36,37]. However, it may overestimate the effects of anthropogenic factors with this method; we need to use direct verification or rethink if there are other possibilities, e.g., unexpected environmental factors such as PECs.
China is one of the leading countries in global greening, especially in north China, where precipitation dominate the temporal patterns of vegetation growth and afforestation projects located. Therefore, we investigated the year-by-year changes of vegetation growth and their underlying forces (precipitation and afforestation) in temperate grasslands of the Inner Mongolia Plateau based on the normalized difference vegetation Index (NDVI) datasets and daily precipitation records during 1982–2015. The specific objectives of this study were to address the following three questions: (1) whether it is greening or browning during the past several decades in terms of year-by-year changes of NDVI; (2) how precipitation regimes, i.e., annual precipitation amount and different aspects of precipitation event characteristics, affect the year-by-year changes of vegetation growth; (3) to what extent afforestation affects greening or browning.

2. Materials and Methods
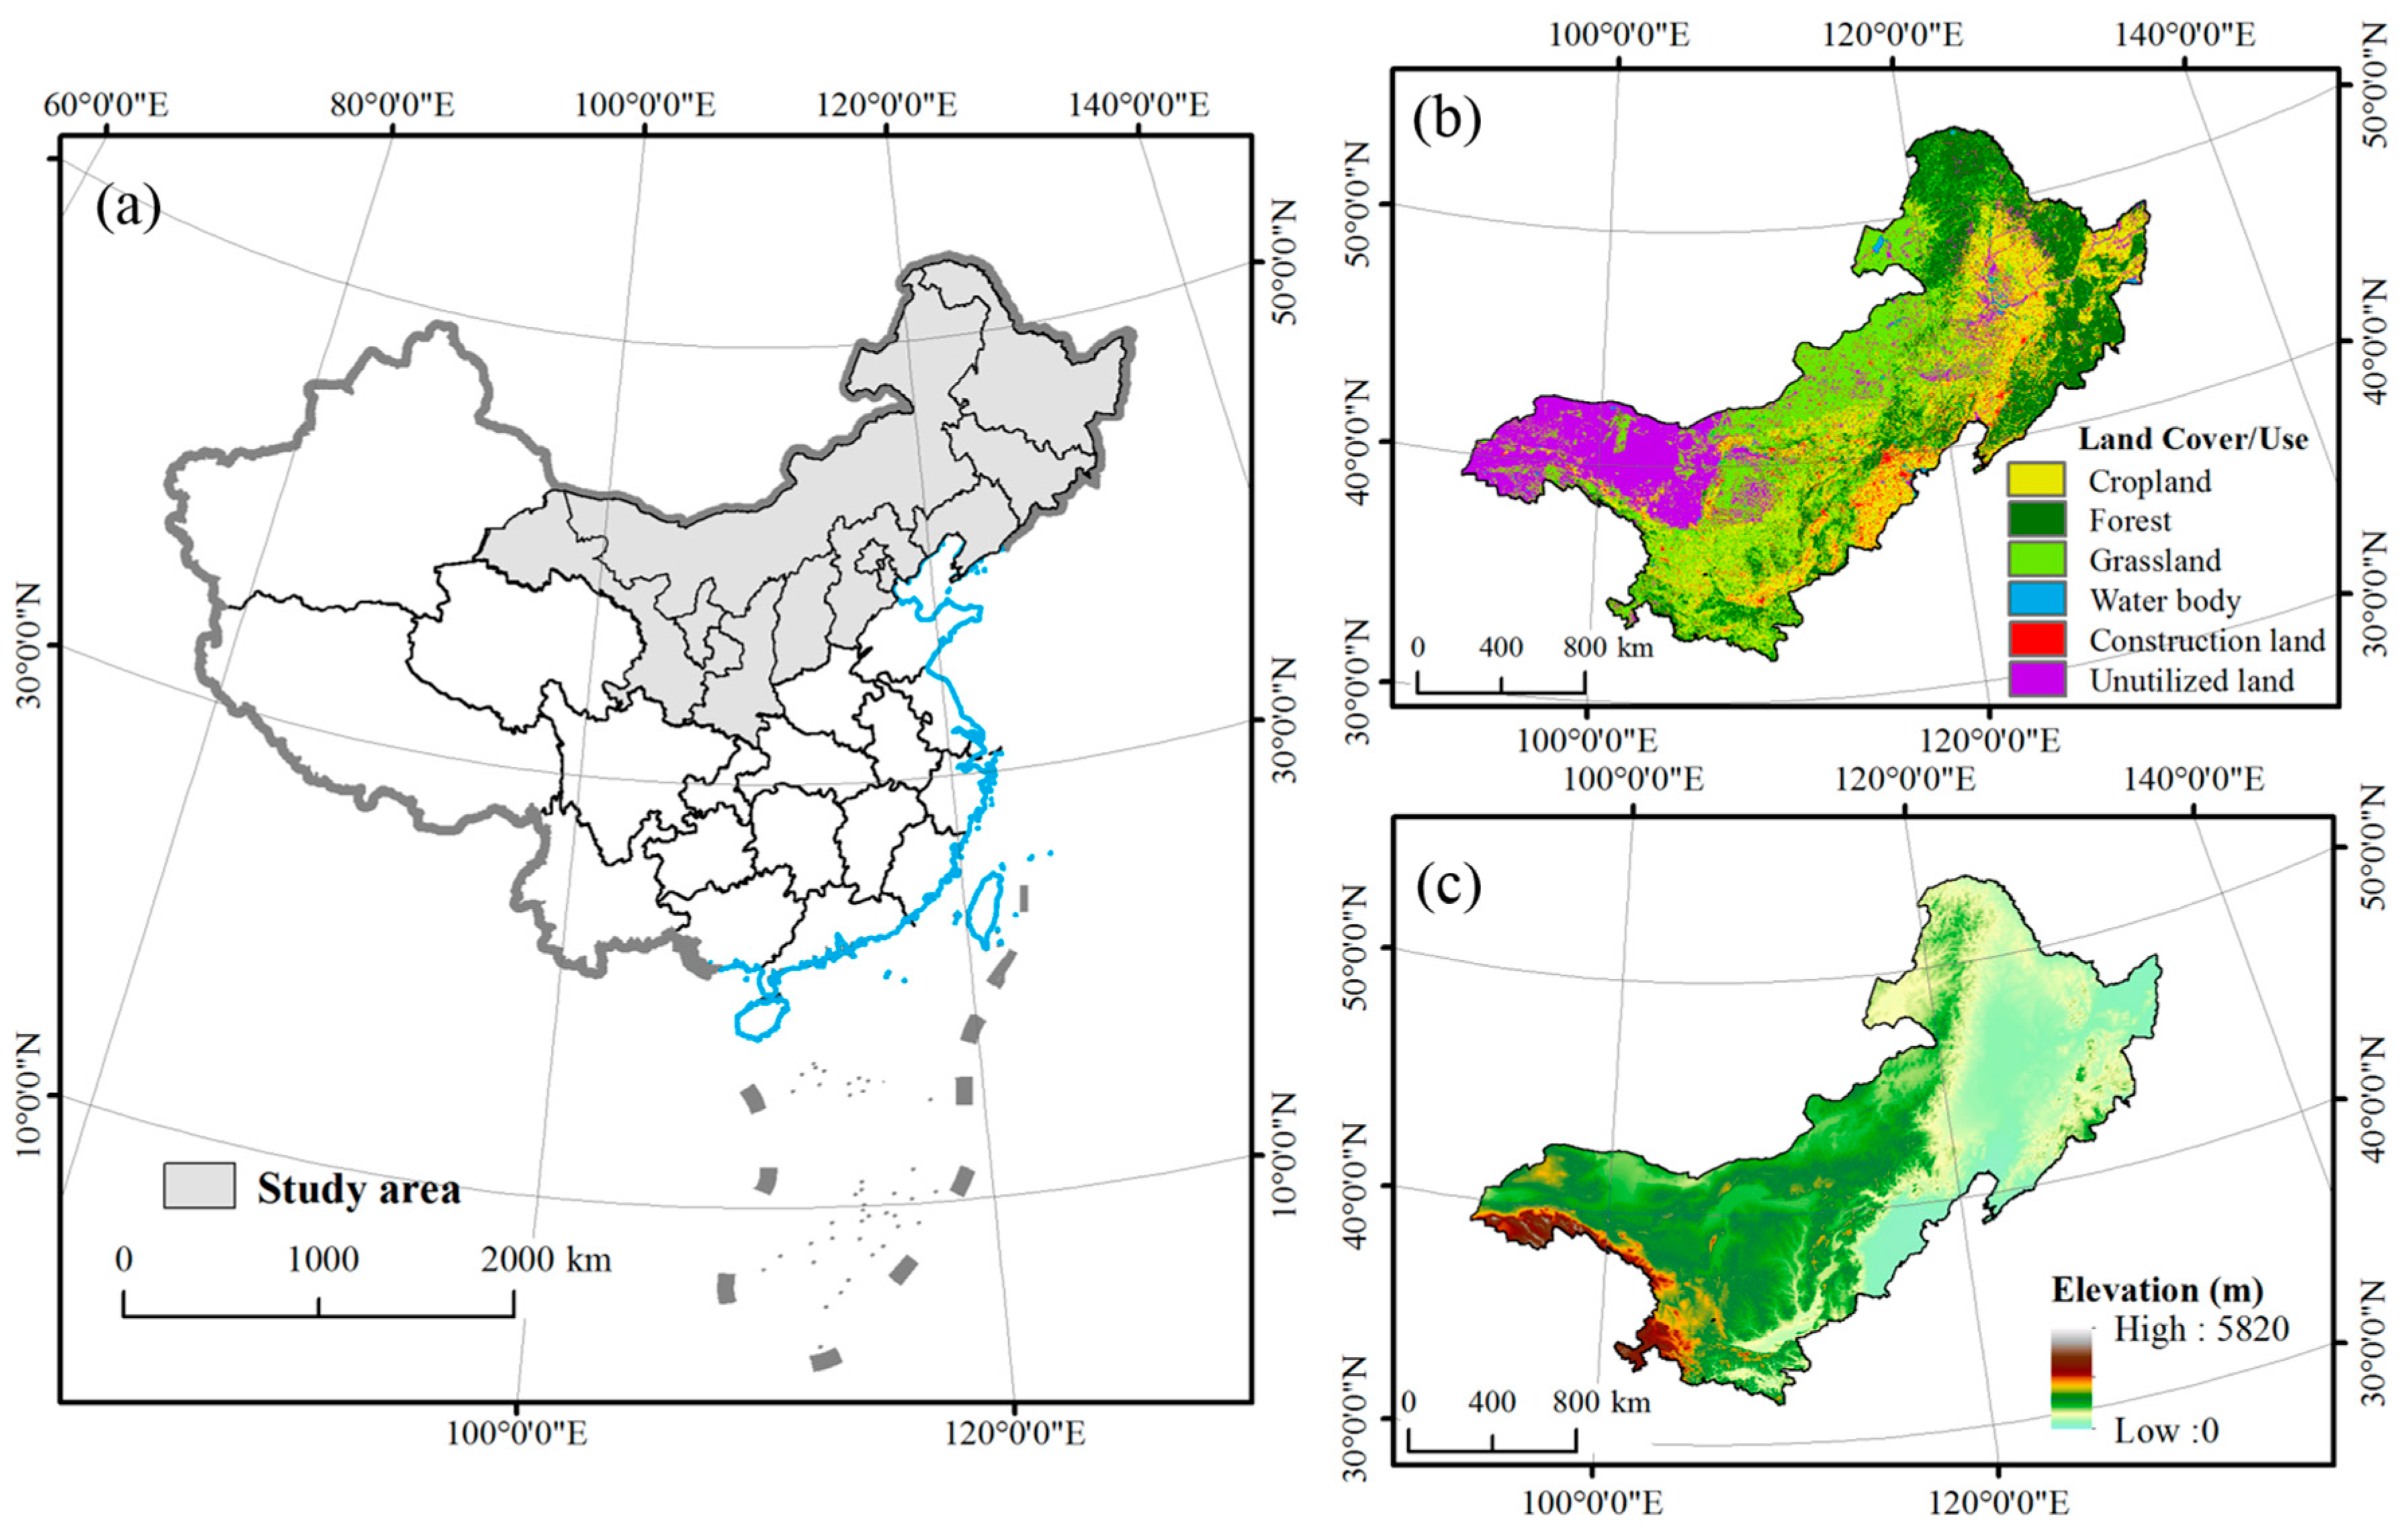
2.1. Study Area

The study area is the temperate grasslands on the Inner Mongolia Plateau (Figure 1a,b), which accounts for more than one-third of grassland area in China. The mean annual precipitation (MAP) of temperate grasslands decreases from 450 mm in northeast to 50 mm in southwest, with 80% falls in the growing season (May to August). The mean annual temperature (MAT) of temperate grasslands ranges from −3 to 9 °C, and the altitude of the temperate grasslands is between 1000 and 2500 m above sea level (Figure 1c). Along the precipitation gradient, the soil types shift from chernozem, chestnut, and meadow soil to brown calcium soil [38]. The vegetation types include meadow, typical, and desert steppes with gradually decreasing biomass and biodiversity. The meadow steppe is dominated by Stipa baicalensis, Leymus chinensis, Filifolium sibiricum, and Stipa grandis. The typical steppe is dominated by S. grandis, L. chinensis, S. krylovii, Cleistogenes squarrosa, Agropyron cristatum, Artemisia frigida, and Caragana microphylla. The dominant species of desert steppe include Stipa klemenzii, Agropyron desertorum, Stipa gobica, Cleistogenes songorica, A. frigida, and Salsola collina [14].

2.2. Data Sources

NDVI data are from Global Inventory Modeling and Mapping Studies (GIMMS_NDVI, 8 × 8 km, 15 days, 1982–2015). The maximum NDVI data, obtained through the maximum value composite (MVC) method [39] from 24 images in the same year and mostly appearing in August, were used to examine the relationships between vegetation growth and precipitation regimes.
Daily precipitation records of 160 stations over 34 years (1982–2015) were obtained from the China Meteorological Data Service Center website (http://data.cma.cn/en) (accessed on 5 June 2023). We excluded the stations that are located in urban areas and those with missing records.
Land cover/use data and digital elevation model (DEM) data were obtained from Resource and Environmental Science Data Center of the Chinese Academy of Sciences (http://www.resdc.cn) (accessed on 5 June 2023). Land cover/use data were extracted from Landsat TM/ETM remote sensing images and generated by manual visual interpretation. DEM data were derived from the Shuttle Radar Topography Mission (SRTM), which has the advantages of being realistic, freely available, and widely used for environmental analysis.
Desertified land distribution dataset in the year of 1975, 1990, 2000, 2005, and 2015 was from National Earth System Science Data Center, National Science & Technology Infrastructure of China (1 × 1 km, http://www.geodata.cn) (accessed on 5 June 2023), which is extracted from Landsat series image data by human–computer interaction, and accuracy rate is more than 90% compared with ground observation and survey. Due to the lack of continuous yearly data, we used those of adjacent years for a rough match, e.g., data from 1975 and 1990 were used to characterize desertification of 1982 and 1995, respectively.

2.3. Data Analysis

Considering the representativeness, we took the mean value of NDVI in a buffer with the radius of 15 km as the NDVI of corresponding meteorological station.
Based on the precipitation records of each station in the growing season (May to August), PECs are defined and calculated as follows: (1) amount of light, moderate, and heavy precipitation events, which is the cumulative amount of precipitation events of <5 mm, 5–10 mm, and >10 mm, respectively; (2) amount of heavy events in different intensities, which is the cumulative amount of precipitation events of 10–20 mm, 20–40 mm, and >40 mm, respectively; (3) mean size of individual precipitation events, calculated as the ratio of annual precipitation amount to the number of precipitation events; (4) annual precipitation frequency and frequency of light, moderate, and heavy precipitation events, which is the number of annual precipitation events and precipitation events of < 5 mm, 5–10 mm, and >10 mm, respectively; (5) frequency of extreme events, in which extreme event is defined as daily precipitation amount exceeding the 99th percentile for the entire 34-year historical records; (6) averaged precipitation interval, in which precipitation interval is the consecutive dry spells between adjacent precipitation events, and averaged precipitation interval is the total days of precipitation interval divided by annual precipitation frequency; (7) frequency and total amount of extreme drought, in which extreme drought is precipitation interval exceeding the 99th percentile for the entire 34-year historical records, and then the frequency and total days of extreme drought are calculated. Note that precipitation events occurring in a day were counted as a single event in this study. Due to the co-linear relation between precipitation amount and precipitation event characteristics, each precipitation event characteristic was divided by growing season precipitation (GSP).
Although there are many afforestation projects in our study area, it is hard to clearly identify all the locations and boundaries. Desertified lands were the main regions where afforestation projects were initiated. As there are ca. 70 yrs of history of desertification control by afforestation in China, the location of afforestation projects in desertified lands was relatively easy to evaluate. We calculated two desertification statuses, i.e., desertification mitigation and intensification, to quantify the effects of afforestation in desertified lands on year-by-year changes of NDVI. Compared with the previous period, we regarded the weakening and disappearance of desertification as desertification mitigation (i.e., afforestation in desertified lands), and the aggravation and emergence of desertification as desertification intensification. In order to match the corresponding NDVI, we took the desertification status of the most area within the radius of 15 km as the desertification status for each meteorological station.
According to the ecological mechanisms, we first evaluate the effects of different indicators of PECs on NDVI in arid or relatively humid regions. For instance, shortened intervals, and thus relieved drought, facilitate the increased NDVI in these arid grasslands. Additionally, according to the bucket model, the decreased frequency and increased size of precipitation will lead to greening, while it may not hold true in relatively humid regions (e.g., GSP > 400 mm). At the sites with greening (significant increase in NDVI), we take PECs and desertification status into account to determine the driving forces. If the effects of PECs (no matter the size, interval, frequency, or amount) are significant and the desertification mitigates, the greening is influenced by both PECs and afforestation. PECs are considered to be the main drivers of greening if they contribute significantly to greening but the desertification intensifies. If the greening is not remarkably related to PECs while the desertification mitigates, afforestation is thought as the key factor for greening. Finally, if the effects of PECs are not evident in the area where desertification is intensified, other factors (e.g., CO2 fertilization, nitrogen deposition, global warming) may dominate the greening.

2.4. Statistical Analysis

We firstly test whether the yearly NDVI, GSP, and PECs have a normal distribution. Most of the observation stations are normally distributed, and only the normal distributed stations were taken in this study.
The simple linear regression model based on the least-squares method was used for the trend analysis of NDVI, GSP, and PECs. A positive slope indicates an upward trend, while a negative slope indicates a downward trend. When the p-value of the slope is less than 0.05, the trend is statistically significant. The NDVI, GSP, and PECs were three-year moving averages to eliminate random fluctuations. The turning points were obtained based on the trend of NDVI, and the significance test of slopes of three periods was conducted by “smatr” package in R software. The results showed that the slopes of regressions between NDVI and years were significantly different among various periods (p < 0.05). The turning points of GSP and PECs were evaluated by that of NDVI.
Pearson correlation coefficients were used to detect the correlation between NDVI and GSP or PECs for each station. For each station, the dominant factor that decided the increase in NDVI was those with the highest positive correlation coefficients and meanwhile an upward trend for the factor per se, and vice versa.

3. Results

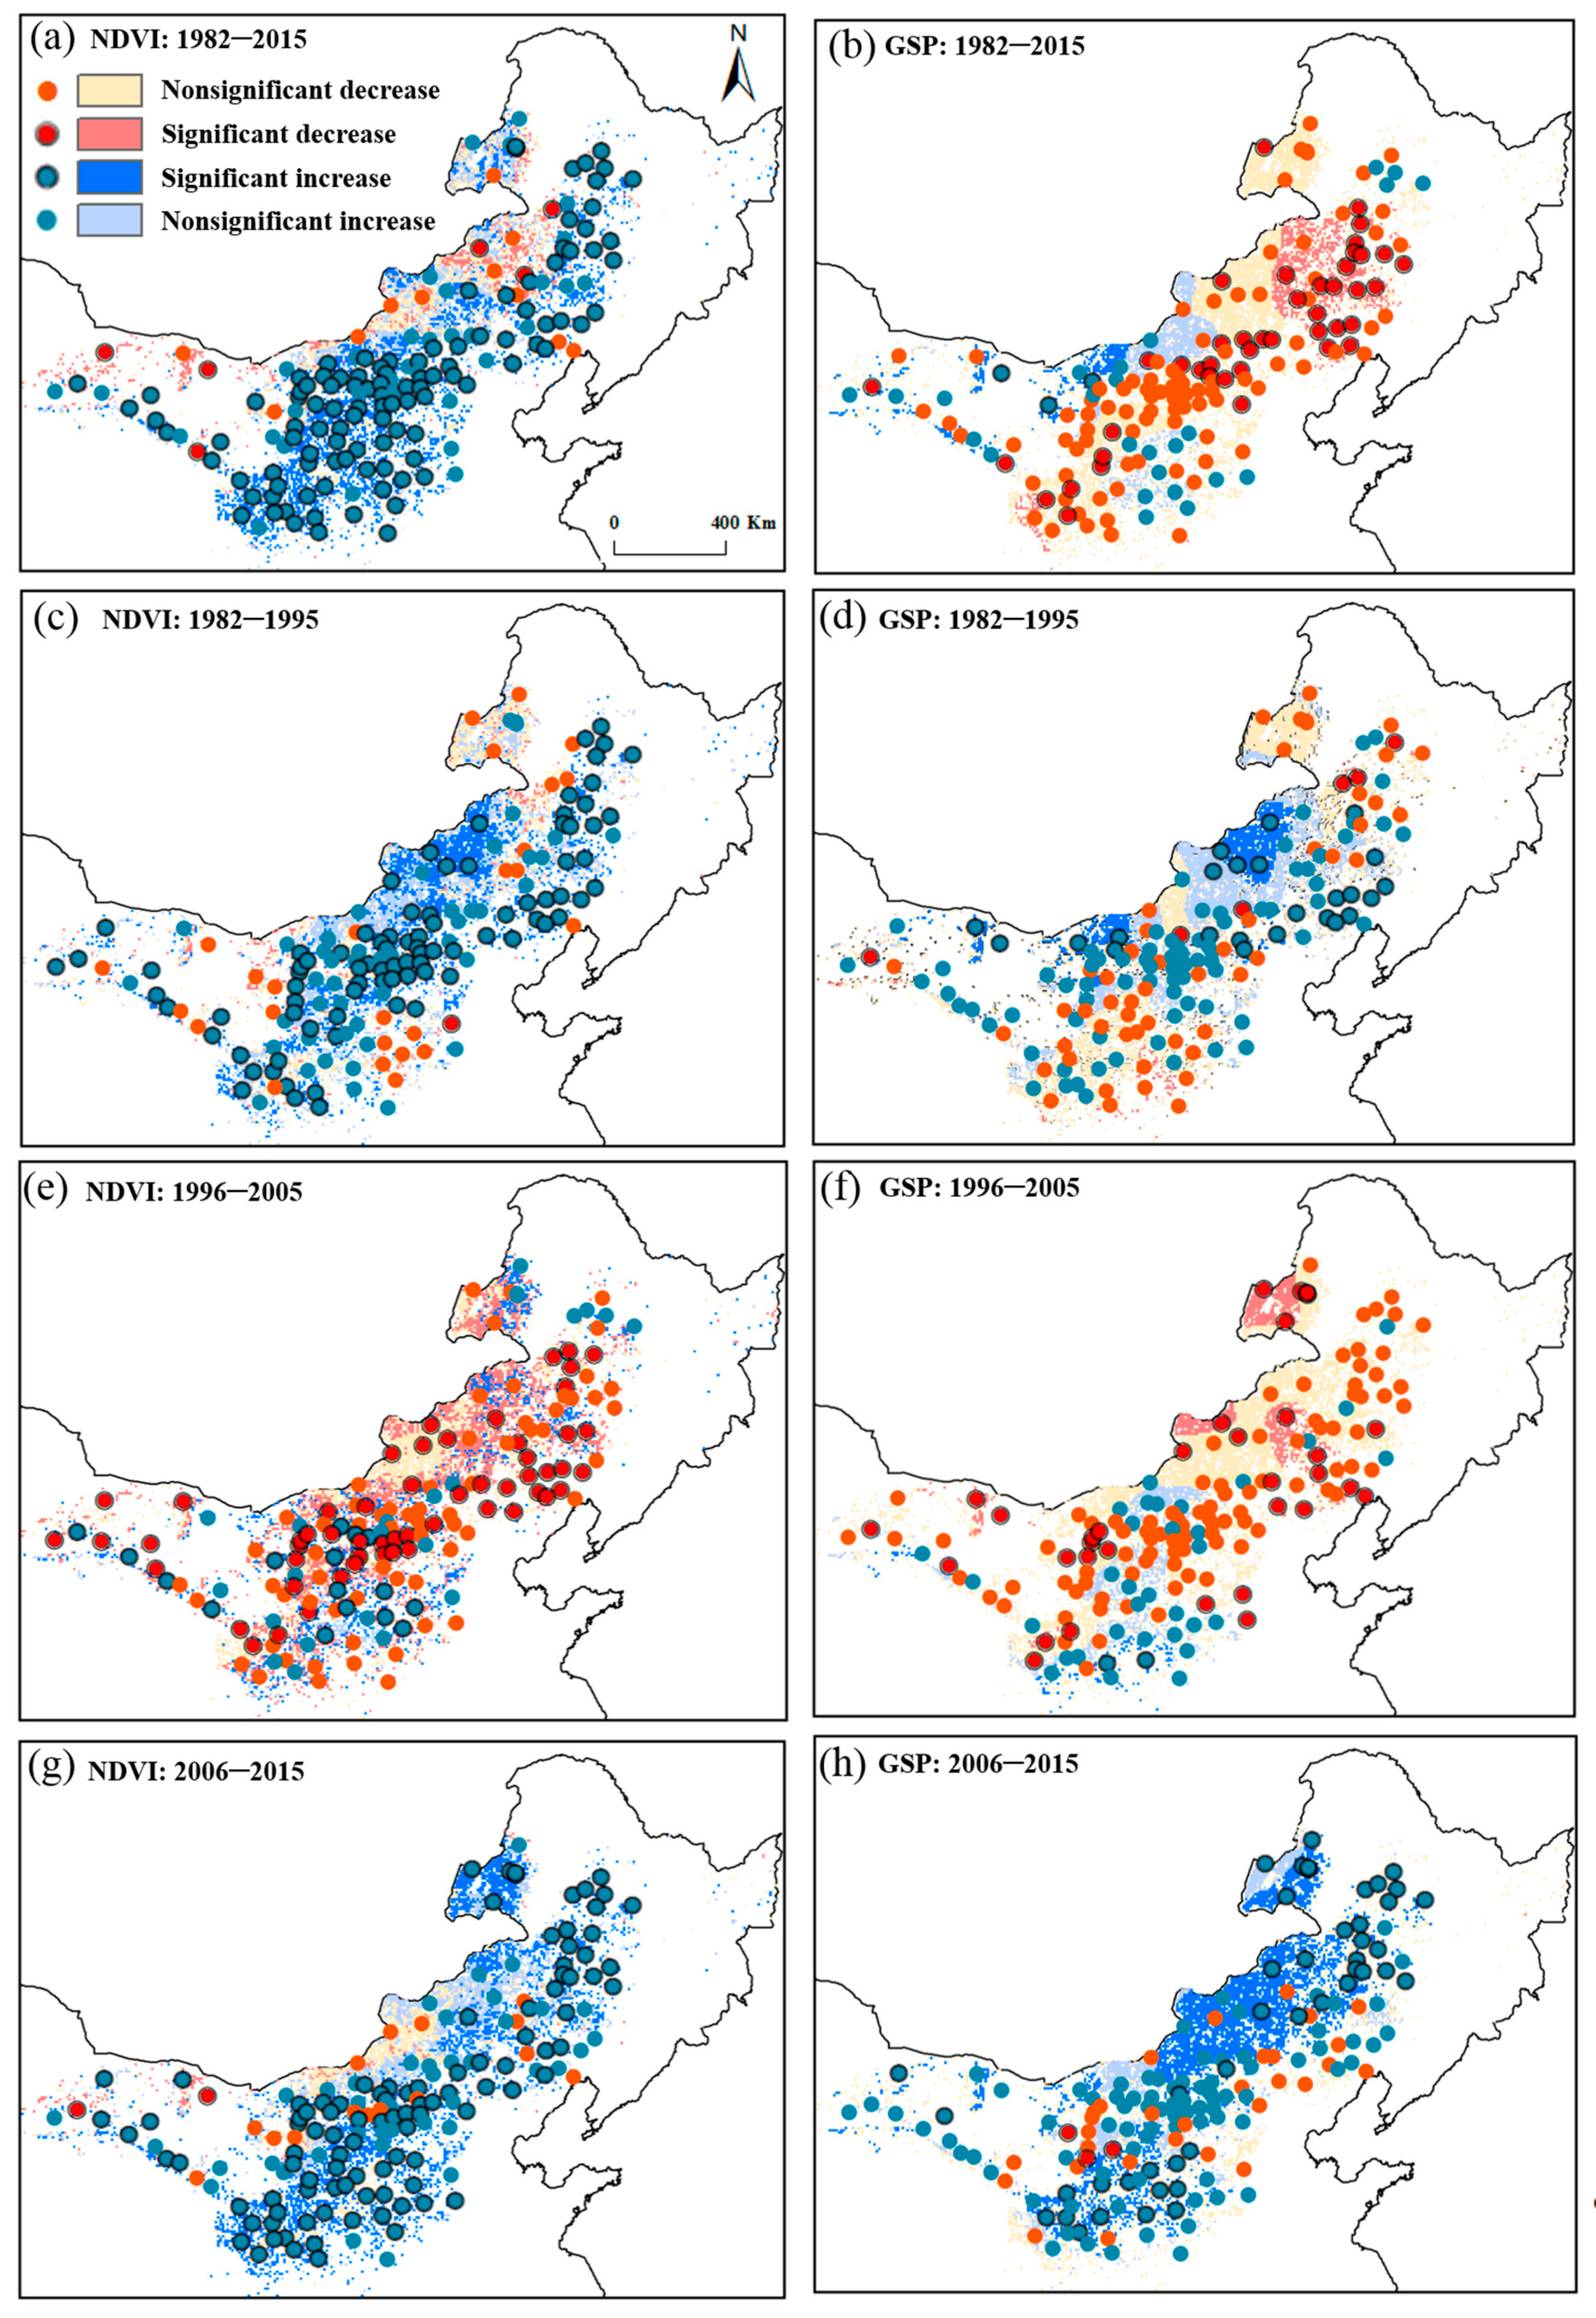
3.1. Interannual Variations of NDVI

Our results showed that NDVI presented a significant increase (R2 = 0.59, p < 0.001, slope = 0.020 10yr−1, Figure 2) during 1982–2015 in most stations (109 of 160 stations, Figure 3a), i.e., greening. However, it did not always increase over the 30 years. NDVI slightly increased (87 stations, Figure 3c) by 0.03456 10yr−1 (R2 = 0.84, p < 0.001) during 1982–1995, then decreased (56 stations, Figure 3e) by −0.0217 10yr−1 (R2 = 0.56, p < 0.05) until 2006, and finally increased with a steeper slope of 0.088 10yr−1 (103 stations, Figure 3g) afterwards (R2 = 0.87, p < 0.001, Figure 2). The slopes of the NDVI–year relationship were significantly different among the three periods (p < 0.05).

3.2. Interannual Variations of Precipitation Regimes

At the same period, there was a significant decrease in growing season precipitation (43 of 160 stations, Figure 3b) at a rate of 0.98 mm yr−1 during 1982–2015 (R2 = 0.16, p < 0.05). According to the turning points of NDVI, GSP only significantly increased (45 stations, Figure 3h) during 2006–2015 (R2 = 0.41, p < 0.001, slope = 4.99 mm yr−1), and with insignificant changes during the 1982–1995 and 1996–2005.
PECs, another important part of precipitation regimes, showed more obvious changes in temperate grasslands of Inner Mongolia (Table 1). Our results suggested that during 1982–2015, annual amount of heavy precipitation events (>10 mm) tended to increase, while that of moderate precipitation events (5–10 mm) decreased significantly (p < 0.05). On the other hand, precipitation frequency tended to decrease while frequency of heavy and extreme precipitation events tended to increase, leading to a more extended precipitation interval between two consecutive events and a significant larger mean size of individual precipitation events (p < 0.05).
During 1982–1995, PECs tended to be larger in size but fewer in number in the whole temperate grasslands (Table 1). Meanwhile, it was obvious that heavy precipitation events (>10 mm) increased in both total amount and frequency, especially events with an intensity above 20 mm. Conversely, light (<5 mm) and moderate precipitation events (5–10 mm) in the study area increased significantly (p < 0.05) accompanied with decreased extreme precipitation events (p < 0.05) during 1996–2005. After that, the trends of most PECs were opposite to before, but without statistical significance (p > 0.05).

3.3. Effects of Precipitation Regimes on Year-by-Year Changes of NDVI

Aspects of precipitation regimes had varied effects on the increase in NDVI. During 1982–2015, NDVI increased with decreased GSP (Figure 3a,b), while only 0.92% of stations with increased NDVI experienced significant increased GSP (Table 2), implying that a significant increase in GSP was not significantly associated with that of NDVI. Interestingly, we found that approximately 28.44% of stations (31 of 109 stations) with increased NDVI was affected by PEC, including positive influence of larger events (heavy and extreme precipitation events) (19.27%, 21 of 109 stations), alleviated extreme drought, and declined light events (8.26%, 9 of 109 stations) (Table 2).
Unlike the whole period, during the period 1982–1995 and 2006–2015, GSP had an impact on the increased NDVI, and almost 8% and 7% of the stations with increased NDVI were actively accompanied with an increased GSP for the two periods, respectively. At the same time, PEC played a vital role in the stations (32–39%) where NDVI increased interannually, in which heavy precipitation events, both in frequency and amount (19.54%), during 1982–1995, and the weakening of extreme droughts and the shortening in precipitation intervals (17.48%) during 2006–2015, played a dominant role at each period. As to the decline in NDVI during 1996–2005, the role of GSP was relatively weakened (5.36%) and PECs remained the vital affecting factor (33%). The decrease in heavy events and the increase in light events are the two dominant aspects of PEC.

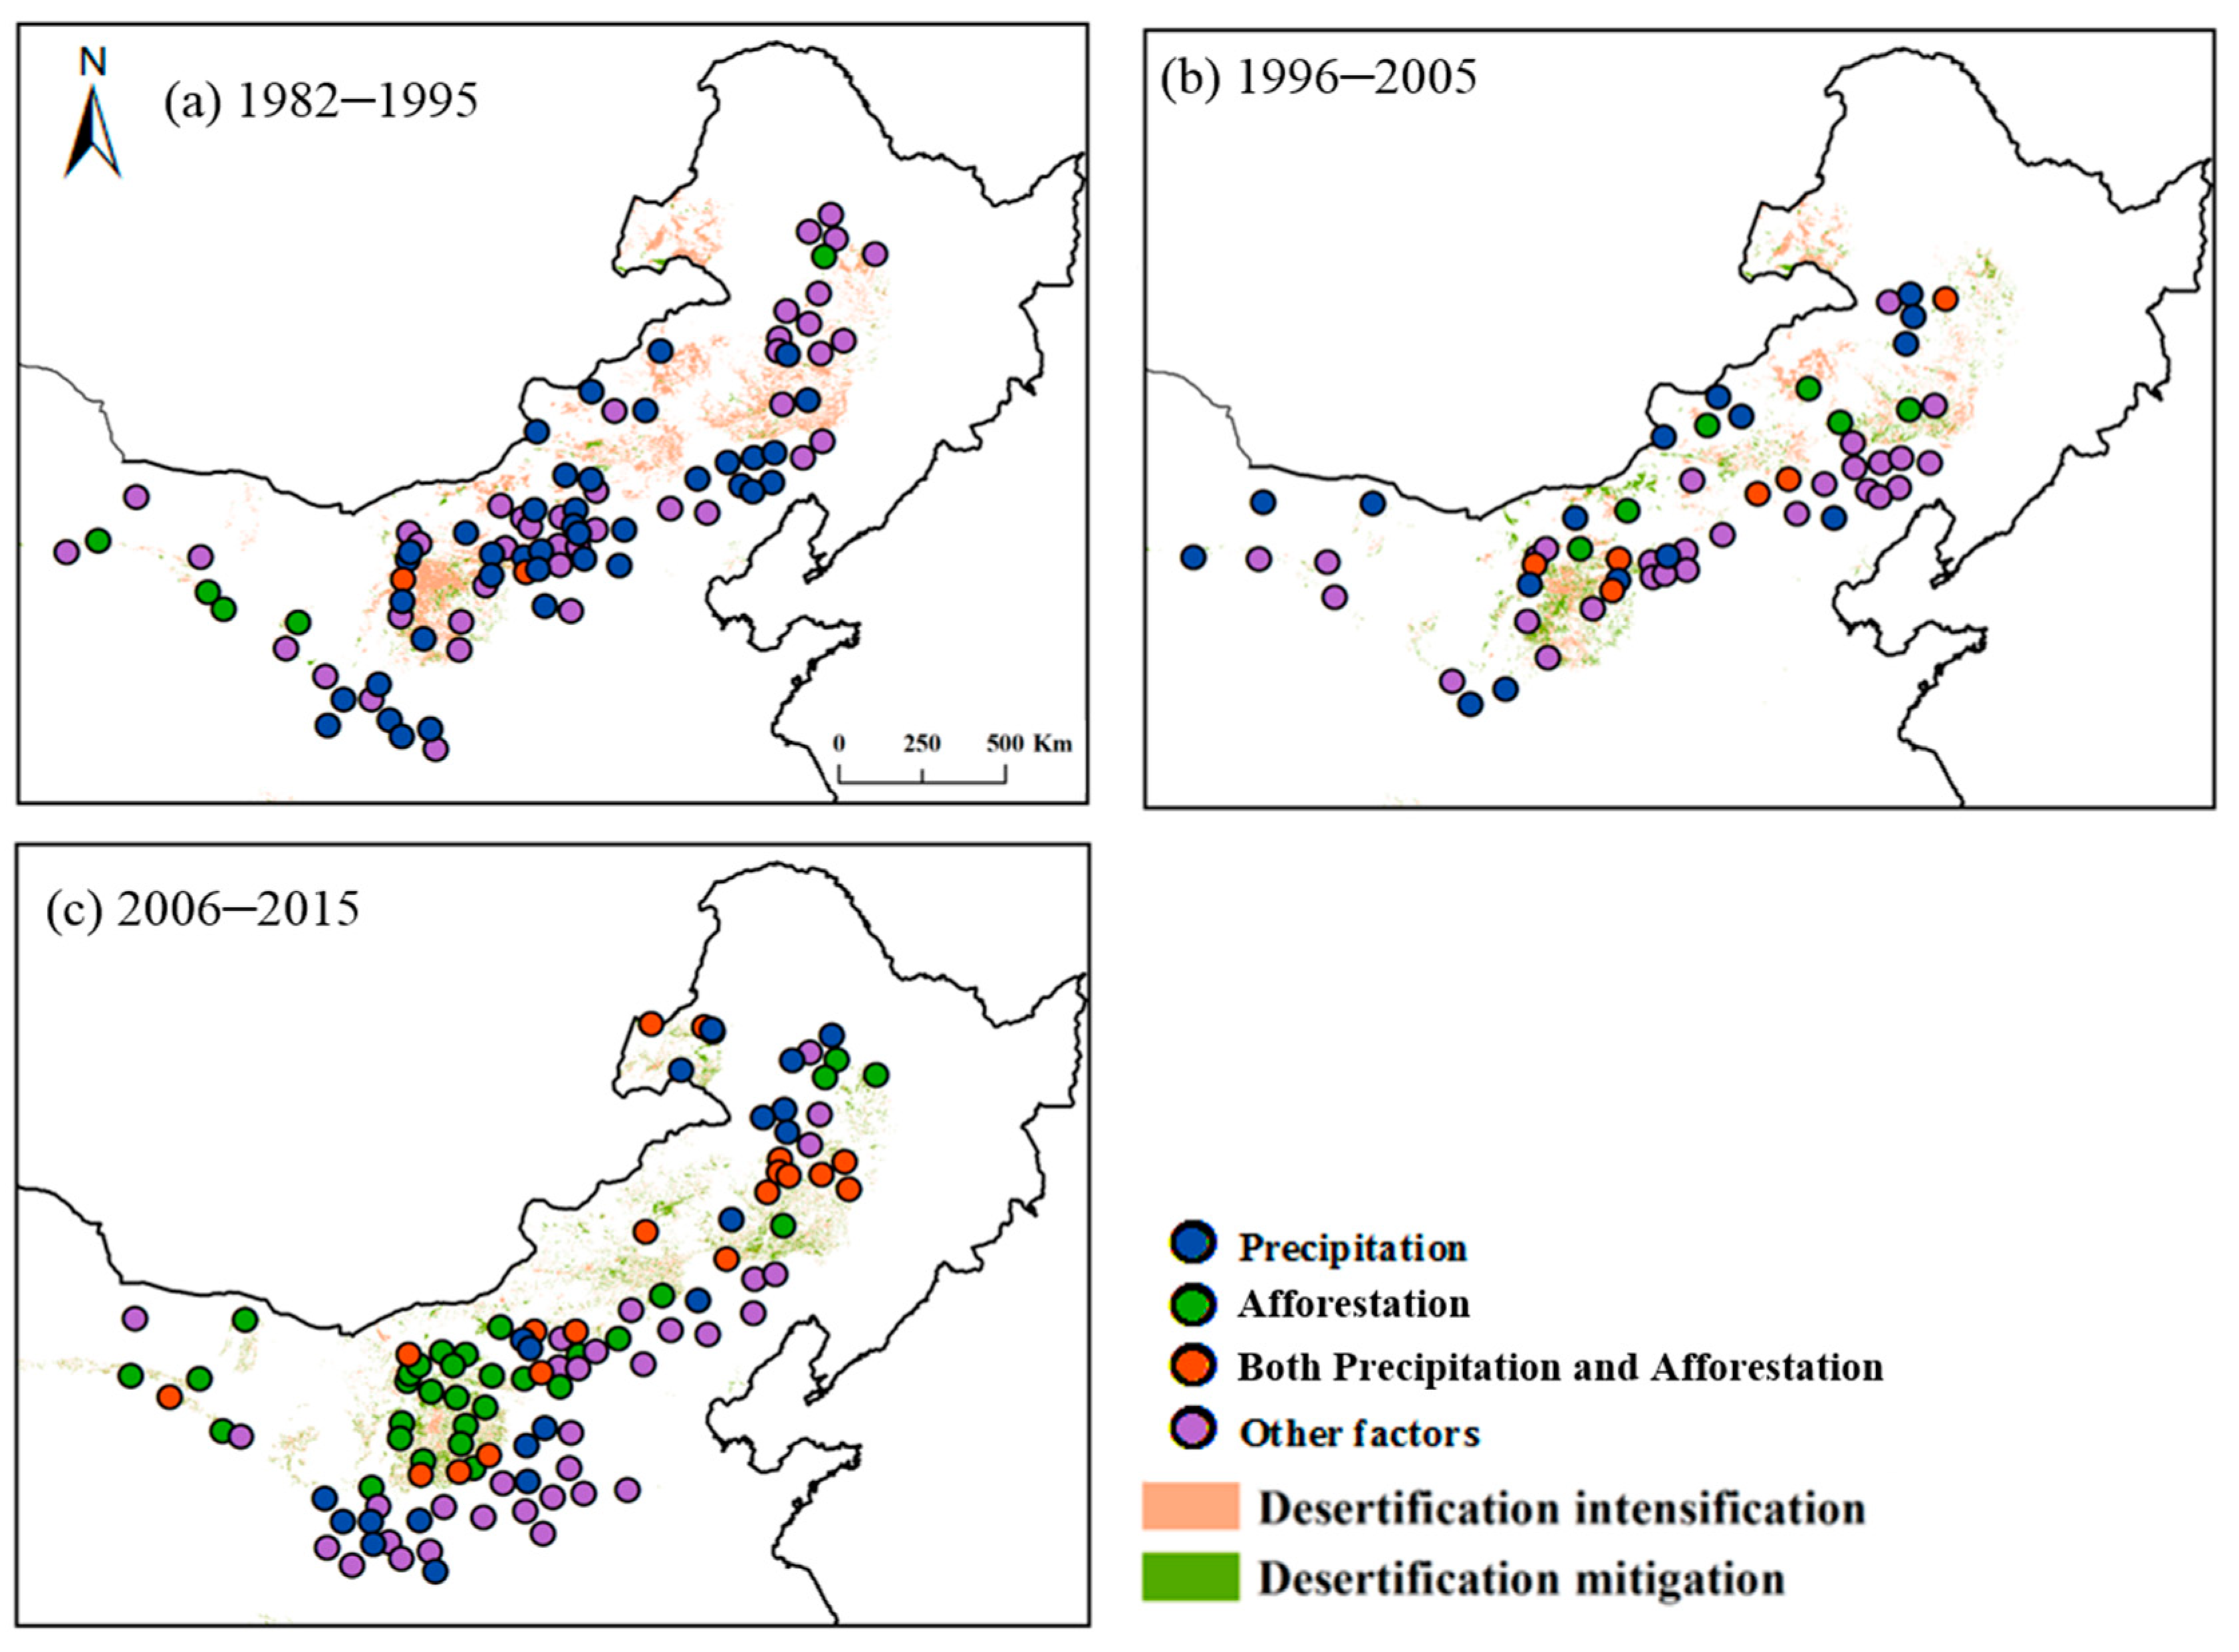
3.4. Comparison between the Effects of Precipitation Regimes and Afforestation Projects on Year-by-Year Changes of NDVI

In addition to precipitation regimes, afforestation projects can also affect the year-by-year changes of NDVI. Afforestation was evident only after 2006, while there was intensified desertification during 1982–1995 (Figure 4). Precipitation contributed more to the greening (41 of 87 stations) during 1982–1995 and the decline of NDVI (22 of 56 stations) during 1996–2005. Only greening of seven stations was affected by afforestation during 1982–1995. Notably, the browning of 12 stations may be ascribed to the intensified desertification during 1996–2005. After 2006, precipitation (40 of 103 stations) and afforestation (51 of 103 stations) contributed almost equally to the increased NDVI. Among them, 20 stations were possibly affected by both precipitation and afforestation.

4. Discussion

4.1. NDVI Increased Significantly in Inner Mongolia Temperate Grasslands during 1982–2015

We found that NDVI increased significantly in the most area of the temperate grasslands during 1982–2015, which was basically consistent with previous studies in Eurasia and northern China [12,40,41]. Additionally, NDVI did not always increase over the 30 years and there was a decrease during 1996–2005, in which the turning point may suggest a sudden change of environmental factors or human activities [12]. Previous studies generally agreed with the fact that there were turning points. For example, it was reported that the greening was either stalled or reversed in 1990s and early 2000s [41,42,43,44,45], which supported our results. However, some studies indicated only one turning point around 2008, in which the differences between the periods before and after the turning point were the growth rates, not the direction of changes [12], which was not fully supported by our observation. Possible reasons may include different data processing methods, various data sources, or specific study regions.

4.2. Increased Precipitation Amount Was Not Significantly Responsible for the Increased NDVI

Contrary to our expectation, our results showed that precipitation amount explained little to the year-by-year increase in NDVI, even in the area where vegetation growth is traditionally constrained by precipitation. Previous studies often suggested that annual precipitation amount or GSP was the predominant climatic factor controlling the spatial or temporal variations in primary production in arid grassland ecosystems [14,38,46,47,48], although productivity was always less sensitive to precipitation in temporal models than that in spatial models [17,18,49]. However, here, we found that previous models do not always work in understanding the year-by-year changes in NDVI, in which NDVI increases significantly without the increase or even decrease in GSP over years. The possible reasons are as follows. Firstly, it may depend on the study periods. As in our study, GSP cannot explain the greening over the 30 years, but it does make some sense in certain periods, i.e., 1982–1995 and 2006–2015. Secondly, other environmental factors may also play a role thereinto. For example, it is reported that the recent global greening may be ascribed to warmer environment [50,51], increased CO2 fertilization [3,52], human activities [29], wind erosion enhanced by land use [53], or increased winter snowfall [54,55], though it may be not evident based on manipulative experiments at specific site (e.g., no fertilization effects of CO2 at a temperate steppe site) [56]. Meanwhile, PECs received less attention in previous studies, although they does exert influence on vegetation. Finally, the underlying mechanisms for the temporal variations and the year-by-year changes are different. The previous temporal model works as long as the temporal variations in precipitation amount are in accordance with those of productivity, but it requires synchronous increase or decrease in precipitation amount and productivity in terms of year-by-year changes.

4.3. The Effects of Precipitation Event Characteristics on Year-by-Year Changes of NDVI

We found that PECs played an important role in the year-by-year variations of NDVI in these water-limited grasslands, of which the positive influence of larger precipitation events (heavy and extreme precipitation events) plays the dominant role, and other PECs included alleviated extreme drought and fewer light precipitation events. This is mostly in accordance with previous findings [57], in which both heavy and light precipitation events are important for greening. These driving forces acted through various mechanisms. Firstly, alleviated extreme drought can increase NDVI by shortening the time periods when ecosystem was limited by water. Secondly, the effects of fewer but larger precipitation events can be explained by the ‘conceptual bucket model’ from Knapp, Beier [25]. The recharged soil water bucket by larger precipitation events and the higher resistance to drought caused by the decreased frequency of precipitation events facilitate productivity in arid ecosystems where the soil water bucket is always stressed. On the contrary, the productivity of humid ecosystems will be limited by the possible drought, while the recharge by the larger rain pulse adds no more benefit because it is already a system in which the bucket is always with water above the stressed threshold [22,24,58]. As the study area is arid, less frequent or larger precipitation events dominate the greening of most stations. This view was supported by an experiment conducted in the grasslands of Inner Mongolia, in which the infiltration depth increased (avoiding evaporation) by 1.06 and 0.79 cm on average for every 1 mm additional rainfall pulse [59], or in periods where the ecosystem was with ample soil water induced by remarkably prolonged larger precipitation events [23]. Lastly, it is difficult for light precipitation events to infiltrate into the deep soil to replenish soil water because it is trapped by the plant canopy and returns to the atmosphere by evaporation [60]; therefore, a lower proportion of light precipitation events, sometimes also accompanied by a higher proportion of larger precipitation events, facilitate higher NDVI. According to the forecasts of IPCC, the precipitation event characteristics tend to be less frequent, larger in size, more extreme, etc., implying continued greening of temperate steppe in the future, and therefore higher ecosystem service and human well-being, according to our results.

4.4. The Role of Afforestation Projects in Greening

Although precipitation regimes (generally PECs) are the dominant factors deciding greening over the 30 years, afforestation projects in desertified lands also explain it to some extent. Combining precipitation regimes (GSP and PECs) and afforestation, we found that precipitation regimes explained more the increase and decline in NDVI during 1982–1995 and 1996–2005, respectively, while there was an equivalent explanatory power of precipitation regimes and afforestation to the increase in NDVI after 2005. The results are in accordance with desertification and its control. Historically intensive grazing due to high demands for food and energy has accelerated grassland degradation in northern China, thus resulting in a considerable loss of aboveground biomass and herbage quality [33,61]. Extremely severe desertification occurred around 2005 when the ecological engineering projects in temperate grassland were extensively initiated [36,62]. Therefore, desertification intensification exerted a negative effect on the growth of NDVI before 2005, and prominently positive effects of afforestation projects on greening were only captured after 2005, which was possibly responsible for the higher growth rate of NDVI after 2005 than that before 1995.
Notably, there are still limitations in our study. Firstly, besides precipitation regimes and afforestation projects, it is worth noting that there are several other ecological projects (e.g., enclosure and rest grazing) and environmental factors (e.g., CO2 concentrations, N depositions, and winter snowfall) uncalculated because of a lack of data. Secondly, our methods cannot clearly split the relative contribution of precipitation regimes and afforestation projects.

5. Conclusions

Combining long-term NDVI data and daily precipitation records over the past three decades, we quantified the interannual variation of NDVI and its driving forces in terms of GSP, PEC, and afforestation projects in temperate grasslands of north China. Firstly, we found that NDVI increased significantly during 1982–2015, i.e., greening, which was in accordance with global greening. Secondly, the greening was accompanied with a significantly decreased precipitation amount, implying a limited role that precipitation might play in this water-limited ecosystem. But we found that the effects of precipitation on greening were not in terms of amount but PECs, in which PECs explained almost one-third of the area of greening. Finally, taking afforestation into consideration, we found that PECs still played dominant roles in the temporal variations of NDVI, but afforestation and precipitation amount also made sense after 2005. Our results emphasize the importance of PEC in clarifying the mechanisms of global greening in arid regions, and other factors should also be paid attention to specific periods. According to the forecasts of precipitation regime and the ecological civilization of China, livelihood and habitat of northern China will be improved.

Author Contributions

Conceptualization, X.G. and Q.G.; methodology, X.G., Q.G. and C.X.; formal analysis, X.G.; resources, Z.H., C.X. and L.S.; writing—original draft preparation, X.G. and Q.G.; writing—review and editing, X.G., Q.G., Z.H., S.L. and S.M.; supervision, Q.G., Z.H., S.L., Q.M. and S.M. All authors have read and agreed to the published version of the manuscript.

Funding

This research was funded by National Natural Science Foundation of China (32161143029, 32171555, 31922053), Strategic Priority Research Program of Chinese Academy of Sciences (Pan-TPE XDA 23060205), and Key Projects of Beijing Academy of Social Sciences (KY2023A0029). And The APC was funded by National Natural Science Foundation of China (32161143029).

Institutional Review Board Statement

Not applicable.

Informed Consent Statement

Not applicable.

Data Availability Statement

Not applicable.

Acknowledgments

This study was jointly supported by the National Natural Science Foundation of China (32161143029, 32171555, 31922053), Strategic Priority Research Program of Chinese Academy of Sciences (Pan-TPE XDA23060205), and Key Projects of Beijing Academy of Social Sciences (KY2023A0029).

Conflicts of Interest

The authors declare no conflict of interest.

References

  1. Piao, S.; Wang, X.; Park, T.; Chen, C.; Lian, X.; He, Y.; Bjerke, J.W.; Chen, A.; Ciais, P.; Tømmervik, H.; et al. Characteristics, drivers and feedbacks of global greening. Nat. Rev. Earth Environ. 2020, 1, 14–27. [Google Scholar] [CrossRef]
  2. Chen, C.; Park, T.; Wang, X.; Piao, S.; Xu, B.; Chaturvedi, R.K.; Fuchs, R.; Brovkin, V.; Ciais, P.; Fensholt, R.; et al. China and India lead in greening of the world through land-use management. Nat. Sustain. 2019, 2, 122–129. [Google Scholar] [CrossRef] [PubMed]
  3. Zhu, Z.; Piao, S.; Myneni, R.B.; Huang, M.; Zeng, Z.; Canadell, J.G.; Ciais, P.; Sitch, S.; Friedlingstein, P.; Arneth, A.; et al. Greening of the Earth and its drivers. Nat. Clim. Chang. 2016, 6, 791–795. [Google Scholar] [CrossRef]
  4. Edwards, R.; Treitz, P. Vegetation greening trends at two sites in the Canadian Arctic: 1984-2015. Arct. Antarct. Alp. Res. 2017, 49, 601–619. [Google Scholar] [CrossRef]
  5. Ghaderpour, E.; Mazzanti, P.; Mugnozza, G.S.; Bozzano, F. Coherency and phase delay analyses between land cover and climate across Italy via the least-squares wavelet software. Int. J. Appl. Earth Obs. Geoinf. 2023, 118, 103241. [Google Scholar] [CrossRef]
  6. Ju, J.C.; Masek, J.G. The vegetation greenness trend in Canada and US Alaska from 1984-2012 Landsat data. Remote Sens. Environ. 2016, 176, 1–16. [Google Scholar] [CrossRef]
  7. Miles, V.V.; Esau, I. Spatial heterogeneity of greening and browning between and within bioclimatic zones in northern West Siberia. Environ. Res. Lett. 2016, 11, 115002. [Google Scholar] [CrossRef]
  8. Yan, Y.; Xin, Z.; Bai, X.; Zhan, H.; Xi, J.; Xie, J.; Cheng, Y. Analysis of Growing Season Normalized Difference Vegetation Index Variation and Its Influencing Factors on the Mongolian Plateau Based on Google Earth Engine. Plants 2023, 12, 2550. [Google Scholar] [CrossRef]
  9. Ahlström, A.; Raupach, M.R.; Schurgers, G.; Smith, B.; Arneth, A.; Jung, M.; Reichstein, M.; Canadell, J.G.; Friedlingstein, P.; Jain, A.K.; et al. The dominant role of semi-arid ecosystems in the trend and variability of the land CO2 sink. Science 2015, 348, 895–899. [Google Scholar] [CrossRef]
  10. Zhao, W.; Yu, X.; Jiao, C.; Xu, C.; Liu, Y.; Wu, G. Increased association between climate change and vegetation index variation promotes the coupling of dominant factors and vegetation growth. Sci. Total Environ. 2021, 767, 144669. [Google Scholar] [CrossRef]
  11. Jin, Y.; Xu, B.; Yang, X.; Qin, Z.; Wu, Q.; Zhao, F.; Chen, S.; Li, J.; Ma, H. MODIS-based vegetation growth of temperate grassland and its correlation with meteorological factors in northern China. Int. J. Remote Sens. 2015, 36, 1–14. [Google Scholar] [CrossRef]
  12. Di, K.; Hu, Z.; Wang, M.; Cao, R.; Liang, M.; Wu, G.; Chen, R.; Hao, G.; Zhao, Y. Recent greening of grasslands in northern China driven by increasing precipitation. J. Plant Ecol. 2021, 14, 843–853. [Google Scholar] [CrossRef]
  13. Wu, Z.; Dijkstra, P.; Koch, G.W.; Peñuelas, J.; Hungate, B.A. Responses of terrestrial ecosystems to temperature and precipitation change: A meta-analysis of experimental manipulation. Glob. Chang. Biol. 2011, 17, 927–942. [Google Scholar] [CrossRef]
  14. Guo, Q.; Hu, Z.; Li, S.; Li, X.; Sun, X.; Yu, G. Spatial variations in aboveground net primary productivity along a climate gradient in Eurasian temperate grassland: Effects of mean annual precipitation and its seasonal distribution. Glob. Chang. Biol. 2012, 18, 3624–3631. [Google Scholar] [CrossRef]
  15. Li, Y.; Wu, D.; Yang, L.; Zhou, T. Declining Effect of Precipitation on the Normalized Difference Vegetation Index of Grasslands in the Inner Mongolian Plateau, 1982–2010. Appl. Sci. 2021, 11, 8766. [Google Scholar] [CrossRef]
  16. Felton, A.J.; Shriver, R.K.; Bradford, J.B.; Suding, K.N.; Allred, B.W.; Adler, P.B. Biotic vs abiotic controls on temporal sensitivity of primary production to precipitation across North American drylands. New Phytol. 2021, 231, 2150–2161. [Google Scholar] [CrossRef] [PubMed]
  17. Estiarte, M.; Vicca, S.; Penuelas, J.; Bahn, M.; Beier, C.; Emmett, B.A.; Fay, P.A.; Hanson, P.J.; Hasibeder, R.; Kigel, J.; et al. Few multiyear precipitation-reduction experiments find ashift in the productivity-precipitation relationship. Glob. Chang. Biol. 2016, 22, 2570–2581. [Google Scholar] [CrossRef] [PubMed]
  18. Knapp, A.K.; Ciais, P.; Smith, M.D. Reconciling inconsistencies in precipitation-productivity relationships: Implications for climate change. New Phytol. 2017, 214, 41–47. [Google Scholar] [CrossRef]
  19. Paruelo, J.M.; Lauenroth, W.K.; Burke, I.C.; Sala, O.E. Grassland Precipitation-Use Efficiency Varies Across a Resource Gradient. Ecosystems 1999, 2, 64–68. [Google Scholar] [CrossRef]
  20. Swemmer, A.M.; Knapp, A.K.; Snyman, H.A. Intra-seasonal precipitation patterns and above-ground productivity in three perennial grasslands. J. Ecol. 2007, 95, 780–788. [Google Scholar] [CrossRef]
  21. Liu, Z.; Wang, J.; Wang, X.; Wang, Y. Understanding the impacts of ‘Grain for Green’ land management practice on land greening dynamics over the Loess Plateau of China. Land Use Policy 2020, 99, 105084. [Google Scholar] [CrossRef]
  22. Heisler-White, J.L.; Blair, J.M.; Kelly, E.F.; Harmoney, K.; Knapp, A.K. Contingent productivity responses to more extreme rainfall regimes across a grassland biome. Glob. Chang. Biol. 2009, 15, 2894–2904. [Google Scholar] [CrossRef]
  23. Guo, Q.; Hu, Z.; Li, S.; Yu, G.; Sun, X.; Zhang, L.; Mu, S.; Zhu, X.; Wang, Y.; Li, Y.; et al. Contrasting responses of gross primary productivity to precipitation events in a water-limited and a temperature-limited grassland ecosystem. Agric. For. Meteorol. 2015, 214, 169–177. [Google Scholar] [CrossRef]
  24. Heisler-White, J.L.; Knapp, A.K.; Kelly, E.F. Increasing precipitation event size increases aboveground net primary productivity in a semi-arid grassland. Oecologia 2008, 158, 129–140. [Google Scholar] [CrossRef] [PubMed]
  25. Knapp, A.K.; Beier, C.; Briske, D.D.; Classen, A.T.; Luo, Y.; Reichstein, M.; Smith, M.D.; Smith, S.D.; Bell, J.E.; Fay, P.A.; et al. Consequences of More Extreme Precipitation Regimes for Terrestrial Ecosystems. BioScience 2008, 58, 811–821. [Google Scholar] [CrossRef]
  26. Mao, X.; Yin, S.; Liu, H. Extreme climate changes and their impact on agricultural production in Shanxi, Shaanxi, and Henan Provinces in recent 61 years. J. Lanzhou Univ. 2023, 59, 71–79. [Google Scholar]
  27. Piao, S.; Zhang, X.; Chen, A.; Liu, Q.; Lian, X.; Wang, X.; Peng, S.; Wu, X. The impacts of climate extremes on the terrestrial carbon cycle: A review. Sci. China Earth Sci. 2019, 49, 1321–1334. [Google Scholar] [CrossRef]
  28. Yin, C.; Yang, F. Variation of Extreme Climate Events in “One Belt and One Road” Region and Its Impact on the Growing Season in Typical Agricultural Regions. Chin. J. Agrometeorol. 2021, 42, 463–474. [Google Scholar]
  29. Hua, W.; Chen, H.; Zhou, L.; Xie, Z.; Qin, M.; Li, X.; Ma, H.; Huang, Q.; Sun, S. Observational Quantification of Climatic and Human Influences on Vegetation Greening in China. Remote Sens. 2017, 9, 425. [Google Scholar] [CrossRef]
  30. Zhang, Y.; Peng, C.; Li, W.-Z.; Tian, L.; Zhu, Q.; Chen, H.; Fang, X.; Zhang, G.; Liu, G.; Mu, X.; et al. Multiple afforestation programs accelerate the greenness in the ‘Three North’ region of China from 1982 to 2013. Ecol. Indic. 2016, 61, 404–412. [Google Scholar] [CrossRef]
  31. Chen, X.N.; Tao, X.; Yang, Y.P. Distribution and Attribution of Gross Primary Productivity Increase Over the Mongolian Plateau, 2001-2018. IEEE Access 2022, 10, 25125–25134. [Google Scholar] [CrossRef]
  32. Niu, Q.; Xiao, X.; Zhang, Y.; Qin, Y.; Dang, X.; Wang, J.; Zou, Z.; Doughty, R.B.; Brandt, M.; Tong, X.; et al. Ecological engineering projects increased vegetation cover, production, and biomass in semiarid and subhumid Northern China. Land Degrad. Dev. 2019, 30, 1620–1631. [Google Scholar] [CrossRef]
  33. Lu, F.; Hu, H.; Sun, W.; Zhu, J.; Liu, G.; Zhou, W.; Zhang, Q.; Shi, P.; Liu, X.; Wu, X.; et al. Effects of national ecological restoration projects on carbon sequestration in China from 2001 to 2010. Proc. Natl. Acad. Sci. USA 2018, 115, 4039–4044. [Google Scholar] [CrossRef]
  34. Tan, M.; Li, X. Does the Green Great Wall effectively decrease dust storm intensity in China? A study based on NOAA NDVI and weather station data. Land Use Policy 2015, 43, 42–47. [Google Scholar] [CrossRef]
  35. Qiu, B.; Chen, G.; Tang, Z.; Lu, D.; Wang, Z.; Chen, C. Assessing the Three-North Shelter Forest Program in China by a novel framework for characterizing vegetation changes. ISPRS J. Photogramm. Remote Sens. 2017, 133, 75–88. [Google Scholar] [CrossRef]
  36. Shao, Q.; Liu, S.; Ning, J.; Liu, G.; Yang, F.; Zhang, X.; Niu, L.; Huang, H.; Fan, J.; Liu, J. Assessment of ecological benefits of key national ecological projects in China in 2000-2019 using remote sensing. Acta Geogr. Sin. 2022, 77, 2133–2153. [Google Scholar]
  37. Liu, X.; Xin, L. China’s deserts greening and response to climate variability and human activities. PLoS ONE 2021, 16, e0256462. [Google Scholar] [CrossRef]
  38. Hu, Z.; Fan, J.; Zhong, H.; Yu, G. Spatiotemporal dynamics of aboveground primary productivity along a precipitation gradient in Chinese temperate grassland. Sci. China Ser. D Earth Sci. 2007, 50, 754–764. [Google Scholar] [CrossRef]
  39. Holben, B.N. Characteristics of maximum-value composite images from temporal AVHRR data. Int. J. Remote Sens. 1986, 7, 1417–1434. [Google Scholar] [CrossRef]
  40. Chen, B.; Xu, G.; Coops, N.C.; Ciais, P.; Innes, J.L.; Wang, G.; Myneni, R.B.; Wang, T.; Krzyzanowski, J.; Li, Q.; et al. Changes in vegetation photosynthetic activity trends across the Asia–Pacific region over the last three decades. Remote Sens. Environ. 2014, 144, 28–41. [Google Scholar] [CrossRef]
  41. Pan, N.; Feng, X.; Fu, B.; Wang, S.; Ji, F.; Pan, S. Increasing global vegetation browning hidden in overall vegetation greening: Insights from time-varying trends. Remote Sens. Environ. 2018, 214, 59–72. [Google Scholar] [CrossRef]
  42. Piao, S.; Wang, X.; Ciais, P.; Zhu, B.; Wang, T.; Liu, J. Changes in satellite-derived vegetation growth trend in temperate and boreal Eurasia from 1982 to 2006. Glob. Chang. Biol. 2011, 17, 3228–3239. [Google Scholar] [CrossRef]
  43. Peng, S.S.; Chen, A.P.; Xu, L.; Cao, C.X.; Fang, J.Y.; Myneni, R.B.; Pinzon, J.E.; Tucker, C.J.; Piao, S.L. Recent change of vegetation growth trend in China. Environ. Res. Lett. 2011, 6, 44027. [Google Scholar] [CrossRef]
  44. Bao, G.; Qin, Z.; Bao, Y.; Zhou, Y.; Li, W.; Sanjjav, A. NDVI-Based Long-Term Vegetation Dynamics and Its Response to Climatic Change in the Mongolian Plateau. Remote Sens. 2014, 6, 8337–8358. [Google Scholar] [CrossRef]
  45. Yuan, W.; Zheng, Y.; Piao, S.; Ciais, P.; Lombardozzi, D.; Wang, Y.; Ryu, Y.; Chen, G.; Dong, W.; Hu, Z.; et al. Increased atmospheric vapor pressure deficit reduces global vegetation growth. Sci. Adv. 2019, 5, eaax1396. [Google Scholar] [CrossRef]
  46. Zhao, X.; Tan, K.; Zhao, S.; Fang, J. Changing climate affects vegetation growth in the arid region of the northwestern China. J. Arid. Environ. 2011, 75, 946–952. [Google Scholar] [CrossRef]
  47. Fang, J.; Piao, S.; Zhou, L.; He, J.; Wei, F.; Myneni, R.B.; Tucker, C.J.; Tan, K. Precipitation patterns alter growth of temperate vegetation. Geophys. Res. Lett. 2005, 32. [Google Scholar] [CrossRef]
  48. Li, C.; Li, L.; Wu, X.; Tsunekawa, A.; Wei, Y.; Liu, Y.; Peng, L.; Chen, J.; Bai, K. Increasing precipitation promoted vegetation growth in the Mongolian Plateau during 2001–2018. Front. Environ. Sci. 2023, 11, 1153601. [Google Scholar] [CrossRef]
  49. Knapp, A.K.; Smith, M.D. Variation among biomes in temporal dynamics of aboveground primary production. Science 2001, 91, 481–484. [Google Scholar] [CrossRef]
  50. Keenan, T.F.; Riley, W.J. Greening of the land surface in the world’s cold regions consistent with recent warming. Nat. Clim. Chang. 2018, 8, 825. [Google Scholar] [CrossRef]
  51. Zhou, W.; Gang, C.; Chen, Y.; Mu, S.; Sun, Z.; Li, J. Grassland coverage inter-annual variation and its coupling relation with hydrothermal factors in China during 1982–2010. J. Geogr. Sci. 2014, 24, 593–611. [Google Scholar] [CrossRef]
  52. Piao, S.; Yin, G.; Tan, J.; Cheng, L.; Huang, M.; Li, Y.; Liu, R.; Mao, J.; Myneni, R.B.; Peng, S.; et al. Detection and attribution of vegetation greening trend in China over the last 30 years. Glob. Chang. Biol. 2015, 21, 1601–1609. [Google Scholar] [CrossRef] [PubMed]
  53. Li, P.; Liu, L.; Wang, J.; Wang, Z.; Wang, X.; Bai, Y.; Chen, S. Wind erosion enhanced by land use changes significantly reduces ecosystem carbon storage and carbon sequestration potentials in semiarid grasslands. Land Degrad. Dev. 2018, 29, 3469–3478. [Google Scholar] [CrossRef]
  54. Peng, S.; Piao, S.; Ciais, P.; Fang, J.; Wang, X. Change in winter snow depth and its impacts on vegetation in China. Glob. Chang. Biol. 2010, 16, 3004–3013. [Google Scholar] [CrossRef]
  55. Wang, X.; Wang, T.; Guo, H.; Liu, D.; Zhao, Y.; Zhang, T.; Liu, Q.; Piao, S. Disentangling the mechanisms behind winter snow impact on vegetation activity in northern ecosystems. Glob. Chang. Biol. 2018, 24, 1651–1662. [Google Scholar] [CrossRef] [PubMed]
  56. Song, J.; Wan, S.; Piao, S.; Hui, D.; Hovenden, M.J.; Ciais, P.; Liu, Y.; Liu, Y.; Zhong, M.; Zheng, M.; et al. Elevated CO2 does not stimulate carbon sink in a semi-arid grassland. Ecol. Lett. 2019, 22, 458–468. [Google Scholar] [CrossRef] [PubMed]
  57. Yuan, X.; Li, L.; Chen, X.; Shi, H. Effects of Precipitation Intensity and Temperature on NDVI-Based Grass Change over Northern China during the Period from 1982 to 2011. Remote Sens. 2015, 7, 10164–10183. [Google Scholar] [CrossRef]
  58. Shinoda, M.; Nandintsetseg, B. Soil moisture and vegetation memories in a cold, arid climate. Glob. Planet. Chang. 2011, 79, 110–117. [Google Scholar] [CrossRef]
  59. Chen, M.; Zhang, B.; Ren, T.; Wang, S.; Chen, S. Responses of soil moisture to precipitation pattern change in semiarid grasslands in Nei Mongol, China. Chin. J. Plant Ecol. 2016, 40, 658–668. [Google Scholar]
  60. Lauenroth, W.K.; Sala, O.E. Long-term forage production of north-american shortgrass steppe. Ecol. Appl. 1992, 2, 397–403. [Google Scholar] [CrossRef]
  61. Houghton, R.A.; Hackler, J.L. Sources and sinks of carbon from land-use change in China. Glob. Biogeochem. Cycles 2003, 17. [Google Scholar] [CrossRef]
  62. Wang, T. Atlas of Sandy Desert and Aeolian Desertification in Northern China; Science Press: Beijing, China, 2015. (In Chinese) [Google Scholar]
Figure 1. Location (a), land cover/use type (b), and elevation (c) of the study area.
Remotesensing 15 04621 g001
Figure 2. Year-by-year changes of NDVI and GSP during 1982–2015 in temperate grasslands on the Inner Mongolia Plateau, China. Note: R2, p-value and slopes are for the entire period.
Remotesensing 15 04621 g002
Figure 3. The spatial patterns of growth rates in NDVI (a,c,e,g) and GSP (b,d,f,h) during 1982–2015 (a,b), 1982–1995 (c,d), 1996–2005 (e,f), and 2006–2015 (g,h) in temperate grasslands on the Inner Mongolia Plateau, China. The circles and rectangles in the legend refer to the analysis at station and region, respectively.
Remotesensing 15 04621 g003
Figure 4. Comparison between the effects of precipitation regimes and afforestation on year-by-year changes of NDVI during 1982–1995 (a), 1996–2005 (b), and 2006–2015 (c) in temperate grasslands on the Inner Mongolia Plateau, China.
Remotesensing 15 04621 g004
Table 1. Interannual variations of precipitation event characteristics in temperate grasslands on the Inner Mongolia Plateau, China.
Precipitation Event Characteristics1982–20151982–19951996–20052006–2015
Precipitation intensityAmount of <5 mm rainfall events (light)+-+-
Amount of 5–10 mm rainfall events (moderate)--+-
Amount of 10–20 mm rainfall events+-+-
Amount of 20–40 mm rainfall events++-+
Amount of >40 mm rainfall events++-+
Amount of >10 mm rainfall events (heavy)++-+
Mean size of individual precipitation events+++-
Mean size of light events+-+-
Mean size of moderate events+-+-
Mean size of heavy events+-+-
Precipitation frequencyAnnual precipitation frequency--+-
Frequency of <5 mm events (light)--+-
Frequency of 5–10 mm events (moderate)--+-
Frequency of >10 mm events (heavy)+++-
Frequency of extreme events ++-+
Precipitation intervalAveraged precipitation interval+-+-
Frequency of extreme drought +++-
Total days of extreme droughts+++-
Note: ‘+’ and ‘-’ represent upward and downward trend in varied periods. Red signal means that trend is statistically significant (p < 0.05).
Table 2. The ratio (number) of stations where precipitation regimes lead the year-by-year changes of NDVI in temperate grasslands on the Inner Mongolia Plateau, China.
Relationships between Precipitation Regimes and NDVIYear-by-Year Changes of Precipitation Regimes1982–20151982–1995 (P1)1996–2005 (P2)2006–2015 (P3)
Ratio (Number)Correlation CoefficientRatio (Number)Correlation CoefficientRatio (Number)Correlation CoefficientRatio (Number)Correlation Coefficient
PositiveIncreased GSP (decreased in P2)0.92 (1)0.668.05 (7)0.65 ± 0.15.36 (3)0.75 ± 0.096.8 (7)0.7 ± 0.09
Increased heavy events both in frequency and amount (decreased in P2)15.60 (17)0.37 ± 0.0619.54 (17)0.59 ± 0.0919.64 (11)0.7 ± 0.110.68 (11)0.71 ± 0.08
Increased extreme events (decreased in P2)3.67 (4)0.44 ± 0.12.3 (2)0.74 ± 0.11.79 (1)0.721.94 (2)0.72 ± 0.16
Total20.19 (22)-29.89 (26)-26.79 (15)-19.42 (20)-
NegativeAlleviated extreme drought and shortened precipitation intervals
(increased in P2)
3.67 (4)−0.4 ± 0.063.45 (3)−0.75 ± 0.08--17.48 (18)−0.76 ± 0.1
Declined total event frequency
(increased in P2)
0.92 (1)−0.515.75 (5)−0.62 ± 0.1----
Declined light events
(increased in P2)
4.59 (5)−0.4 ± 0.078.05 (7)−0.64 ± 0.0612.5 (7)−0.71 ± 0.041.94 (2)−0.71 ± 0.04
Total9.17 (10)-17.24 (15)-12.5 (7)-19.42 (20)-
Note: The value after ‘±’ refers to the standard error of the correlation coefficient.
Disclaimer/Publisher’s Note: The statements, opinions and data contained in all publications are solely those of the individual author(s) and contributor(s) and not of MDPI and/or the editor(s). MDPI and/or the editor(s) disclaim responsibility for any injury to people or property resulting from any ideas, methods, instructions or products referred to in the content.

