Comment

Comment on Blagoveshchenskaya et al. Artificial Ducts Created via High-Power HF Radio Waves at EISCAT. Remote Sens. 2023, 15, 2300

1
EISCAT Scientific Association, 9027 Ramfjordbotn, Norway
2
Independent Researcher, Lancaster LA1 2RX, UK
*
Author to whom correspondence should be addressed.
Remote Sens. 2023, 15(17), 4294; https://doi.org/10.3390/rs15174294
Submission received: 8 June 2023 / Revised: 23 August 2023 / Accepted: 27 August 2023 / Published: 31 August 2023

Abstract

:
The claim that incoherent scatter radar data show electron density enhancements of 50–80% during some ionospheric heating experiments in a recent paper is questioned. The backscatter from the monostatic radar can indeed be enhanced during these experiments, but the conclusion that a large electron density increase is the cause is almost certainly wrong. Some natural plasma line data are presented in support of our claim. Previously published studies of similar events and a possible explanation for the observed increases in backscattered power are pointed out.

1. Introduction

In a recent paper [1] the authors present data from the EISCAT incoherent scatter radar during an ionospheric heating experiment which they claim shows evidence of artificial ducts caused by the heating experiment. The bulk of the evidence is in the apparent electron density enhancements of about 50–80% above the background density given by the standard analysis of the received radar signals. The data are interesting but we argue that these density enhancements are almost certainly not real. We point out a published alternative explanation for the observations.

2. Other Studies

Two similar observations to those presented [1] were studied in detail [2] where the authors showed that the apparent electron density enhancements measured by the EISCAT UHF radar were not real because (a) in one case the natural plasma line (PL) frequency, which is a more accurate measurement than that provided by the ion line backscattered power, did not show an enhancement, and (b) in the second case the analysis of the data received in a bistatic remote receiver did not show any enhancement. In both cases, the transmitted radar beam was pointed along the magnetic field line direction. The backscattered power in the monostatic radar cases is indeed enhanced, but not because of an enhanced electron density, which is the result that the standard analysis gives. No explanation of the observations was given in [2]. Such apparent density enhancements were seen quite often during heating experiments. The enhancements are in the power of the backscattered ion line so they are sometimes called wide altitude ion line enhancements or WAILEs for short. A statistical study of similar events to those presented in [1,2] was made and a possible explanation was offered in [3]. Unfortunately, neither of these references [2,3] was mentioned in the study [1]. Examination of the natural PL frequency data for the heights where the enhanced backscatter is observed in [1], assuming that they are strong enough, will almost certainly show that there were no density enhancements of 50–80%. We now present some PL data in support of our claim.

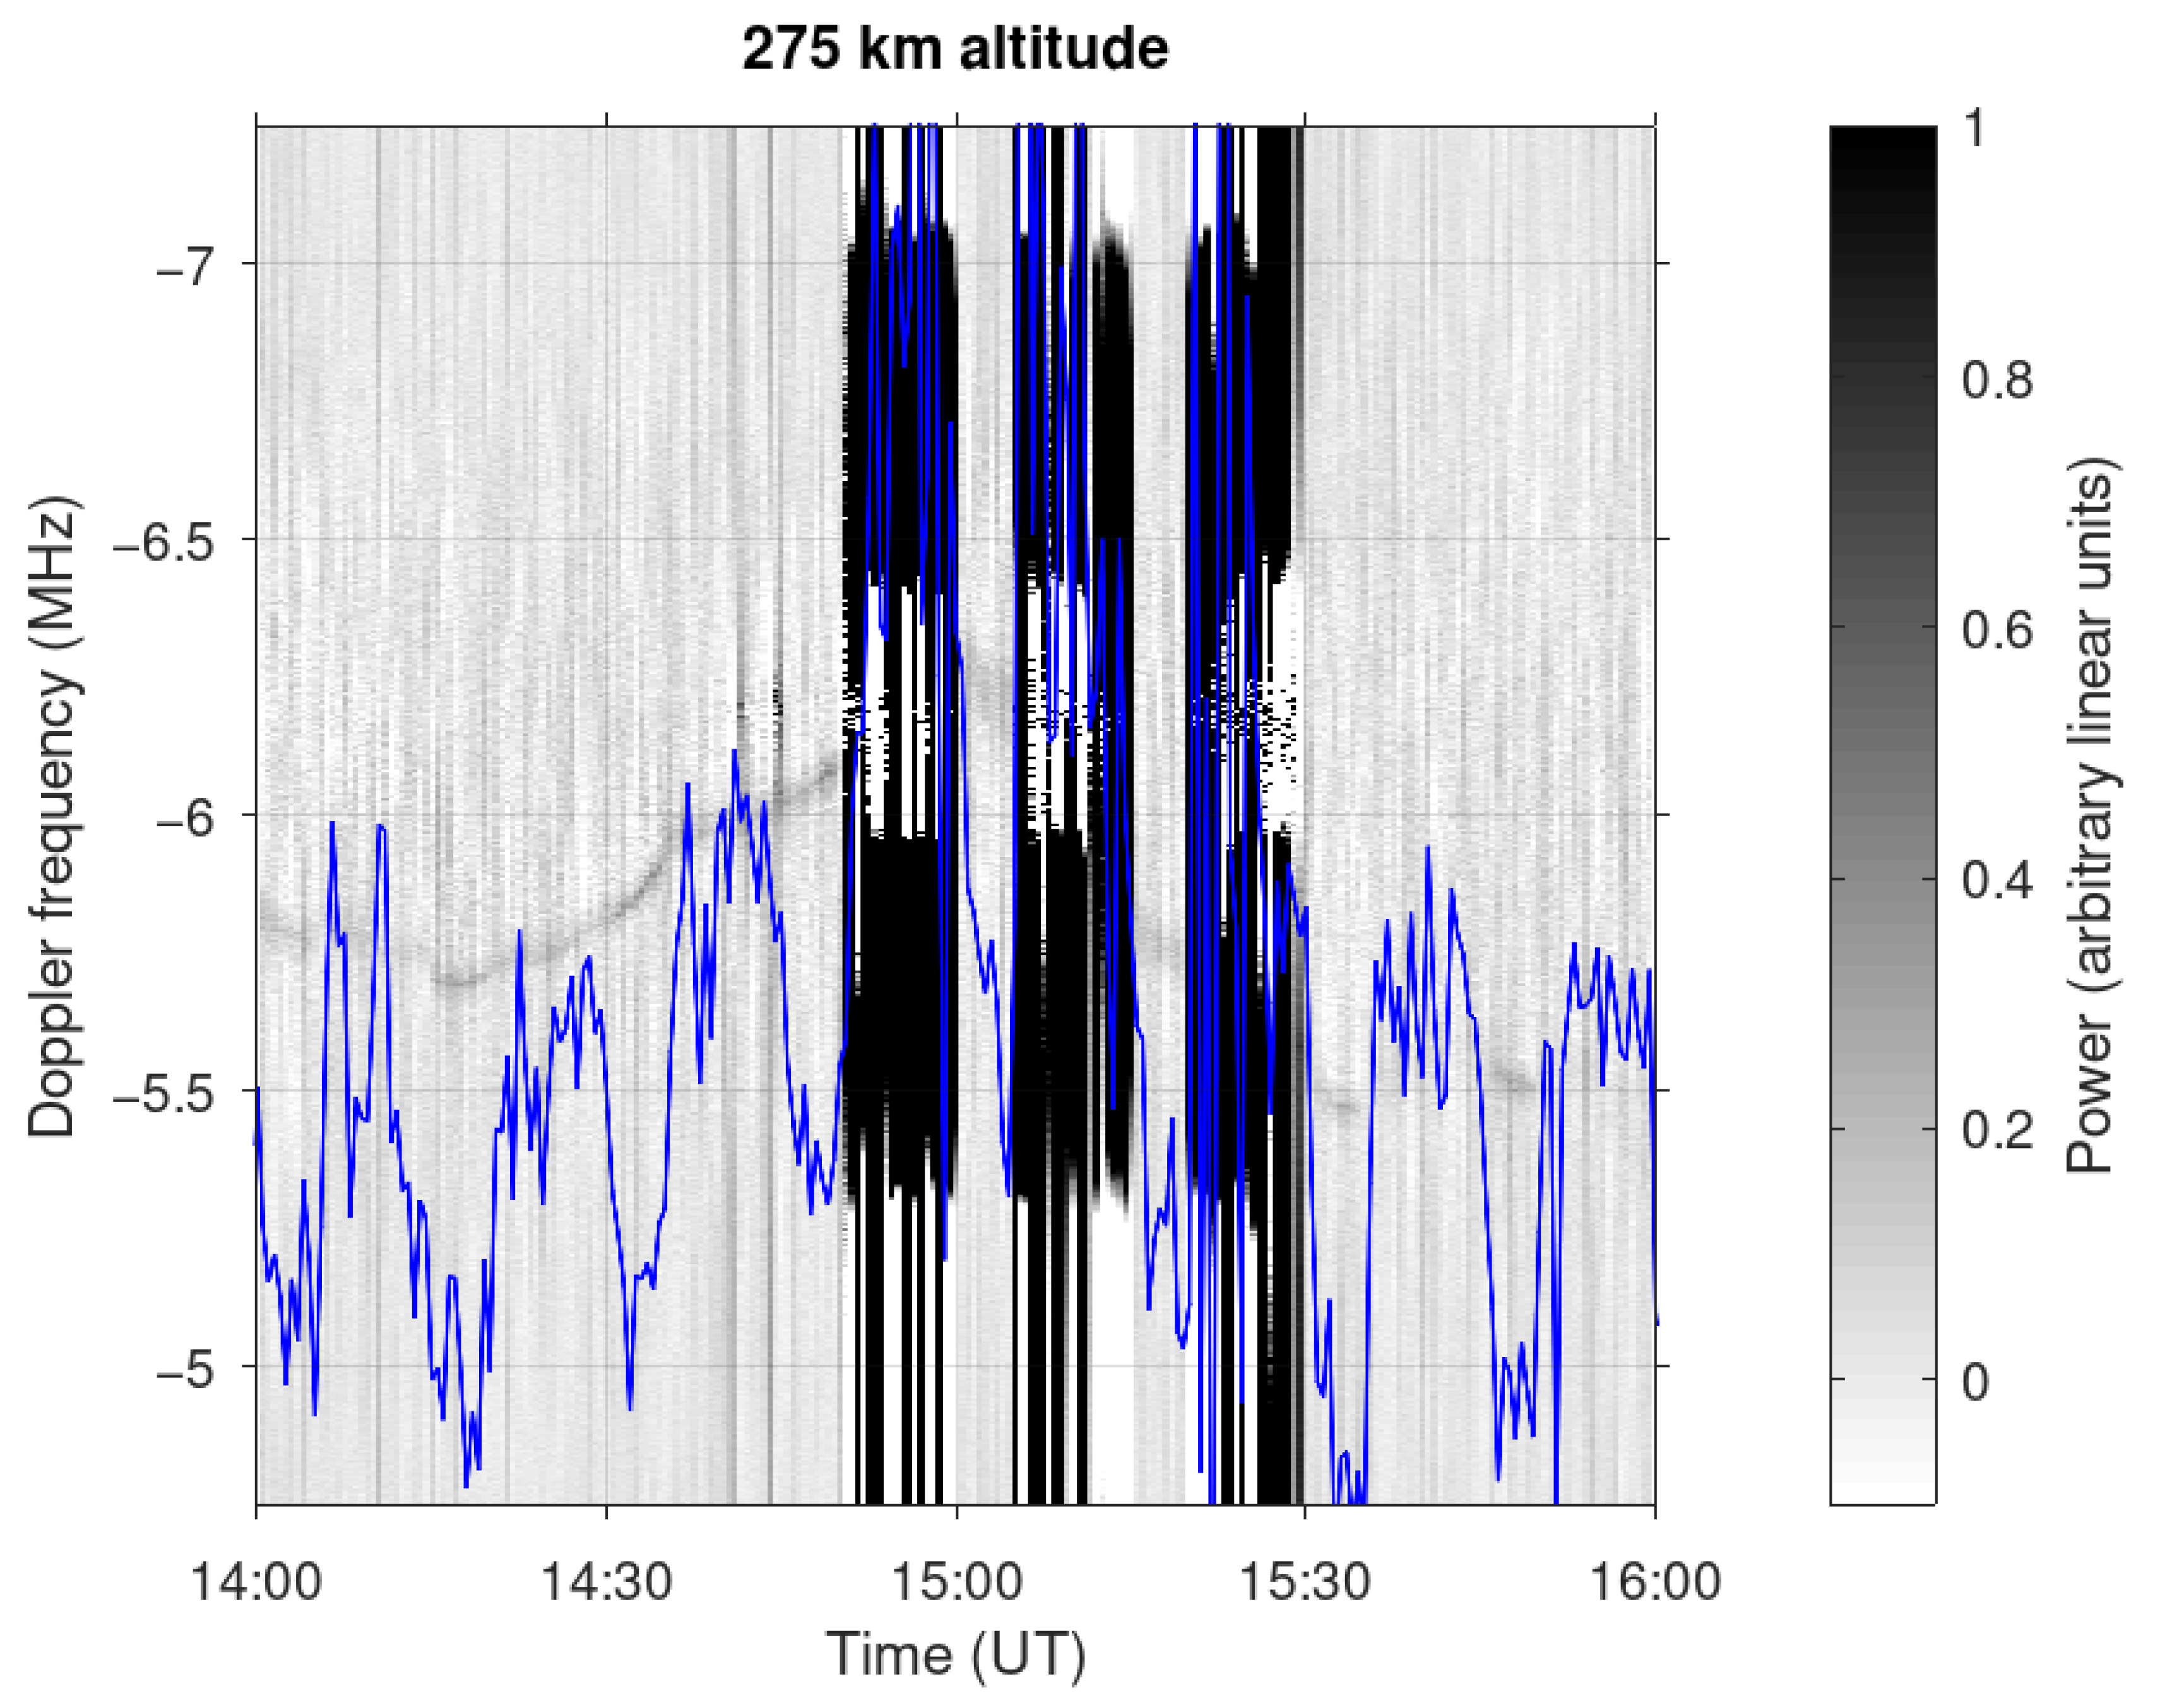
3. Natural Plasma Line

Admittedly, analysis of the natural PL is not trivial since it can be weak and is often masked by the HF-enhanced plasma line (HFPL). We have analyzed the PL data from 18 February 2012, which corresponds to the data presented in Figures 2 and 3 of [1].
Figure 1 shows the PL spectrum versus time for an altitude of 275 km. The PL data above this height are too weak for a clear analysis. The spectra come from the downshifted plasma line channel of the beta experiment, centered on a Doppler offset of −6 MHz. The radar data have been post-integrated to 30 s time resolution. The spectra were obtained from the EISCAT real-time graph software and do not include corrections for the radar ambiguity functions or transmitter power variation caused by the operation of the co-located HF facility. However, neither of these corrections is expected to make a material difference to the interpretation of the spectrum.
The PL is the thin band that starts at a frequency offset of ~−5.8 MHz and varies between −5.5 and −6.4 MHz over the time interval. During the pump pulses starting at 14:50, 15:05 and 15:20 UT, the spectrum is masked by very strong interference. This is due to clutter from the strong HFPL generated near the pump reflection height and arises because of the long alternating-coded pulses used by the radar. This effect also makes it difficult to see the PL spectrum at lower altitudes close to the pump reflection height.
In the pump pulses beginning at 14:05 and 14:20 UT, the PL frequency is seen to shift slightly and the PL spectrum becomes more diffuse. The PL frequency is primarily determined by the electron density (cold plasma frequency) and the electron temperature. For the apparent electron density enhancements reported by Blagoveshchenskaya et al. [1] the blue curve shows for the same pump pulses that the plasma frequency would be expected to change by about 0.8 MHz, i.e., from about −6 to −6.8 MHz. This is much larger than the change observed which is most likely due to increased electron temperature during the pump pulses. These PL data show that the large electron density enhancements in this case are not real, which strongly suggests that the other cases presented in [1] are similar.
If the alternative explanation for the apparent electron density enhancements put forward by Rietveld and Senior [3] is correct, it might be expected that the PL would also show an enhanced intensity during the pump pulses. However, the PL intensity is sensitive to changes in the electron distribution function due to changes in the electron temperature and the presence of suprathermal electrons, which may be generated during the heating process. These changes could easily mask any enhancement due to the proposed focusing of the radar beam on pump-induced plasma density irregularities.

4. Discussion

Although the incoherent scatter technique is a very powerful diagnostic of the ionosphere and can give very detailed parameters with good spatial and temporal resolution, misleading results are possible if certain assumptions that are made in the standard analysis [4] are not met. Such misleading results are possible also when the residual of the spectral fitting procedure has the normally low values. These assumptions need to be considered especially when the ionospheric plasma is perturbed by powerful HF waves as in these ionospheric heating experiments. One assumption, that the plasma is Maxwellian, can easily be violated during heating experiments. The powerful HF wave can excite instabilities and plasma waves which distort the spectrum of the backscattered waves such that the assumption of a Maxwellian plasma becomes invalid. This usually occurs near the reflection height of the HF pump wave, and, as mentioned in the cases studied here [1,2,3], this effect could be rejected since the enhanced backscatter occurred at heights where the plasma was unaffected by plasma instabilities.
Another assumption is that the radar waves propagate isotropically through the medium, as in free space, and it is this assumption that appears to be violated in the cases studied here. During ionospheric heating experiments electron density irregularities are often created having scale sizes across the magnetic field ranging from cm to km [5]. Some of these irregularities give rise to backscatter on coherent radars such as the CUTLASS (SuperDARN) Finland radar at Hankasalmi [6]. The study in [3] showed that such irregularities can refract the 933 MHz EISCAT radar rays that are incident at near grazing angles in such a way as to guide or duct the rays closer to the magnetic field direction than they would if they propagated in free space. By raytracing 933 MHz radio waves the authors showed in a simulation that enhanced backscatter similar in magnitude to that observed by [1,2,3] was possible.
Many questions still remain to be answered concerning the nature and mechanism of the postulated irregularities that guide the UHF rays. Some of the characteristics of the phenomena described in [1] such as power thresholds and the background ionospheric conditions are valuable information that may help to answer these questions and help to find an explanation for the still mysterious X-mode pumping phenomena described in [1] and references therein. Particularly coherent radar data such as those provided by CUTLASS are valuable diagnostics of irregularities which certainly play a role in these phenomena. We accept that ducts of some form may well have been produced in the experiments examined in [1], but no evidence is provided that VLF waves were ducted. Indeed, ducting of UHF waves is postulated in the mechanism suggested in [3] but these “ducts” were of much smaller scale and had only a few percent electron density variation, not the 50–80% claimed in [1]. Even if the explanation we proposed in [3] is not correct, the main point of this comment is that the interpretation of the enhanced backscatter as a large electron density enhancement is not correct.

Author Contributions

M.R. formed the concept for this comment and both authors have contributed to the writing of this comment and have read and agreed to the published version of the manuscript. A.S. analyzed the plasma line data and produced the plot. All authors have read and agreed to the published version of the manuscript.

Data Availability Statement

The data presented here can be obtained through EISCAT Madrigal database (https://portal.eiscat.se/schedule/, accessed on 19 August 2023).

Acknowledgments

EISCAT is an international scientific association supported by research organizations in China (CRIRP), Finland (SA), Japan (NIPR and STEL), Norway (NFR), Sweden (VR), and the United Kingdom (NERC).

Conflicts of Interest

The authors declare no conflict of interest.

References

  1. Blagoveshchenskaya, N.F.; Borisova, T.D.; Kalishin, A.S.; Egorov, I.M. Artificial Ducts Created via High-Power HF Radio Waves at EISCAT. Remote Sens. 2023, 15, 2300. [Google Scholar] [CrossRef]
  2. Senior, A.; Rietveld, M.T.; Häggström, I.; Kosch, M.J. Radio induced incoherent scatter ion line enhancements with wide altitude extents in the high-latitude ionosphere. Geophys. Res. Lett. 2013, 40, 1669–1674. [Google Scholar] [CrossRef]
  3. Rietveld, M.T.; Senior, A. Ducting of incoherent scatter radar waves by field-aligned irregularities. Ann. Geophys. 2020, 38, 1101–1113. [Google Scholar] [CrossRef]
  4. Lehtinen, M.S.; Huuskonen, A. General incoherent scatter analysis and GUISDAP. J. Atmos. Sol. Terr. Phys. 1996, 58, 435–452. [Google Scholar] [CrossRef]
  5. Gurevich, A.V. Nonlinear Phenomena in the Ionosphere; Springer: New York, NY, USA, 1978.
  6. Lester, M.; Chapman, P.J.; Cowley, S.W.H.; Crooks, S.J.; Davies, J.A.; Hamadyk, P.; McWilliams, K.A.; Milan, S.E.; Parsons, M.J.; Payne, D.B.; et al. Stereo CUTLASS: A new capability for the SuperDARN radars. Ann. Geophys. 2004, 22, 459–473. [Google Scholar] [CrossRef]
Figure 1. The plasma line frequency from 18 February 2012 is shown as a grey thin band. The blue line shows the cold plasma frequency calculated from the electron densities derived from the ion line analysis (Figures 2 and 3 of [1]). The offset between the two curves when the heater is off is caused by the electron temperature contribution to the PL which is not included in the blue curve. The ca. 0.8 MHz enhancements in the ion line analysis (blue curve) during the heater pulses are not seen in the PL curve. Heater pulses are 10 min long, then 5 min off, starting at 14:05 UT.
Remotesensing 15 04294 g001
Disclaimer/Publisher’s Note: The statements, opinions and data contained in all publications are solely those of the individual author(s) and contributor(s) and not of MDPI and/or the editor(s). MDPI and/or the editor(s) disclaim responsibility for any injury to people or property resulting from any ideas, methods, instructions or products referred to in the content.

