Article

High Spatial Resolution Nighttime PM2.5 Datasets in the Beijing–Tianjin–Hebei Region from 2015 to 2021 Using VIIRS/DNB and Deep Learning Model

1
School of Remote Sensing and Information Engineering, North China Institute of Aerospace Engineering, Langfang 065000, China
2
Hebei Collaborative Innovation Center for Aerospace Remote Sensing Information Processing and Application, Langfang 065000, China
3
Aerospace Information Research Institute, Chinese Academy of Sciences, Beijing 100094, China
*
Author to whom correspondence should be addressed.
Remote Sens. 2023, 15(17), 4271; https://doi.org/10.3390/rs15174271
Submission received: 19 July 2023 / Revised: 25 August 2023 / Accepted: 28 August 2023 / Published: 30 August 2023

Abstract

:
The concentration of particulate matter (PM2.5) can be estimated using satellite data collected during the daytime. However, there are currently no long-term evening PM2.5 datasets, and the application of low-light satellite data to analyze nighttime PM2.5 concentrations is limited. The Visible Infrared Imaging Radiometer Suite Day/Night Band (VIIRS/DNB), meteorology, Digital Elevation Model, moon phase angle, and Normalized Digital Vegetation Index were used in this study to develop a Deep Neural Network model (DNN) for estimating the nighttime concentrations of PM2.5 in the Beijing–Tianjin–Hebei (BTH) region from 2015 to 2021. To evaluate the model’s performance from 2015 to 2021, a ten-fold cross-validation coefficient of determination was utilized (CV − R2 = 0.51 − 0.68). Using a high spatial resolution of 500 m, we successfully generated a PM2.5 concentration map for the BTH region. This finer resolution enabled a detailed representation of the PM2.5 distribution over the area. Interannual and seasonal trends in nighttime PM2.5 concentrations were analyzed. Winter had the highest seasonal spatial PM2.5, followed by spring and autumn, whereas summer had the lowest. The annual concentration of PM2.5 at night steadily decreased. Finally, the estimation of nighttime PM2.5 was applied in scenarios such as continuous day–night changes, rapid short-term changes, and single-point monitoring. A deeper understanding of PM2.5, enabled by nightly PM2.5, will serve as an invaluable resource for future research.

1. Introduction

Fine particulate matter (PM2.5) is the primary cause of atmospheric pollution and poses a considerable risk to both human health and environmental quality [1]. The Beijing–Tianjin–Hebei (BTH) region of China is known for its high pollution levels, with PM2.5 being a notable cause. According to Zhang et al. [2], the main causes of pollution in an area include topography, weather, and boundary layer characteristics. Furthermore, the BTH region is among China’s most heavily polluted areas, with contributions from local emissions and long-range transport from metropolitan agglomerations in the south [2]. Although several studies have investigated daytime PM2.5 concentrations [3,4,5,6,7], limited research has focused on nighttime PM2.5 pollution [8,9,10,11]. Nighttime PM2.5 concentrations characteristically differ from daytime concentrations and affect different processes. To completely understand the consequences of pollution from PM2.5, more research on nighttime PM2.5 pollution is required.
Indeed, nighttime PM2.5 concentrations are influenced by a variety of factors, including, but not limited to, traffic patterns, weather conditions, and human activities. These factors can significantly affect the levels of PM2.5 in the atmosphere during nighttime hours. Understanding and addressing these factors are crucial for effective air quality management and mitigation strategies. The relationship between nighttime PM2.5 and satellite data is not fully explained by traditional linear models. To address this limitation, previous studies have used machine learning and deep learning techniques, including back-propagation neural networks (BP), support vector machines (SVM), and random forests (RF), to estimate nighttime PM2.5 [12,13]. In recent years, machine and deep learning have been increasingly used to understand the non-linear relationships between meteorological variables, ground-based PM2.5, and satellite data. Previous research has mainly focused on investigating the potential of using low-light images to calculate PM2.5 levels at night. For example, using radiative transfer simulations, Wang et al. [14] demonstrated the sensitivity of the Visible Infrared Imaging Radiometer Suite/Day/Night Band (VIIRS/DNB) to aerosol variations in Atlanta. Similarly, Zhao et al. [13] developed a BP model for Beijing using the VIIRS/DNB, relative humidity, temperature, and other meteorological parameters as inputs. The model’s correlation coefficient (R) is 0.91. A mixed-effects model was developed by Fu et al. [15] to investigate the differences between the application of VIIRS/DNB data in light and light-sparse locations. Their results showed that VIIRS/DNB data could help estimate PM2.5 even in light-sparse regions.
Despite existing studies, the estimation of nighttime PM2.5 concentrations is still in its early stages. This is primarily due to the limitations of satellite data and nighttime low-light capabilities. The Defense Meteorological Satellite Program/Operational Linescan System lacks onboard calibration tools, making its data challenging to use for quantitative remote sensing [16]. Other low-light satellite data sources such as Satellite de Aplicaciones Cientificas-C (SAC-C) are not generally available, and the Luojia-1 satellite has a short lifetime and few image acquisitions [17]. Of the available satellite images, only the VIIRS/DNB images have longer temporal coverage and better spatial resolution and are publicly available [18]. Moreover, the VIIRS/DNB spectral range (0.5–0.9 μm) includes molecule absorption bands (e.g., 0.69 μm, 0.76 μm, 0.72 μm, and 0.82 μm) that significantly affect the estimation of PM2.5 concentrations [14]. However, the effect of these absorption bands on PM2.5 concentration monitoring remains unclear. Finally, low-light sources at night from the moon and ground lighting produce radiant energy, and it is unclear how atmospheric transmittance in the DNB varies under different light sources (sodium lamps, LEDs, etc.) [19]. These limitations prevent the use of nighttime low-light data to estimate PM2.5 concentrations.
By analyzing PM2.5, the impact of atmospheric pollutants on human health can be explored in the field of environmental health [20,21,22,23,24]. These data can be used in air pollution control to formulate control plans and evaluate the effectiveness of control measures [25,26]. Urban planners can also use PM2.5 data to assess air quality and develop plans for future development [5]. However, accessible daytime PM2.5, such as those managed by Tsinghua University’s Tracking Air Pollution in China collection, include PM2.5 at geographical resolutions of 1 km and 10 km [27,28]. The China High Air Pollutants (CHAP) collection, developed by Wei Jing of the University of Maryland, provides daily, monthly, and annual PM2.5, along with supplementary PM2.5, offering a spatial resolution of 1 km [29,30]. The estimation of nighttime PM2.5 is challenging because of the need for developing radiative transfer models at night. As a result, only data without moonlight (moon phase angle > 120°) were frequently included in the research, rendering approximately 60% of the data useless and substantially reducing the temporal coverage of PM2.5 at night.
Our aim was to suggest a method for calculating nighttime PM2.5, which has a greater geographic resolution and more extensive variables. To gain a deeper understanding of the nonlinear relationship between PM2.5 and its influencing factors, we proposed a Deep Neural Network (DNN) model. To estimate PM2.5 concentrations at night in the BTH region from 2015 to 2021, we used a 500 m resolution VIIRS/DNB product (VNP46A1) and included meteorological factors, Normalized Digital Vegetation Index (NDVI), moon phase angle, and Digital Elevation Model (DEM). We also review and discuss the interannual and seasonal variations in nighttime PM2.5. Furthermore, we explored the practical application of nighttime PM2.5 concentration monitoring.

2. Materials and Methods
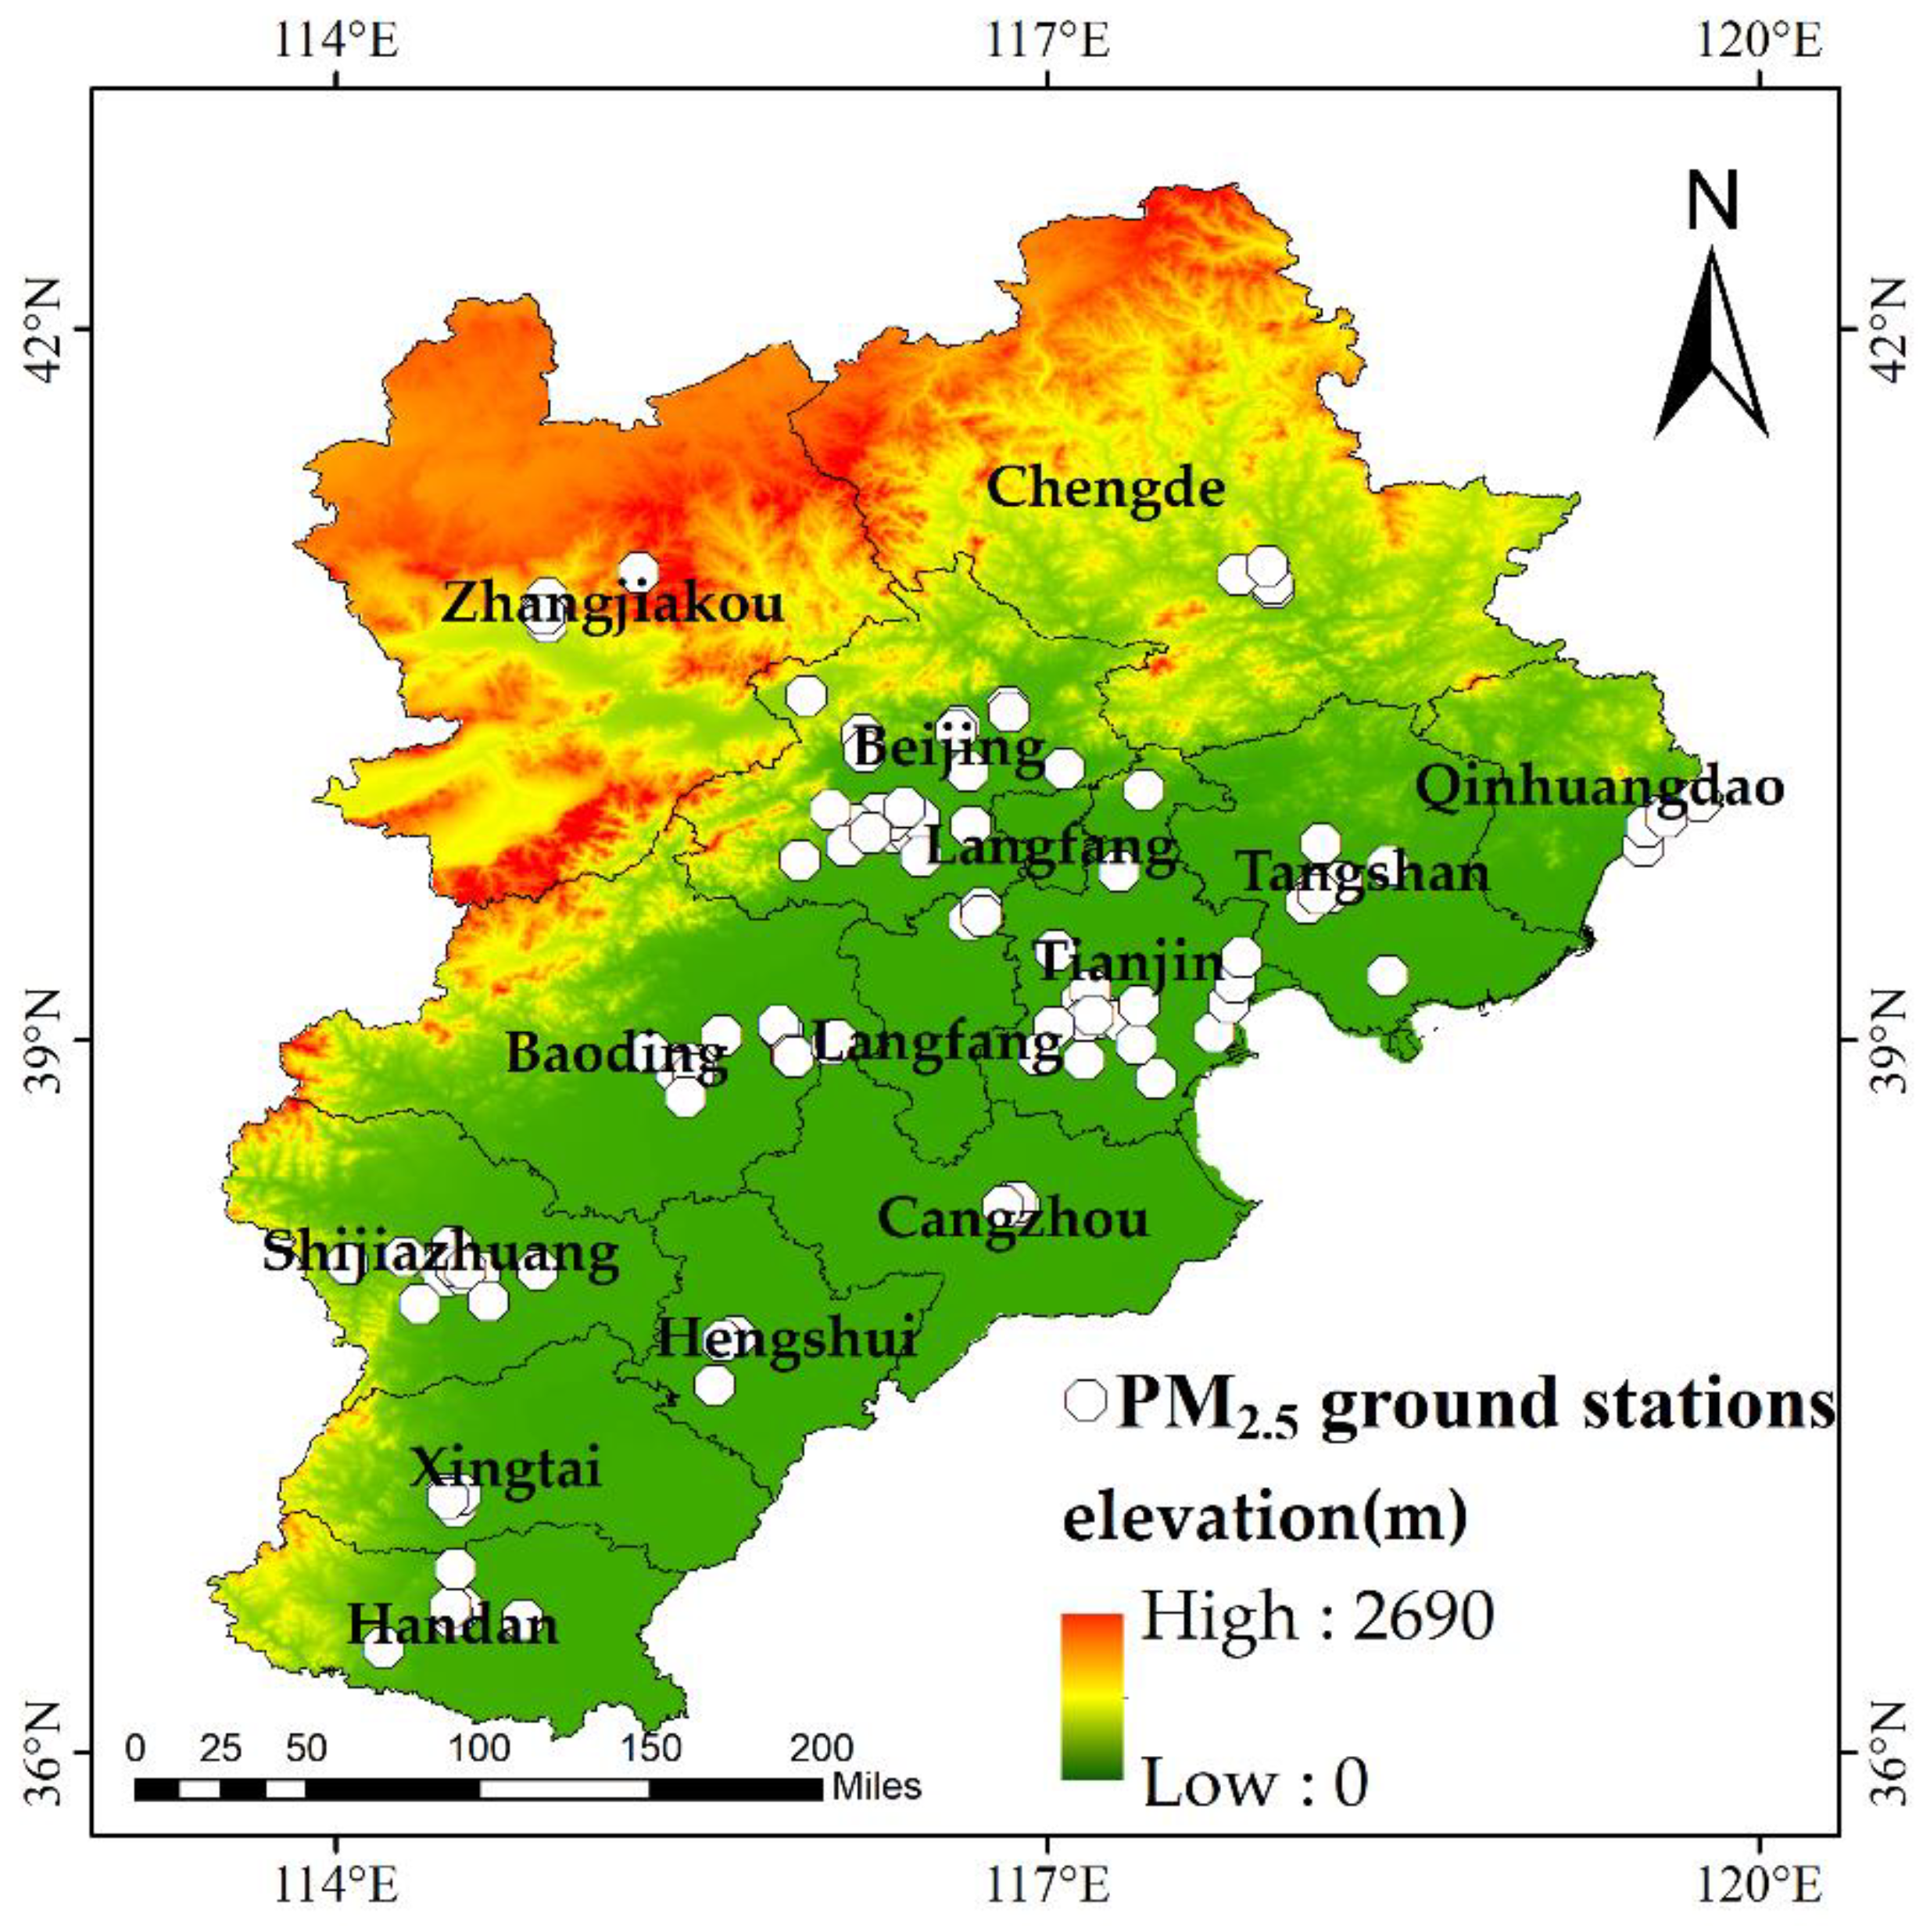
2.1. Materials

2.1.1. Ground PM2.5 Data

The BTH region is characterized by a complex terrain with mountains, hills, plains, deserts, and coastal areas. The northwestern and western regions are encompassed by the Taihang and Yanshan Mountains (Figure 1). By contrast, the central and eastern areas are mainly covered by hills and plains, where industrial activities are concentrated. Air pollution is more pronounced in the BTH region due to the combined effects of natural and anthropogenic factors.
The China National Environmental Monitoring Centre website (http://www.cnemc.cn/) was used to collect hourly ground PM2.5 concentration data from 2015 to 2021, accessed on 18 March 2022. According to the China National Ambient Air Quality Standard (GB3905-2012), the ground PM2.5 concentration is usually measured using the beta-attenuation method or the oscillating microbalance method [31]. There are now 131 ground monitoring stations, up from 80 in 2015, which are relatively evenly distributed across the BTH cities, with a denser distribution in urban centers, as shown in Figure 1. After eliminating stop-running sites, the numbers of sites used in this study were 78, 75, 80, 78, 81, and 117 from 2015 to 2021, respectively. Missing data were removed before analysis.

2.1.2. Satellite Data

The VIIRS sensor, mounted on Suomi-National Polar-orbiting Partnership satellite platforms, offers valuable daily global observations of nighttime visible and near-infrared light. The overpass time of the VIIRS is 1:30 local time. These observations are extremely valuable for Earth system studies and a wide range of applications [32].
The National Aeronautics and Space Administration (NASA) has developed the Black Marble Product Suite (VNP46), a collection of standard products that facilitate the utilization of VIIRS/DNB time series recordings [33]. VNP46, which is processed within 3–5 h after daily acquisition, can be used for both near-real-time applications and monitoring purposes, as it is processed within 3 to 5 h after acquisition every day.
The VNP46A1 products have provided VIIRS/DNB data since January 2012, including 26 scientific data storage (SDS) layers. For this study, the following parameters were selected from the SDS layers of the VIIRS/DNB data: radiance, moon phase angle, time, and cloud flags (accessed 12 April 2022).

2.1.3. Meteorological Data

In this study, we used the fifth-generation reanalysis dataset (ERA5) with a spatial resolution of 0.25° × 0.25°, accessed on 22 March 2022 [34]. The hourly data of the boundary layer height (BLH), surface pressure (SP), 2 m temperature (T2M), 2 m dewpoint temperature (D2M), relative humidity (RH), east wind speed (10 m u-component of wind, U10), and north wind speed (10 m v-component of wind, V10) were used as input factors in this study (Table 1). Notably, the existing research surface ERA5 meteorological data are conducive to PM2.5 estimation in China [35,36,37].
At night, the boundary layer stabilizes and decreases in height, allowing pollutants to accumulate at the ground level. Sulfur dioxide and nitrogen oxides are transformed more rapidly when humidity is high, which can exacerbate PM2.5. Wind speed directly affects the rate of pollutant diffusion and low wind speeds are likely to exacerbate air pollution. The boundary layer height and temperature are indicators of temperature inversion, which slows pollutant diffusion and exacerbates local air pollution.

2.1.4. Auxiliary Data
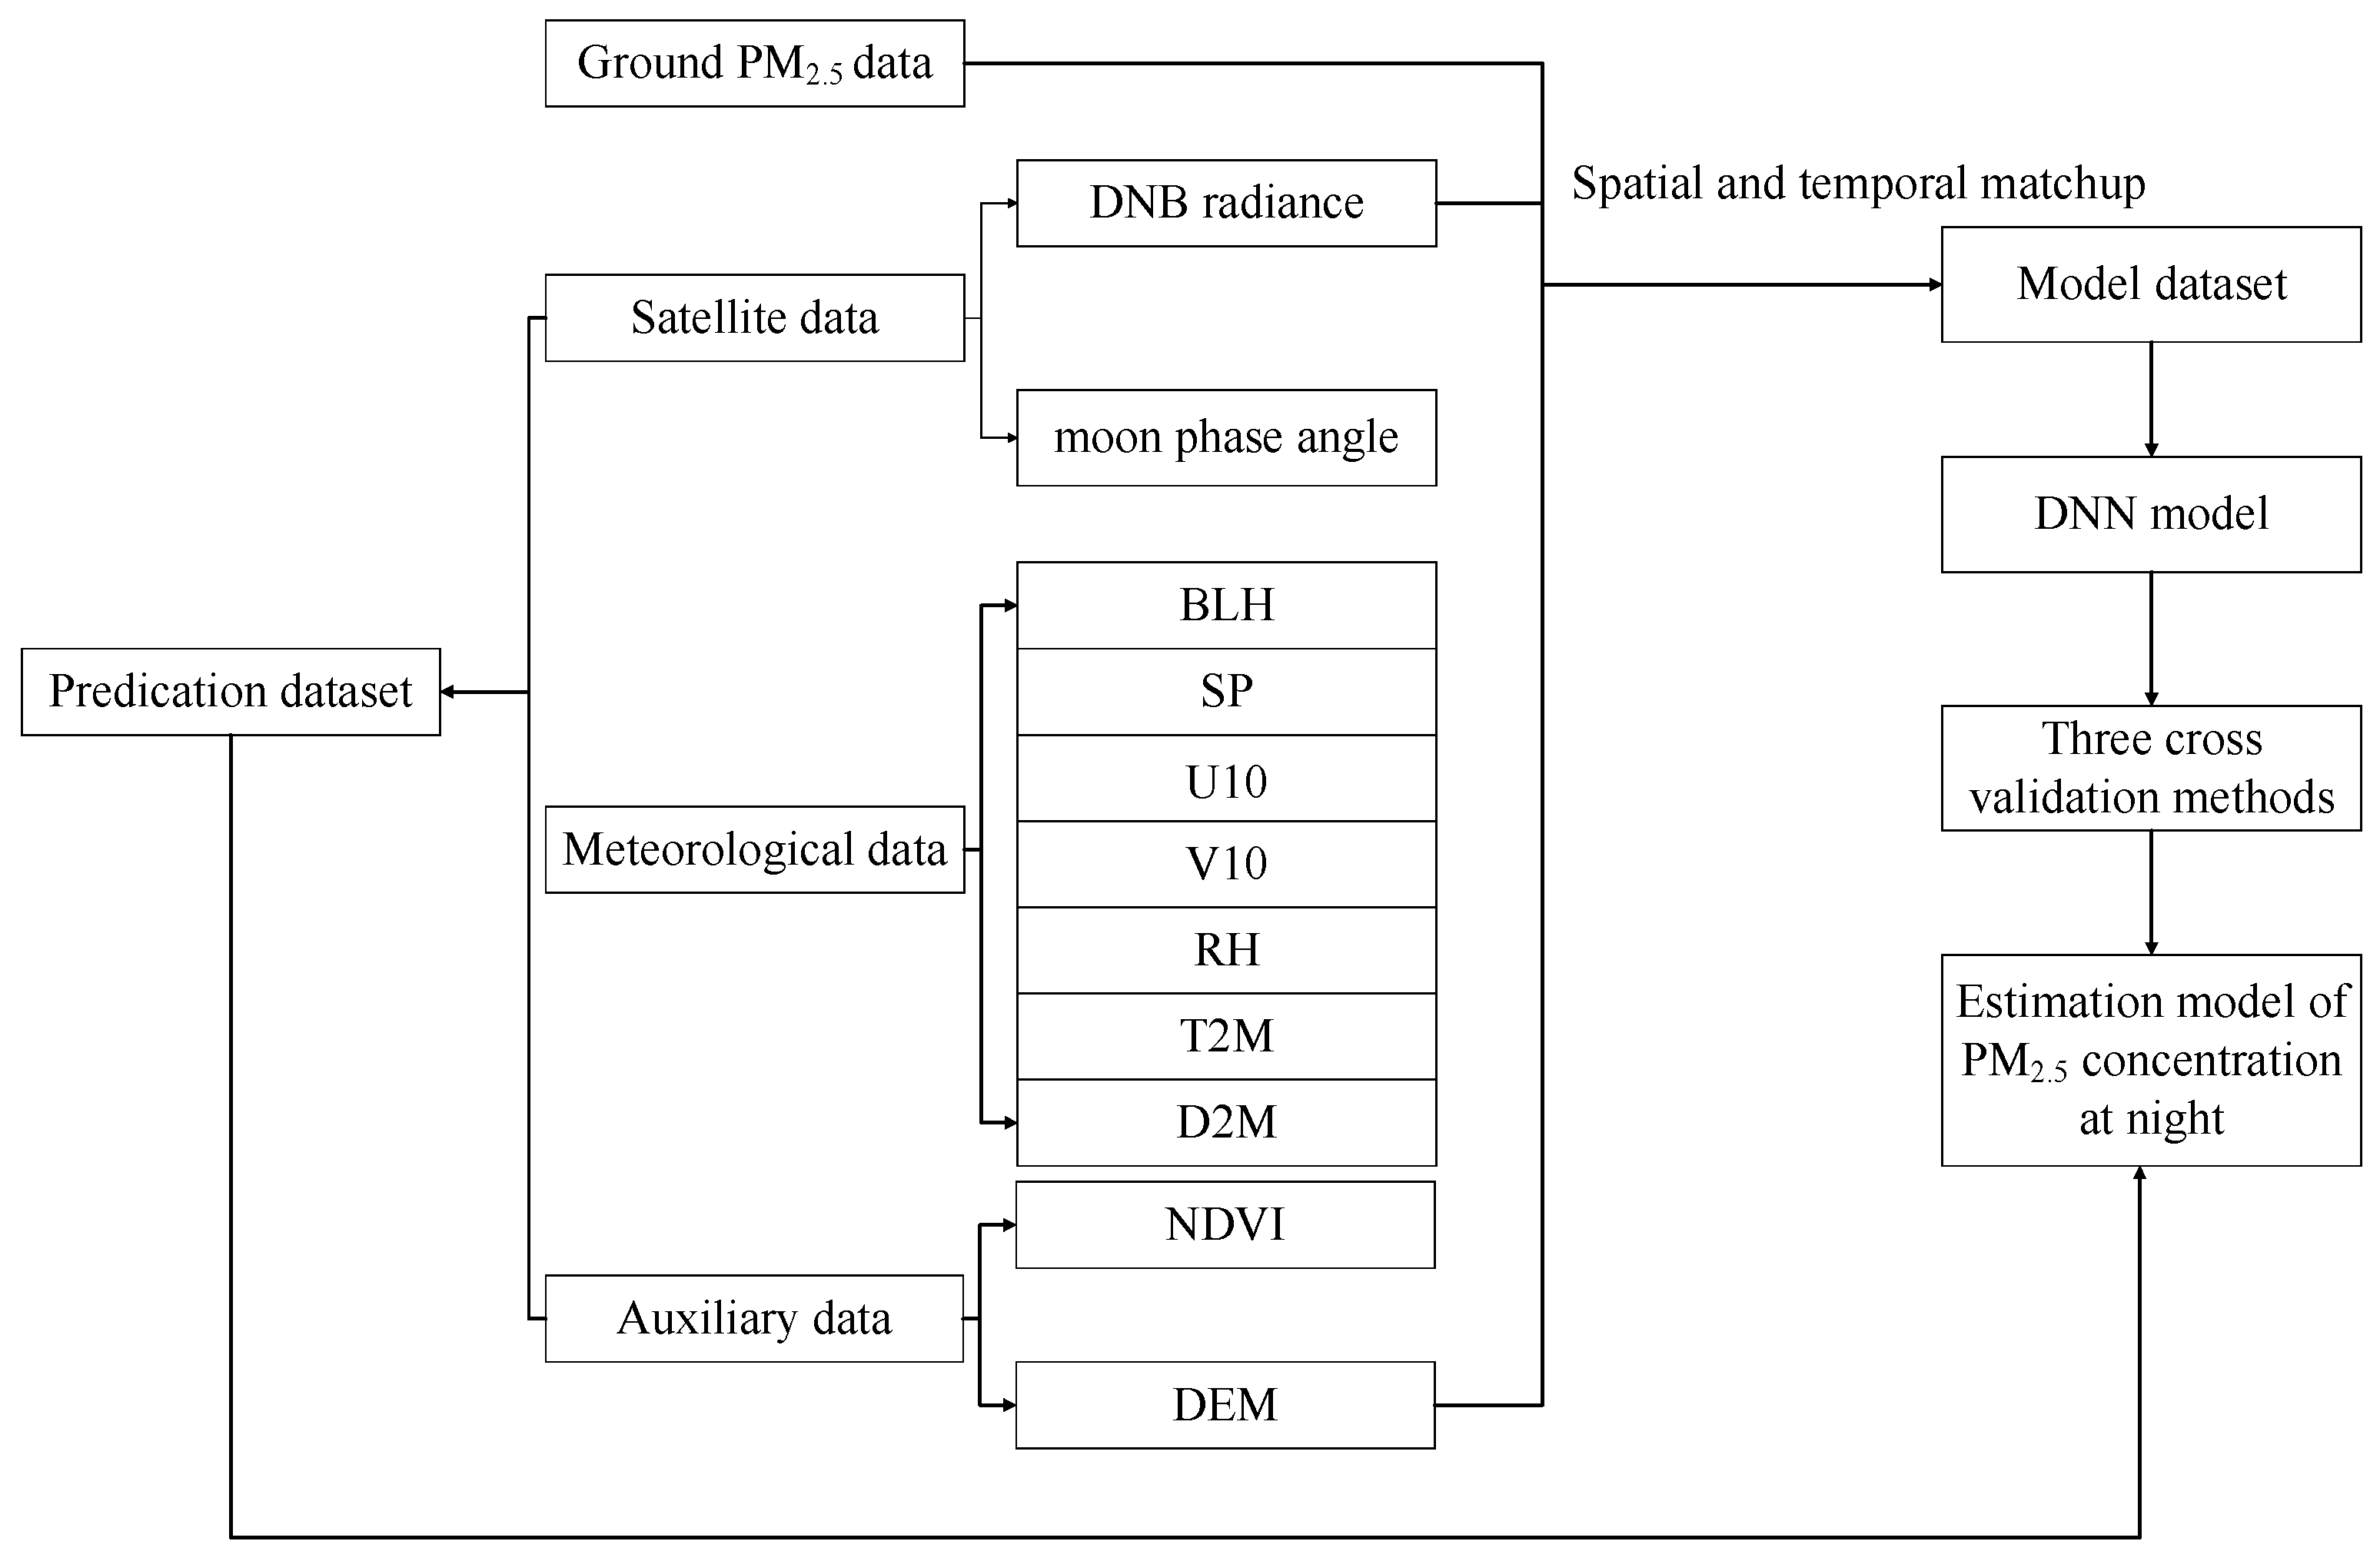
This study utilized auxiliary data, such as NDVI and DEM, which may affect PM2.5 concentration during the nighttime (Table 1). A 500 m spatial and 16 day temporal resolution was used to create NDVI data for the MOD13A1 product. The elevation data were obtained from GMTED2010, with a spatial resolution of approximately 900 m. These data were accessed on 20 March 2022.
Data from satellites, meteorological stations, and auxiliary sources were spatially and temporally matched using the latitude and longitude of each station. The resulting dataset consists of 120,816 valid data samples from 2015 to 2021. The data samples varied slightly annually, with 14,666, 15,234, 16,705, 16,772, 16,355, 16,749, and 24,335 data points recorded each year, respectively.

2.2. Methods

2.2.1. Deep Neural Network (DNN) Model

As the number of input variables increases, their relationships and impact on the output results become more complex, requiring models with strong nonlinear fitting capabilities. Traditional linear models, such as linear regression and multiple linear regression (MLR), have a low fitting accuracy and are therefore unsuitable. Hence, a DNN was used in this study to construct models with multiple parameters that can better capture the complexity of the relationships between the input variables and output outcomes.
Figure 2 shows the overall technical flowchart of the 11 input variables, including the VIIRS/DNB and RH. The DNN model used four hidden layer structures. Owing to the simplicity of its calculation, the hidden layer activation function is a Rectified Linear Unit [38] a rapid training rate and high efficiency (Formula (1)). The Adam optimization function was utilized to provide stable parameters during the iteration, offering a range of learning rates. During training, the weight and bias of each layer was optimized using the reciprocal of the loss function. The Mean Square Error (MSE) loss function (Equation (2)) was used to optimize the network settings.
f ( x ) = m a x ( 0 , x )
The formula defines x as the linear combination of the weights and biases of all previous layer neuron values. The output neuron f(x) is used as the input for the neurons of the next layer.
M S E = i = 1 n ( P M 2.5 i P M ^ 2.5 i ) 2
where P M ^ 2.5 i  is the model estimate of PM2.5, P M ^ 2.5 i  is the measured value of PM2.5 from the ground stations, and n is the number of samples.
To estimate nighttime PM2.5, this study proposed a DNN-based multiparameter integrated method. The model combines VIIRS/DNB and meteorological and auxiliary data as input variables to estimate PM2.5 concentrations in the BTH region. The meteorological and auxiliary data were resampled to match the resolution of the satellite data, which was 0.00416667°.

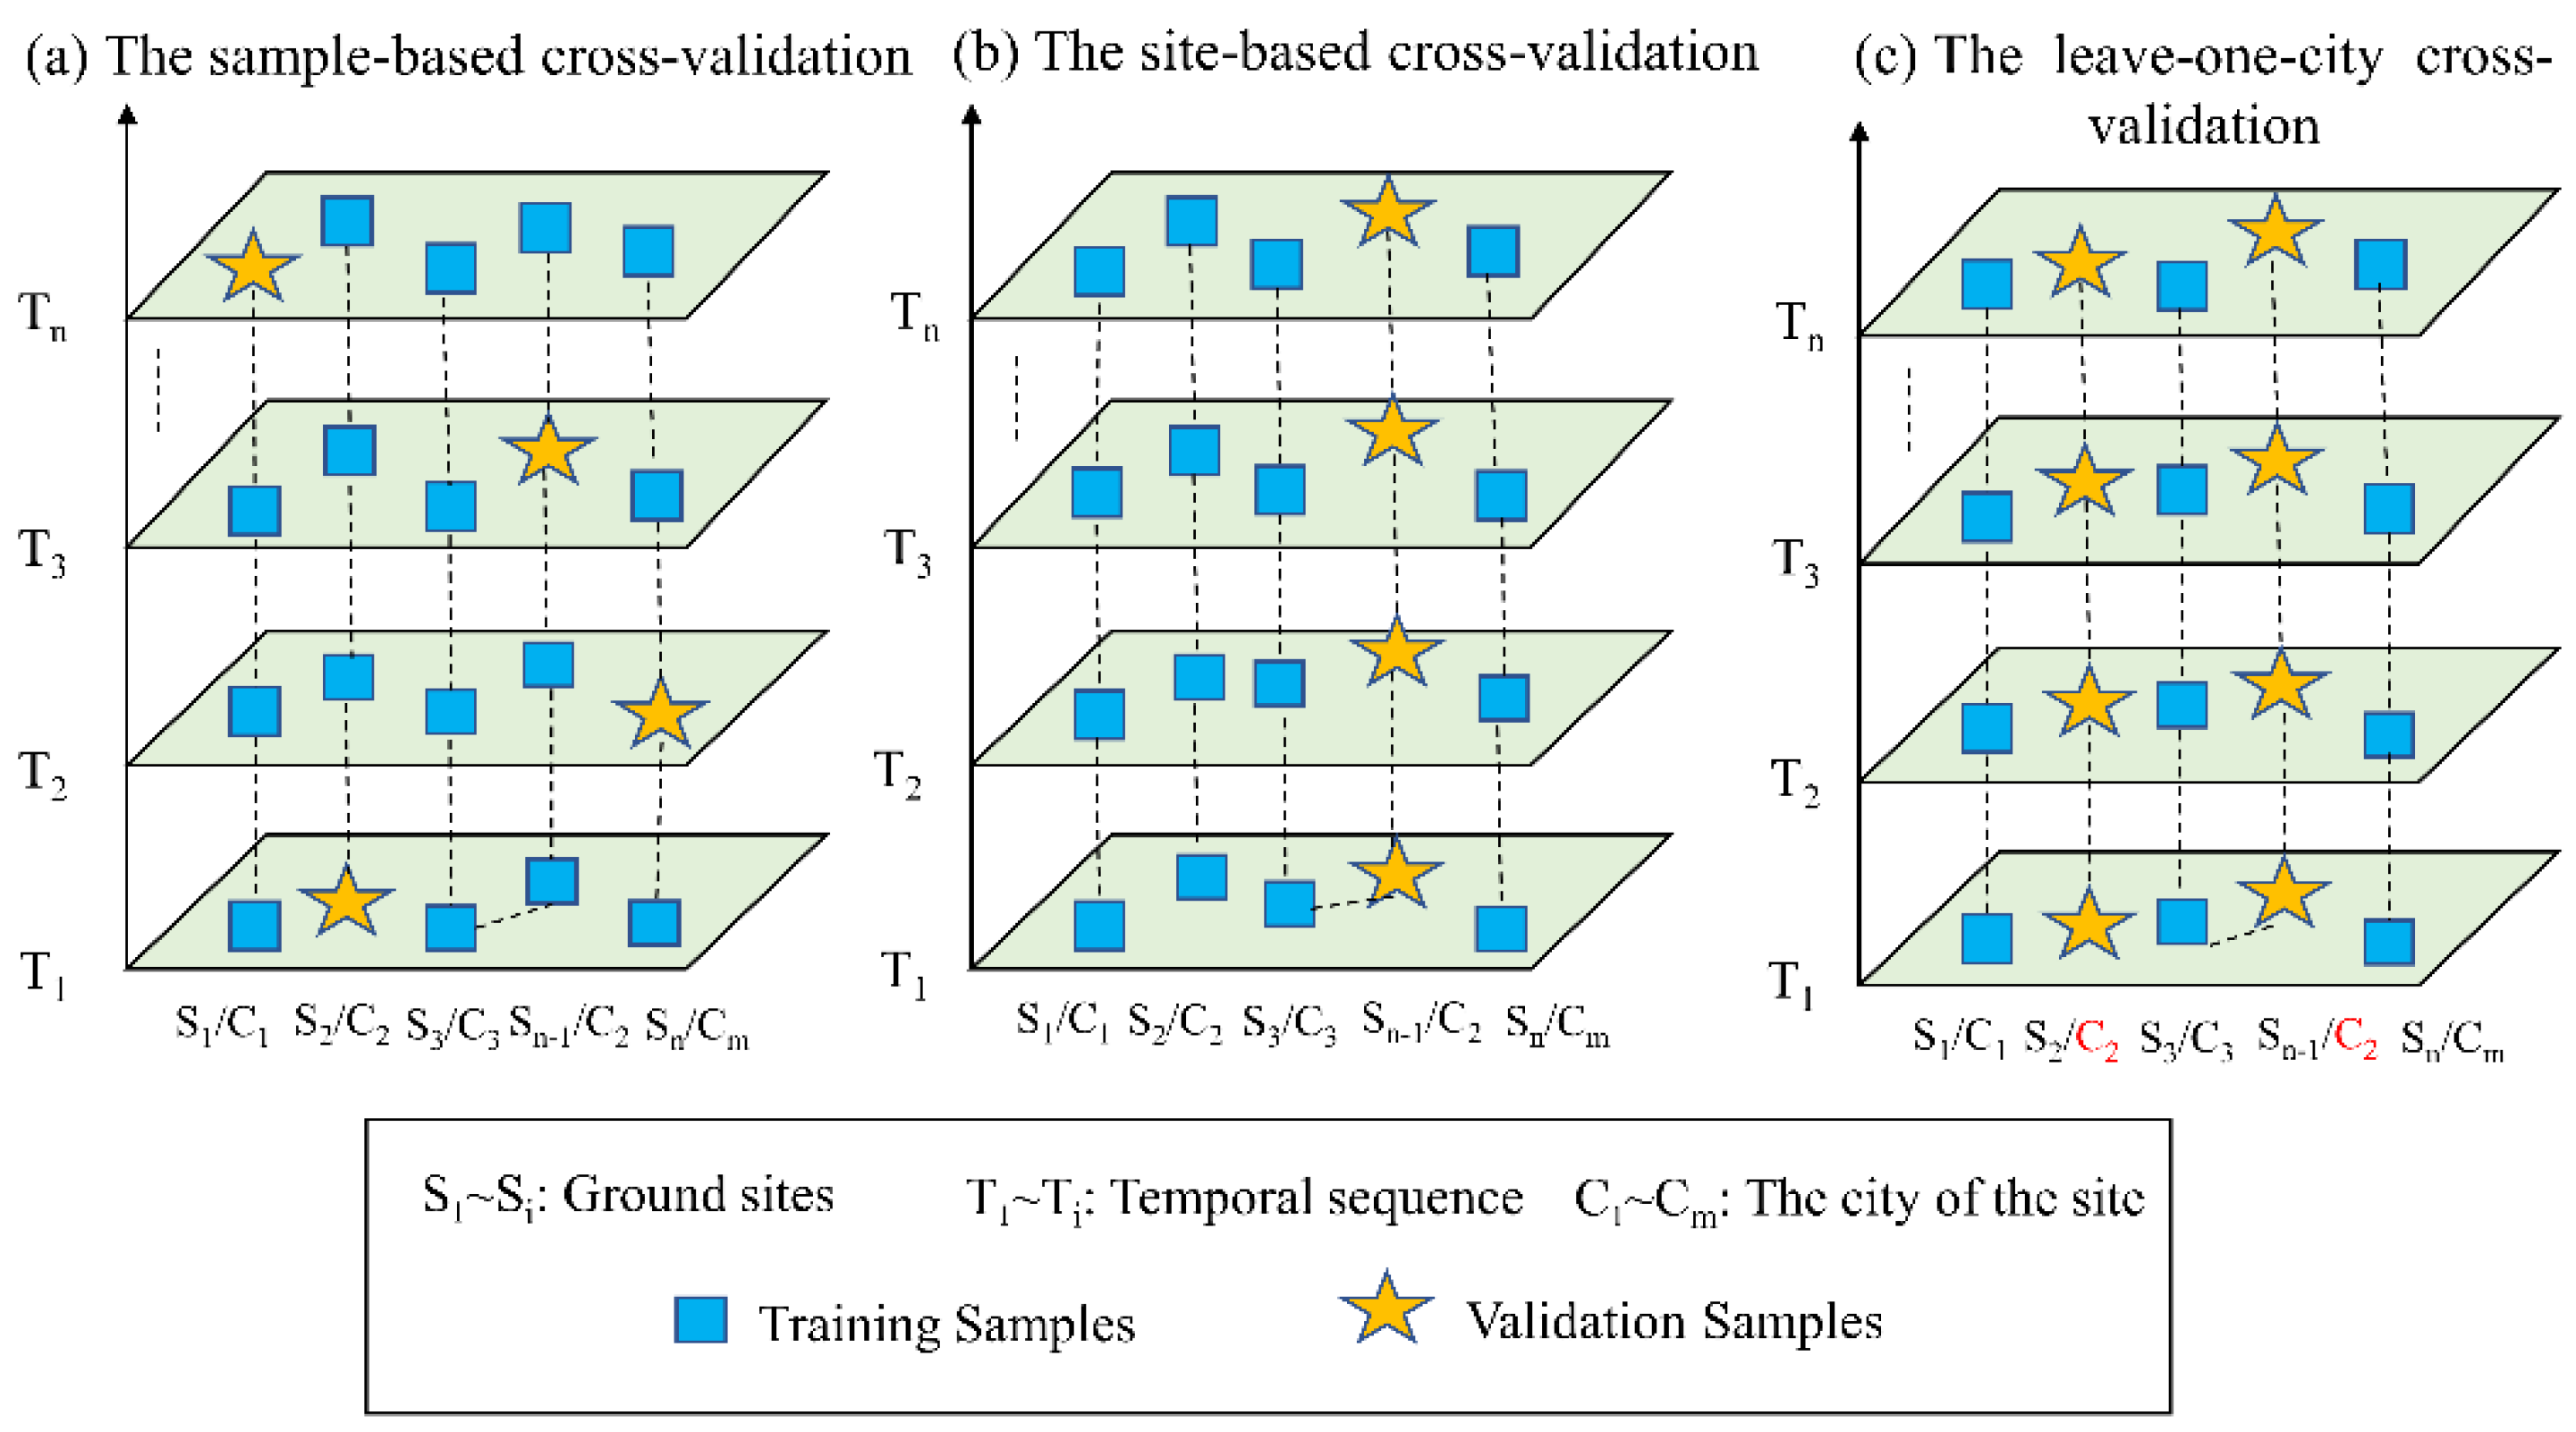
2.2.2. Model Evaluation Methods

This study used three different methods for model evaluation, as illustrated in Figure 3. These methods include ten-fold sample-based cross-validation (Figure 3a), ten-fold site-based cross-validation (Figure 3b), and leave-one-city cross-validation (Figure 3c).
The sample was subjected to ten-fold cross-validation. Subsequently, the sample was split into ten subsets using randomization. In each cycle of the approach, nine subsets were used for model training and the last subset was used for model validation. This procedure was carried out 10 times. Finally, for model evaluation, comparisons between the estimated PM2.5 values of all ten iterations and the measured PM2.5 concentrations were made [39].
The monitoring sites were divided into ten parts on average for site-based cross-validation, and the verification process was consistent with the sample-based cross-validation process.
In the leave-one-city cross-validation approach, all monitoring stations within a single city were used for verification, whereas stations located in other cities were used for model fitting. This ensured that the monitoring stations in each city were verified.
In summary, the sample-based cross-validation method can assess the overall performance of the model, whereas spatial cross-validation methods, such as site-based cross-validation and leave-one-city cross-validation, can evaluate the spatial performance more accurately. Sample-based cross-validation is introduced in Section 3.1.1, and the site-based and leave-one-city cross-validation results are presented in Section 3.1.2.

3. Results

3.1. Model Performance

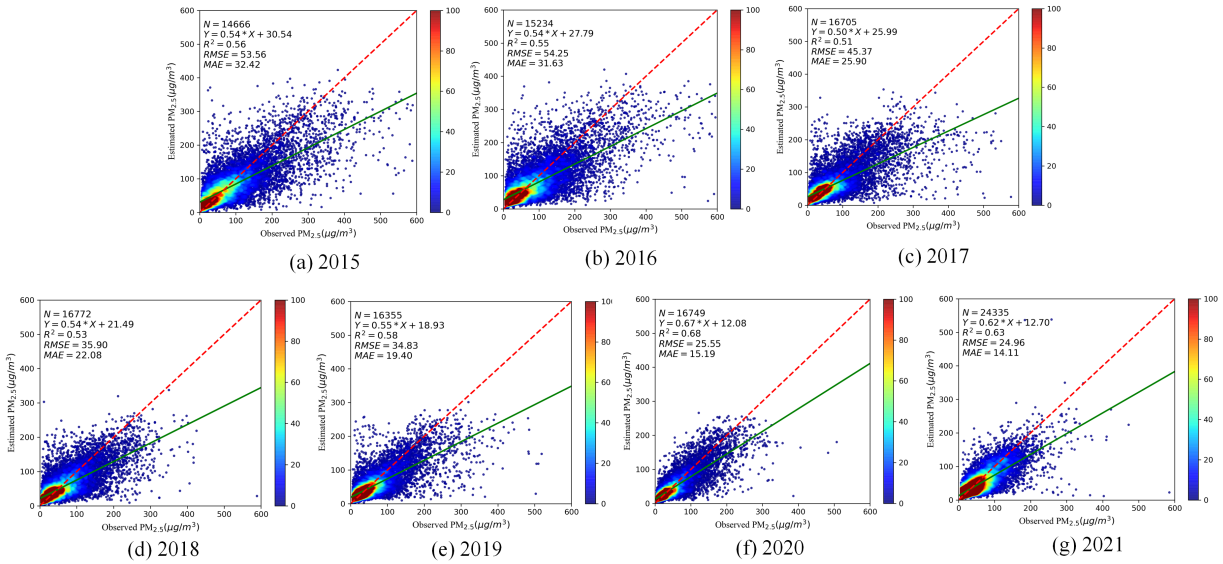
3.1.1. Accuracy of Models

Figure 4 shows the cross-validation results between daily nighttime PM2.5 and observed values at all ground sites in the BTH region from 2015 to 2021. The amount of data utilized in this study has been growing annually, especially with the rapid increase in the number of ground sites by 2021.
The sample-based cross-validation accuracy of the model was evaluated using the coefficient of determination (R2) and varied from 0.51 to 0.68 across different years, with an average of 0.58. From 2015 to 2016, the root mean square error (RMSE) was largely stable and decreased from 54.25 µg/m3 in 2016 to 24.96 µg/m3 in 2021. The mean absolute error (MAE) decreased from 32.42 µg/m3 in 2015 to 14.11 µg/m3 in 2021. The observed reduction in both RMSE and MAE suggests that the uncertainty in PM2.5 estimates gradually decreased over time, primarily due to the improvement in air quality [30]. In recent years, the range of PM2.5 sample data has decreased, whereas the number of ground-based air quality monitors providing multiple samples for model training has increased.

3.1.2. Spatial Performance

The spatial performance of the ten-fold site-based cross-validation used to estimate nighttime PM2.5 concentration in the BTH region from 2015 to 2021 is shown in Figure S1. Although Chengde and Zhangjiakou showed poorer accuracy than the central and eastern BTH regions, the model performed better there. The poor performance of the model can be attributed to the absence of ground stations in these two cities. Figure 1 illustrates that compared with other cities, these two cities have higher altitudes, denser vegetation coverage, and fewer ground monitoring sites, which could result in the model’s subpar performance in these regions. The site-based cross-validations with R2 greater than 0.6 accounted for 32%, 24%, 28%, 32%, 32%, 52%, and 68% from 2015 to 2021. Although there was a slight decline in 2016 and 2017, the proportion of site-by-site R2 was greater than 0.6, increasing annually.
From 2015 to 2021, the BTH region’s nighttime PM2.5 spatial estimation uncertainty is shown in Figure S2. As shown in Figure S2, the RMSE of nearly 90% of the sites was above 30 µg/m3 in 2015, 2016, and 2017, whereas the percentages of sites with an RMSE below 30 µg/m3 for 2018, 2019, 2020, and 2021 were 27%, 44%, 73%, and 87%, respectively. The annual increase in R2 (Figure S1) and decrease in RMSE (Figure S2) indicate that the model has exhibited better performance in recent years as the air quality has improved.
Figures S3 and S4 show the spatial performance and uncertainty of the model based on the leave-one-city cross-validation method to estimate nighttime PM2.5 for the BTH region from 2015 to 2021. The leave-one-city cross-validation method uses data from one city as validation data and the remaining data from the other 12 cities as training data. This process was repeated until all cities were used as validation sets.
The leave-one-city cross-validation results utilized in this investigation exhibited an unsatisfactory performance, as illustrated in Figures S3 and S4. The primary cause of the difference in performance between day and night was the light source. Specifically, sunlight is used during the day, while the light sources for the night include ground light, moonlight, and other sources. However, the energy entering the satellite detector at night is weak and ranges between 10−5 and 10−6 of that in sunlight. Moreover, the radiation intensity of the ground light source is at least ten times greater than that of moonlight [40], making ground light the primary light source for the DNB. As the intensity of the ground light source varies owing to the different economic developments and population densities of each city, the leave-one-city cross-validation process performs poorly at night. Consequently, a localized model is required to better estimate nighttime PM2.5 concentration.

3.1.3. Influence of Input Factors

To test the importance of the model input, we circularly eliminated each input variable and conducted experiments (Table 2). Based on the annual model for 2015−2021, after removing the moon phase angle, the R2 model exhibited the largest decline, followed by RH, BLH, and V10. Finally, SP, U10, T2M, D2M, DEM, and NDVI had relatively weak impacts on PM2.5; however, the lack of any factor had a slight impact on the accuracy of the model. Nighttime illumination data include not only the energy of lunar radiation but also the radiation of ground light. Fine particles in the atmosphere directly affect the upward radiation of light at night, which is directly reflected by the energy levels received by satellites. Therefore, when there is no DNB radiance as an input, the accuracy of the model is reduced.

3.2. Spatial Distribution Characteristics

Figure 5 shows the estimated average yearly concentration of PM2.5 with a spatial resolution of 500 m, in the BTH region from 2015 to 2021. The model employs all samples of the moon phase angle for model training (with moon phase angle from 0 to 180°) in this study, which offers a broader scope compared to previous research (moon phase angle > 120°). The spatial patterns across the different years were consistent. The higher concentration of PM2.5 in the central and eastern parts of the BTH region can be attributed to the high population density, rapid economic development, and unique terrain in cities such as Beijing and Tianjin. In contrast, the northwestern region has less human activity, and PM2.5 concentrations are typically low. Overall, the interannual patterns indicate a decreasing trend of PM2.5 pollution in the BTH region from 2015 to 2021, which is mainly attributed to China’s emphasis on implementing air pollution control measures such as the “Blue Sky Protection Campaign” over these years [41].
Figure 6 shows the seasonal average PM2.5 concentration distribution in the BTH region from 2015 to 2021. There were considerable seasonal variations in the spatial distribution of PM2.5 concentration. With PM2.5 concentrations above 80 µg/m3 in the central and eastern districts of the BTH region during winter, PM2.5 pollution is substantially worse. This phenomenon can be attributed to the heating measures adopted in the northern region during winter. In addition, low temperature and high humidity can facilitate the occurrence of inversion phenomena at night, thereby affecting pollutant diffusion. Conversely, the concentration of PM2.5 in summer was relatively lower. This may be due to frequent rainfall deposition during the summer months. In terms of spatial patterns, the concentrations of PM2.5 in spring and autumn were comparable.

3.3. Applications in Different Scenarios

Figure 7 illustrates the daytime and nighttime variations in air quality from 17 to 21 October 2019, using an air pollution process as an example. The estimated results are shown in Figure 7a,c,e,g. In contrast, Figure 7b,d,f,h show the daytime PM2.5 concentration distributions from the CHAP dataset. Figure 7a shows that on 18 October, PM2.5 concentrations were higher in the early morning in the central and southern cities of the BTH region. The lower wind speed and higher relative humidity in the central, eastern, and southern BTH region led to higher pollution levels on the morning of 18 October (Figure 7b and Figure 8a). On October 19 the central and eastern cities experienced considerable pollution in the early morning (Figure 7c). On 19 October (Figure 7d), the southeasterly wind moved pollutants toward the cities in front of the mountain, resulting in increased pollution levels in Shijiazhuang, Baoding, and other cities (Figure 8b). PM2.5 concentrations decreased in southern Hebei during the early morning of October 20 (Figure 7e) but increased again during the daytime in Shijiazhuang, Handan, and Xingtai (Figure 7f and Figure 8c). The early morning of 21 October was influenced by cold air (Figure 7g). This led to a decrease in PM2.5 concentrations in cities in the northern BTH region (Figure 7h and Figure 8d). Nevertheless, PM2.5 concentrations in the southern cities remained unsatisfactory. By supplementing the data with nighttime PM2.5, we can comprehensively understand the diurnal variation and diffusion/dissipation direction of PM2.5.
The estimated PM2.5 concentration at night before, during, and after the Spring Festival in China is presented in Figure 9. The first, second, and third columns show the estimations before, during, and after the festival, respectively. In 2018, the Chinese government implemented strict regulations limiting the use of fireworks and firecrackers during the Spring Festival. A noticeable trend was observed in the average concentrations of PM2.5 from 2015 to 2017 and from 2018 to 2021. Before Chinese New Year, PM2.5 concentration increased, peaked during the event, and then gradually decreased. Despite overnmentment’s efforts to restrict fireworks, it is difficult to completely ban fireworks during the Spring Festival because of traditional folk customs. Although the air quality has improved annually, there are still substantially higher PM2.5 concentrations during the Spring Festival. However, compared with 2015–2017, PM2.5 pollution levels were lower before and after the Spring Festival in 2018–2021.
As one of China’s foremost centers for steel production, Tangshan produces a significant amount of particulate matter during its production process. As a result, the concentration of PM2.5 in Tangshan was higher than that in other regions. Figure 10 shows the average yearly PM2.5 concentration in Qian’an, BTH, in 2016. The figure reveals high PM2.5, which is abundant in iron ore resources and has a high concentration in iron factories. To further illustrate this, two images (obtained from Google Maps) show images of two steel mills located at (118.68662°E, 39.92575°N) and (118.59248°E, 39.90758°N), respectively. Owing to the presence of steel mills, PM2.5 concentrations are expected to be higher at night in and around the region. Consequently, monitoring PM2.5 concentration during nighttime is crucial for single-point monitoring, such as in heavy industry factories, or continuous monitoring covering both day and night. Because steel mills may emit PM2.5, it is necessary to monitor nighttime emissions and single-point exceedance of steel mills to assess their health risks and provide valuable references for environmental policies and public health.

4. Discussion

In this section, we compare our results with those of previous studies and discuss the trend consistency of nighttime PM2.5 concentration with daytime PM2.5 on interannual and daily scales.
Table 3 summarizes the different models used in previous studies, which are usually limited by their sample size and research duration. First, in terms of data volume, the sample size of this study was nine times that of other existing research samples (maximum value), reflecting the diversity of the samples. Simultaneously, due to a large amount of data and multiple features, the DNN model has a better nonlinear fitting ability. Second, in terms of time span, this study uses data for all moon phase angles, which can obtain a long-term series of datasets and estimate long-term, continuous PM2.5. Most of the existing studies use cloudless and moonless data (moon phase angle > 120°) to construct the model, which affects the amount of data available for research. In this study, the lunar phase angle was used as the input of the model to estimate long-term nighttime PM2.5, with improved spatial and temporal resolution (2015–2021). Compared to previous studies, this improvement in data quality and resolution allows for a more accurate analysis.
Figure 11 illustrates the annual average PM2.5 concentration during the daytime and nighttime at four urban sites from 2015 to 2021. Data from the CHAP dataset were used to represent daytime PM2.5; Day_CHAP is the estimated daytime concentration, and Day_site is the measured value at the site during the same period. Night_Model represents the estimated concentration of this study, and Night_site represents the measured value of the site in the same period. Figure 11a shows the site (116.4072°E, 39.8863°N) located in Beijing. The annual average concentration showed a year-by-year decrease in PM2.5, and the concentration difference between daytime and nighttime was minimal. The site in Tianjin (117.202°E, 39.0927°N), shown in Figure 11b, presented a similar trend of annual decrease; however, the results indicated an underestimation of both daytime and nighttime PM2.5 concentrations. Figure 11c shows the changes in the site (112.5331°E, 38.0178°N) in Shijiazhuang City, where the PM2.5 concentration showed a slight peak in 2016 and a continuous steady decreasing trend from 2017 to 2021. Figure 11d shows the changes at the site (112.4704°E, 37.0886°N) located in Xingtai, a southern city in the BTH region. The concentration of PM2.5 decreased from over 100 µg/m3 in 2015 to roughly 40 µg/m3 in 2021. Although there were significant discrepancies between daytime and nighttime PM2.5, across different sites and years, the results from different cities demonstrated a consistent interannual variation trend in both daytime and nighttime PM2.5.
To further illustrate the differences in PM2.5 concentration between day and night, we calculated the quarterly average error from 2015 to 2021 (Figure 12). The absolute difference in PM2.5 concentration between day (CHAP) and night was used for calculation. It can be observed from Figure 12 that the error in winter was higher than that in the other three seasons, and the maximum error was 58.93 μg/m3. By contrast, the error in summer was the smallest, with a difference of 9.82 μg/m3.
Although this study generated a dataset of nighttime PM2.5 concentrations for the BTH region from 2015 to 2021, some limitations need to be considered. The proposed model has only been tested in the BTH region and requires further validation through an expanded spatial scale and an extended time-series investigation. Land-use change, population migration, or industrial growth may affect PM2.5 concentration, but they are not reflected in this study, and their impact on the model will be discussed in a future study. Moreover, VIIRS/DNB radiances are mainly derived from moonlight and ground light. To more accurately estimate nighttime PM2.5, atmospheric contributions must be obtained by implementing a nighttime low-light radiation transfer model. Therefore, there is an urgent need to develop such models. In existing research, scholars have combined the lunar irradiance model (MT2009) with the daytime radiative transfer model (SCIATRAN) to obtain a radiative transfer model using moonlight as the light source [45]. Subsequent research will focus on a radiative transfer model derived from a combination of moonlight and ground light.

5. Conclusions

A deep neural network model was developed using VIIRS/DNB, moon phase angle, ERA5 meteorological data, NDVI, and DEM as inputs to generate a dataset for nighttime PM2.5 from 2015 to 2021. Our findings show that the developed model reliably estimates PM2.5, which is crucial for continuous daytime and nighttime air pollution monitoring. Our results suggest that the proposed model is a valuable reference for day and night monitoring.
(1)
Studies have shown that the proposed model outperforms most existing models, including MLR, BP, and SVM, in terms of time coverage and spatial resolution. Among them, the R2 of the 2015–2021 model is 0.56, 0.55, 0.51, 0.53, 0.58, 0.68, and 0.63, respectively. Cross-validation based on samples, sites, and leaving one city showed that the models in this study had better spatial performance. The method of circularly removing each input variable showed that the input variables used in this study had an impact on the estimation of PM2.5 and that the model performed best when all input variables were used.
(2)
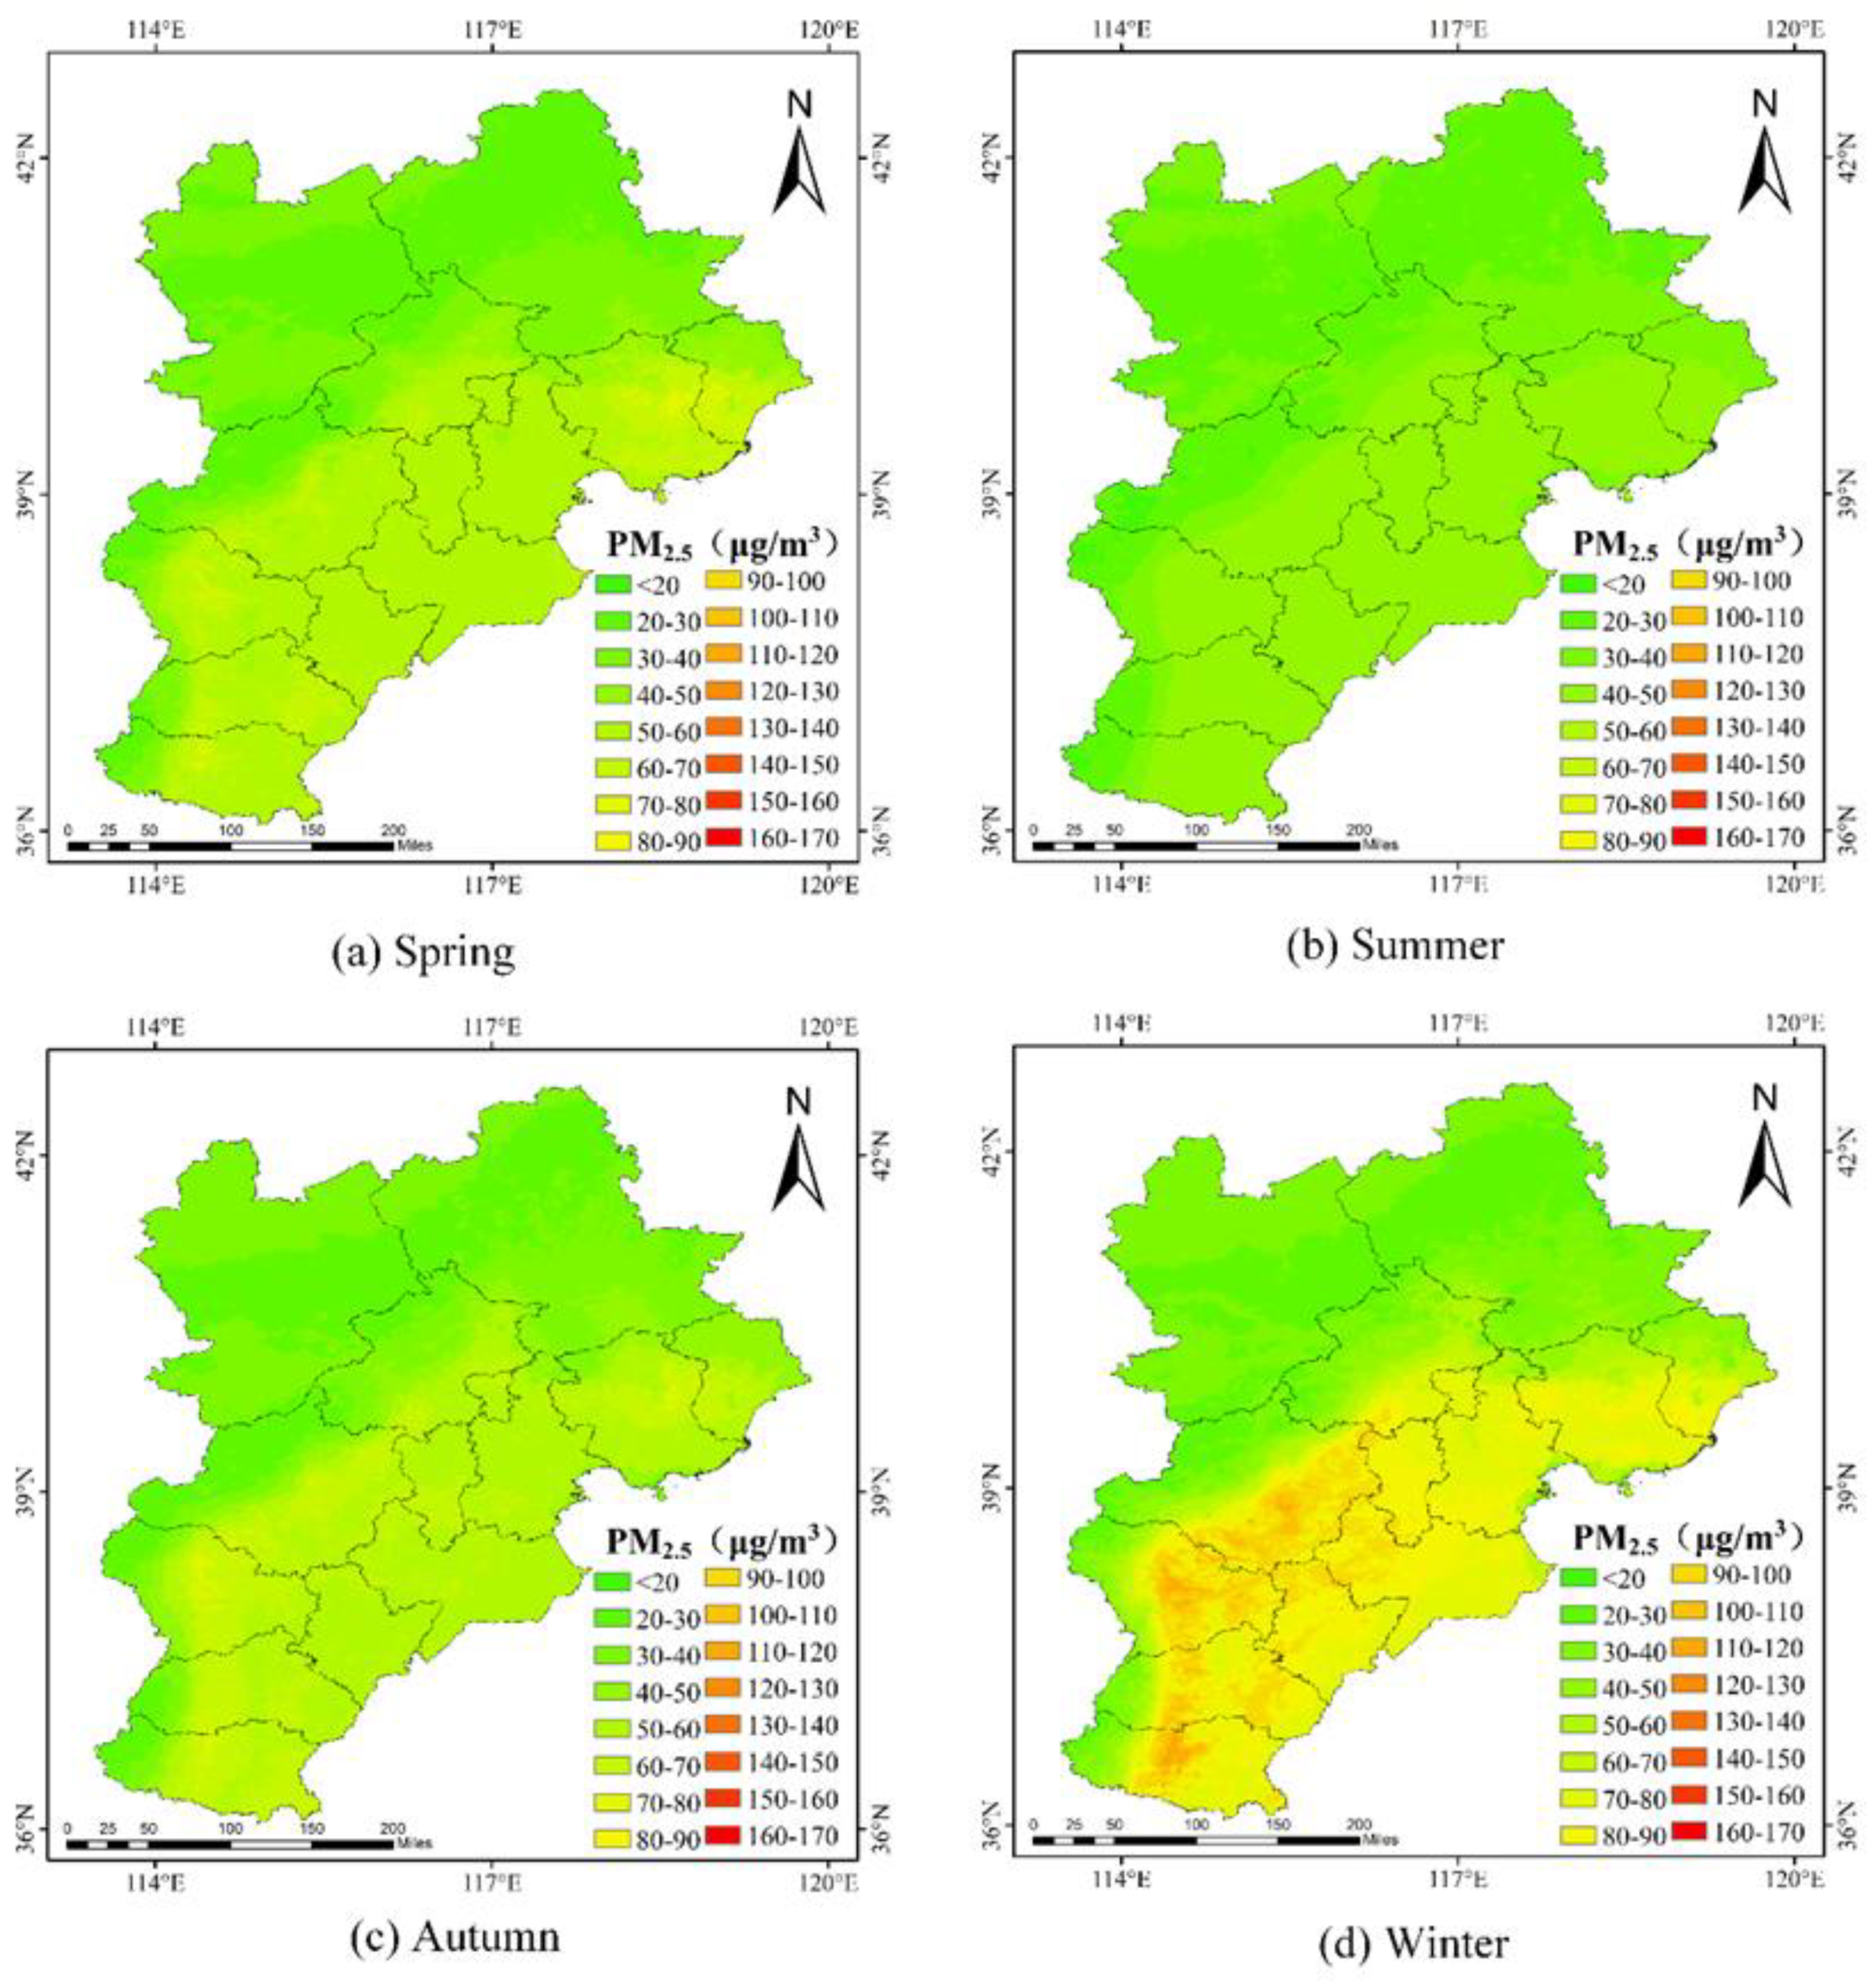
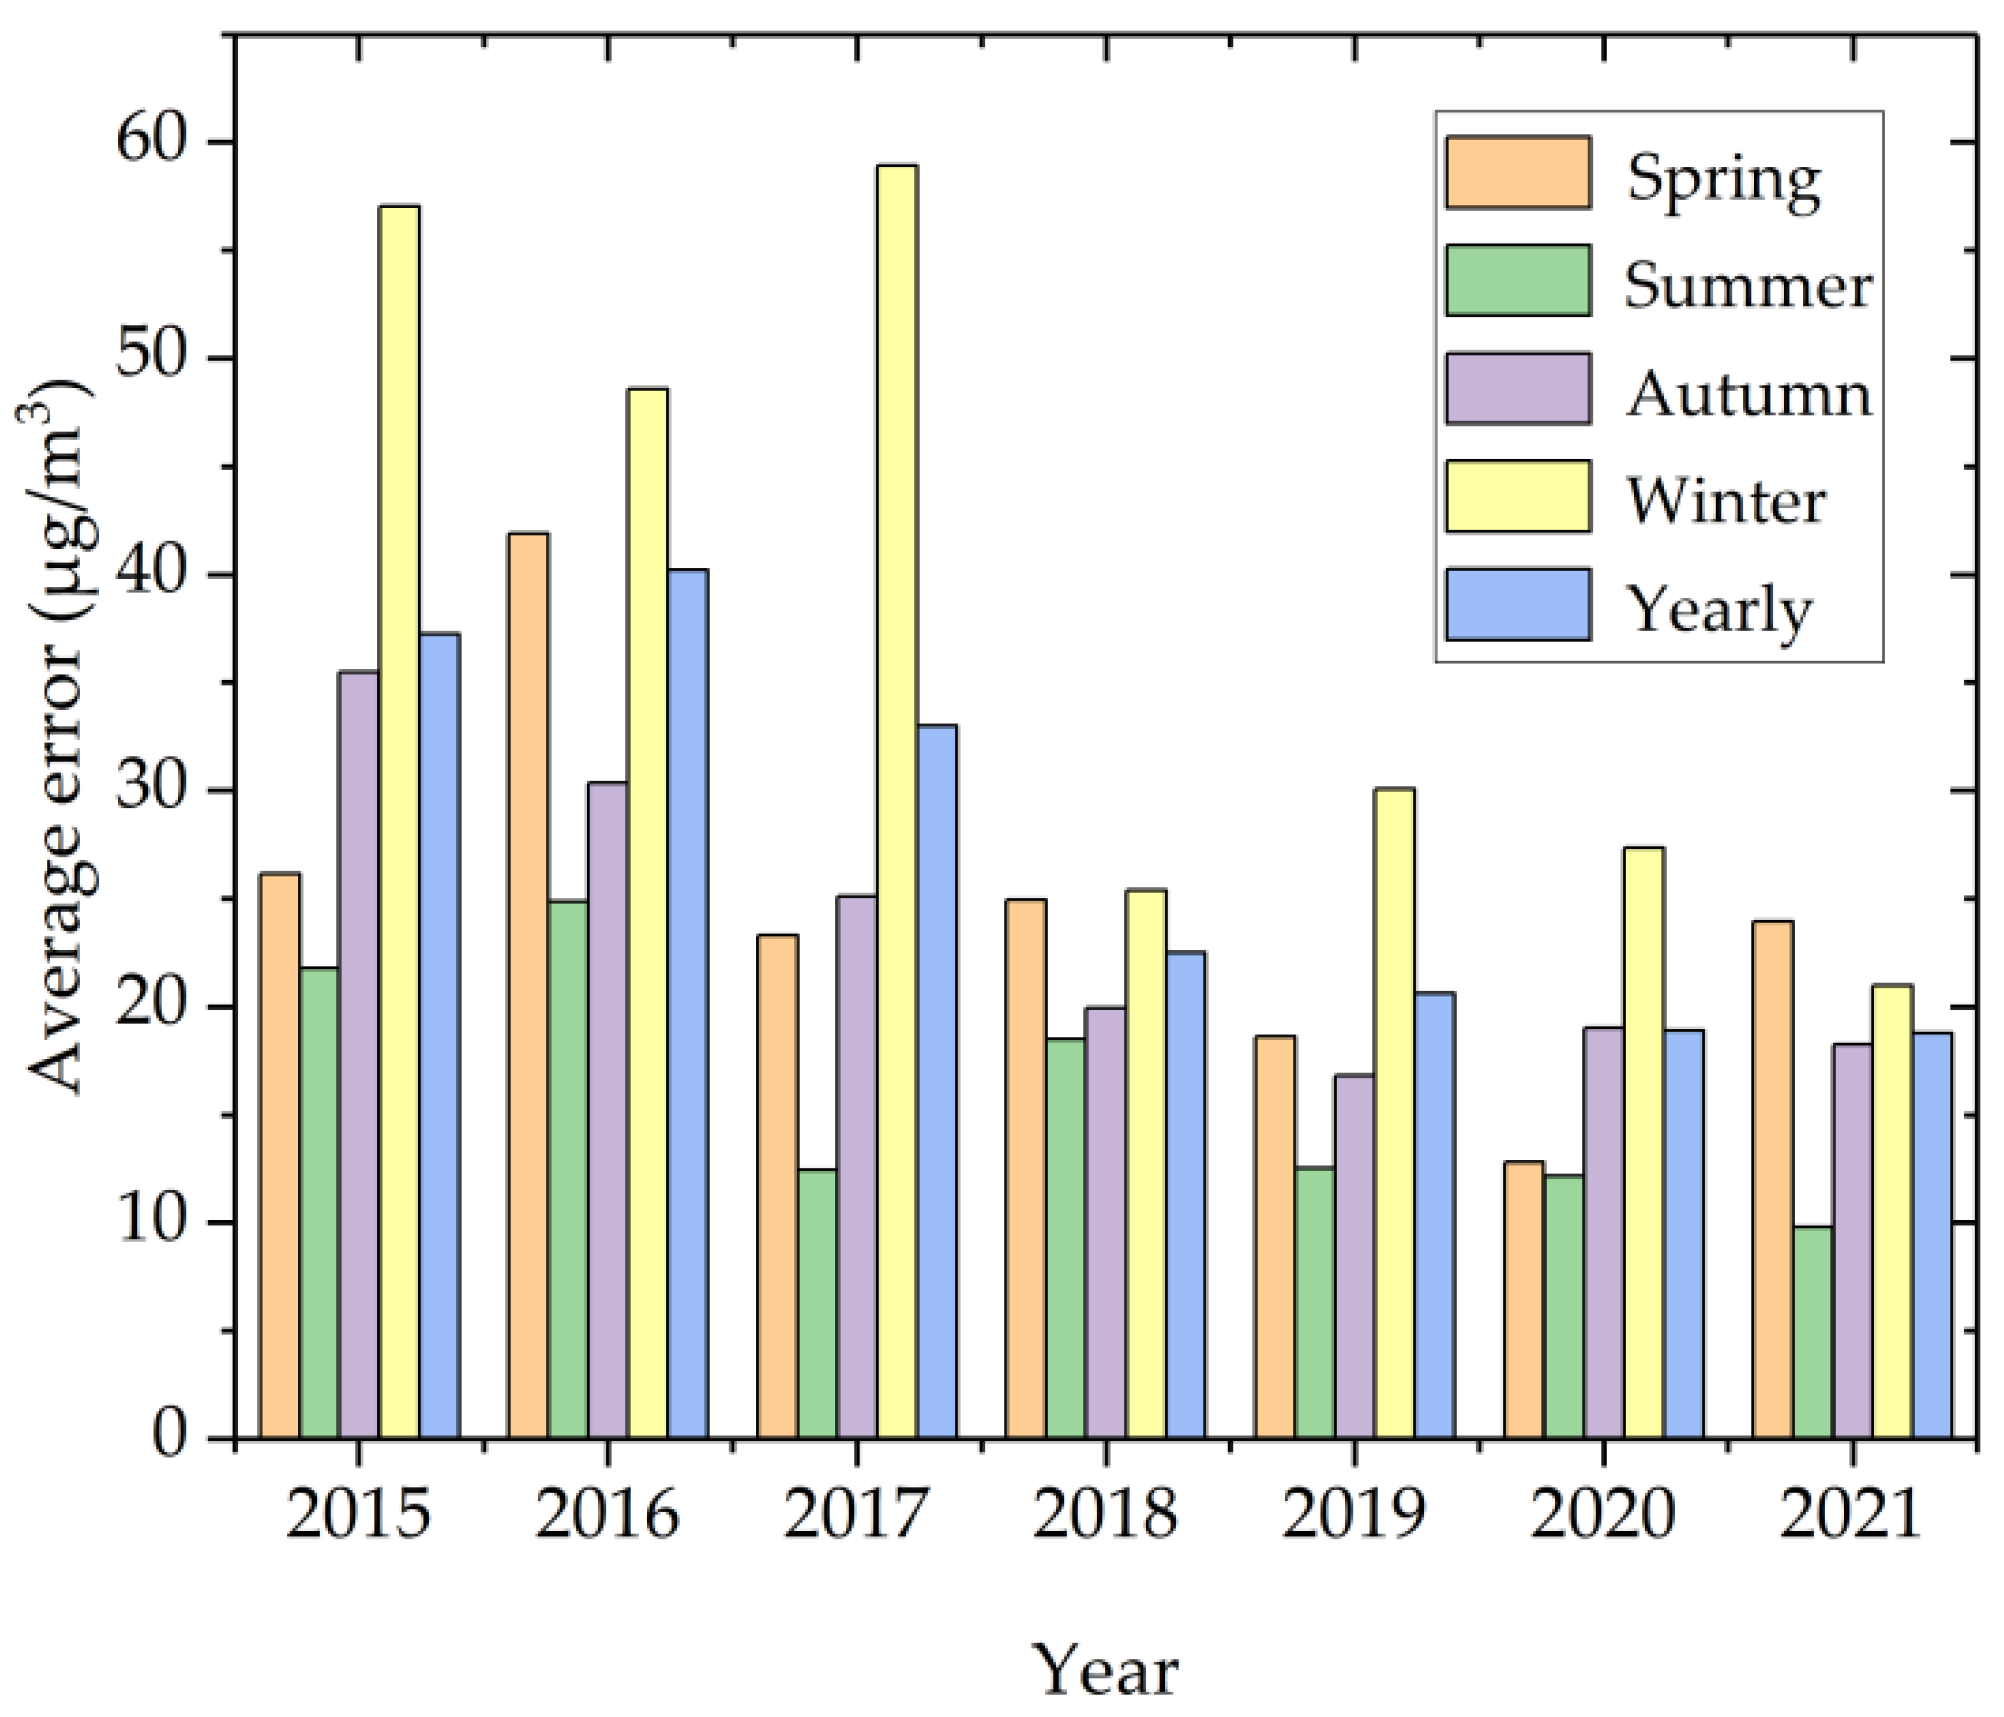
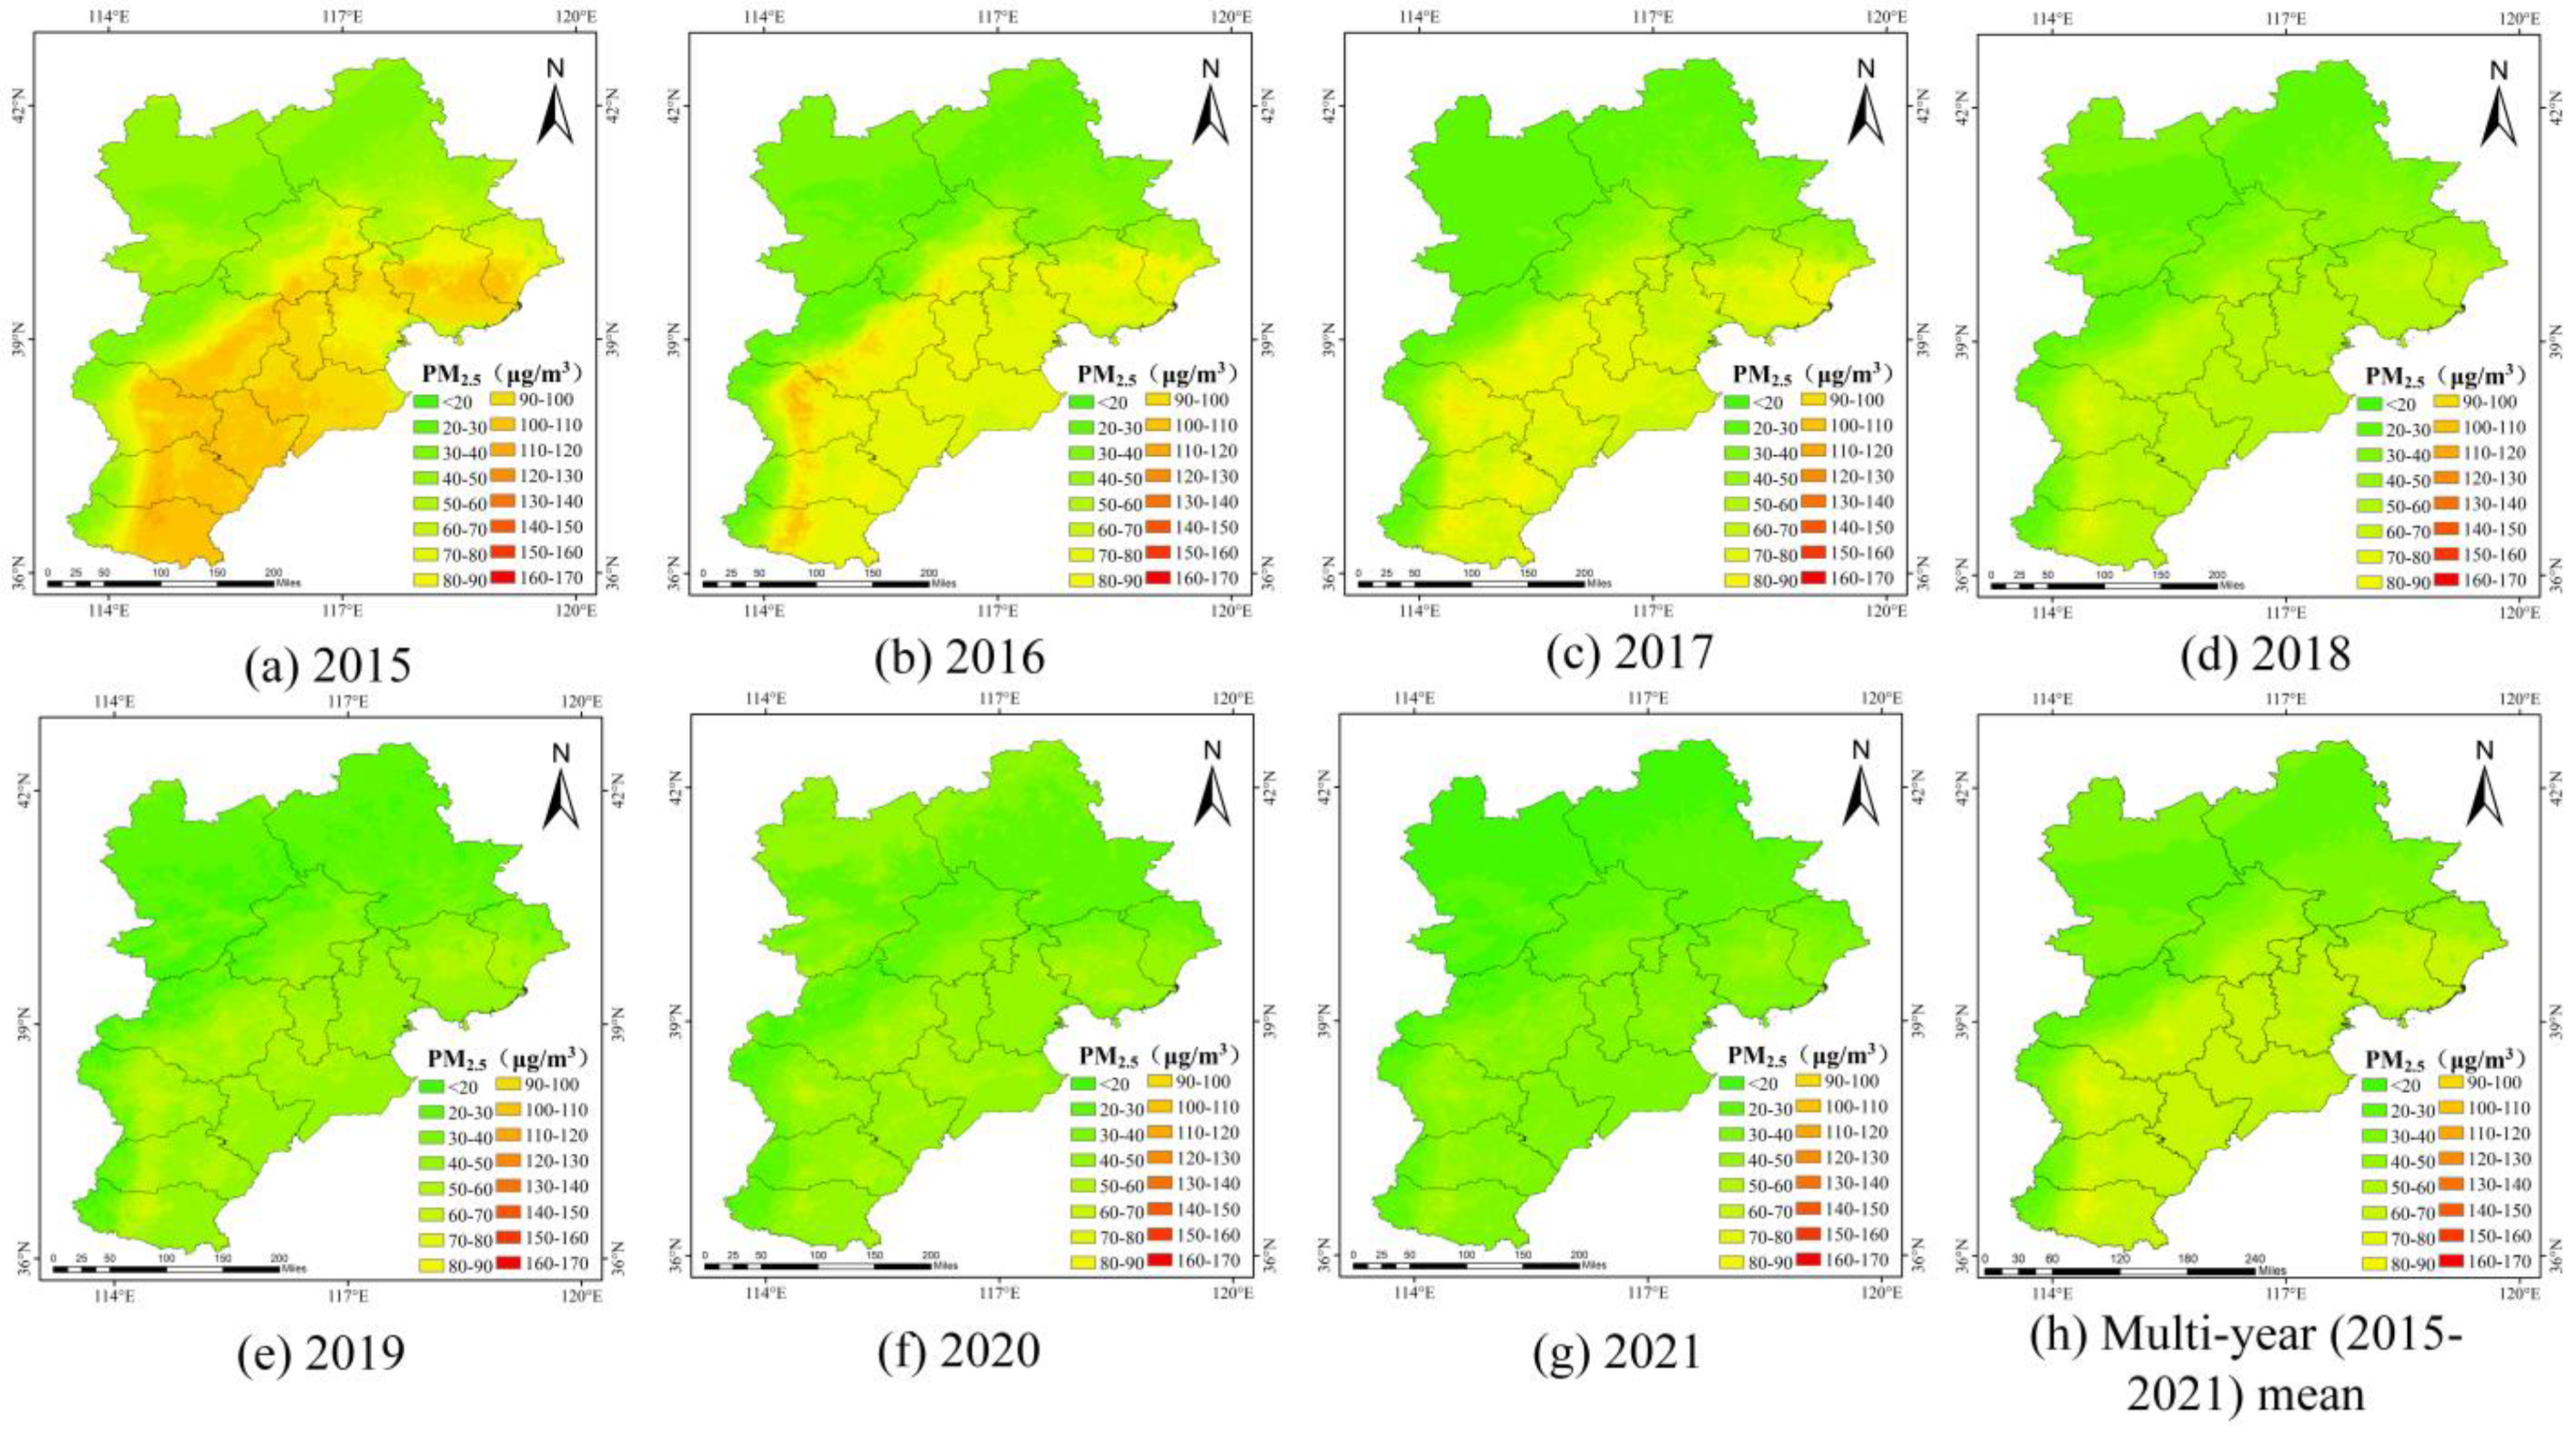
This study produced a map of nighttime PM2.5 concentrations for 2015–2021, which exhibited a yearly decrease. The lowest PM2.5 was recorded in summer, followed by spring and autumn, with the highest levels recorded in winter. Higher pollution levels were observed in the central and eastern parts of the BTH region, whereas lower levels were observed in the northwest region.
(3)
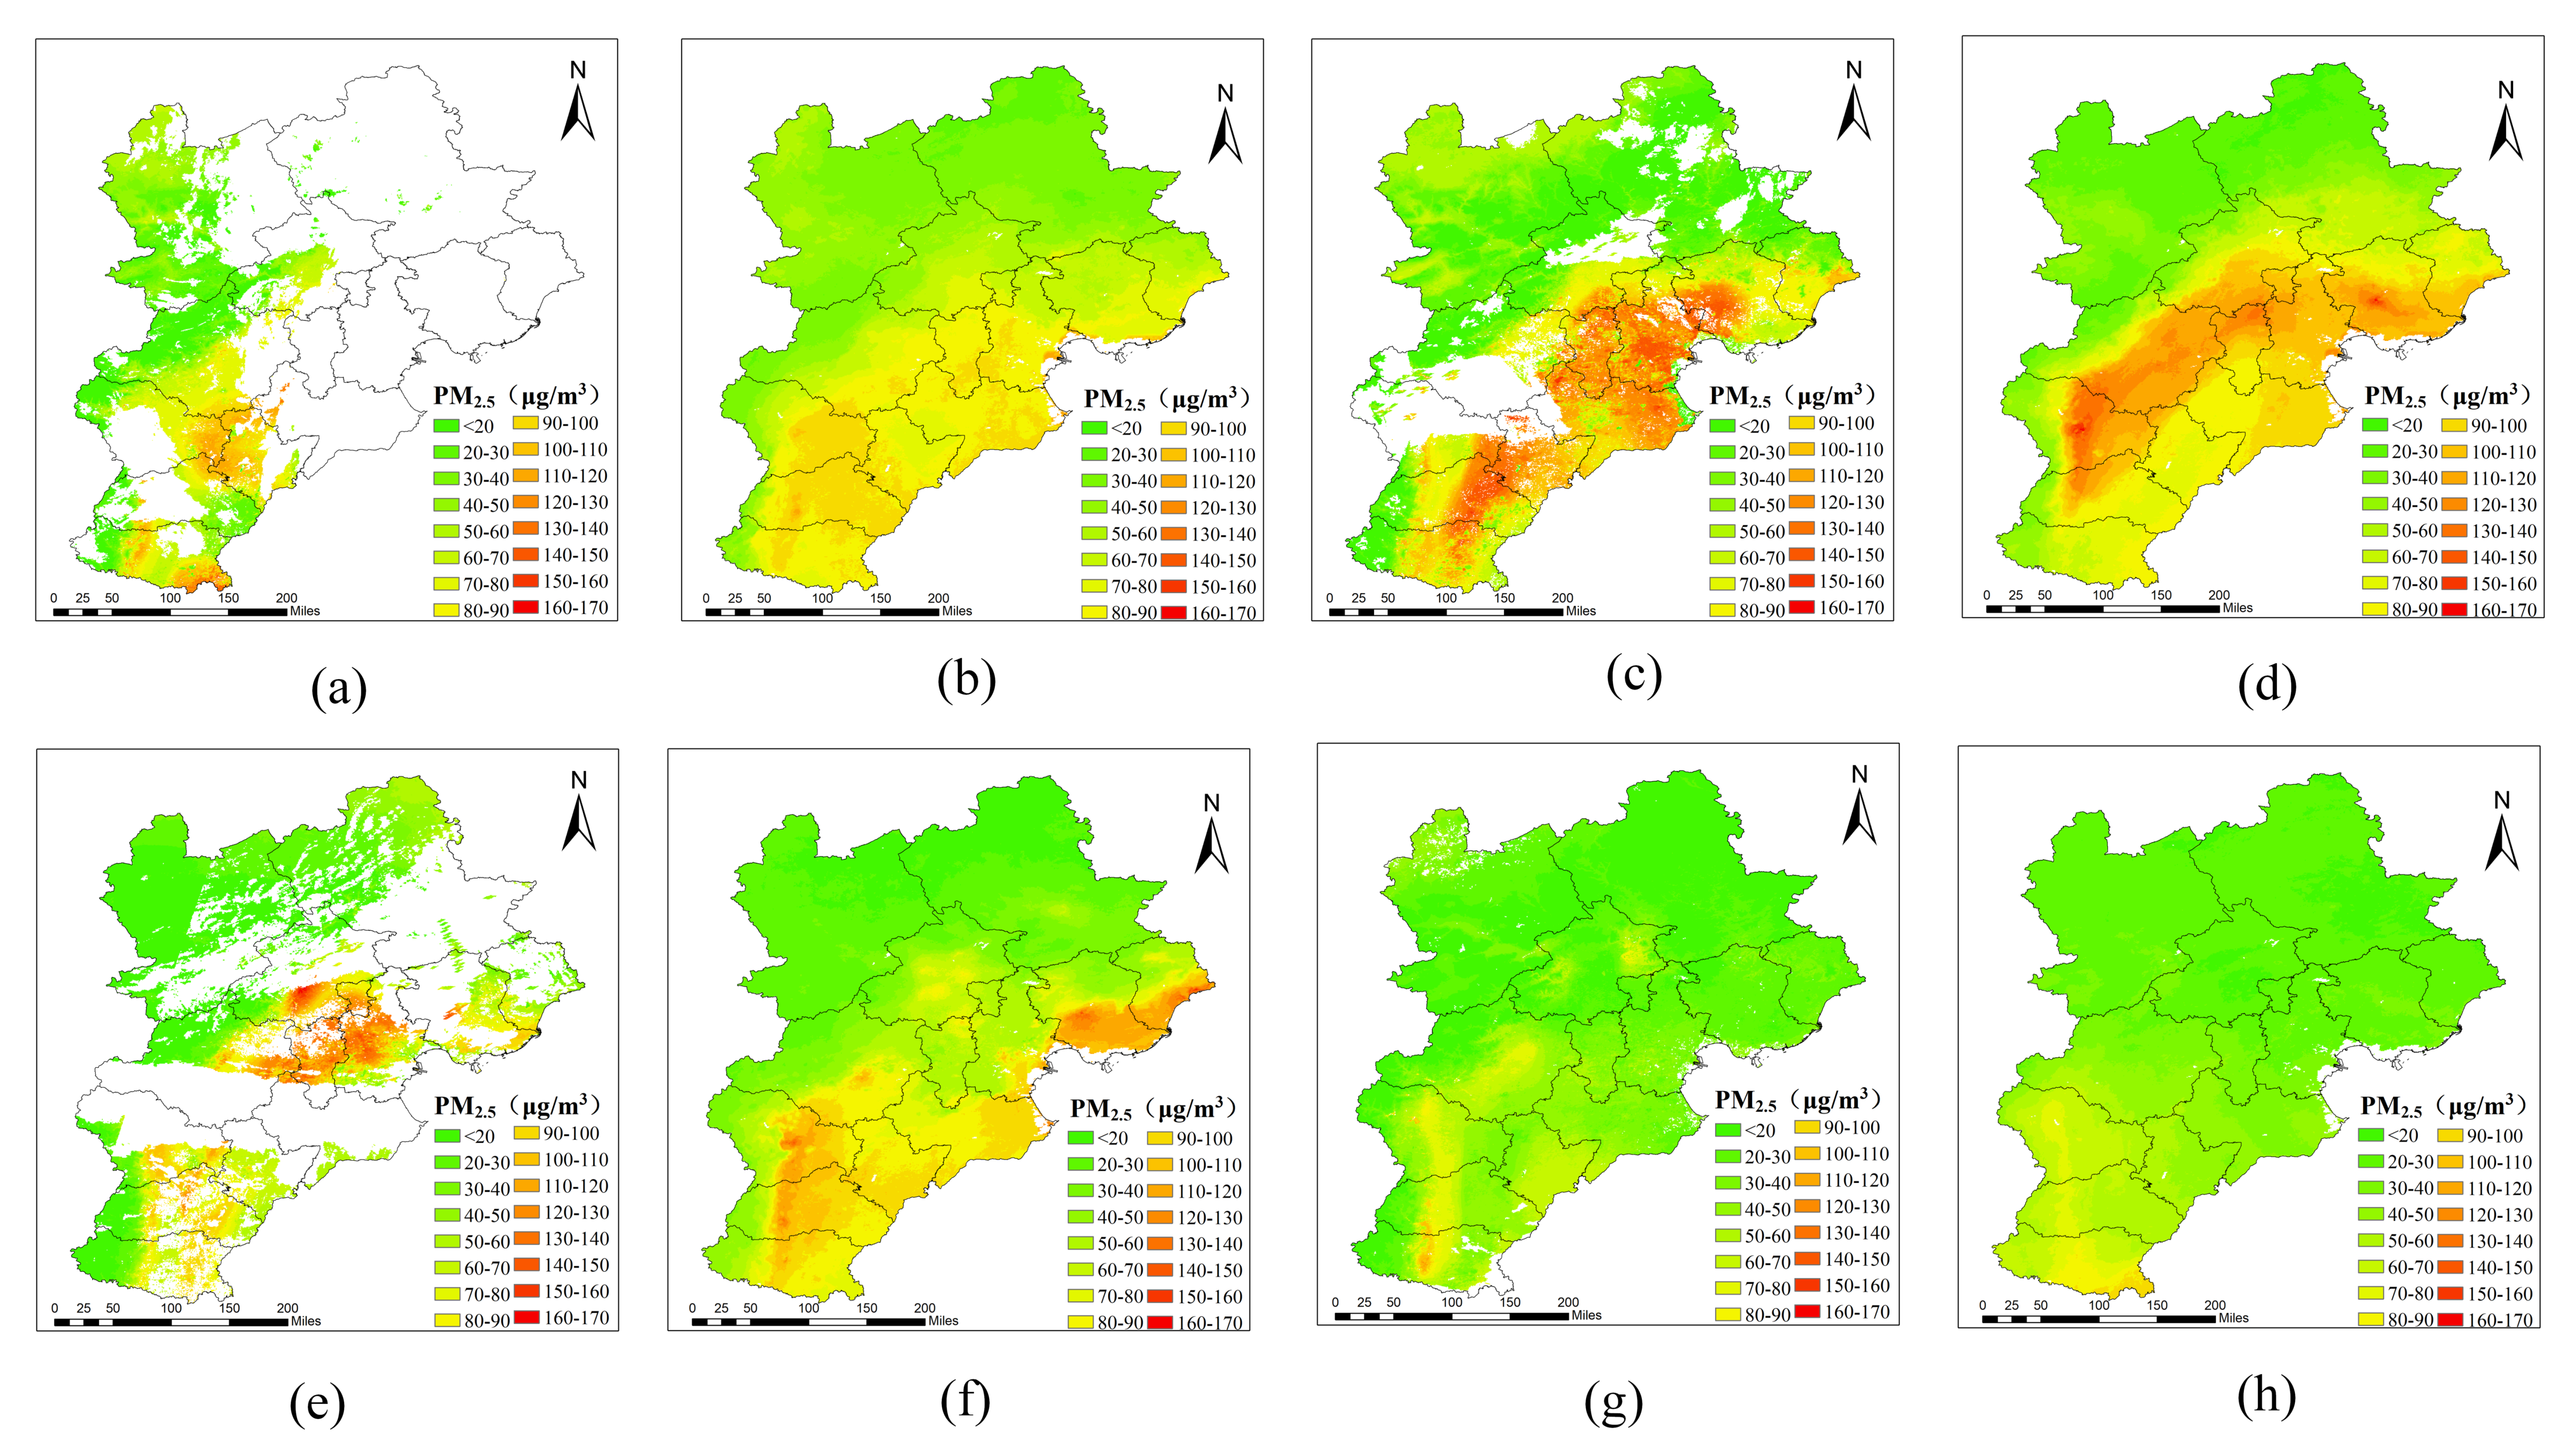
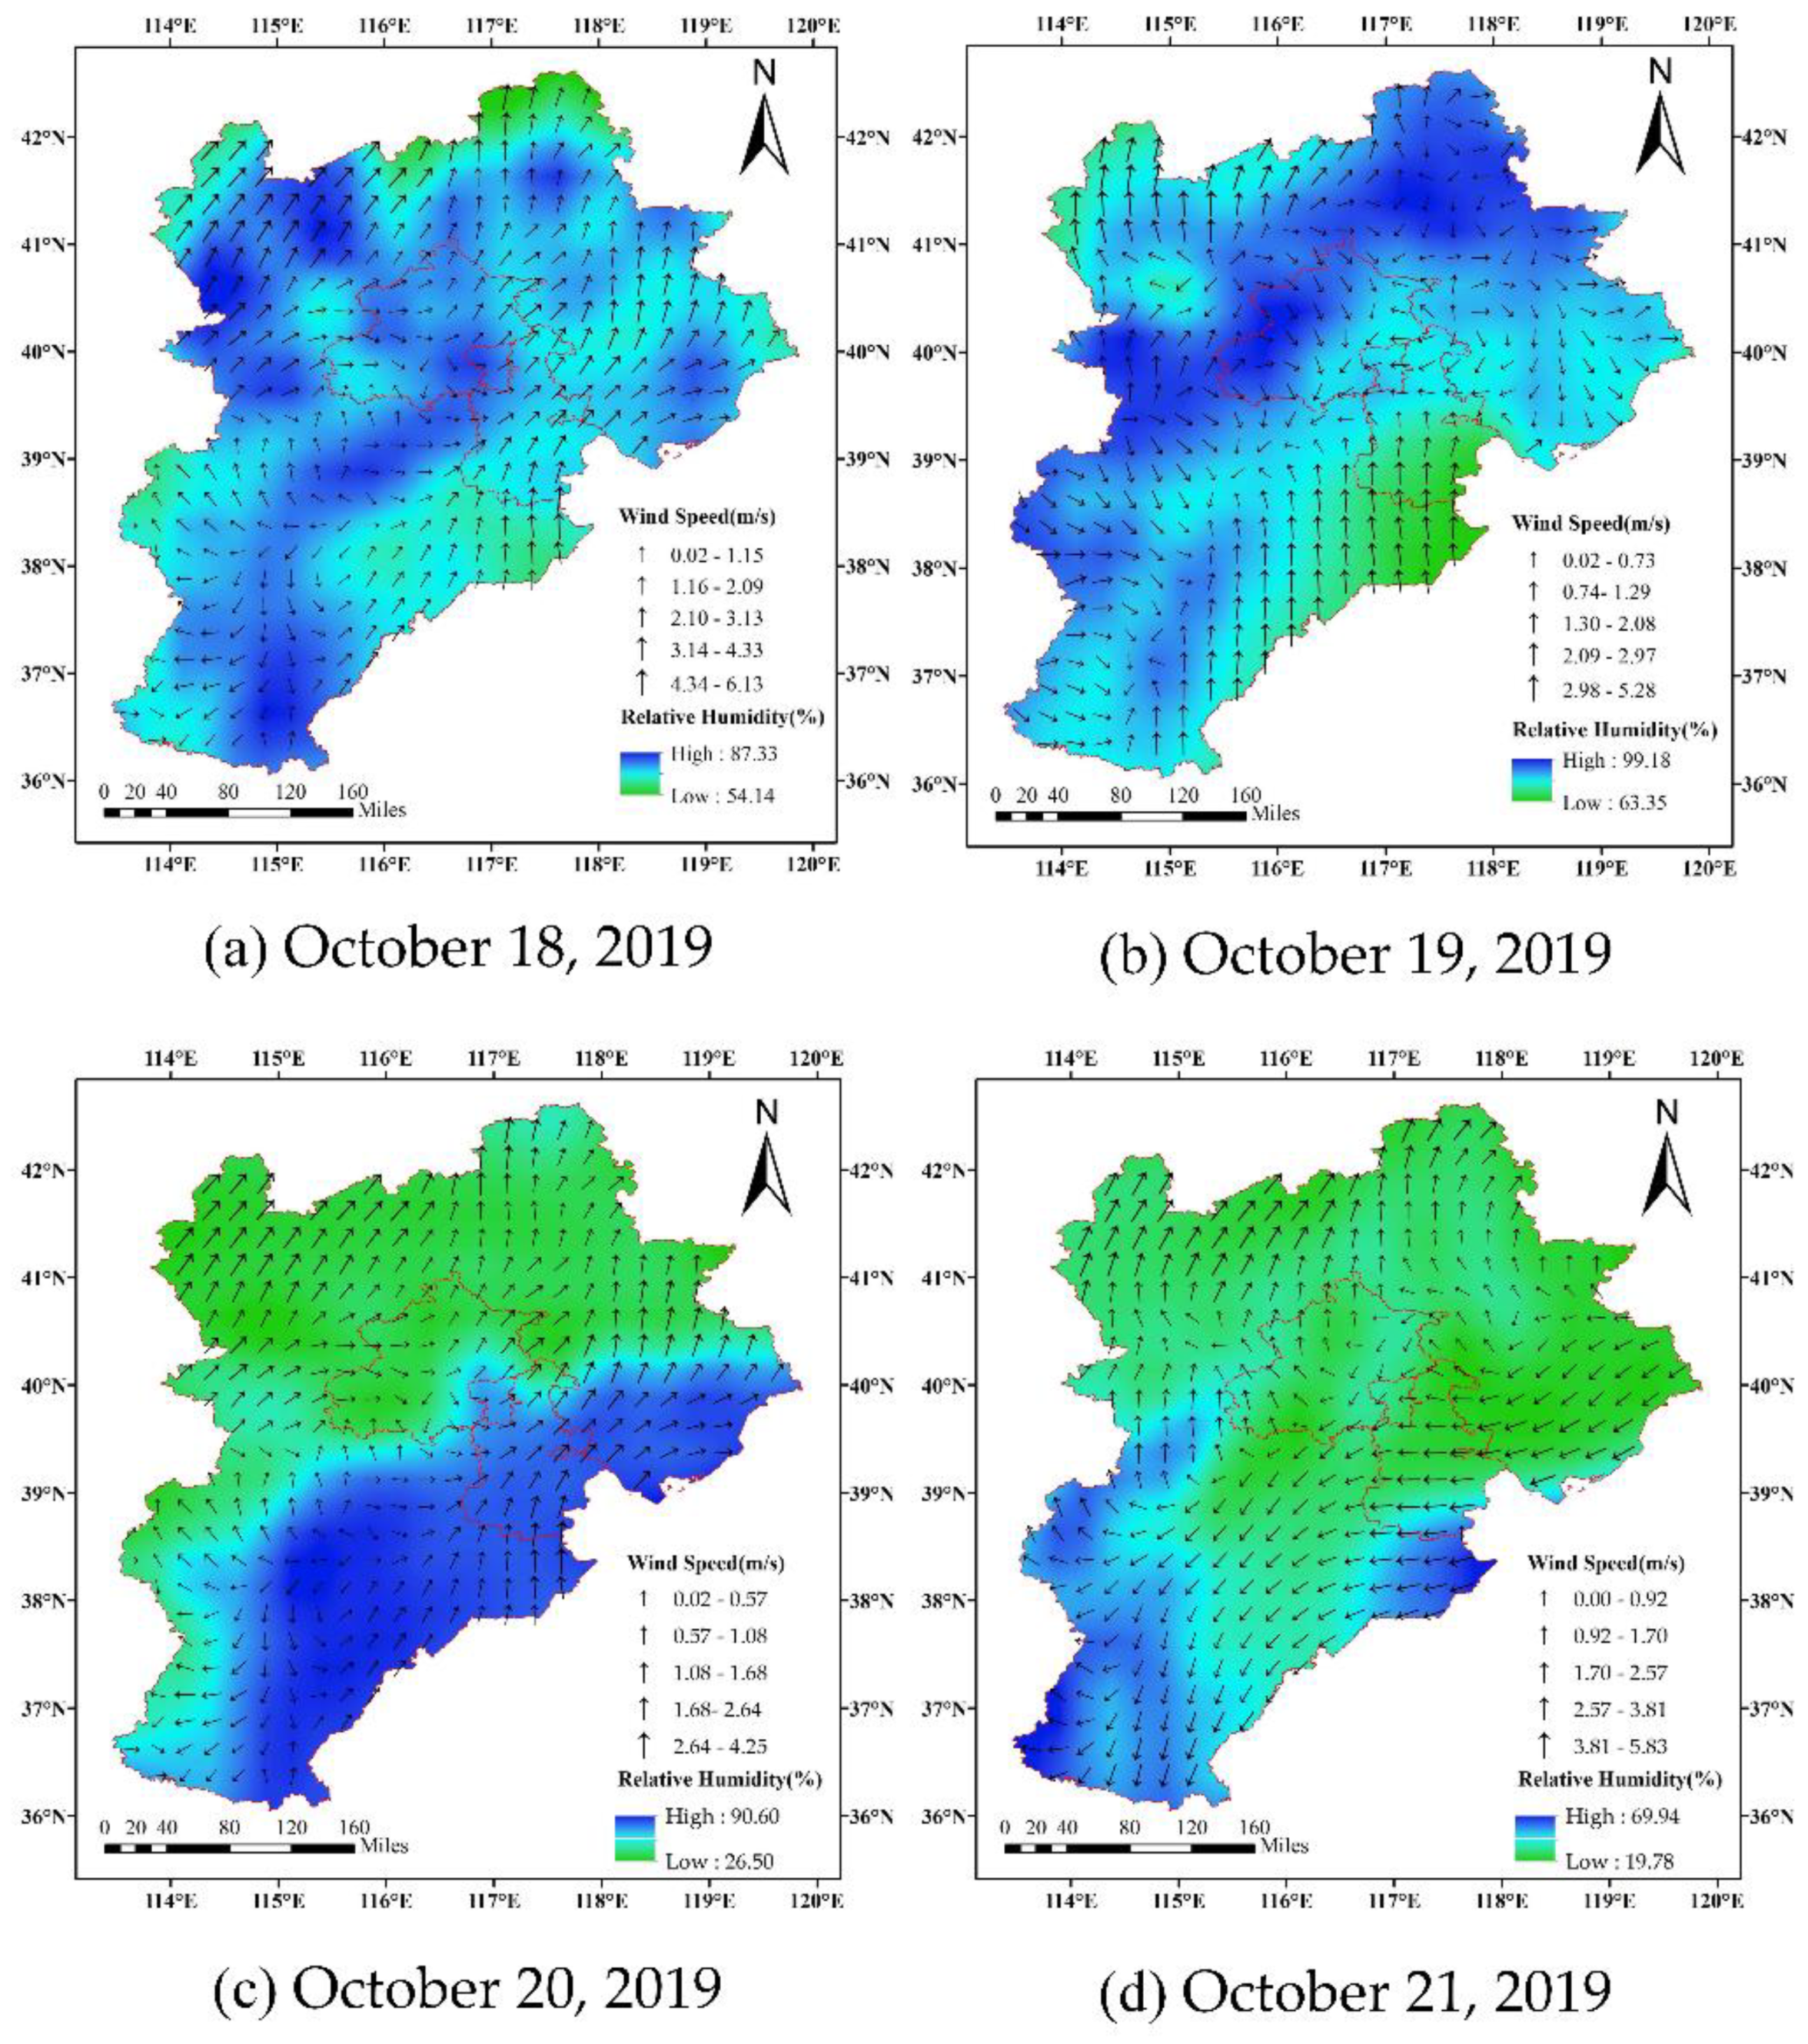
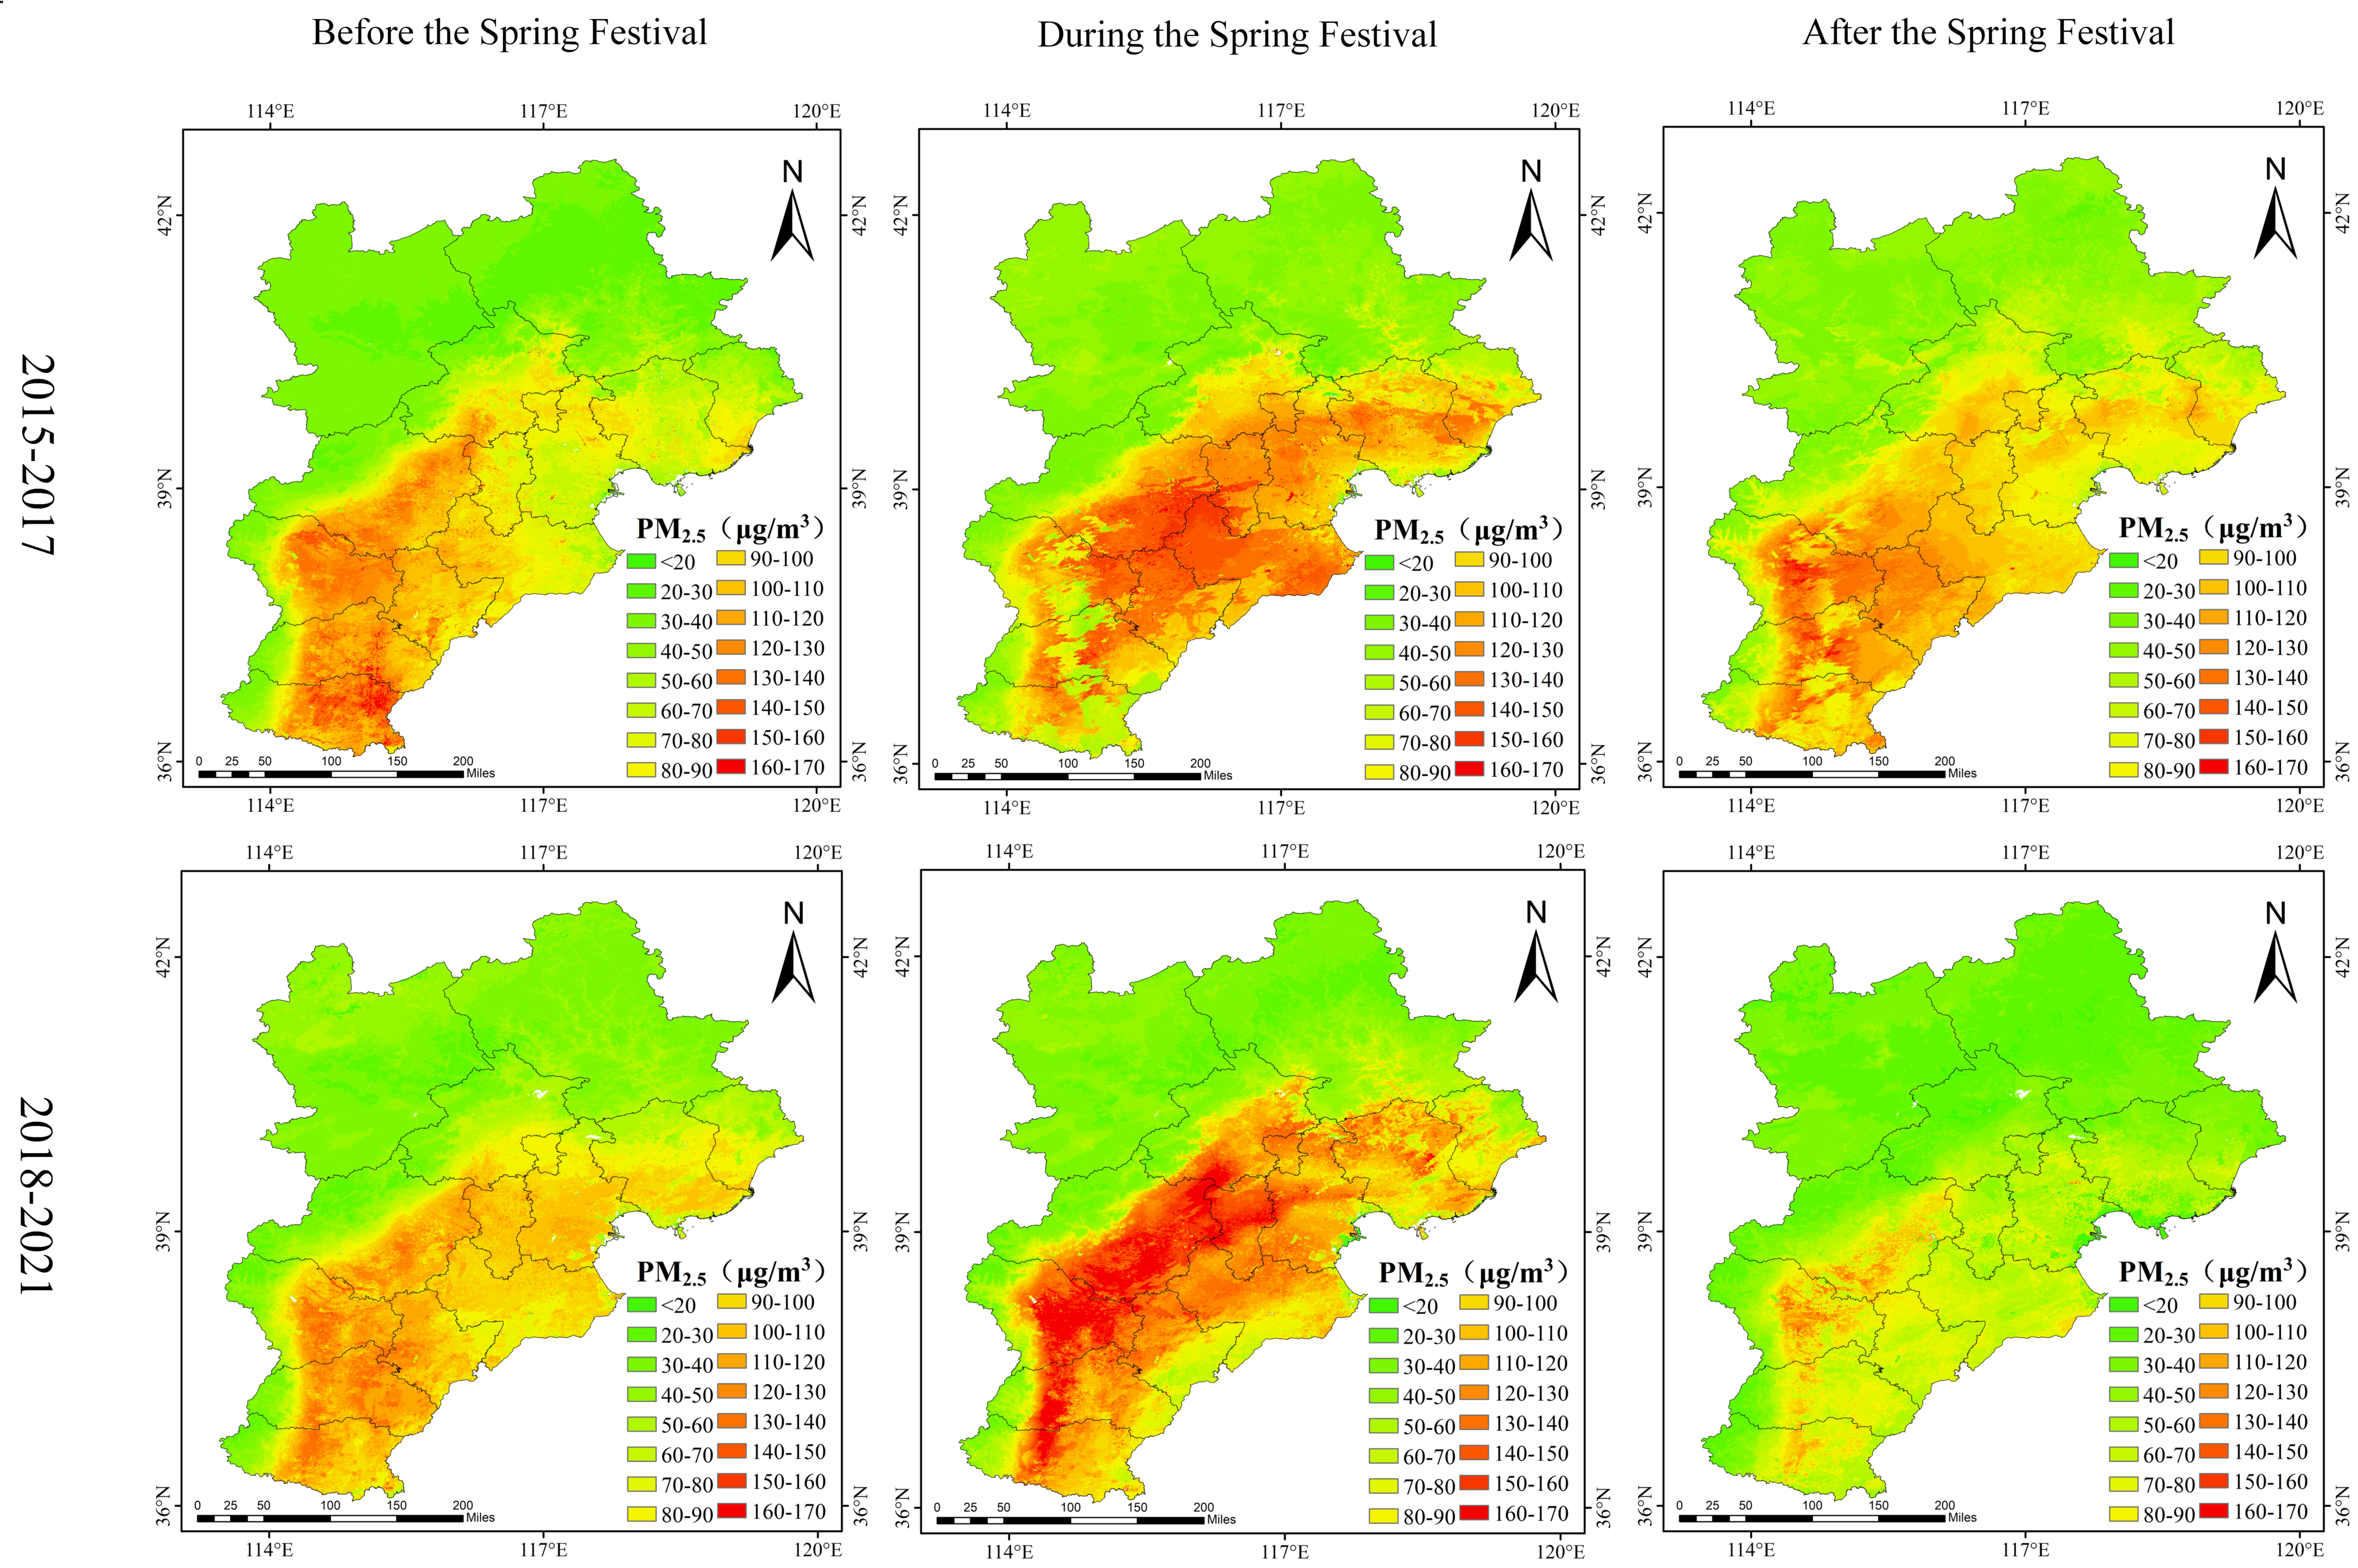
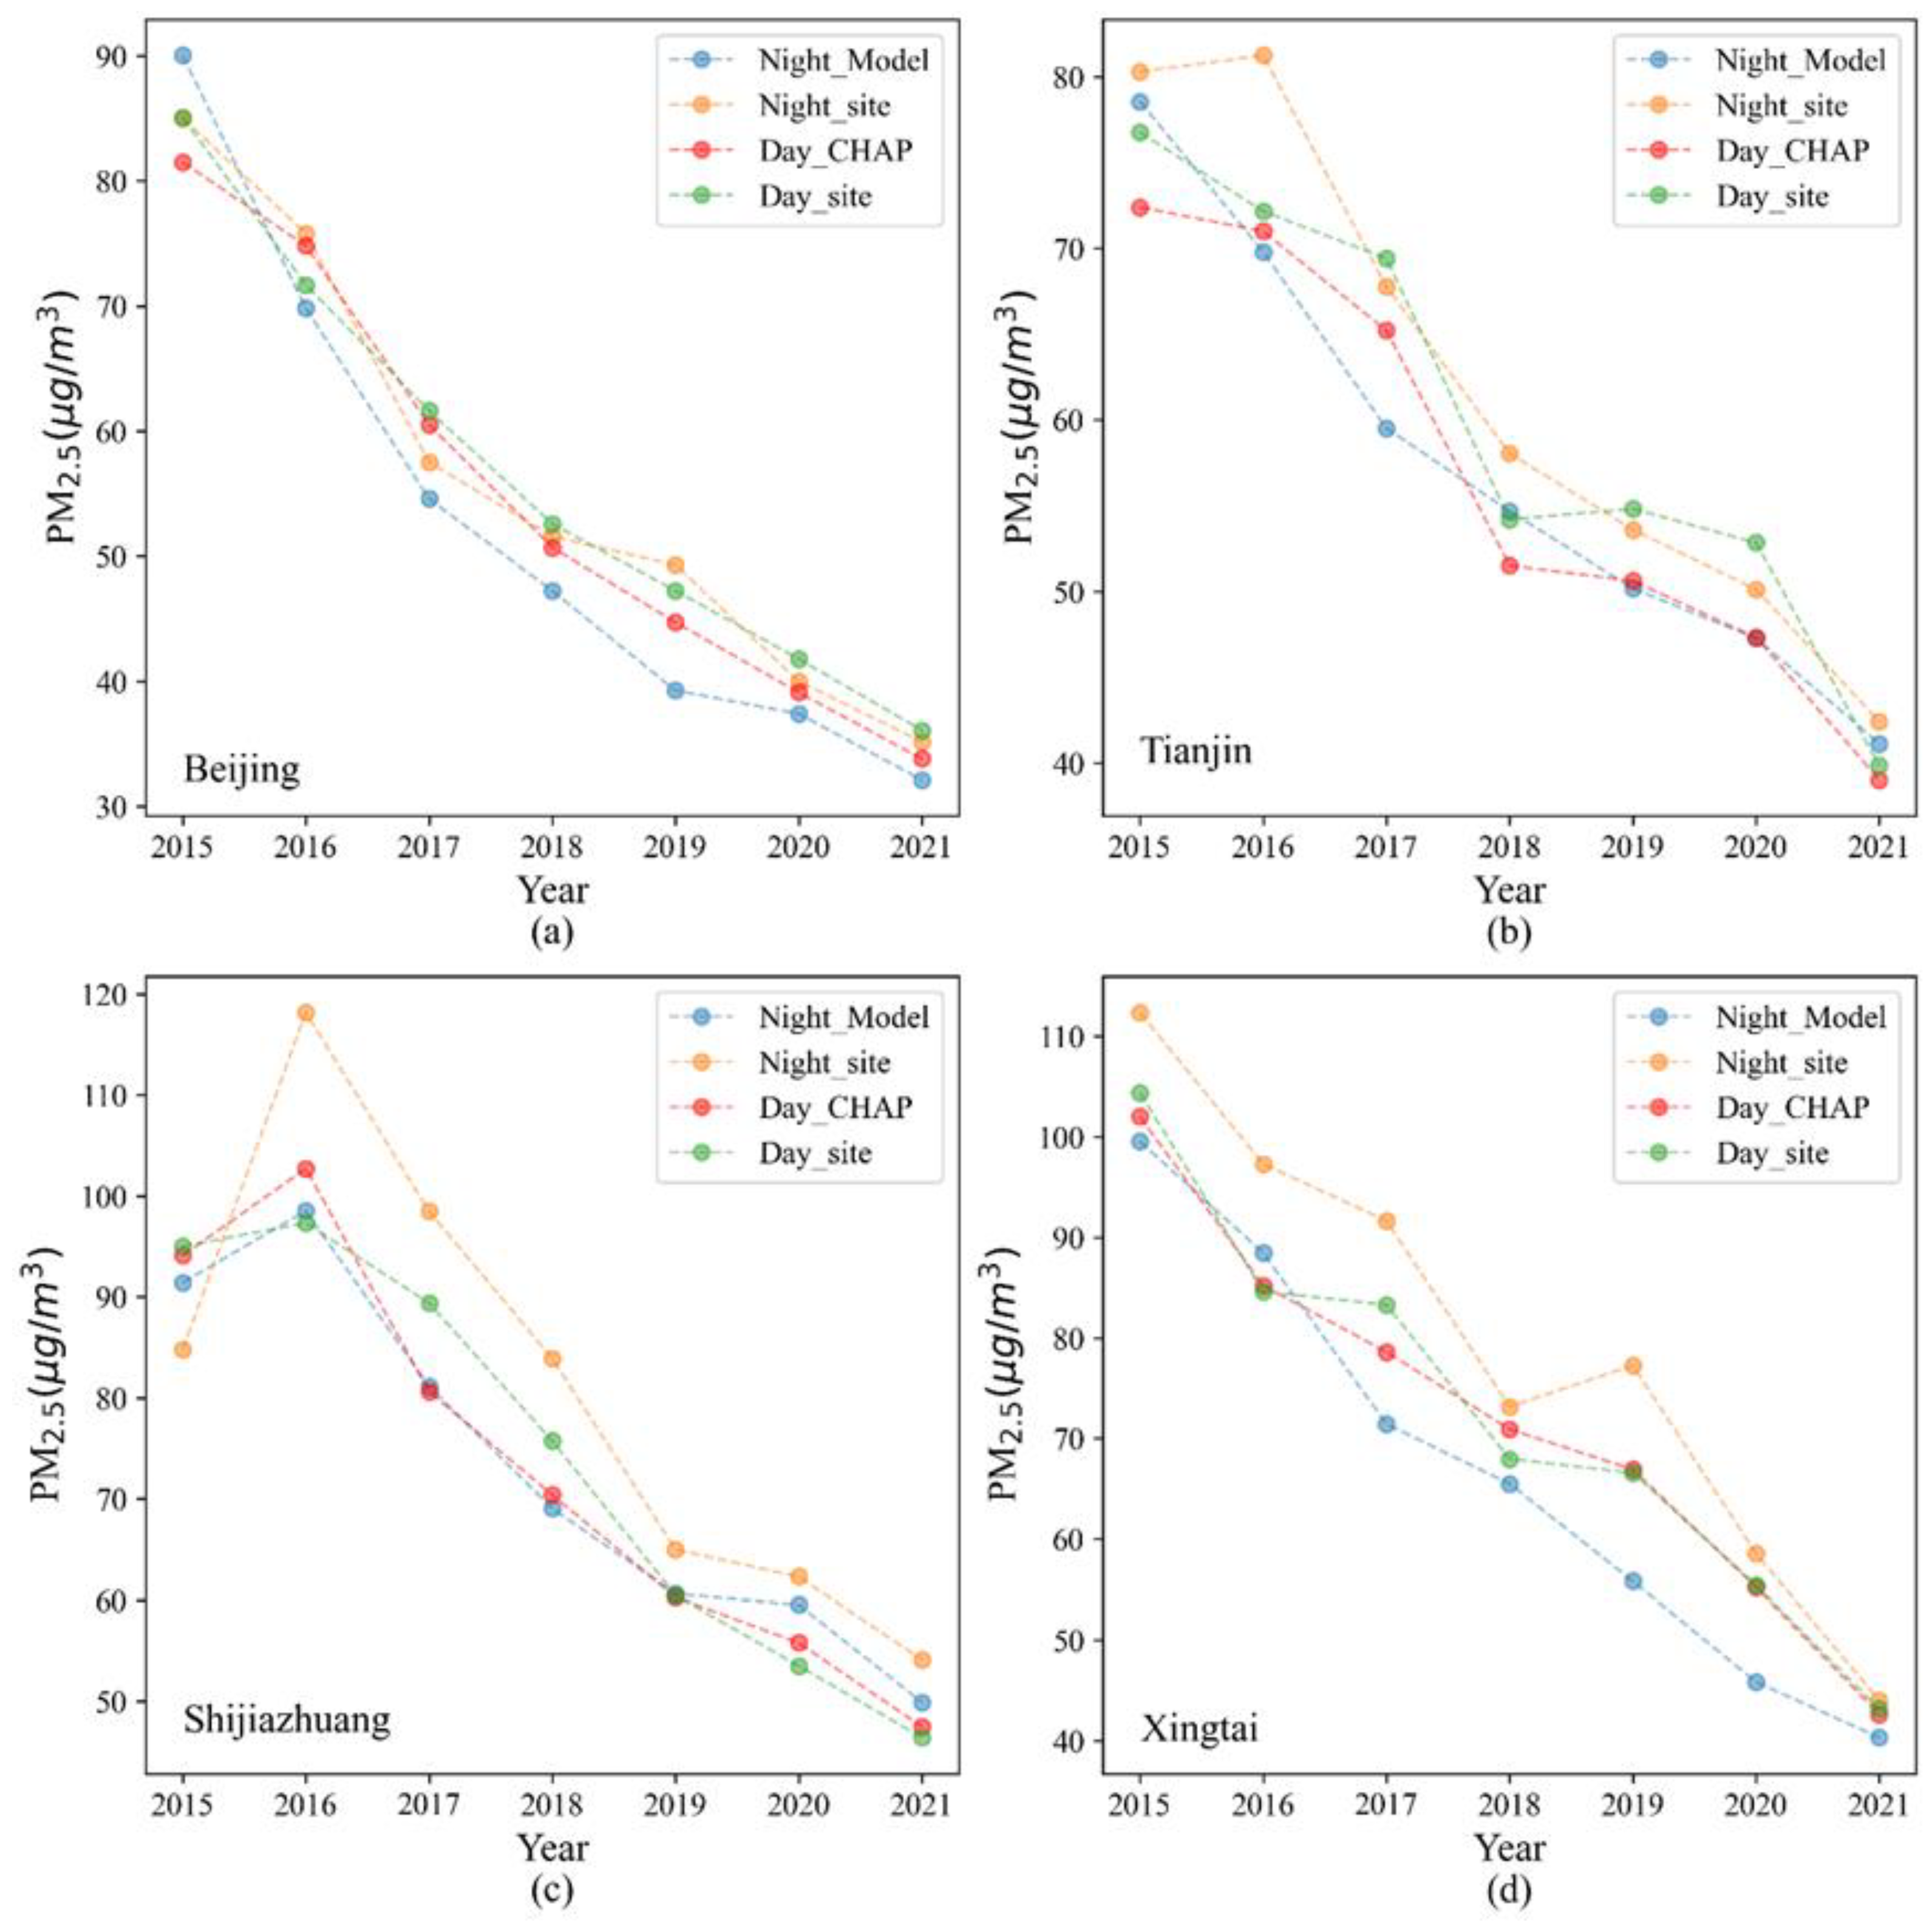
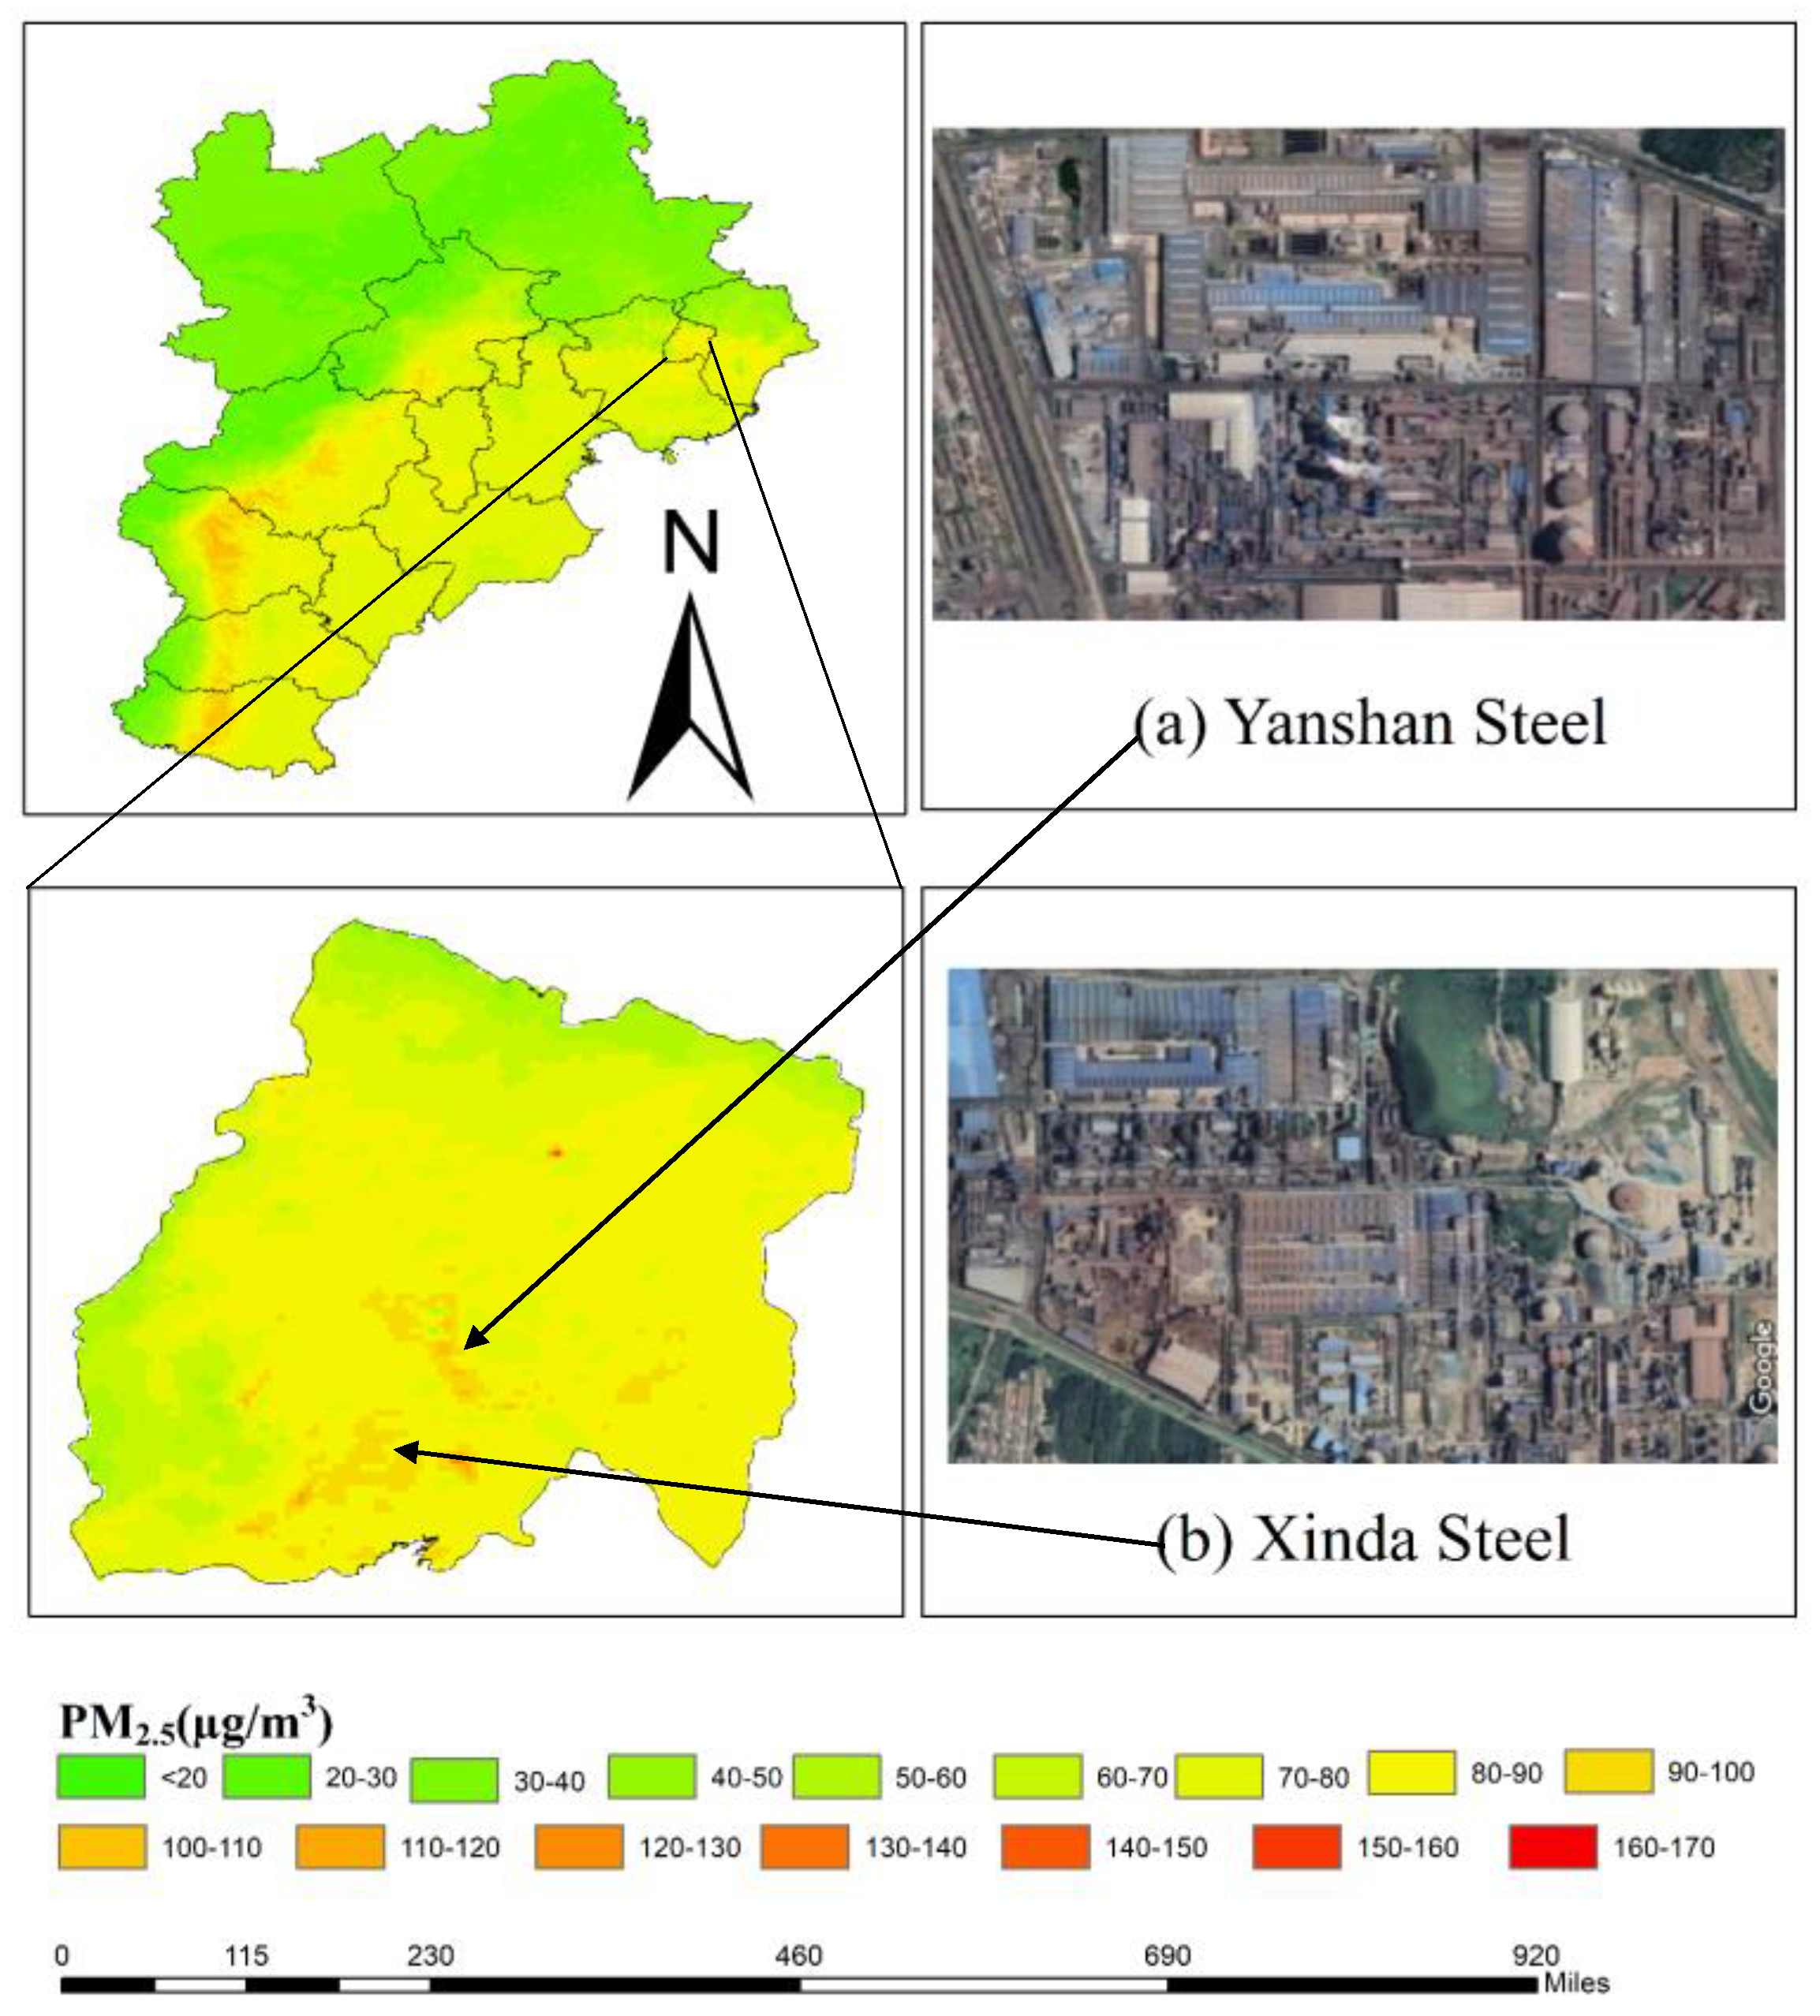
A comparison of daytime and nighttime PM2.5, shows that there is a large difference in PM2.5 concentrations between day and night, indicating that nighttime PM2.5 concentration monitoring is meaningful, and the production of nighttime PM2.5 provides the possibility of continuous monitoring day and night. Simultaneously, nighttime PM2.5 provided data support for short-term surge events and environmental pollution monitoring, such as setting off fireworks during the Spring Festival and excessive emissions from the Tangshan Iron and Steel Plant.

Supplementary Materials

The following supporting information can be downloaded at: https://www.mdpi.com/article/10.3390/rs15174271/s1, Figure S1: The spatial distribution of ten-fold site-based cross-validate R2 (from 2015 to 2021); Figure S2: The spatial distribution of ten-fold site-based cross-validate RMSE (from 2015 to 2021); Figure S3: The measured and estimated PM2.5 concentration between 2015 and 2021 were used to leave-one-city cross-validate the spatial distribution of R2; Figure S4: The measured and estimated PM2.5 concentration between 2015 and 2021 were used to leave-one-city cross-validate the spatial distribution of RMSE.

Author Contributions

Conceptualization, methodology, validation, formal analysis, and data curation, Y.M. and W.Z.; writing—original draft preparation, Y.M.; writing—review and editing, all authors; supervision, L.Z. and X.C.; funding acquisition, W.Z.; and project administration, Q.L. All authors have read and agreed to the published version of the manuscript.

Funding

The Major Project of the High-Resolution Earth Observation System, 30-Y60B01-9003-22/23. North China Institute of Aerospace Engineering Foundation of Doctoral Research, BKY-2021-31. National Science and Technology Major Project of High-Resolution Earth Observation System, 67-Y50G04-9001-22/23. Science and Technology Research Projects of Higher Education Institutions in Hebei Province, ZD2021303. Hebei Province Graduate Student Innovation Ability Training Funding Project: CXZZSS2023166. Research on the typical optical sample library and key technologies of remote sensing satellites in the Beijing-Tianjin-Hebei region: 216Z0303G.

Data Availability Statement

The data in this article can be found online at https://github.com/MaYu04/Nighttime-PM2.5, accessed on 30 May 2023.

Conflicts of Interest

The authors declare no conflict of interest.

References

  1. Guo, B.; Zhang, D.; Pei, L.; Su, Y.; Wang, X.; Bian, Y.; Zhang, D.; Yao, W.; Zhou, Z.; Guo, L. Estimating PM(2.5) concentrations via random forest method using satellite, auxiliary, and ground-level station dataset at multiple temporal scales across China in 2017. Sci. Total Environ. 2021, 778, 146288. [Google Scholar] [CrossRef]
  2. Zhang, Y.; Zhu, B.; Gao, J.; Kang, H.; Yang, P.; Wang, L.; Zhang, J. The Source Apportionment of Primary PM2.5 in an Aerosol Pollution Event over Beijing-Tianjin-Hebei Region using WRF-Chem, China. Aerosol Air Qual. Res. 2017, 17, 2966–2980. [Google Scholar] [CrossRef]
  3. Choi, H.; Park, S.; Kang, Y.; Im, J.; Song, S. Retrieval of hourly PM(2.5) using top-of-atmosphere reflectance from geostationary ocean color imagers I and II. Environ. Pollut. 2023, 323, 121169. [Google Scholar] [CrossRef]
  4. Feng, Y.; Fan, S.; Xia, K.; Wang, L. Estimation of Regional Ground-Level PM2.5 Concentrations Directly from Satellite Top-of-Atmosphere Reflectance Using A Hybrid Learning Model. Remote Sens. 2022, 14, 2714. [Google Scholar] [CrossRef]
  5. Liu, N.; Li, S.; Zhang, F. Multi-Scale Spatiotemporal Variations and Drivers of PM2.5 in Beijing-Tianjin-Hebei from 2015 to 2020. Atmosphere 2022, 13, 1993. [Google Scholar] [CrossRef]
  6. Peng, J.; Han, H.; Yi, Y.; Huang, H.; Xie, L. Machine learning and deep learning modeling and simulation for predicting PM2.5 concentrations. Chemosphere 2022, 308, 136353. [Google Scholar] [CrossRef]
  7. Zhang, L.; Wilson, J.P.; Zhao, N.; Zhang, W.; Wu, Y. The dynamics of cardiovascular and respiratory deaths attributed to long-term PM(2.5) exposures in global megacities. Sci. Total Environ. 2022, 842, 156951. [Google Scholar] [CrossRef]
  8. Li, R.; Liu, X.; Li, X. Estimation of the PM2.5 Pollution Levels in Beijing Based on Nighttime Light Data from the Defense Meteorological Satellite Program-Operational Linescan System. Atmosphere 2015, 6, 607–622. [Google Scholar] [CrossRef]
  9. Ma, Y.; Zhang, W.; Zhang, L.; Gu, X.; Yu, T. Estimation of Ground-Level PM2. 5 Concentration at Night in Beijing-Tianjin-Hebei Region with NPP/VIIRS Day/Night Band. Remote Sens. 2023, 15, 825. [Google Scholar] [CrossRef]
  10. Xu, Z.; Xia, X.; Liu, X.; Qian, Z. Combining DMSP/OLS Nighttime Light with Echo State Network for Prediction of Daily PM2.5 Average Concentrations in Shanghai, China. Atmosphere 2015, 6, 1507–1520. [Google Scholar] [CrossRef]
  11. Zhang, L.; Wilson, J.P.; MacDonald, B.; Zhang, W.; Yu, T. The changing PM2.5 dynamics of global megacities based on long-term remotely sensed observations. Environ. Int. 2020, 142, 105862. [Google Scholar] [CrossRef]
  12. Chen, H.; Xu, Y.; Zhong, S.; Mo, Y.; Zhu, S. Mapping nighttime PM2.5 concentrations in Nanjing, China based on NPP/VIIRS nighttime light data. Atmos. Environ. 2023, 303, 119767. [Google Scholar] [CrossRef]
  13. Zhao, X.; Shi, H.; Yu, H.; Yang, P. Inversion of nighttime PM2. 5 mass concentration in Beijing based on the VIIRS day-night band. Atmosphere 2016, 7, 136. [Google Scholar] [CrossRef]
  14. Wang, J.; Aegerter, C.; Xu, X.; Szykman, J.J. Potential application of VIIRS Day/Night Band for monitoring nighttime surface PM 2.5 air quality from space. Atmos. Environ. 2016, 124, 55–63. [Google Scholar] [CrossRef]
  15. Fu, D.; Xia, X.; Duan, M.; Zhang, X.; Li, X.; Wang, J.; Liu, J. Mapping nighttime PM2.5 from VIIRS DNB using a linear mixed-effect model. Atmos. Environ. 2018, 178, 214–222. [Google Scholar] [CrossRef]
  16. Nechaev, D.; Zhizhin, M.; Poyda, A.; Ghosh, T.; Hsu, F.-C.; Elvidge, C. Cross-Sensor Nighttime Lights Image Calibration for DMSP/OLS and SNPP/VIIRS with Residual U-Net. Remote Sens. 2021, 13, 5026. [Google Scholar] [CrossRef]
  17. Zhang, G.; Shi, Y.; Xu, M. Evaluation of LJ1-01 Nighttime Light Imagery for Estimating Monthly PM2.5 Concentration: A Comparison With NPP-VIIRS Nighttime Light Data. IEEE J. Sel. Top. Appl. Earth Obs. Remote Sens. 2020, 13, 3618–3632. [Google Scholar] [CrossRef]
  18. Wang, X.; Mu, X.; Yan, G. Quantitative Analysis of Aerosol Influence on Suomi-NPP VIIRS Nighttime Light in China. IEEE J. Sel. Top. Appl. Earth Obs. Remote Sens. 2020, 13, 3557–3568. [Google Scholar] [CrossRef]
  19. Miller, S.; Straka, W.; Mills, S.; Elvidge, C.; Lee, T.; Solbrig, J.; Walther, A.; Heidinger, A.; Weiss, S. Illuminating the Capabilities of the Suomi National Polar-Orbiting Partnership (NPP) Visible Infrared Imaging Radiometer Suite (VIIRS) Day/Night Band. Remote Sens. 2013, 5, 6717–6766. [Google Scholar] [CrossRef]
  20. Coleman, C.J.; Yeager, R.A.; Pond, Z.A.; Riggs, D.W.; Bhatnagar, A.; Arden Pope, C., 3rd. Mortality risk associated with greenness, air pollution, and physical activity in a representative U.S. cohort. Sci. Total Environ. 2022, 824, 153848. [Google Scholar] [CrossRef]
  21. Ma, Z.; Dey, S.; Christopher, S.; Liu, R.; Bi, J.; Balyan, P.; Liu, Y. A review of statistical methods used for developing large-scale and long-term PM2.5 models from satellite data. Remote Sens. Environ. 2022, 269, 112827. [Google Scholar] [CrossRef]
  22. Mousavi, S.E.; Amini, H.; Heydarpour, P.; Amini Chermahini, F.; Godderis, L. Air pollution, environmental chemicals, and smoking may trigger vitamin D deficiency: Evidence and potential mechanisms. Environ. Int. 2019, 122, 67–90. [Google Scholar] [CrossRef] [PubMed]
  23. Weichenthal, S.; Pinault, L.; Christidis, T.; Burnett, R.T.; Brook, J.R.; Chu, Y.; Crouse, D.L.; Erickson, A.C.; Hystad, P.; Li, C. How low can you go? Air pollution affects mortality at very low levels. Sci. Adv. 2022, 8, eabo3381. [Google Scholar] [CrossRef] [PubMed]
  24. Zhang, L.; Zhao, N.; Zhang, W.; Wilson, J.P. Changes in Long-Term PM2.5 Pollution in the Urban and Suburban Areas of China’s Three Largest Urban Agglomerations from 2000 to 2020. Remote Sens. 2022, 14, 1716. [Google Scholar] [CrossRef]
  25. Chen, G.; Li, S.; Knibbs, L.D.; Hamm, N.A.S.; Cao, W.; Li, T.; Guo, J.; Ren, H.; Abramson, M.J.; Guo, Y. A machine learning method to estimate PM(2.5) concentrations across China with remote sensing, meteorological and land use information. Sci. Total Environ. 2018, 636, 52–60. [Google Scholar] [CrossRef] [PubMed]
  26. Xie, R.; Sabel, C.E.; Lu, X.; Zhu, W.; Kan, H.; Nielsen, C.P.; Wang, H. Long-term trend and spatial pattern of PM(2.5) induced premature mortality in China. Environ. Int. 2016, 97, 180–186. [Google Scholar] [CrossRef]
  27. Geng, G.; Xiao, Q.; Liu, S.; Liu, X.; Cheng, J.; Zheng, Y.; Xue, T.; Tong, D.; Zheng, B.; Peng, Y. Tracking Air Pollution in China: Near Real-Time PM2.5 Retrievals from Multisource Data Fusion. Environ. Sci. Technol. 2021, 55, 12106–12115. [Google Scholar] [CrossRef]
  28. Xiao, Q.; Geng, G.; Liu, S.; Liu, J.; Meng, X.; Zhang, Q. Spatiotemporal continuous estimates of daily 1 km PM2.5 from 2000 to present under the Tracking Air Pollution in China (TAP) framework. Atmos. Chem. Phys. 2022, 22, 13229–13242. [Google Scholar] [CrossRef]
  29. Wei, J.; Li, Z.; Cribb, M.; Huang, W.; Xue, W.; Sun, L.; Guo, J.; Peng, Y.; Li, J.; Lyapustin, A.; et al. Improved 1 km resolution PM2.5 estimates across China using enhanced space–time extremely randomized trees. Atmos. Chem. Phys. 2020, 20, 3273–3289. [Google Scholar] [CrossRef]
  30. Wei, J.; Li, Z.; Lyapustin, A.; Sun, L.; Peng, Y.; Xue, W.; Su, T.; Cribb, M. Reconstructing 1-km-resolution high-quality PM2.5 data records from 2000 to 2018 in China: Spatiotemporal variations and policy implications. Remote Sens. Environ. 2021, 252, 112136. [Google Scholar] [CrossRef]
  31. Wu, J.; Yao, F.; Li, W.; Si, M. VIIRS-based remote sensing estimation of ground-level PM2.5 concentrations in Beijing–Tianjin–Hebei: A spatiotemporal statistical model. Remote Sens. Environ. 2016, 184, 316–328. [Google Scholar] [CrossRef]
  32. Wang, Z.; Román, M.O.; Kalb, V.L.; Miller, S.D.; Zhang, J.; Shrestha, R.M. Quantifying uncertainties in nighttime light retrievals from Suomi-NPP and NOAA-20 VIIRS Day/Night Band data. Remote Sens. Environ. 2021, 263, 112557. [Google Scholar] [CrossRef]
  33. Román, M.O.; Wang, Z.; Sun, Q.; Kalb, V.; Miller, S.D.; Molthan, A.; Schultz, L.; Bell, J.; Stokes, E.C.; Pandey, B.; et al. NASA’s Black Marble nighttime lights product suite. Remote Sens. Environ. 2018, 210, 113–143. [Google Scholar] [CrossRef]
  34. Hersbach, H.; Bell, B.; Berrisford, P.; Hirahara, S.; Horányi, A.; Muñoz-Sabater, J.; Nicolas, J.; Peubey, C.; Radu, R.; Schepers, D.; et al. The ERA5 global reanalysis. Q. J. R. Meteorol. Soc. 2020, 146, 1999–2049. [Google Scholar] [CrossRef]
  35. Liu, H.; Dong, L.; Yan, R.; Zhang, X.; Guo, C.; Liang, S.; Tu, J.; Feng, X.; Wang, X. Evaluation of near-surface wind speed climatology and long-term trend over China’s mainland region based on ERA5 reanalysis. Clim. Environ. Res. 2021, 26, 299–311. [Google Scholar]
  36. Sun, Y.; Yang, F.; Liu, M.; Li, Z.; Gong, X.; Wang, Y. Evaluation of the weighted mean temperature over China using multiple reanalysis data and radiosonde. Atmos. Res. 2023, 285, 106664. [Google Scholar] [CrossRef]
  37. Zuo, C.; Chen, J.; Zhang, Y.; Jiang, Y.; Liu, M.; Liu, H.; Zhao, W.; Yan, X. Evaluation of four meteorological reanalysis datasets for satellite-based PM2. 5 retrievals over China. Atmos. Environ. 2023, 305, 119795. [Google Scholar] [CrossRef]
  38. She, L.; Zhang, H.K.; Li, Z.; de Leeuw, G.; Huang, B. Himawari-8 Aerosol Optical Depth (AOD) Retrieval Using a Deep Neural Network Trained Using AERONET Observations. Remote Sens. 2020, 12, 4125. [Google Scholar] [CrossRef]
  39. Li, T.; Shen, H.; Yuan, Q.; Zhang, X.; Zhang, L. Estimating Ground-Level PM2.5 by Fusing Satellite and Station Observations: A Geo-Intelligent Deep Learning Approach. Geophys. Res. Lett. 2017, 44, 11985–11993. [Google Scholar] [CrossRef]
  40. Miller, S.D.; Turner, R.E. A dynamic lunar spectral irradiance data set for NPOESS/VIIRS day/night band nighttime environmental applications. IEEE Trans. Geosci. Remote Sens. 2009, 47, 2316–2329. [Google Scholar] [CrossRef]
  41. Guo, B.; Wu, H.; Pei, L.; Zhu, X.; Zhang, D.; Wang, Y.; Luo, P. Study on the spatiotemporal dynamic of ground-level ozone concentrations on multiple scales across China during the blue sky protection campaign. Environ. Int. 2022, 170, 107606. [Google Scholar] [CrossRef]
  42. Zhao, X.; Shi, H.; Yang, P.; Zhang, L.; Fang, X.; Liang, K. Inversion Algorithm of PM2.5 Air Quality Based on Nighttime Light Data from NPP-VIIRS. J. Remote Sens. 2017, 21, 291–299. [Google Scholar] [CrossRef]
  43. Li, K.; Liu, C.; Jiao, P. Estimating of Nighttime PM2.5 Concentrations in Shanghai Based on NPP/VIIRS Day_Night Band Data. Acta Sci. Circumstantiae 2019, 39, 1913–1922. [Google Scholar] [CrossRef]
  44. Erkin, N.; Simayi, M.; Ablat, X.; Yahefu, P.; Maimaiti, B. Predicting spatiotemporal variations of PM2.5 concentrations during spring festival for county-level cities in China using VIIRS-DNB data. Atmos. Environ. 2023, 294, 119484. [Google Scholar] [CrossRef]
  45. Ma, S.; Yan, W.; Huang, Y.-X.; Ai, W.-H.; Zhao, X. Vicarious calibration of S-NPP/VIIRS day–night band using deep convective clouds. Remote Sens. Environ. 2015, 158, 42–55. [Google Scholar] [CrossRef]
Figure 1. The distribution of ground stations (white dots) and the elevation map of the BTH region.
Remotesensing 15 04271 g001
Figure 2. Overall flow chart of this study.
Remotesensing 15 04271 g002
Figure 3. The schematic diagram of three cross-validation methods.
Remotesensing 15 04271 g003
Figure 4. Scatter plot of sample-based cross-validation results of daily nighttime PM2.5 estimates for each year from 2015 to 2021 across the BTH region. The best-fitting linear regression line is represented by the green line, while the 1:1 line is represented by the red dotted line.
Remotesensing 15 04271 g004
Figure 5. The BTH region’s nightly PM2.5 concentration map from 2015 to 2021, with a spatial resolution of 500 m.
Remotesensing 15 04271 g005
Figure 6. Map of the BTH region’s seasonal average nighttime PM2.5 concentrations at 500 m resolution from 2015 to 2021.
Remotesensing 15 04271 g006
Figure 7. Process of atmospheric pollution from 17 to 21 October 2019. (a) DNN Model estimates for 17 October 2019, (b) CHAP of 18 October 2019, (c) DNN Model estimates for 18 October 2019, (d) CHAP of 19 October 2019, (e) DNN Model estimates for 19 October 2019, (f) CHAP of 20 October 2019, (g) DNN Model estimates for 20 October 2019, (h) CHAP of 21 October 2019.
Remotesensing 15 04271 g007
Figure 8. Relative humidity and wind speed during 18–21 October 2019.
Remotesensing 15 04271 g008
Figure 9. The changes of PM2.5 before, during and after the Spring Festival.
Remotesensing 15 04271 g009
Figure 10. Qian’an City’s average yearly PM2.5 concentration map in 2016. (a,b) show the satellite map of the steel mill. The geographic coordinates are (118.68662°E, 39.92575°N), and (118.59248°E, 39.90758°N).
Remotesensing 15 04271 g010
Figure 11. Different urban sites’ average annual change trends from 2015 to 2021. (a) Beijing, (b) Tianjin, (c) Shijiazhuang, and (d) Xingtai. The Night_Model shows the estimated concentration of this study. The Night_site shows the observed concentration of nighttime. The Day_CHAP shows the estimated concentration of daytime. The Day_site shows the observed concentration of daytime.
Remotesensing 15 04271 g011
Figure 12. The quarterly average error between 2015 and 2021.
Remotesensing 15 04271 g012
Table 1. Statistical description of the data.
CategoryDataData SourceUnitsSpatial ResolutionTemporal Resolution
Satellite dataDNB radianceVNP46A1W/(sr·m2)500 mDaily
moon phase angledegree
Meteorological dataBLHERA5m0.25° × 0.25°Hourly
SPPa
T2MK
D2MK
RH%
U10m/s
V10m/s
Auxiliary dataNDVIMOD13A1-500 m16 Days
DEMGMTED2010m900 m-
Ground PM2.5 dataPM2.5CNMECµg/m3-Hourly
Table 2. Model performance after cyclic removal of each factor (R2).
Input Variables2015201620172018201920202021
Without DNB radiance0.550.530.500.520.560.660.61
Without moon phase angle0.510.500.420.490.500.610.56
Without BLH0.530.530.490.510.530.670.61
Without D2M0.540.520.500.500.540.650.62
Without RH0.530.500.460.500.540.630.59
Without SP0.540.520.490.510.550.640.61
Without T2M0.530.510.490.500.540.660.60
Without U100.530.520.490.520.550.640.61
Without V100.530.520.480.520.530.660.59
Without NDVI0.550.540.500.530.570.680.62
Without DEM0.530.520.500.520.560.670.62
All 10.560.550.510.530.580.680.63
1 All input variables are DNB radiance, moon phase angle, BLH, D2M, RH, SP, T2M, U10, V10, NDVI, and DEM.
Table 3. Comparison of the performance of previous models and the DNN model in estimating PM2.5 concentration at night.
ModelNumbers of SamplesTime SpanSpatial Resolution (m)RegionR2RMSE (µg/m3)Reference
MLR751 August 2012–30 October 2012750Atlanta0.454.112[14]
SVM50March–May 2013750Beijing0.9-[42]
MLR488December–February 2012–2018750Shanghai0.7719.21[43]
RF-September–December 2020500Nanjing0.81-[12]
BP198March–May 2013750Beijing0.8312.02[13]
SADBN13,39313–23 February 2013; 4–12 February 2016; and 24 January to 1 February 2017; and 12–22 February 2018750China0.8919.94[44]
DNN120,8162015−2021500BTH0.51–0.6854.25–12.11This study
Disclaimer/Publisher’s Note: The statements, opinions and data contained in all publications are solely those of the individual author(s) and contributor(s) and not of MDPI and/or the editor(s). MDPI and/or the editor(s) disclaim responsibility for any injury to people or property resulting from any ideas, methods, instructions or products referred to in the content.

