Abstract
Ratoon rice, an effective rice cultivation system, allows paddy rice to be harvested twice from the same stubble, playing an important role in ensuring food security and adapting to climate change with its unique growth characteristics. However, there is an absence of research related to remote-sensing monitoring of ratoon rice, and the presence of other rice cropping systems (e.g., double-season rice) with similar characteristics poses a hindrance to the accurate identification of ratoon rice. Furthermore, cloudy and rainy regions have limited available remote-sensing images, meaning that remote-sensing monitoring is limited. To address this issue, taking Yongchuan District, a typical cloud-prone region in Chongqing, China, as an example, this study proposed the construction of a time-series optical dataset using the Modified Neighborhood Similar Pixel Interpolator (MNSPI) method for cloud-removal interpolation and the Flexible Spatiotemporal DAta Fusion (FSDAF) model for fusing multi-source optical remote-sensing data, in combination with vegetation index features and phenological information to build a threshold model to map ratoon rice at high-resolution (10 m). The mapping performance of ratoon rice was evaluated using independent field samples to obtain the overall accuracy and kappa coefficient. The findings indicate that the combination of the MNSPI method and FSDAF model had a stable and effective performance, characterized by high correlation coefficient (r) values and low root mean square error (RMSE) values between the restored/predicted images and the true images. Notably, it was possible to effectively capture the distinct characteristics of ratoon rice in cloudy and rainy regions using the proposed threshold model. Specifically, the identified area of ratoon rice in the study region was 194.17 km2, which was close to the official data (158–180 km2), and the overall accuracy and kappa coefficient of ratoon rice identification result were 90.73% and 0.81, respectively. These results demonstrate that our proposed threshold model can effectively distinguish ratoon rice during vital phenological stages from other crop types, enrich the technical system of rice remote-sensing monitoring, and provide a reference for agricultural remote-sensing applications in cloudy and rainy regions.
1. Introduction
Serving as a primary food source for over 50% of the global population, paddy rice covers an area of cropland exceeding 12% [1]. The scientific community has become increasingly concerned about the rising global food demands resulting from population growth and shifts in dietary preferences. Specifically, as stated by Seck et al. [2], in order to satisfy the growing demand, global rice production must experience a 26% increase, equivalent to 116 million tons per year, by 2035 compared to the production level recorded in 2010. However, in recent years, a series of uncertain factors, including the international political situation, occupation of agricultural land, and climate change, have posed threats food security. Under such circumstances, previous studies suggested that paddy rice yield can be increased through improved crop varieties or more frequent harvests on existing land through optimized planting management. In fact, the biophysical potential for increasing rice yield through the improvement in rice varieties is reaching its upper limit [3,4]. Hence, triple- and double-season rice along with ratoon rice systems, have been acknowledged as effective planting patterns that enable more frequent rice harvests within the available land. The extensive cultivation of triple- and double-season rice in China and other parts of Asia has made a significant contribution to the global rice supply by fully exploited available water and thermal resources, surpassing the productivity of single-season rice systems. Nevertheless, in China, a shift from double-season rice to single-season rice has been observed due to the escalation of labor expenses and the rapid pace of urbanization [5,6]. The development of a second season of rice that combines cost-saving, high yield, and environmental sustainability is of paramount importance and requires immediate attention.
Ratoon rice uses the dormant buds surviving on rice stubble after the first season of rice is harvested (the main crop) and adopts certain cultivation and management measures to make it sprout, tiller, and mature again (ratoon crop) [5]. With its ability to produce two harvests from one sowing, ratoon rice demonstrates an annual yield that surpasses single-season rice by 54.8–71.4%, accompanied by a growth period that is 44–48 days shorter than that of double-season rice [7,8]. Hence, in situations where there is thermal energy greater than that required for single-season rice, but less than that required for double-season rice, the cultivation of ratoon rice can fully exploit available water and thermal resources, boosting yield and economic output [9,10]. While the average annual yield of ratoon rice is approximately 13% lower than that of traditional double-season rice, it presents the advantage of eliminating the requirement for additional labor in transplanting the second-season rice. Additionally, it enables savings in water, fertilizer, and pesticide inputs [7]. The adoption of ratoon rice cropping systems effectively reduces the susceptibility of rice to extreme weather conditions, such as scorching summer temperatures and drought in the middle and lower reaches of the Yangtze River, as well as prolonged rainy days in southern China [11]. In summary, ratoon rice is a major planting mode for actively adapting to climate change, increasing the harvest area, and reducing resource consumption due to its obvious superior characteristics [12].
Currently, research concerning the regional distribution of ratoon rice cultivation remains limited. Satellite remote-sensing technology represents a promising approach for monitoring ratoon rice. Remote-sensing technology finds extensive application in studies pertaining to the mapping of paddy rice. Existing methods for remote-sensing monitoring of paddy rice include machine-learning models [13], time-series matching [14], vegetation index feature methods [15], and object-based classification mapping [16]. In recent years, the phenological method has become a relatively popular method of rice mapping, which belongs to the category of vegetation index characteristic methods [17,18,19,20,21,22]. Xiao et al. [18,23] discovered the characteristics of vegetation indices in key phenological periods and carried out large-scale rice-extraction studies in regions such as South Asia. Biradar et al. [24] used a phenology algorithm to extract double-season and triple-season rice, showing the potential of the phenology algorithm in monitoring rice of different rice cropping types. Dong et al. [17] utilized Landsat imagery and a phenology algorithm to explore the dynamics of a single-season rice cultivation region in Northeast China between 1986 and 2010. Similarly, Zhu et al. [25] plotted the distribution maps of single- and double-season rice from 1999 to 2019 in South China by improving a rice mapping algorithm based on phenology and pixels, considering the phenological characteristics of rice in the transplanting and heading stages.
However, these methods have certain limitations. Firstly, there are differences in the growth characteristics and phenology of rice in different cropping systems. Existing rice monitoring models cannot be directly applied to ratoon rice monitoring. Since the phenological changes in ratoon rice are similar to those in traditional double-season rice (i.e., they both have the characteristics of “double peaks” and “double troughs”), only by exploring the unique phenological characteristics of ratoon rice can we accurately distinguish it from other crop types. Secondly, there is interference from clouds and rain. Current methods are mainly based on remote-sensing images to generate vegetation index time-series curves, but optical remote-sensing images are susceptible to cloud and rain interference, and the images rarely satisfy the research needs. Liu et al. [26] mapped the area of ratoon rice planted in Hubei Province at 10 m resolution based on a phenology algorithm and Sentinel-2 images (cloud cover < 80%), and the overall accuracy of ratoon rice was 0.76. Their study lacked processing of cloud-covered images, and the cloud coverage of the images used was large. Optical remote-sensing data are easily affected, which introduces serious obstacles to the dynamic monitoring of the surface [27]. Hence, cloud removal and interpolation are the basis of high-quality remote-sensing data construction. The Modified Neighborhood Similar Pixel Interpolator (MNSPI) is an effective method for removing thick-cloud contamination. By incorporating spatial-based and temporal-based estimations, it effectively fills in the missing reflectance data caused by cloud interference with high accuracy [28]. In this study, the MNSPI method was used to remove cloud pollution in both Sentinel-2 and Landsat-8 OLI images. Nonetheless, in regions characterized by cloudy and rainy conditions, cloud cover was persistent and recurrent. The Sentinel-2 and Landsat-8 OLI images did not meet the time-series data requirements for ratoon rice monitoring, and there were still time gaps after removing clouds. Therefore, MODIS’s daily reflectance product MOD09GA was considered to complement the time-series gaps. Because of the different spatial resolutions, the data needed to be fused using a spatiotemporal fusion model. The Flexible Spatiotemporal DAta Fusion (FSDAF) model was used for this purpose; this model generates fused images with enhanced accuracy while retaining a higher level of spatial detail compared with other fusion methods [29].
For the purposes of enhancing the monitoring system for ratoon rice under different cropping systems and mitigating the limitations of remote-sensing monitoring in cloudy and rainy regions, the aims of our research were as follows: (1) to construct a time-series dataset using the MNSPI method and the FSDAF model; (2) to assess the feasibility of the threshold model for monitoring ratoon rice in cloudy and rainy areas. By observing changes in the vegetation index characteristics during the growth of ratoon rice, a phenological and statistical characteristic-based model was established to identify ratoon rice.
2. Study Region and Data
2.1. Study Region
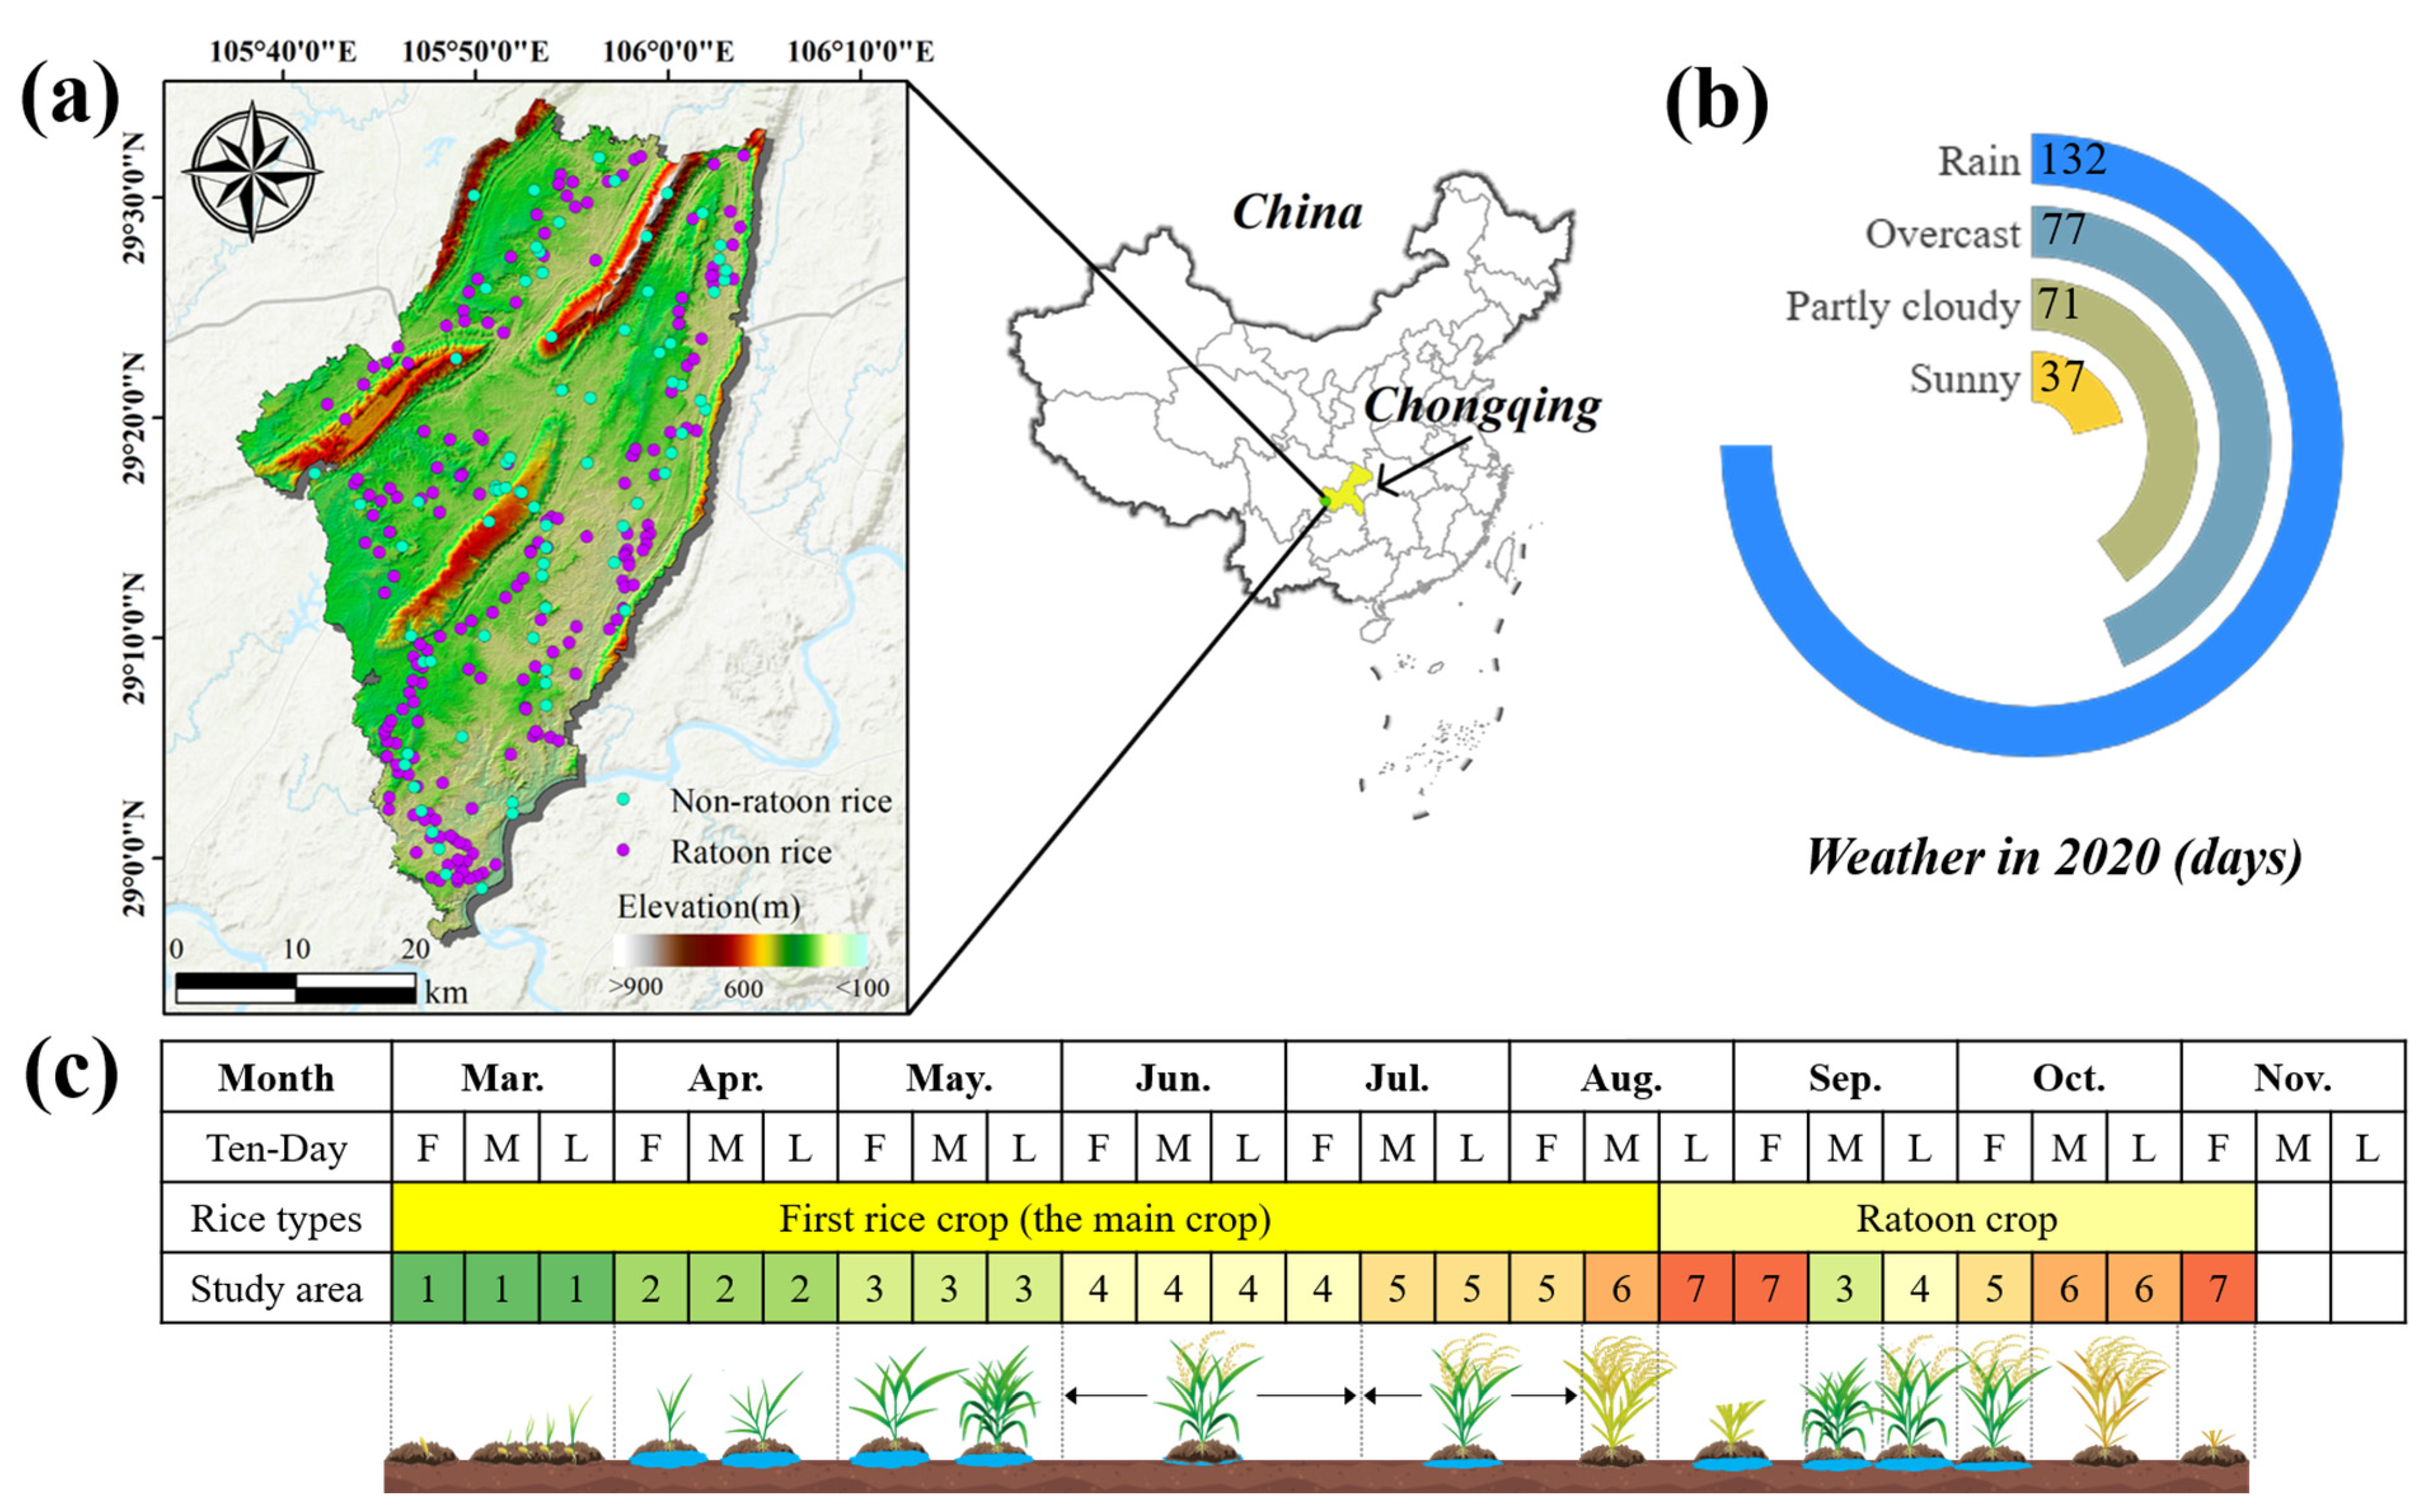
The study region was Yongchuan District (105°38′E–106°05′E, 28°56′N–29°34′N), situated in the west of Chongqing, China, and at the end of the parallel ridge valley in eastern Sichuan. Many mountains are distributed from northeast to southwest, running through the whole region. This area covers an area of 1576 km2 with low mountains, hills, terraces, and other landform types, which provide conditions for the main layout of agriculture (Figure 1a). Yongchuan District experiences a subtropical monsoon humid climate, characterized by an average temperature of 17.7 °C and an average annual precipitation of 1015.0 mm. Historical weather data were derived from the China Meteorological Network (https://www.cma.gov.cn/ (accessed on 9 June 2021)). The data showed that in Yongchuan District in 2020, only 37 days were sunny, 132 days were rainy, and 41% of the days were cloudy, demonstrating characteristics of cloudy and rainy weather (Figure 1b). Hence, this region was selected as a typical region for optical remote-sensing monitoring of ratoon rice in cloudy and rainy regions. The potential area of ratoon rice is about 30,000 km2 in China, mainly distributed in Sichuan, Chongqing, and Fujian [30]. The main planting system in Yongchuan District is “mid-season rice and ratoon rice”, rendering the region suitable for investigating the spatial distribution of ratoon rice [31]. The “mid-season rice and ratoon rice” is a detailed description of “ratoon rice”, emphasizing that the main rice crop of ratoon rice is a super-high-yield mid-season rice variety with strong regeneration ability.
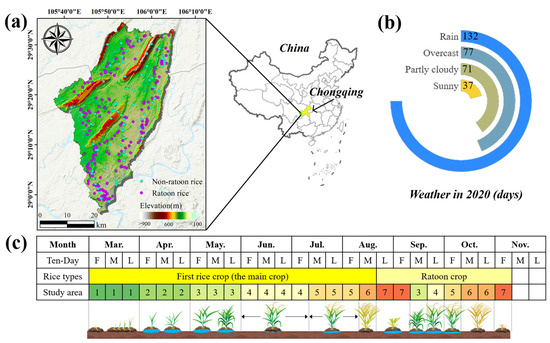
Figure 1.
(a): Study region location and occurrence locations of ratoon rice and non-ratoon rice in Yongchuan District; (b): Weather statistics in 2020 in Yongchuan District; (c): Ratoon rice planting calendar in Yongchuan District. Note: F, M, and L denote the first, middle, and last parts of the month, respectively; 1—sowing; 2—flooding; 3—tillering; 4—heading; 5—filled; 6—maturity; 7—stubble and harvest.
2.2. Growth Characteristics of Ratoon Rice
The ratoon rice phenological stages, obtained from the Chongqing General Agricultural Technology Station (http://www.cqates.com/ (accessed on 20 March 2021)), are illustrated in Figure 1c, alongside a crop calendar for the region. Farmers generally raise seedlings in March, and the field plots are submerged in irrigation water, reaching a depth of 2–15 cm, in preparation for the transplantation period about a month later. After transplantation, it is recommended to maintain a water level of approximately 3 cm, gradually increasing it to 5–10 cm as the plant height increases until maturity is reached [32]. Specifically, the main rice crop starts tillering in early–mid-May, with tilling and filling in June and July and harvesting in mid-August. When the main rice crop is harvested, 20–40 cm of rice stubble is reserved [33]. Utilizing shallow-water irrigation and appropriate fertilization, the germination period of ratoon crop is from the end of August to the beginning of September. The original axillary buds on the rice stubble germinate and grow, and then the ratoon crop grows rapidly over the tillering, heading, filling, maturity, and harvest stages. Ratoon rice grows rapidly with a short growth period.
2.3. Optical Data Collection and Pre-Processing
Sentinel-2A and 2B multispectral imager images (cloud coverage < 60%) from January to November 2020 were downloaded from the United States Geological Survey via their website at https://earthexplorer.usgs.gov/ (accessed on 5 March 2021). They had a Level-1C format without atmospheric and topographic correction and required atmospheric and topographic correction using the Sen2cor processor. To standardize the spatial resolutions of the Sentinel-2 satellite constellation, which offers spatial resolutions of 10 m, 20 m, and 60 m and 5 days of time resolution across its 13 bands, the bands were uniformly resampled to 10 m using the Sentinel Application Platform (SNAP) software 8.0.0. Finally, this study used six bands: band 2 (blue, 458–523 nm), band 3 (Green, 543–578 nm), band 4 (Red, 650–680 nm), band 8 (NIR, 785–900 nm), and band 11 (SWIR, 1565–1655 nm).
Furthermore, this study also incorporated satellite images from Landsat-8 Operational Land Imager (OLI) (https://earthexplorer.usgs.gov/ (accessed on 6 March 2021)) with a revisit time of 16 days and a 30 m spatial resolution. These images were observed and available from January to November 2020 with cloud coverage of <60% in the study region and have been atmospherically corrected. Therefore, the data pre-processing mainly included band synthesis and image clipping based on ENVI software 5.0. Given that each band comprises only a portion of the wavelength data, the incorporation of diverse bands can expand the coverage of wavelength information, effectively accentuating distinct feature attributes. For instance, the amalgamation of bands in true color synthesis (red band, green band, and blue band) yields images resembling human vision’s perception of color. Using the SWIR band, NIR band, and blue band for false color synthesis is very effective for monitoring crops. Finally, we selected band 2 (blue, 450–515 nm), band 3 (Green, 525–600 nm), band 4 (Red, 630–680 nm), band 5 (NIR, 845–885 nm), and band 6 (SWIR, 1560–1660 nm) for ratoon rice monitoring.
MOD09GA is a surface reflectance dataset acquired on a daily basis by the MODIS sensor aboard the Terra satellite, which follows a polar orbit. This dataset provides a spatial resolution of 500 m in the visible spectrum. Images from January to November 2020 (with a cloud coverage below 60%) were downloaded from the National Aeronautics and Space Administration (NASA) website at https://www.nasa.gov/ (accessed on 7 March 2021). These images were in EOS-HDF format. Firstly, the MODIS Re-projection Tool was employed to convert the data format and adjust the map projection. Subsequently, the quality control layer was utilized to eliminate any invalid values present in the images. Finally, ENVI software was used for band synthesis and image cropping. The selection of MOD09GA images was based on the existing availability of Sentinel-2 and Landsat-8 OLI images, aiming to complement the missing images in the time-series dataset. The selected bands include band 1 (Red, 620–670 nm), band 2 (NIR, 841–876 nm), band 3 (blue, 459–479 nm), band 4 (Green, 545–565 nm), and band 6 (SWIR, 1628–1652 nm).
The coordinate reference system utilized by all images was the UTM-WGS84 projection coordinate system (WGS_1984_UTM_Zone_48N).
2.4. Field Collection and Other Ancillary Data
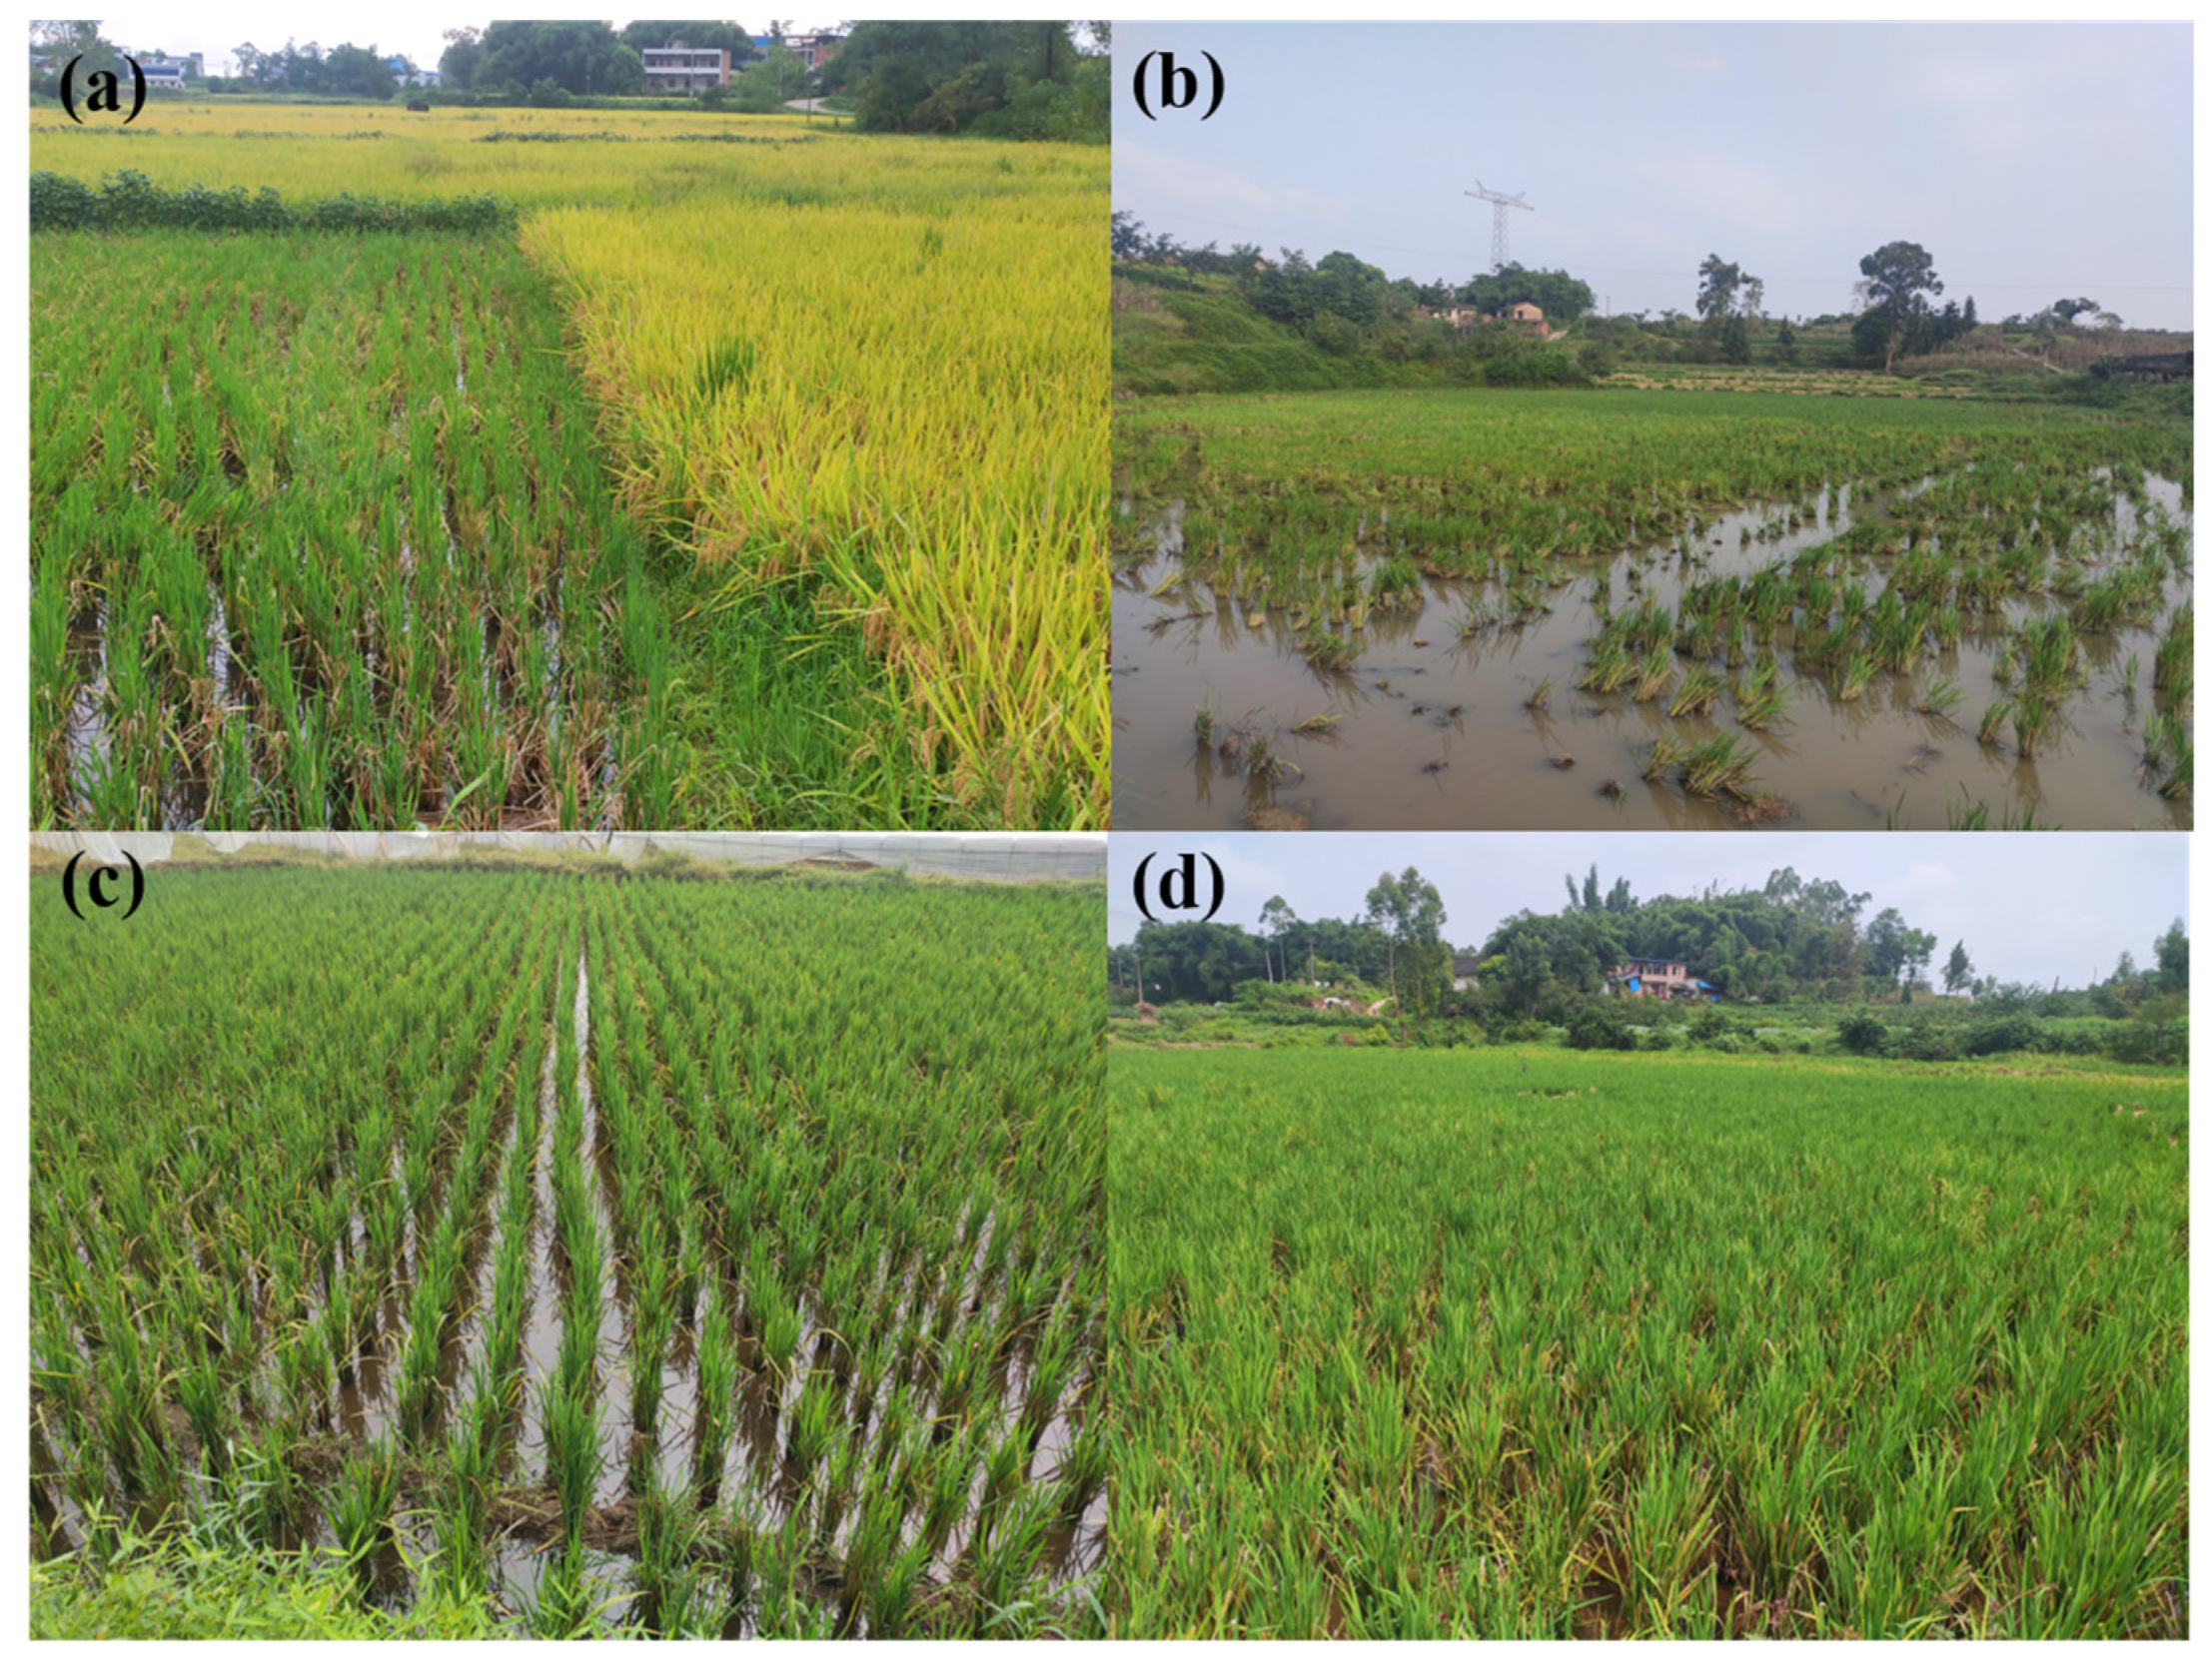
The field data in Yongchuan District were collected on May 31 and June 1 (during the tillering and heading stages of the main rice crop), as well as on August 29–30 (during the harvesting period of the main rice crop and stubble tillering stage of ratoon crop) in 2021. The sample crop types were consistent with 2020, as confirmed by the interviewed local growers and viewed historical Google Earth images. Considering crop growth, GPS coordinates of sample sites were collected using a real-time kinematic (RTK) surveying instrument, and field photographs were taken to prepare for accurate verification of the results. Finally, there were two sample types (Figure 1a): (1) 185 ratoon rice sample points and (2) 76 non-ratoon rice sample points, including forest, urban, water body, etc. The ratoon rice sample points were randomly divided into 30% training and 70% validation. The ratoon rice samples used in this study were taken from field survey records. Through a field investigation, we found that the overall situation of ratoon rice planting in the south of Yongchuan District was better than that in the north, but there was a relatively scattered situation of ratoon rice planting in the south and north. This is manifested by the fact that ratoon rice was not planted continuously (where half of the fields were planted with ratoon rice, while the other half was left unplanted), or some rice stubbles were damaged during the main rice crop harvest (Figure 2a,b), which also brings challenges to the monitoring of ratoon rice. On the other hand, most of the ratoon rice in the research region was well developed, with intact rice stubbles, dense regrowth buds, and a high number of rice panicles (Figure 2c,d). This phenomenon shows that the planting technology of ratoon rice in Yongchuan District is relatively mature, and the planting range is wide.

Figure 2.
Typical pictures of a field survey of ratoon rice: (a,b) show scattered plots of ratoon rice cultivation; (c,d) show ratoon rice with suitable growth.
Other ancillary data included land cover data for Yongchuan District for 2020, Yongchuan statistical yearbook data about the planting area of ratoon rice, and high-resolution images sourced from Google Earth. The land cover data with a 10 m spatial resolution for 2020, obtained from ESRI (https://livingatlas.arcgis.com/landcover/ (accessed on 7 September 2021)), included 10 land types with an overall accuracy of 0.85 [34] and were used as masks to extract grassland, urban, water body, and forest. Meanwhile, to assess the consistency between the monitoring results of ratoon rice and the official statistical area, we gathered the official statistics regarding the total area of ratoon rice. In addition, Google Earth high-resolution images acquired in 2020 were applied to check whether each sample position was correct through visual interpretation.
3. Methods
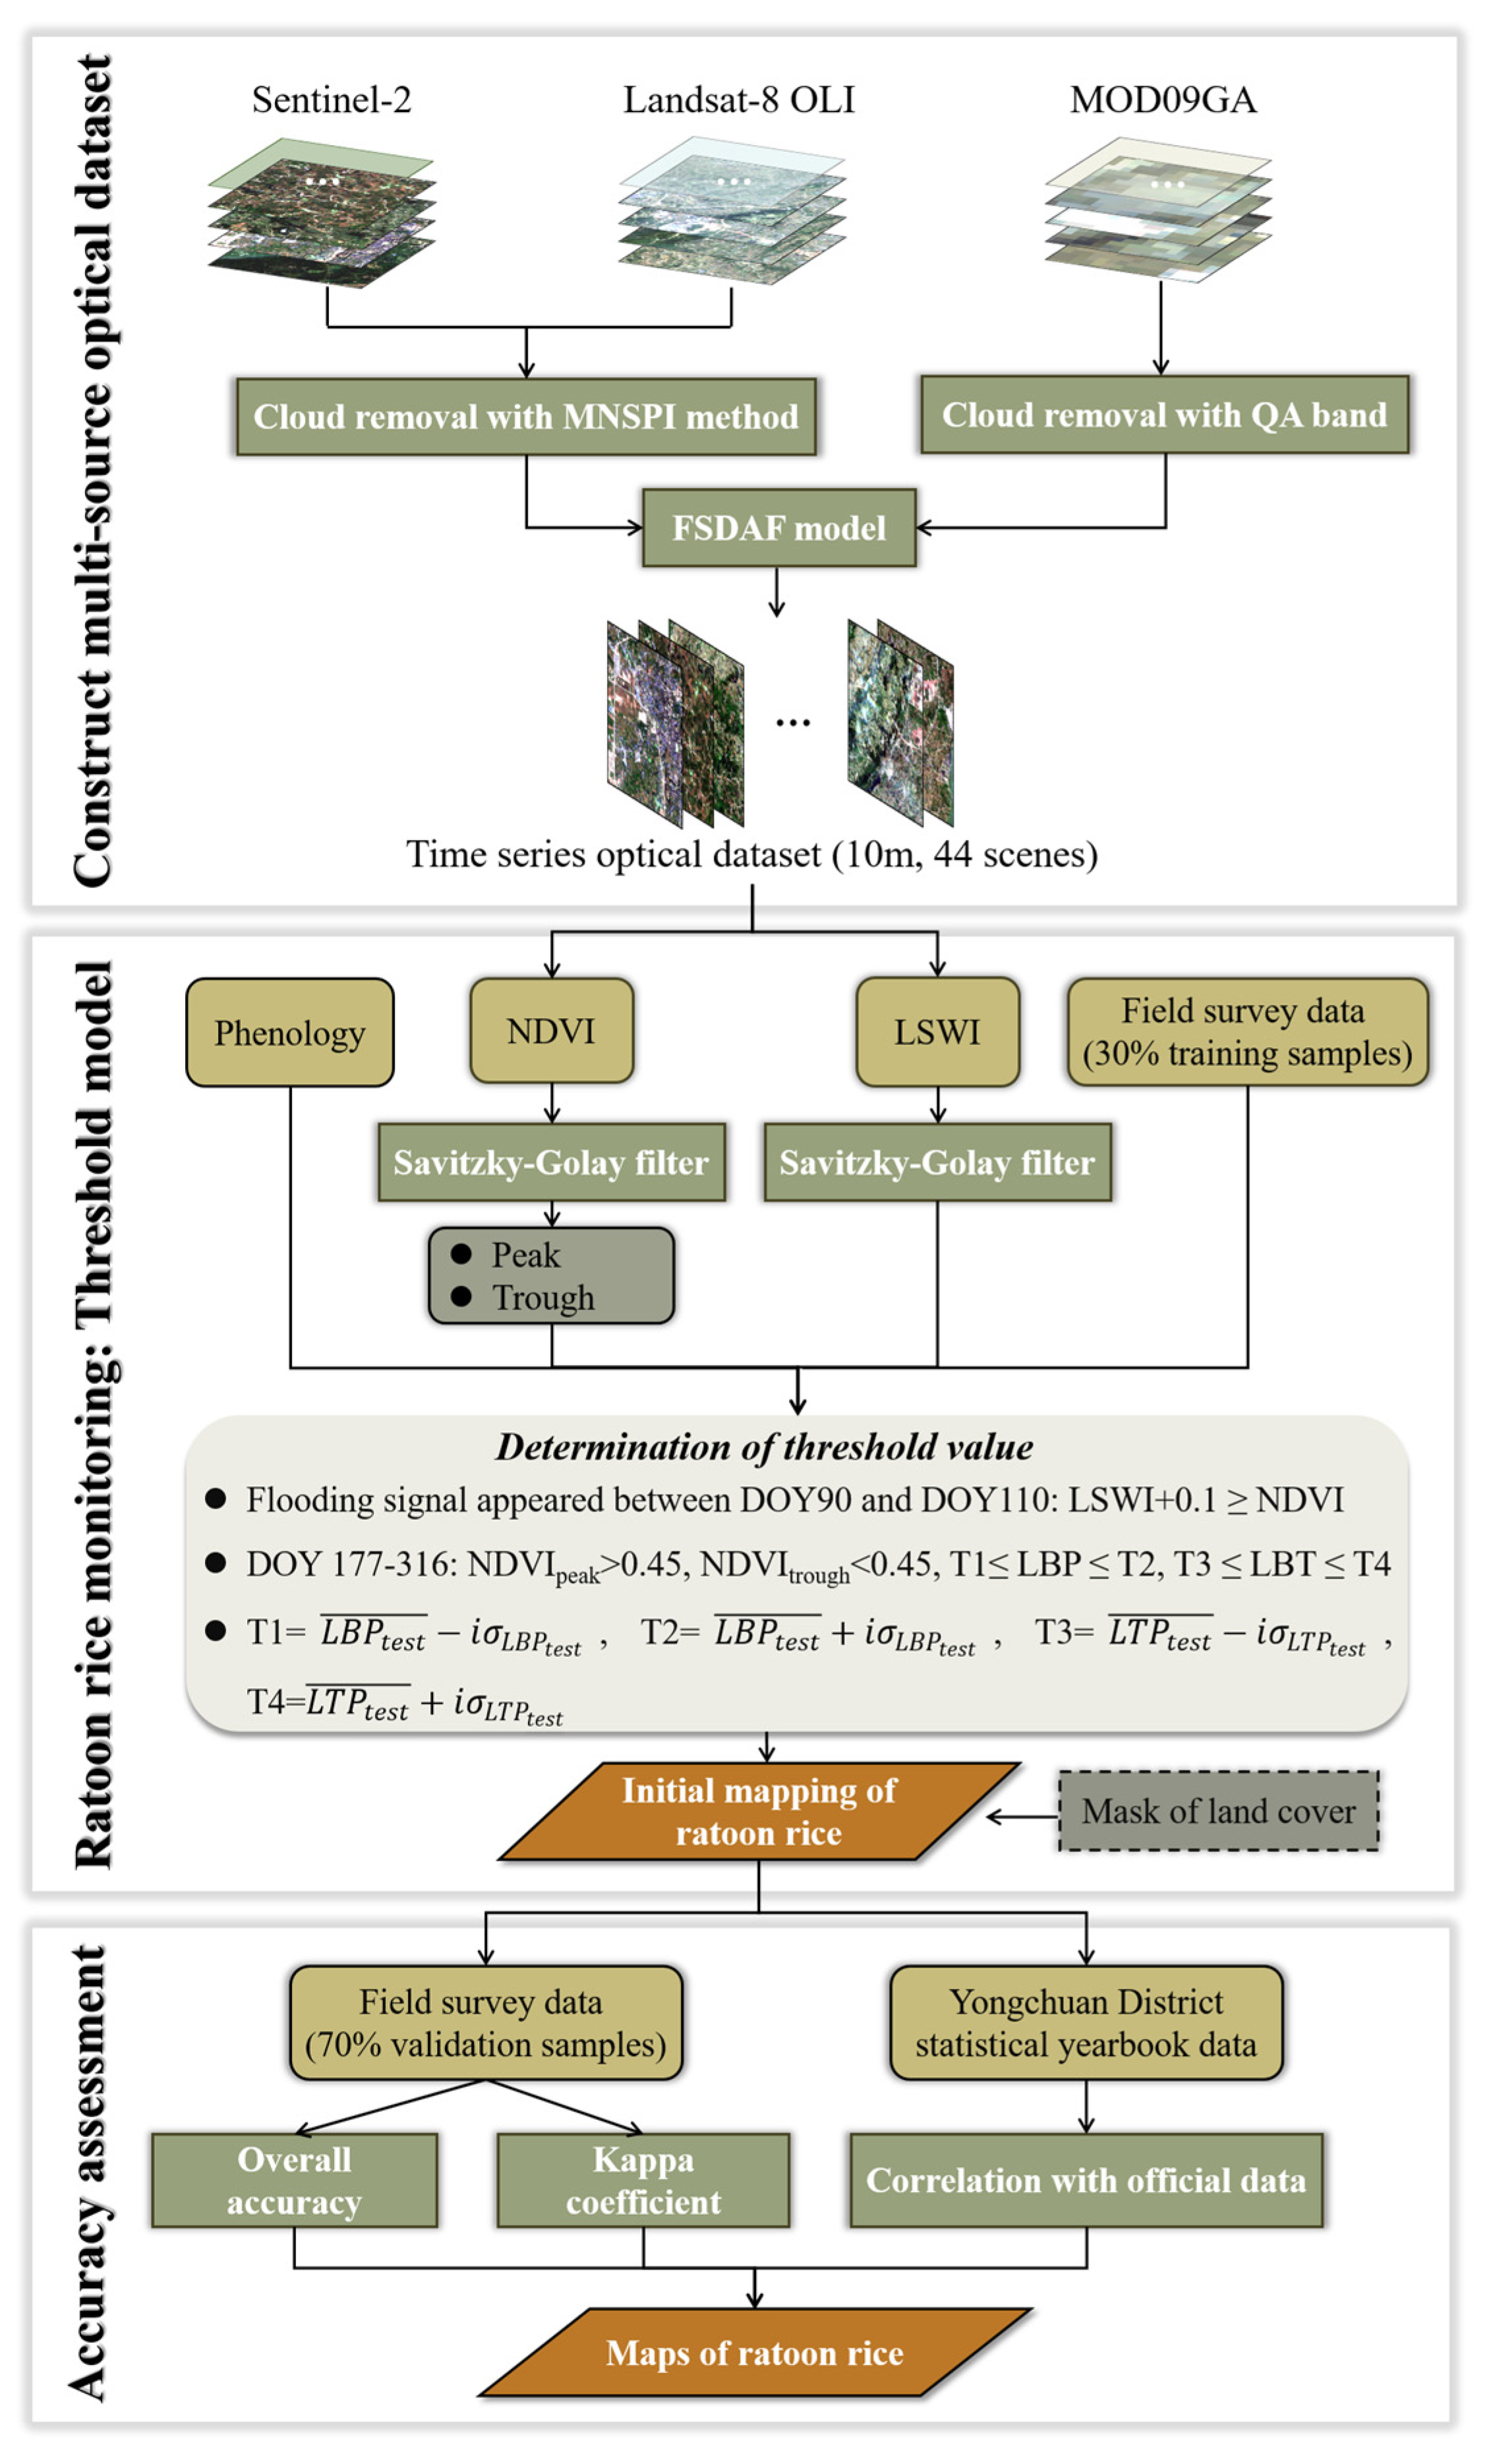
The framework for monitoring ratoon rice using the MNSPI method, FSDAF model, and threshold model is shown in Figure 3. There are three major steps: (1) A multi-source remote-sensing optical dataset was constructed to prepare for ratoon rice monitoring. We used the MNSPI method to eliminate cloud interference from the Sentinel-2 and Landsat-8 OLI images, while the QA band was used for cloud removal in MOD09GA. Subsequently, we applied the FSDAF model to build a multi-source remote-sensing optical dataset with a 10 m spatial resolution and 44 scenes. (2) Ratoon rice monitoring based on the threshold model was carried out. First, based on the collected sample points, NDVI and LSWI curves of ratoon rice were calculated using the time-series optical images from step (1). The Savitzky–Golay (S-G) filter was used to smooth NDVI and LSWI curves to reduce the influence of noise. The peak and trough of the NDVI curve were extracted. Then, we incorporated the phenological information of ratoon rice in Figure 1 and the field survey data (30% training samples) to determine the threshold of ratoon rice. Specifically, identify flooding signal between day of year (DOY) 90 and DOY 110 using the criteria LSWI + 0.1 ≥ NDVI. Determine the corresponding dates of the peaks and troughs in the NDVI time series of ratoon rice and calculate the length of days between two peaks (LBP) and the length of days between two troughs (LBT). The lower (T1) and upper (T2) limits of the LBP and the lower (T3) and upper (T4) limits of the LBT were calculated by the mean and standard deviation of the training samples so as to obtain the key thresholds for identifying ratoon rice. Finally, the area and distribution of potential ratoon rice were delineated using a land cover mask. (3) The accuracy assessment of the ratoon rice monitoring result was verified using field survey data (70% validation samples) and Yongchuan District statistical yearbook data. The specific evaluation indices include overall accuracy, kappa coefficient, and correlation analysis, and the final distribution maps of ratoon rice were obtained after accuracy verification.
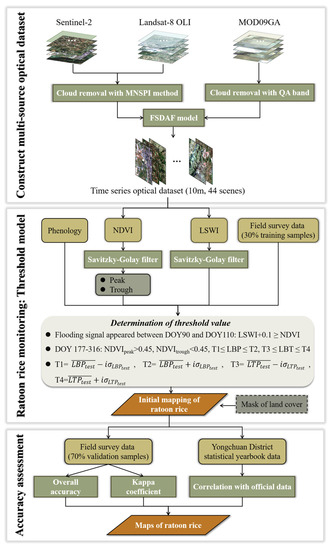
Figure 3.
A flowchart of the methodology showing the processing for ratoon rice monitoring.
3.1. Two Cloud-Removal Methods and FSDAF Model
In this study, the MNSPI method was utilized to effectively remove cloud cover in both the Sentinel-2 and Landsat-8 OLI datasets, and we used the QA band to remove clouds in MOD09GA. The MNSPI method [28], a commonly employed approach for thick-cloud removal, is a modified version of the Neighborhood Similar Pixel Interpolator (NSPI) method that was initially designed to address the issue of filling gaps caused by the Landsat ETM+ Scan Line Corrector (SLC)-off problem. This method utilizes spatial neighbor information (referred to as spatial correlation prediction) and temporal variations (referred to as time-based prediction) to predict missing data. Furthermore, MNSPI quantifies the relative significance of spatial correlations and time-based prediction in the final ensemble. The MNSPI method was subsequently employed for the reconstruction of time-series images [35]. The expression is:
where is the value of the target pixel on date in band ; represents the prediction of the target pixel using spectro-spatial information, while represents the prediction based on the spectro-temporal information; denotes the average spatial distance between the target pixel and its similar pixels; and is the spatial distance between the target pixel and the center of the cloud.
We applied the QA band to detect and identify cloud pixels in MOD09GA. The QA pixel values were transformed into binary form, aligning with the indicators provided in the user manual, in order to detect and label cloud pixels.
Zhu et al. [29] proposed the FSDAF model, which integrates the unmixing method, weight function, and thin plate spline (TPS) interpolation method within a unified framework. This integration allows FSDAF to achieve satisfactory performance in most scenarios while requiring minimal input data. The primary concept involves classifying a high-spatial-resolution image at time , followed by estimating the changes in ground object types between two low-spatial-resolution images, and , during the time period. Subsequently, based on this change, the prediction of the high-spatial-resolution image at time is performed, and the residual is subsequently assigned. The classification method uses ISODATA classification in unsupervised classification. TPS interpolation method downscales low-spatial-resolution images to high-spatial-resolution images more accurately through residual distribution.
3.2. Ratoon Rice Threshold Model
Based on the analysis of ratoon rice phenological characteristics in Section 2.2, we proposed a ratoon rice threshold model integrating ratoon rice phenological characteristics and land cover data. This model was deployed to identify ratoon rice fields and size within regions featuring complex crop cultivation distributions.
As the growth status of ratoon rice changes, the spectral characteristics and vegetation index characteristics also change accordingly. Previous research has highlighted the efficacy of certain indices in capturing crop growth dynamics, with the Normalized Difference Vegetation Index (NDVI) and Land Surface Water Index (LSWI) emerging as effective indicators [23]. Specifically, the NDVI serves as a valuable indicator of greenness and vitality, displaying a strong correlation with the leaf area index of ratoon rice fields. Because the LSWI is sensitive to changes in vegetation moisture and soil moisture, it can effectively capture the flooding signal of ratoon rice. The calculation of the NDVI and LSWI involves utilizing surface reflectance values from the near-infrared (), red (), and short-wave infrared () bands. The S-G filter was utilized to smooth the NDVI and LSWI time series, thereby removing the small fluctuations in the time series [36].
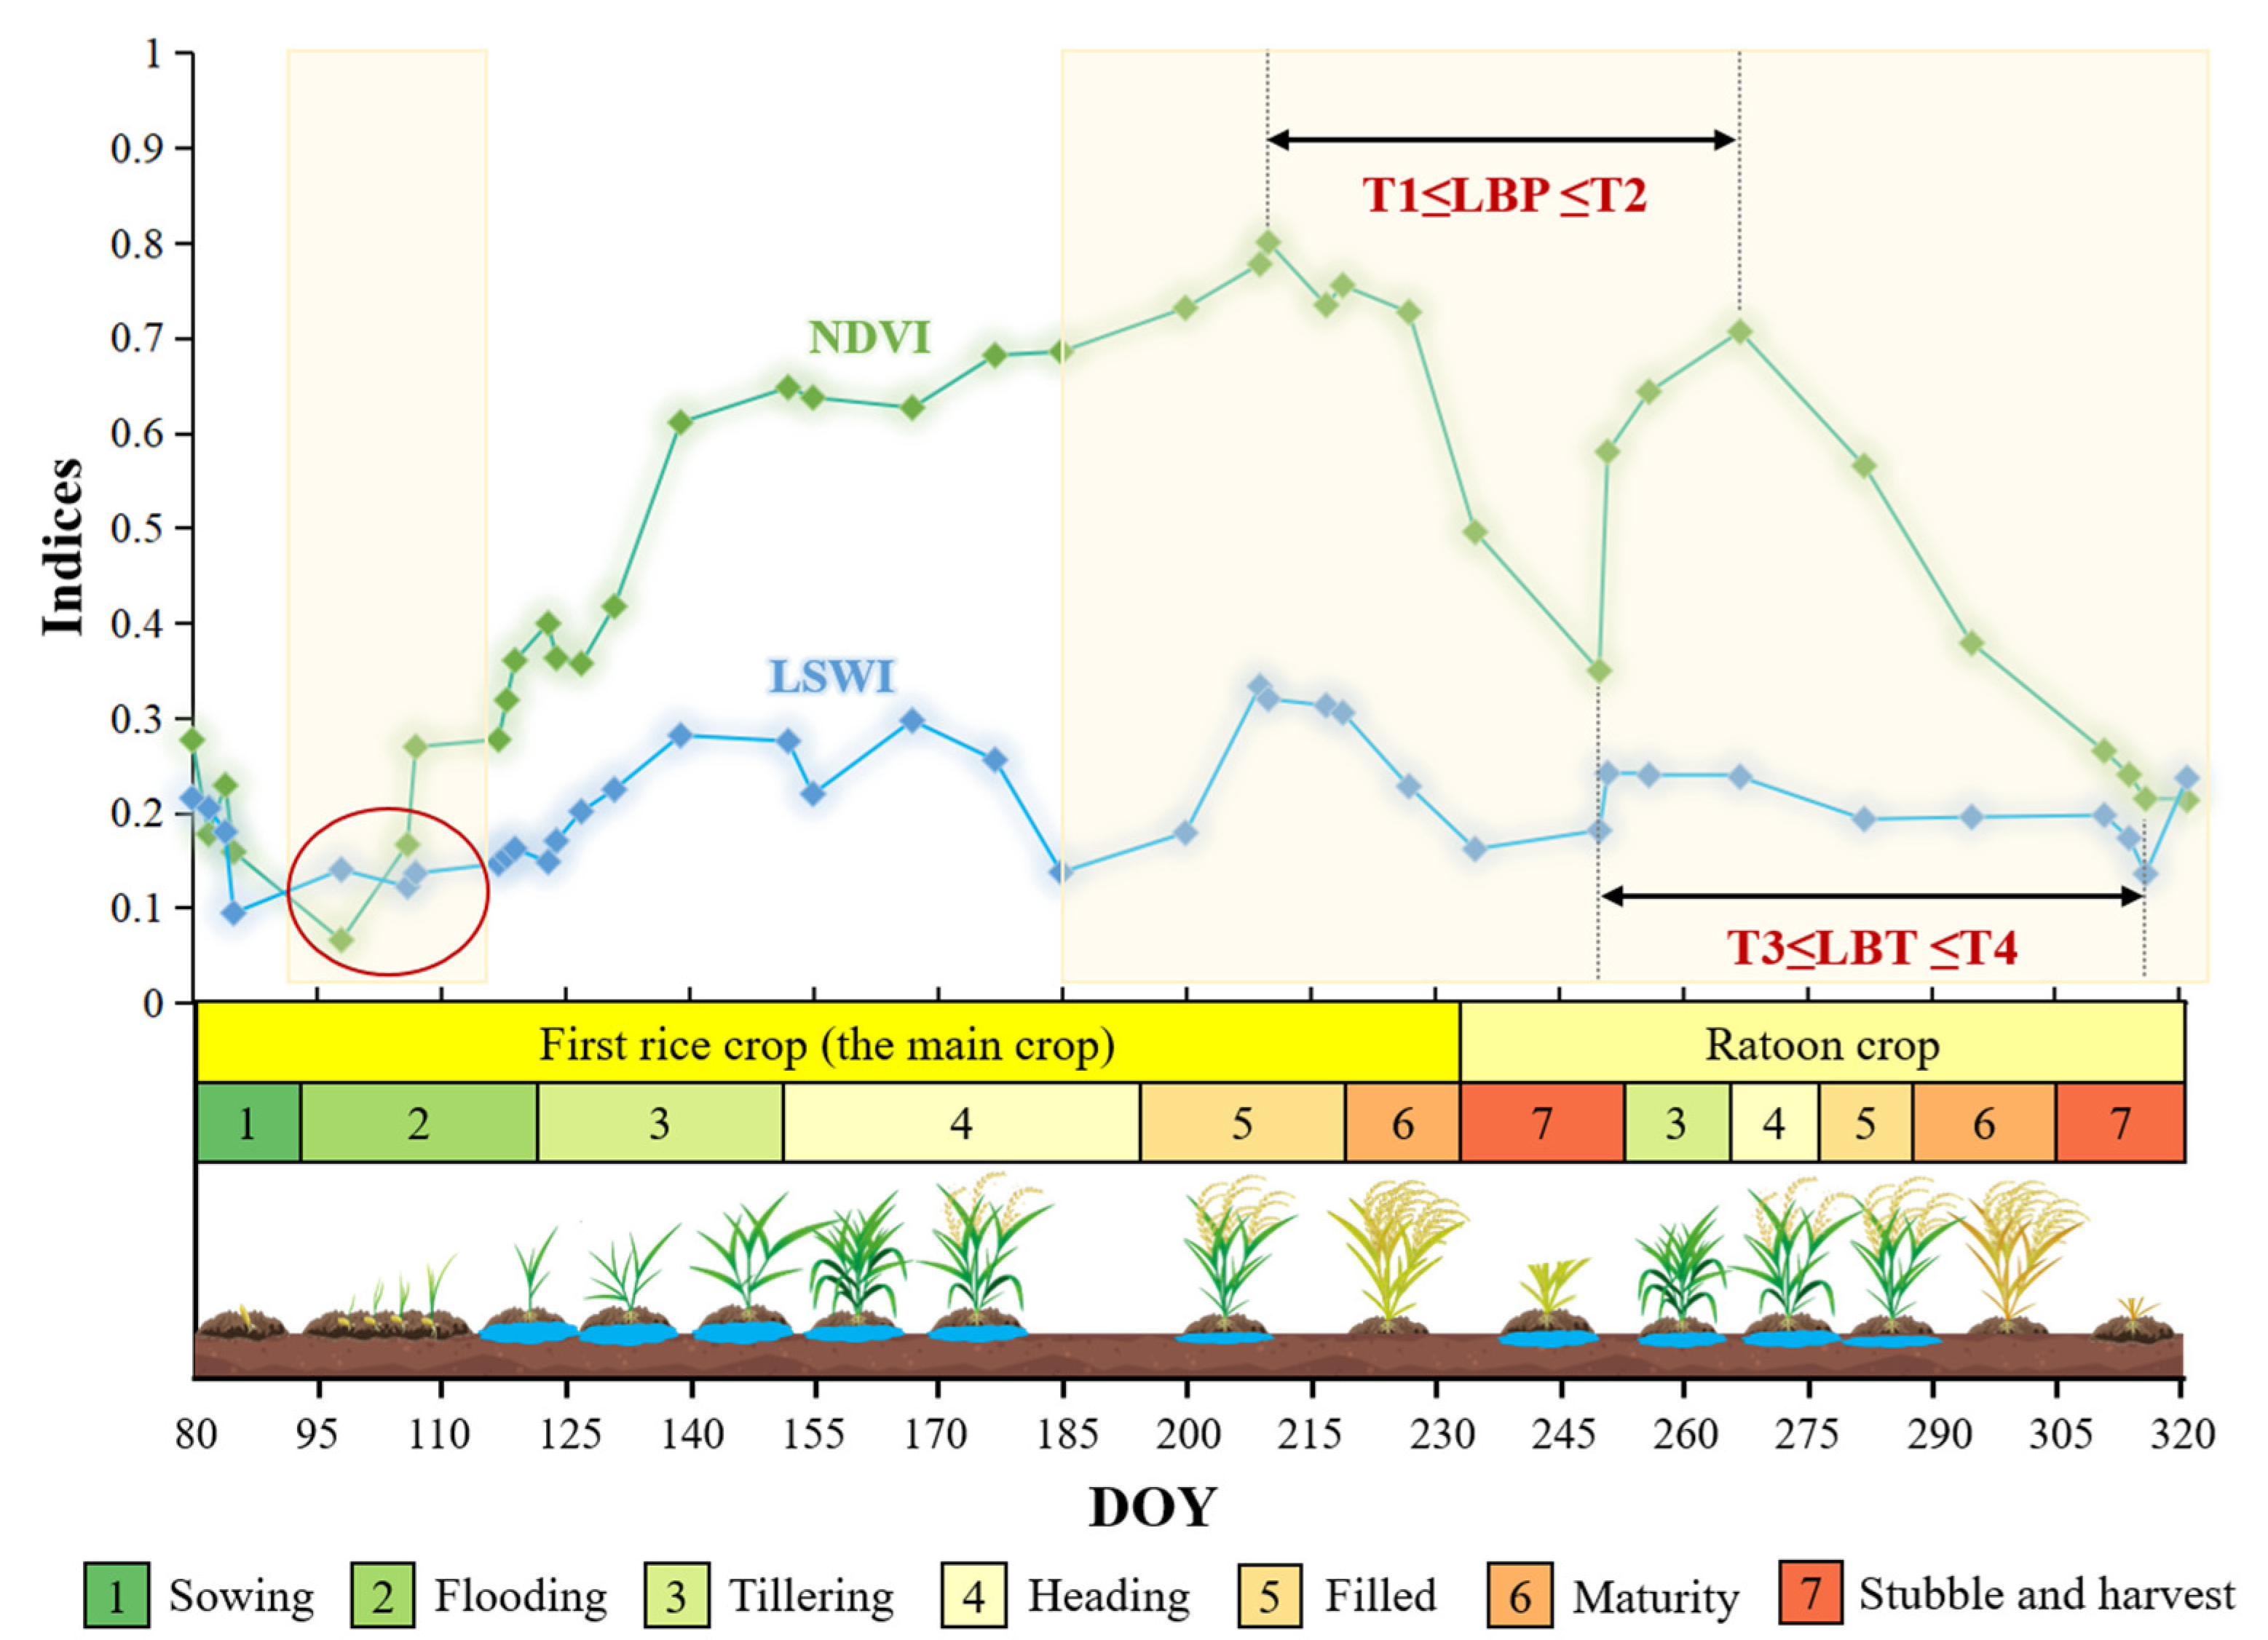
The main time windows for identifying ratoon rice included the main rice crop transplanting stage, heading stage, reserved stubble stage, ratoon crop heading stage, and maturity and harvest stage. The NDVI and LSWI time series of ratoon rice exhibited corresponding changes. The growth cycle and schematic diagram of ratoon rice in Yongchuan District are shown in Figure 4. During the transplanting period of the main rice crop, a flooding signal appeared, which was expressed as LSWI > NDVI (red circle in Figure 4). The main rice crop continued to grow, showing that the NDVI also continued to increase, and the NDVI reached its peak around the heading stage. However, since the increase in main rice crop biomass gradually masked the flooding signal, LSWI showed a trend of increasing first and then decreasing. The main rice crop was harvested and reserved for the stubble period, and the NDVI decreased, close to the LSWI value. After that, the ratoon crop germinated and grew, and the NDVI increased, reaching a peak around the heading stage. Since the ratoon season also requires shallow-water irrigation to help the growth of rice stubble, the LSWI also increased; until maturity and harvest, the NDVI and LSWI decreased. In the NDVI time series, “double peaks” and “double troughs” between the heading stage and the harvest of the ratoon rice were captured. Therefore, based on the characteristics of the flooding period and the characteristics of “double peaks” and “double troughs” during the growth of ratoon rice, a model was designed, which was implemented in MATLAB software 9.13. The model was as follows:
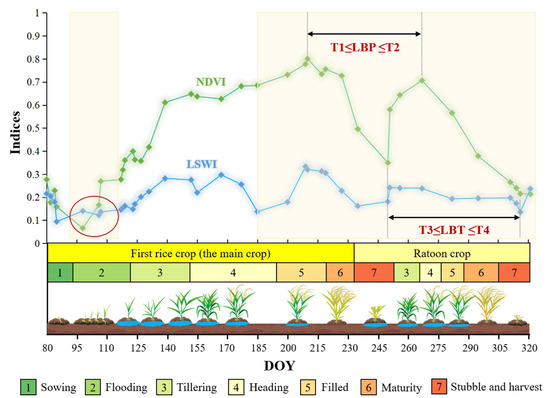
Figure 4.
NDVI and LSWI curves of ratoon rice and phenological characteristics. Red circle indicates the signal characteristics of the flooding period.
Firstly, the flooding signal was determined. As shown by the red circle in Figure 4, around DOY 100, a flooding signal, LSWI > NDVI, appeared, and at least one time flooding signal was observed during the following periods [20]:
DOY 90~110: LSWI + 0.1 > NDVI
Secondly, the peaks and troughs of NDVI and their dates of occurrence were identified, and the phenological calendar and training samples were used to determine the length of days between peaks and troughs. It was decided to identify the peaks and troughs between DOY 177 and DOY 316. The peak of the NDVI () was greater than 0.45, and the trough () was less than 0.45. This threshold was determined by counting the characteristics of the training samples:
After identifying the peaks and troughs, output their corresponding dates and calculate LBP and LBT:
T1 ≤ LBP ≤ T2
T3 ≤ LBT ≤ T4
T1 and T2 are the lower and upper limits of the LBP, while T3 and T4 are the lower and upper limits of the LBT, determined using the mean and standard deviation of the training samples [37]:
where , are the average values of the LBP and LBT of the training samples; , are the standard deviation values of the LBP and LBT of the training samples; and stands for the multiple of the variance, where = 1, 1.25, 1.5, 1.75, …, 3, representing 1 times the standard deviation, 1.25 times the standard deviation, etc. In total, there will be 9 cases of T1, T2, T3, and T4 corresponding to each type of training sample. By employing the mathematical combinatorial method, we derived 6561 combinations of T1, T2, T3, and T4 (94 = 6561), thereby selecting the optimal threshold combination. To ensure robust results, the sample segmentation process was cycled 100 times to determine the optimal threshold corresponding to the best result. After the calculation, the optimal threshold combination was as follows:
T1 = 25 days, T2 = 85 days, T3 = 32 days, T4 = 66 days
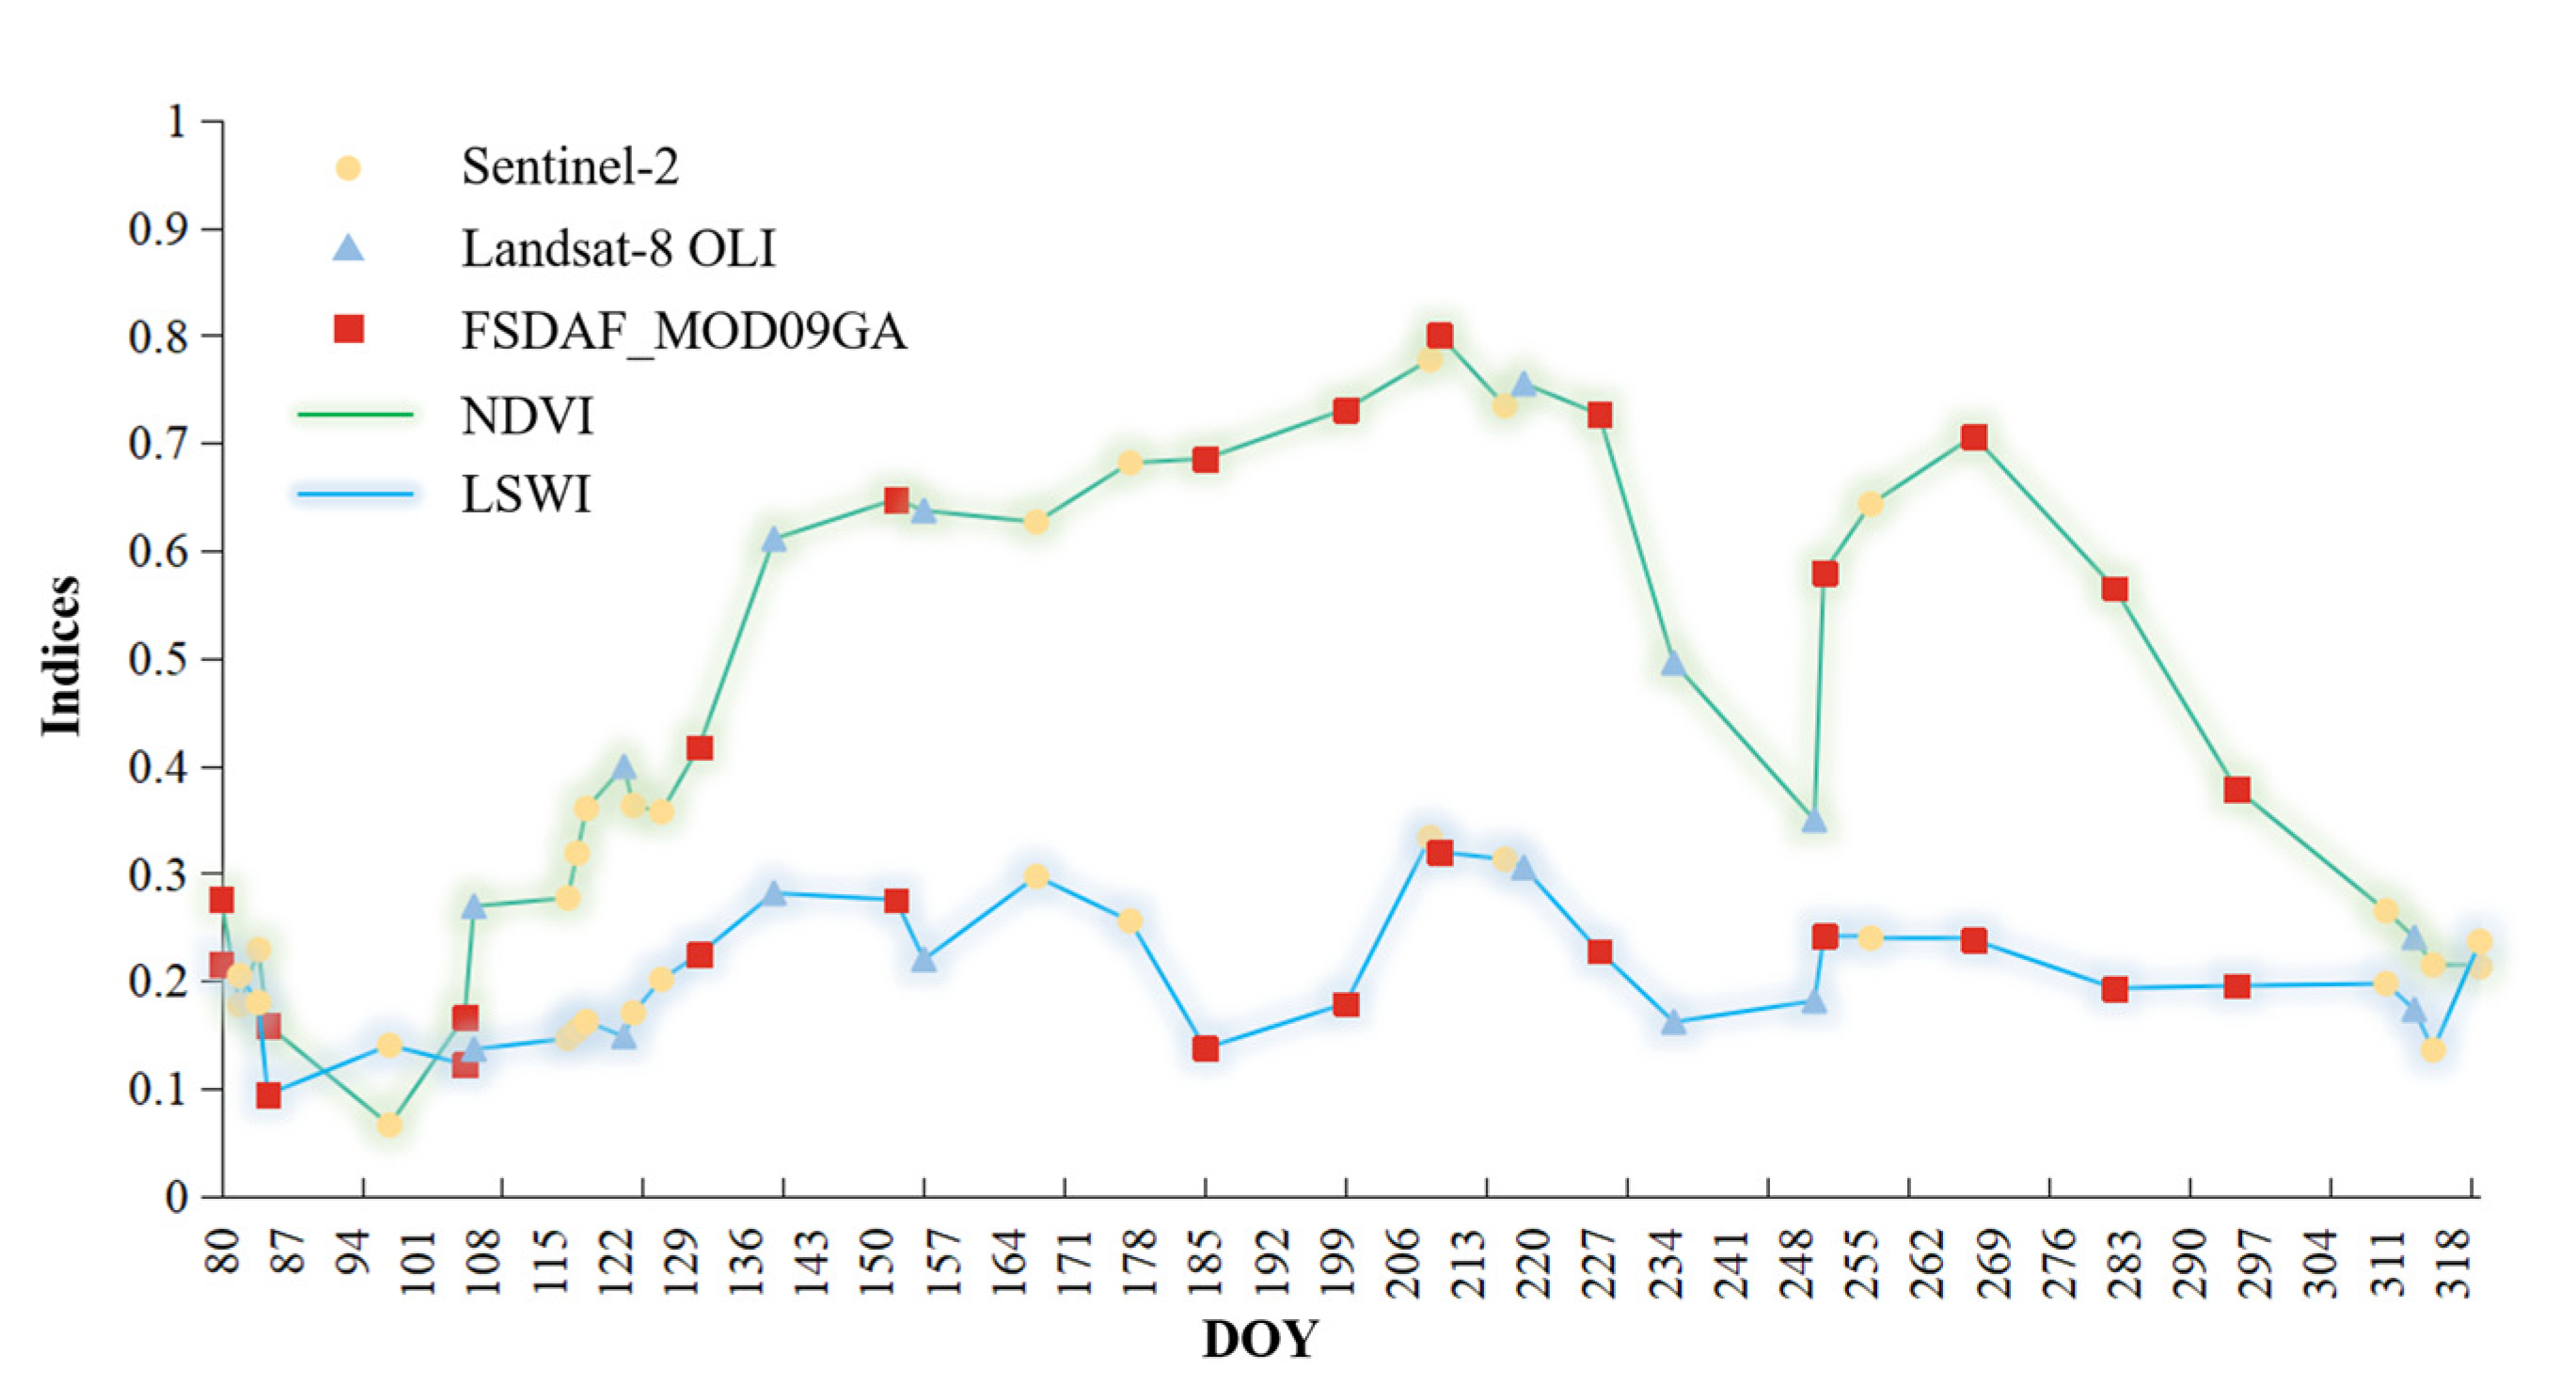
Comparing the threshold results from Equation (11) with the phenological calendar of Yongchuan District, we observed that the values of T2, T3, and T4 closely align with the phenological calendar, whereas there was a notable disparity in the case of T1. The T1 value determined from the training samples was 25 days, which constitutes a relatively short interval and does not conform to the fundamental growth pattern of ratoon rice. The reason for this may be the problem of spatiotemporal fusion. As shown in Figure 5, the NDVI and LSWI characteristic curves of ratoon rice were composed of different remote-sensing data sources, including Sentinel-2, Landsat-8 OLI, and MOD09GA. Due to their high spatial resolution, Sentinel-2 and Landsat-8 OLI are regarded as the preferred data sources for ratoon rice monitoring. However, they are significantly susceptible to cloud contamination, resulting in the loss of numerous image instances. Furthermore, the temporal gaps in these missing images invariably coincide with critical growth stages (“double peaks”) of ratoon rice. Therefore, MODIS’s daily reflectance product MOD09GA was considered to complement the time series gaps. Confronted with an additional concern, the spatial resolution of MOD09GA is limited to 500 m, rendering it ineffective for accurate ratoon rice identification. Thus, the application of the FSDAF model can enhance the spatial resolution. Although the FSDAF model was used, there will inevitably be errors in the fused image, which will affect the determination of the threshold, thus reducing the mapping accuracy of ratoon rice. Referring to the phenological calendar, it was observed that T1 exceeds 40 days. Based on this, a second threshold was determined in combination with the phenological calendar:
T1 = 40 days, T2 = 85 days, T3 = 32 days, T4 = 66 days
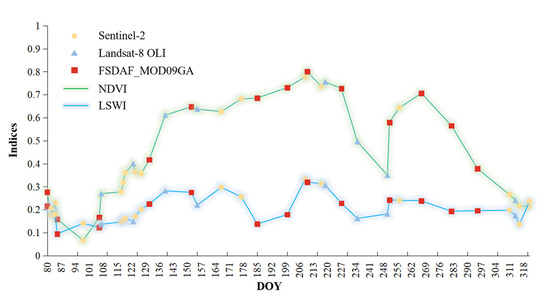
Figure 5.
NDVI and LSWI characteristic curves of different data sources in the study region.
The threshold parameters were input into the model to output the initial ratoon rice distribution map. The masks of forest, urban, water body, and grassland were also extracted from the land cover product [20]. These masks were then overlaid onto the initial distribution map of ratoon rice to eliminate potential noise and obtain the final distribution result of ratoon rice.
3.3. Accuracy Assessment
The cloud removal and spatial–temporal fusion performance were evaluated via simulation experiment with the correlation coefficient (r) and root mean square error (RMSE) [20]. Specifically, for each land cover type, we randomly created cloud patches and conducted a comparison between the reflectance values of the restored pixels and those of the true images within the respective cloud patches.
The accuracy of the ratoon rice monitoring results was evaluated using the overall accuracy and kappa coefficient from the validation samples, which could reflect the monitoring accuracy from different aspects. Overall accuracy is the number of correctly classified samples as a proportion of the number of all samples. The value of kappa is between −1 and 1. When the value > 0.6, the closer to 1.0, the higher the consistency. Meanwhile, the ratoon rice area was compared with the official statistical area.
4. Results
4.1. Performance of the MNSPI Method
As an illustration, the Sentinel-2 image captured on 26 April 2020 and the Landsat-8 OLI image taken on 2 May 2020 were chosen for analysis. Artificial cloud patches were randomly generated for five land cover types of Sentinel-2 and Landsat-8 OLI: urban, cultivated land, forest, water body, and grassland. After applying the MNSPI method for cloud removal, the comparison outcomes of the true image and the restored image are depicted in Figure 6: It was observed that the MNSPI method was capable of effectively restoring a significant portion of image features that were previously obscured by thick clouds and shadows. There were only a few issues with the recovery of small boundaries (such as roads and building edges) in the cloud-covered images, as they may not appear as clearly and lack continuity. Meanwhile, RMSE and r were used to evaluate the performance of the MNSPI method. A smaller value of the RMSE indicates better cloud-removal results, implying a higher level of accuracy in removing cloud interference. The results showed that the RMSE value of each land cover type was low, and the mean RMSE values of the Sentinel-2 and Landsat-8 OLI images were 0.0118 and 0.0357, respectively. In particular, due to the obvious difference in spectral characteristics between the water body and other land covers, it was easier to recover image information with the lowest RMSE (Sentinel-2: 0.0064; Landsat-8 OLI: 0.0289). On the contrary, due to the fragmentation of urban patches, the restoration effect on images had the highest RMSE (Sentinel-2: 0.0200; Landsat-8 OLI: 0.0399), which was not as satisfactory as with other land cover types. The value range of r is −1 to 1. The closer the absolute value of r is to 1, the stronger the correlation between the restored image and the true image, while a value closer to 0 indicates a weaker correlation. Figure 6 shows that the r value of each land cover type was high, and the mean r values of the Sentinel-2 and Landsat-8 OLI images were 0.9730 and 0.9983, respectively. Among them, the highest correlation was observed between the restored grassland and the true grassland in the Sentinel-2 image (r = 0.9866). Similarly, the highest correlation was found between the restored water body and the true water body in the Landsat-8 OLI image (r = 0.9987). Overall, the MNSP method exhibited stable and effective cloud-removal performance in both Sentinel-2 and Landsat-8 OLI images.
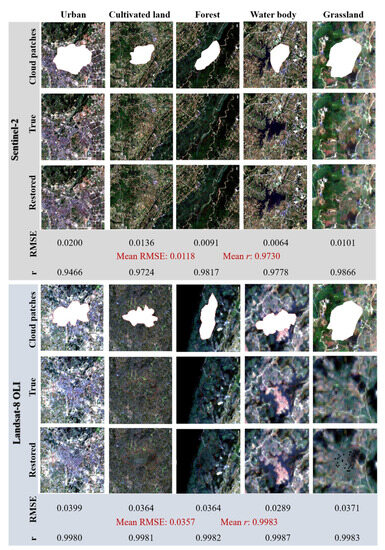
Figure 6.
True color composite images from Sentinel-2 (26 April 2020) and Landsat-8 OLI (2 May 2020) for the cloud-removal simulation experiment and accuracy evaluation using the RMSE and r. Cloud patches: artificial cloud patches were designed for five land cover types. True: real cloudless images. Restored: cloud images were restored.
4.2. Performance of the FSDAF Model
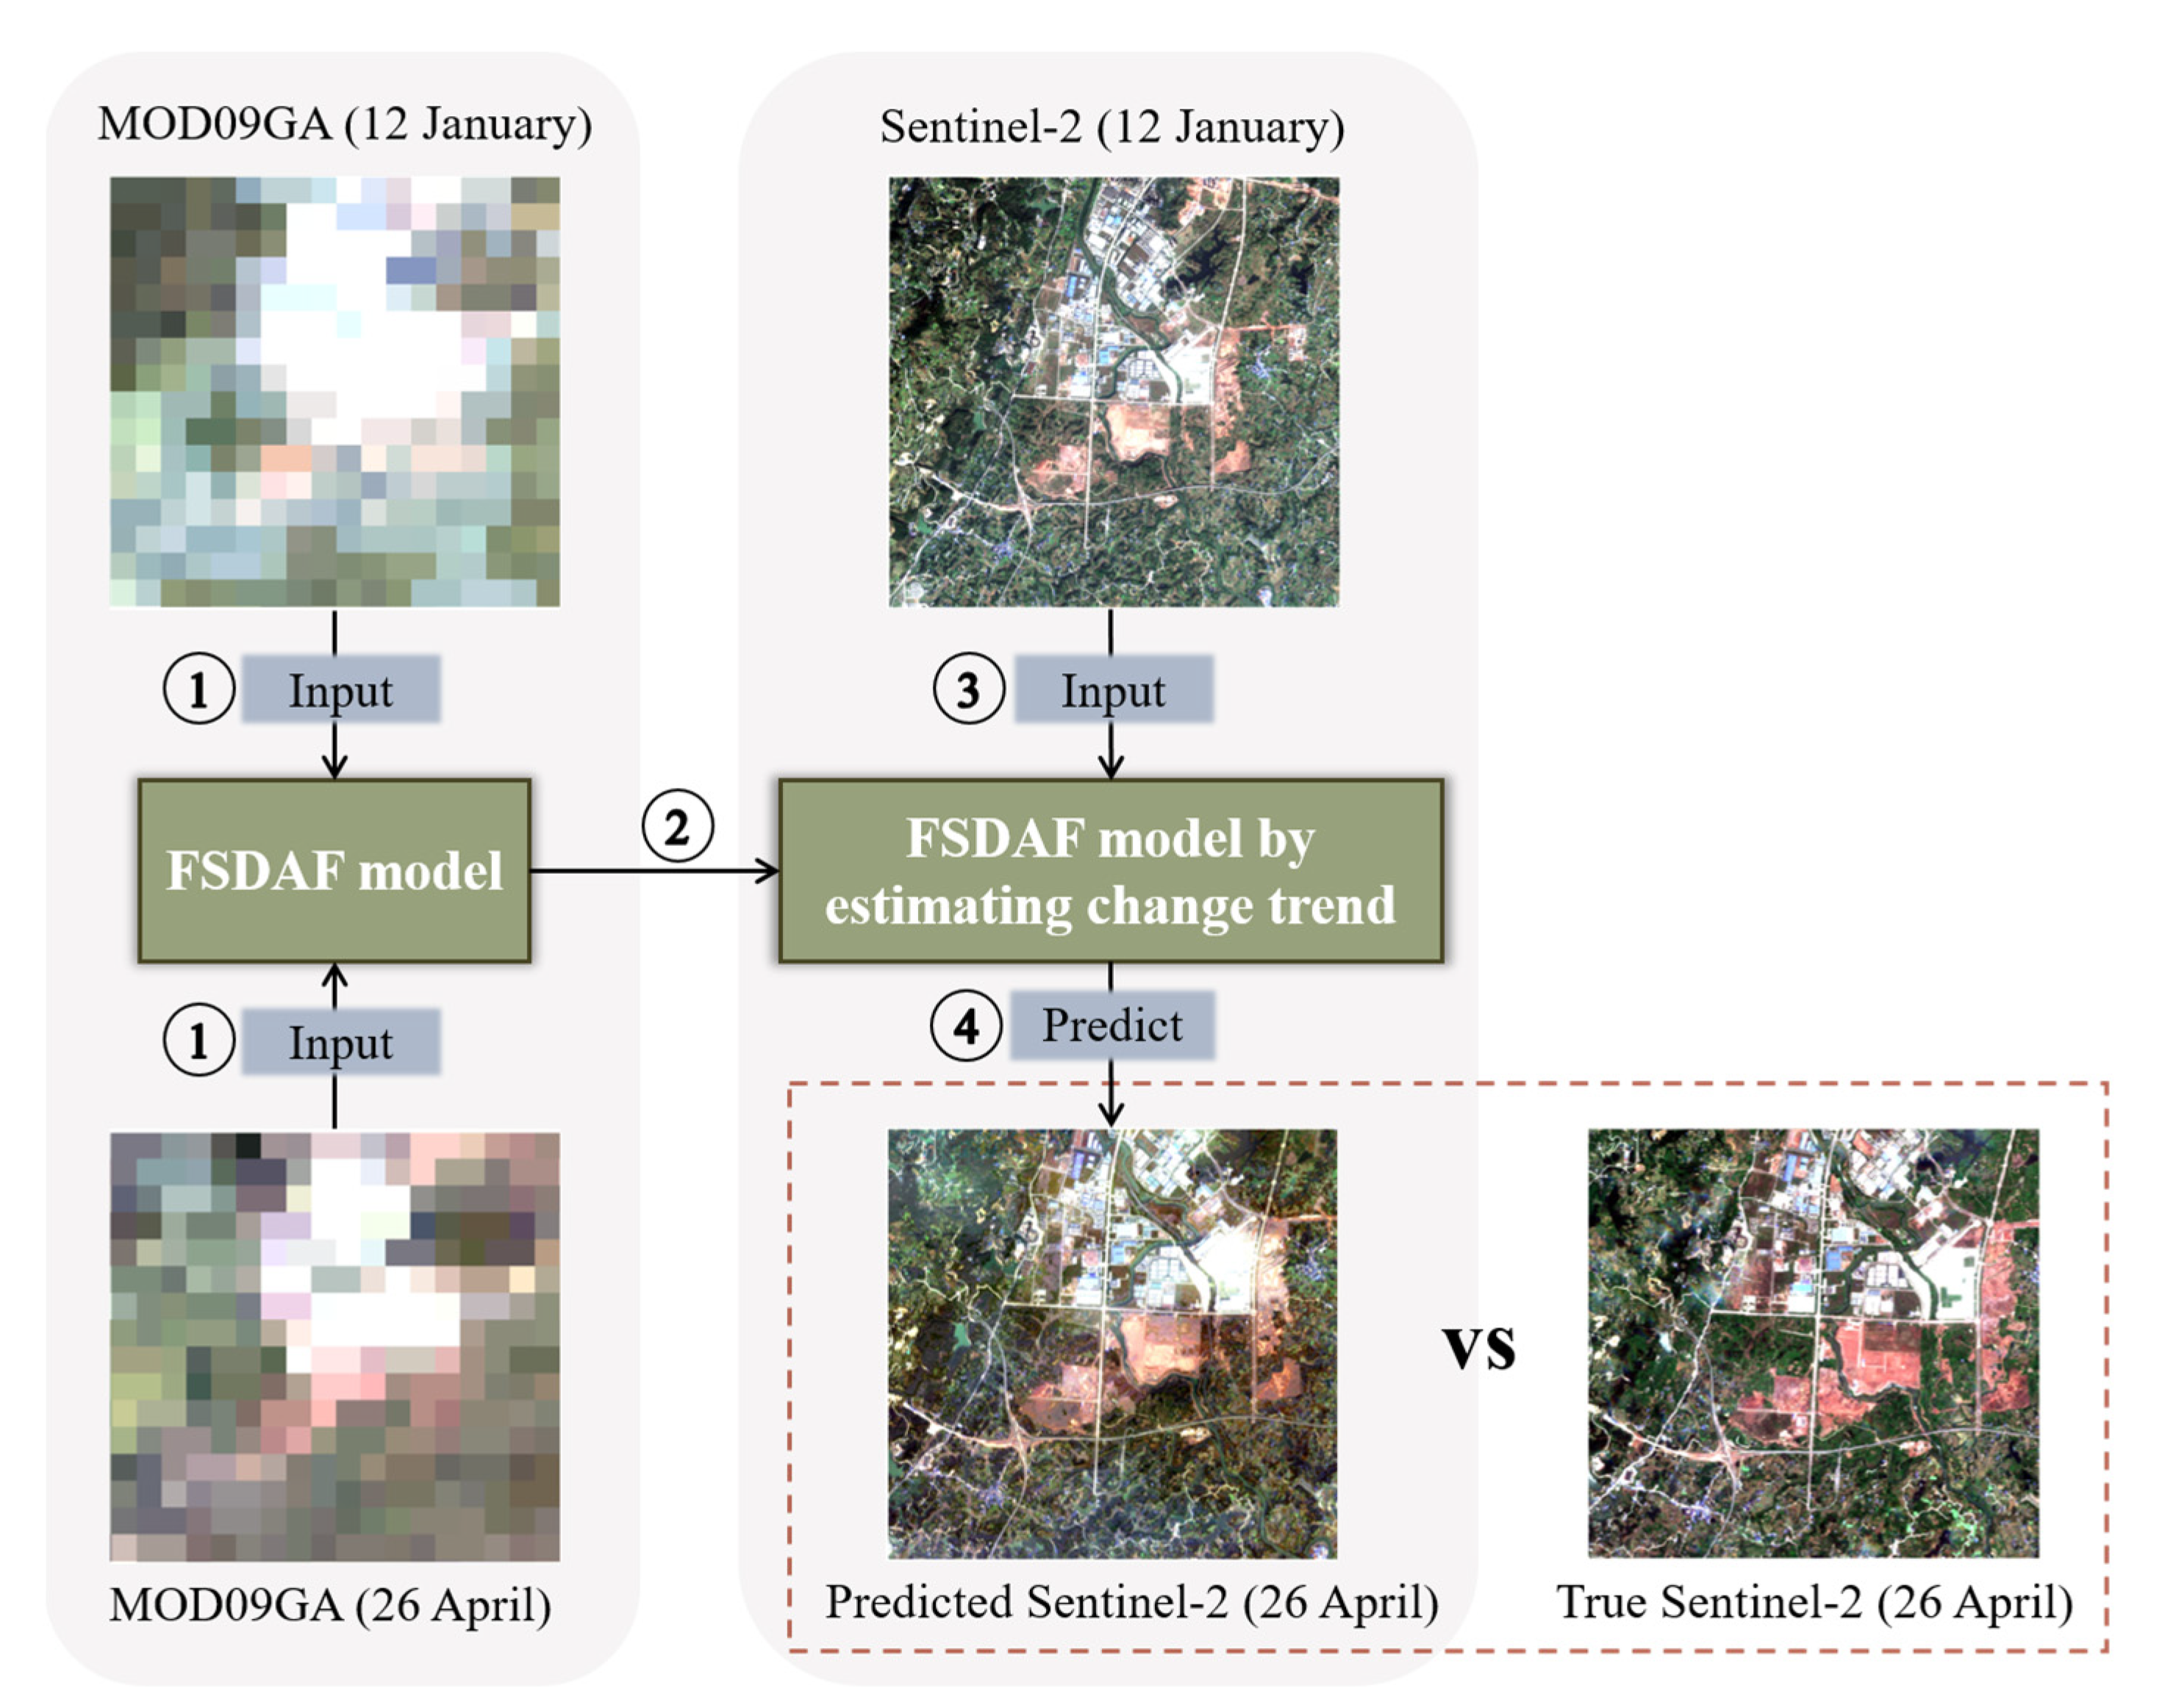
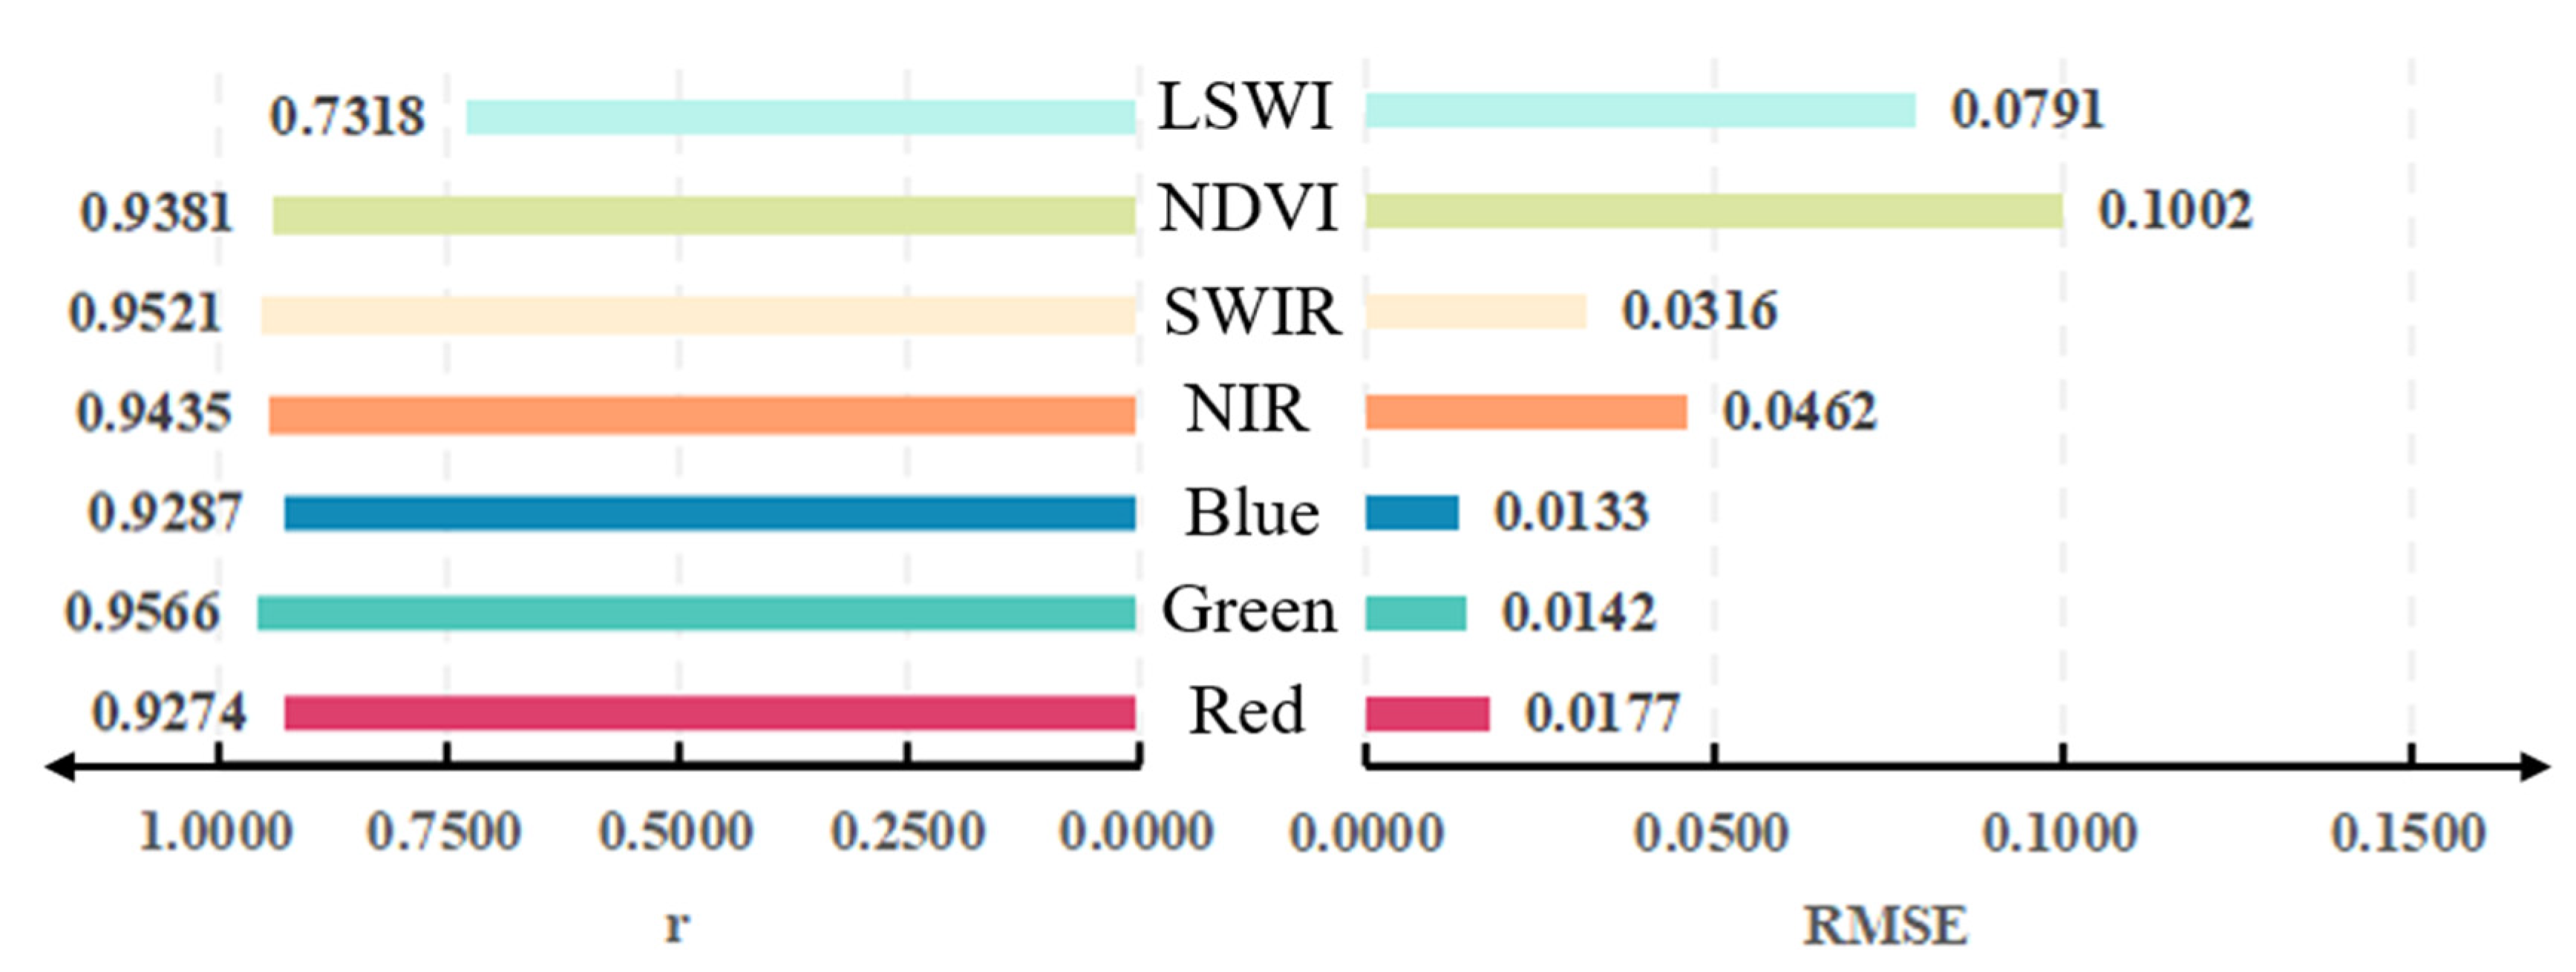
Figure 7 illustrates a predicted Sentinel-2 image on 26 April 2020 using the FSDAF model in comparison with the true Sentinel-2 image on 26 April 2020. There were four steps: ① Two MOD09GA images at different times ( = 12 January 2020, = 26 April 2020) were input into the FSDAF model. ② After that, the FSDAF model detected the trend of these two images. ③ Then, the Sentinel-2 image at time was input. ④ Finally, the FSDAF model with predictive ability was used to predict the Sentinel-2 image at time . Through visual comparison, it was evident that the predicted Sentinel-2 image closely resembled the true Sentinel-2 image, demonstrating the effectiveness of the FSDAF method in accurately capturing changes in surface coverage reflectivity. Thanks to the high temporal resolution (one day) of MOD09GA images, accurate acquisition of key parameters during the ratoon rice growth period in Yongchuan District is facilitated. However, the spatial resolution (500 m) is insufficient to effectively discern the distribution of ratoon rice. Hence, the FSDAF model can downscale the MOD09GA image to a spatial resolution of 10 m, thus providing a high-precision data source for accurate monitoring of ratoon rice. As shown in Figure 8, through quantitative evaluation, the RMSE values for the five bands (SWIR, NIR, blue, green, and red) of the predicted Sentinel-2 image were discovered to be 0.0462 or lower, with an average of 0.0246. The RMSE of the blue band was the lowest (0.0133), while the RMSE of NIR was the highest (0.0462). Additionally, the r values for the five bands were 0.9274 or higher, with an average of 0.9417. The r value of the green band was the highest (0.9566), while the r value of the red band was the lowest (0.9274). However, for the NDVI and LSWI, the RMSE values were greater than those of the five bands; that is, the error was greater than the evaluation results of a single band. The r value of the LSWI was determined to be 0.7318, which falls within the acceptable range. This may be related to the diversity of land cover types. Consequently, the fused image met the accuracy requirements for subsequent ratoon rice monitoring. The results of the accuracy evaluation indicated a strong correlation between the FSDAF fusion image and the true Sentinel-2 image. Hence, the fused images were used for the subsequent monitoring of ratoon rice.
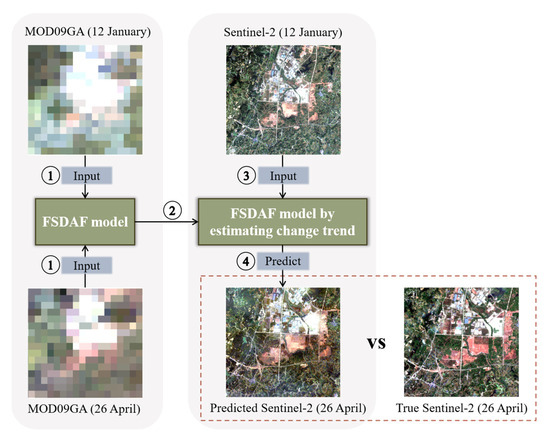
Figure 7.
The FSDAF model predicts a Sentinel-2 image on a certain day based on MOD09GA and Sentinel-2 images on other days, and these images are displayed in true color composite.
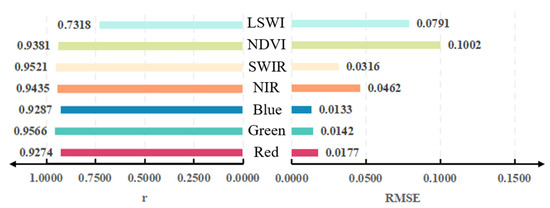
Figure 8.
Accuracy of the FSDAF model applied to different bands and indices.
Finally, as shown in Figure 9, a total of 44 available images (MOD09GA: 17 scenes; Landsat-8 OLI: 9 scenes; Sentinel-2: 18 scenes) were used for fusing the time series optical dataset. The time distribution of three remote-sensing images in the study region from January to December 2020 highlights the image distribution within one month with different colors to enhance the readability of the graphics. The temporal resolution was 5–16 days, and the spatial resolution of this dataset was 10 m.
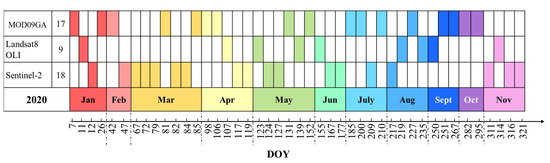
Figure 9.
Date and quantity of optical remote-sensing data acquisition in this study.
4.3. Ratoon Rice Mapping Based on Two Sets of Thresholds and Accuracy Assessment
Figure 10 shows maps of the ratoon rice planting area in the study region with a 10 m spatial resolution obtained under two sets of thresholds, as well as a detailed comparison of the two results. Figure 10a shows the result obtained by calculating the threshold based on samples (Formula (11)), and Figure 10b shows the result obtained by adjusting the threshold based on the phenological calendar (Formula (12)). Overall, ratoon rice was planted in all townships in Yongchuan District. The planting area in the south was greater than that in the north, and it was mainly distributed in low-altitude regions. Detailed maps of four regions were randomly selected from the two results and compared with the true Sentinel-2 image (Figure 10a-1–b-4). The rice field boundaries of the two types of ratoon rice-extraction results were similar, and both had a high degree of matching with the real remote-sensing image background. Nevertheless, a utilization of the pixel-based method for extraction unavoidably leads to the presence of a “salt and pepper” effect.
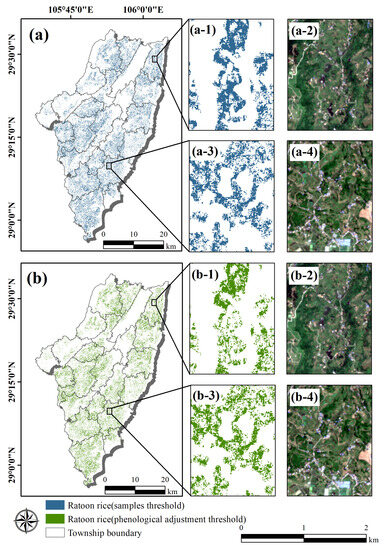
Figure 10.
The spatial distribution of ratoon rice in 2020 in Yongchuan District based on two sets of thresholds. (a): The result of the threshold value based on training samples; (b): The result of the threshold value adjusted based on the phenological information; (a-1,a-3,b-1,b-3): Detailed comparison of the two results; (a-2,a-4,b-2,b-4): Sentinel-2 optical image on August 4, 2020. The scale bar in the bottom right is for the zoomed-in figures.
According to relevant official documents, the average annual area of ratoon rice in Yongchuan District was controlled between 158 km2 and 180 km2. Based on the sample threshold calculation results, the monitoring area of ratoon rice was 227.28 km2, with an overall accuracy and a kappa coefficient of 89.27% and 0.77, respectively. The results of the phenological adjustment threshold showed that the monitoring area of ratoon rice was 194.17 km2, with an overall accuracy of 90.73% and a kappa coefficient of 0.81. Overall, both methods yielded satisfactory outcomes. However, the ratoon rice area obtained using the phenological adjustment threshold was closer to the official data, and the result was used as the final monitoring result of the ratoon rice, which indirectly proves the importance of phenological information. The above results show that the dataset and threshold model constructed by us perform well in monitoring ratoon rice in cloudy and rainy regions.
5. Discussion
To address the limitations of optical imagery in cloudy and rainy areas, the MNSPI method and the FSDAF model were utilized to reconstruct complete time series optical remote-sensing data. In our previous study, the dataset was validated using evaluation metrics and examples, resulting in a high validation accuracy. This ensures the validity and usability of the dataset [20]. As a relatively new mode of rice cultivation, there are insufficient studies on ratoon rice remote-sensing monitoring. Previous scholars extracted ratoon rice in Hubei Province, but they did not perform the relevant processing of the cloud-covered images, resulting in incomplete results [26]. Our reconstruction of the dataset mitigates the consequences of cloud cover. Moreover, phenology-based algorithms have become a relatively popular and evolving approach for rice extraction in recent years and require only a small number of field samples [19,20,38,39]. The spatial resolution of our dataset is 10 m, which closely matches the scale of small fields in southwest China and helps mitigate the impact of mixed pixels [6]. In this subsection, the applicability of the method to different cropping patterns of rice, the degree of contribution of the spatiotemporal fusion algorithm, and the limitations of the method are discussed.
5.1. Comparison of Characteristics of Different Rice Cropping Types
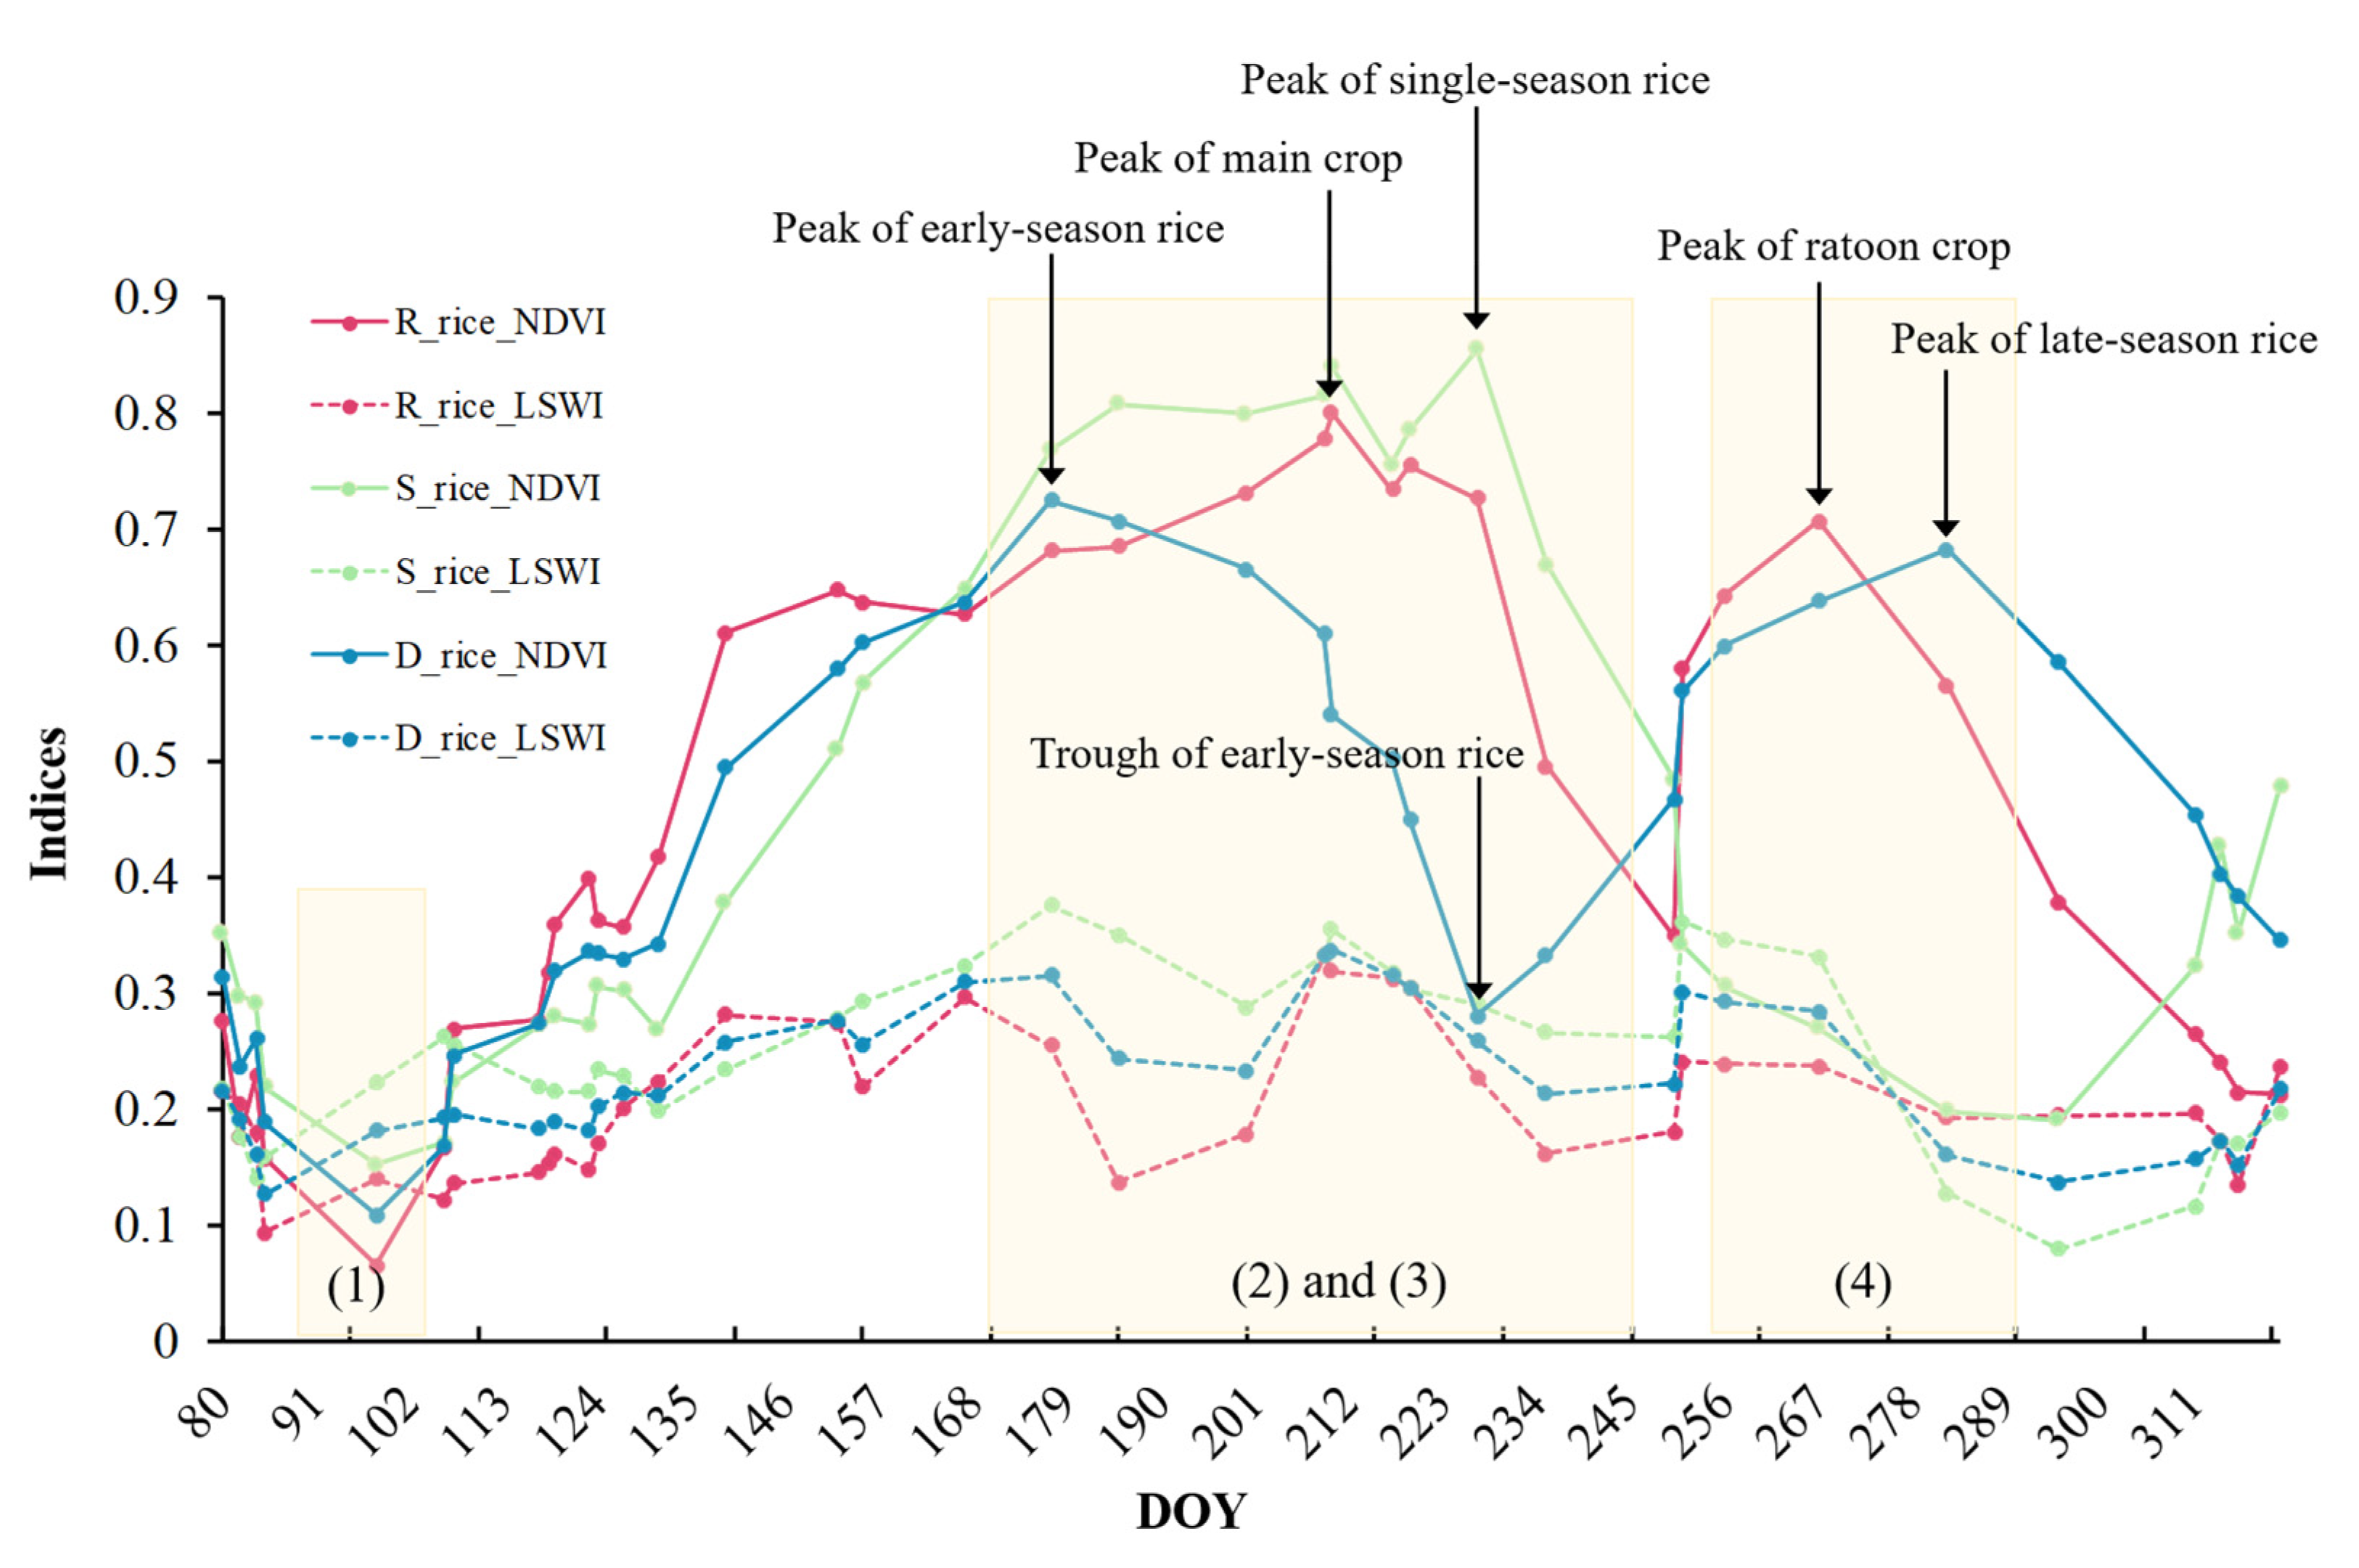
The threshold model was constructed mainly by identifying the transplanting period, “double peaks”, and “double troughs” characteristics of ratoon rice. Specifically, the growth cycles of single-season rice, double-season rice, and ratoon rice exhibited distinct variations, which translated to unique curve characteristics, as shown in Figure 11: (1) During the transplanting period, double-season rice, single-season rice, and ratoon rice had the same flooding signal characteristics, characterized by LSWI > NDVI. (2) After that, the early-season rice (the first season of double-season rice), single-season rice, main rice crop, and ratoon rice grew together, but the early-season rice reached its peak earlier than single-season rice and the main rice crop. (3) After heading, the early-season rice, single-season rice, and main rice crops were filled and matured, showing a decrease in NDVI. Similarly, the NDVI of early-season rice reached the trough first. (4) In the stubble period of the ratoon crop, NDVI increased again and reached a second peak, but the NDVI of single-season rice continued to decline, and late-season rice (the second season of double-season rice) reached a second peak later. In general, there is only one peak in the growth cycle of single-season rice, while there are “double peaks” in the growth cycle of ratoon rice, which is an important feature when distinguishing them. Both ratoon rice and double-season rice had “double peaks” and “double troughs”, but they appeared at different times. Since there was no sample site for double-season rice cultivation in this study region, the ideal curve of vegetation index change corresponding to double-season rice growth was constructed by referring to the relevant literature and information on double-season rice cultivation in other areas [26,40].
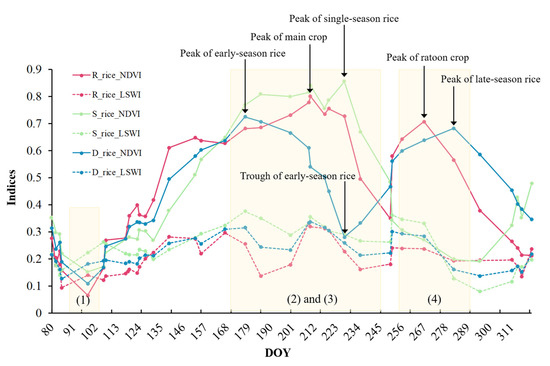
Figure 11.
Comparison of NDVI and LSWI curves for ratoon rice, single-season rice, and double-season rice (note: R_rice—ratoon rice; S_rice—single-season rice; D_rice—double-season rice).
The most important difference between different rice crop types is the number of flood signals in a year and the number of curve peaks [27]. It is worth mentioning that the curve characteristics of the ratoon rice and double-season rice were similar, but there were differences in the growth phenology between them. The ratoon crop of ratoon rice did not need to be re-transplanted, and stubble of 20–40 cm was retained in the paddy field, contrasting the need for re-transplantation with the double-season rice (Figure 11). The ratoon crop of ratoon rice grew rapidly and had a short growth cycle, which was also different from the double-season rice. The difference between ratoon rice and traditional double-season rice can be judged by the length of the phenological period and the NDVI and LSWI characteristics in the early stage of the second-season rice.
5.2. Contribution of the Spatiotemporal Fusion Model
The distribution of each data source within the fusion dataset is shown in Figure 5. It can be seen that several key periods of ratoon rice monitoring were inseparable from the fusion data. In this example, the transplanting information happens to be the Sentinel-2 image, but around it were the data obtained through the MOD09GA spatiotemporal fusion, and the flooding signals of other sample points appeared at the time of the MOD09GA image. In the “double peaks” period, both MOD09GA fusion images were involved, which also caused a problem in the value range of the threshold model (Section 3.2). It was not difficult to find that the late stage of the ratoon rice stubble was composed of Landsat-8 OLI and MOD09GA images, while Sentinel-2 images were found more in the late growth period (Figure 5). This demonstrates the great usefulness of the FSDAF model, which fills the absence of high-spatial-resolution images of key phenological periods and lays the foundation for subsequent research.
5.3. Limitations of Phenological Information and Samples
The model thresholds were determined using training samples and a phenological calendar. The method proposed in this paper is suitable for the regions with phenological data on ratoon rice. Phenological data are utilized to determine the key phenological periods of ratoon rice and certain thresholds in the model. However, other regions may lack phenological information. According to the relevant literature, variations in meteorological factors and crop growth, as well as farmer choices, may differ across distinct sub-regions and even among various paddy fields [41,42]. In the model, samples are needed to calculate the upper and lower limit days of the critical period of ratoon rice. When the study region is large, and there are significant phenological differences in ratoon rice within the region, using only one phenological information will increase the uncertainty of the results. For the above two reasons, some scholars have determined the time window using the surface temperature, air temperature, etc. [17,43]. The time window can also be determined by defining the mathematical characteristics of the NDVI changes, which can be used for application research in areas without phenological information.
6. Conclusions
Monitoring of ratoon rice is an important measure to adjust the agricultural structure in time and ensure food security. In this study, a time-series dataset of Yongchuan District was constructed using multi-source remote-sensing data via the MNSPI method for cloud-removal interpolation and the FSDAF model for spatiotemporal fusion. Then, a threshold model for monitoring ratoon rice was developed based on a phenological and mathematical statistical approach. The accuracy of the results was confirmed through the utilization of field survey data and official statistical data. We constructed a time series fusion optical dataset with a revisit period of 5–16 days and a spatial resolution of 10 m. In addition, the performances of the MNSP method and FSDAF model were stable and effective, exhibiting high r values and low RMSE values. The results also showed that the reconstructed dataset using the MNSP method and FSDAF model can better meet the data requirements for phenology mapping, demonstrating the potential of the MNSP method and FSDAF model for ratoon rice monitoring in cloudy and rainy regions. The total area of ratoon rice was 194.17 km2, with an overall accuracy of 90.73% and a kappa coefficient of 0.81, which shows that the threshold model could effectively identify ratoon rice. The availability of phenological features of ratoon rice in the study region is a potential limitation of the method. Microwave data are increasingly being used for remote-sensing monitoring of cloudy and rainy areas due to their advantages of passing through clouds and fog. Subsequent studies will prioritize the integration of both remote-sensing data types, as well as exploring and developing better phenological indicators.
Author Contributions
Conceptualization, Visualization, and Writing—Original Draft Preparation, R.Z.; Writing—Review and Editing, Y.W.; Conceptualization, Methodology, Writing—Review and Editing, Y.L. All authors have read and agreed to the published version of the manuscript.
Funding
This research was funded by the Natural Science Foundation of Chongqing, grant number CSTB2022NSCQ-MSX0442, and the Fundamental Research Funds for the Central Universities, grant number SWU021003.
Data Availability Statement
Data will be made available on request.
Conflicts of Interest
The authors declare no conflict of interest.
References
- Singha, M.; Dong, J.; Zhang, G.; Xiao, X. High resolution paddy rice maps in cloud-prone Bangladesh and Northeast India using Sentinel-1 data. Sci. Data 2019, 6, 26. [Google Scholar] [CrossRef] [PubMed]
- Seck, P.A.; Diagne, A.; Mohanty, S.; Wopereis, M.C.S. Crops that feed the world 7: Rice. Food Secur. 2012, 4, 7–24. [Google Scholar] [CrossRef]
- Dong, H.; Chen, Q.; Wang, W.; Peng, S.; Huang, J.; Cui, K.; Nie, L. The growth and yield of a wet-seeded rice-ratoon rice system in central China. Field Crops Res. 2017, 208, 55–59. [Google Scholar] [CrossRef]
- Ray, D.K.; Foley, J.A. Increasing global crop harvest frequency: Recent trends and future directions. Environ. Res. Lett. 2013, 8, 044041. [Google Scholar] [CrossRef]
- Yang, J.; Hu, Q.; You, L.; Cai, Z.; Chen, Y.; Wei, H.; Xu, Z.; He, Z.; Yin, G.; Xu, B. Mapping the potential northern limits and promotion extent of ratoon rice in China. Appl. Geogr. 2023, 150, 102822. [Google Scholar] [CrossRef]
- Jiang, M.; Xin, L.; Li, X.; Tan, M.; Wang, R. Decreasing rice cropping intensity in southern China from 1990 to 2015. Remote Sens. 2018, 11, 35. [Google Scholar] [CrossRef]
- Yuan, S.; Cassman, K.G.; Huang, J.; Peng, S.; Grassini, P. Can ratoon cropping improve resource use efficiencies and profitability of rice in central China? Field Crops Res. 2019, 234, 66–72. [Google Scholar] [CrossRef]
- Shen, X.; Zhang, L.; Zhang, J. Ratoon rice production in central China: Environmental sustainability and food production. Sci. Total Environ. 2021, 764, 142850. [Google Scholar] [CrossRef]
- Hussain, S.; Peng, S.; Fahad, S.; Khaliq, A.; Huang, J.; Cui, K.; Nie, L. Rice management interventions to mitigate greenhouse gas emissions: A review. Environ. Sci. Pollut. Res. 2015, 22, 3342–3360. [Google Scholar] [CrossRef]
- Jiang, Q.; Wang, W.; Chen, Q.; Peng, S.; Huang, J.; Cui, K.; Nie, L. Response of first flood irrigation timing after rice dry-direct-seeding: Productivity and greenhouse gas emissions in Central China. Agric. Water Manag. 2016, 177, 241–247. [Google Scholar] [CrossRef]
- Wang, F.; Huang, J.; Peng, S. Research and development of mechanized rice ratooning technology in China. China Rice 2021, 27, 1–6. [Google Scholar]
- Lin, W. Developmental status and problems of rice ratooning. J. Integr. Agric. 2019, 18, 246–247. [Google Scholar] [CrossRef]
- Zhao, S.; Liu, X.; Ding, C.; Liu, S.; Wu, C.; Wu, L. Mapping rice paddies in complex landscapes with convolutional neural networks and phenological metrics. GIScience Remote Sens. 2019, 57, 37–48. [Google Scholar] [CrossRef]
- Guan, X.; Huang, C.; Liu, G.; Meng, X.; Liu, Q. Mapping rice cropping systems in Vietnam using an NDVI-Based Time-Series similarity measurement based on DTW distance. Remote Sens. 2016, 8, 19. [Google Scholar] [CrossRef]
- Nuarsa, I.W.; Nishio, F.; Hongo, C.; Mahardika, I.G. Using variance analysis of multitemporal MODIS images for rice field mapping in Bali Province, Indonesia. Int. J. Remote Sens. 2012, 33, 5402–5417. [Google Scholar] [CrossRef]
- Zhang, M.; Lin, H. Object-based rice mapping using time-series and phenological data. Adv. Space Res. 2019, 63, 190–202. [Google Scholar] [CrossRef]
- Dong, J.; Xiao, X.; Kou, W.; Qin, Y.; Zhang, G.; Li, L.; Jin, C.; Zhou, Y.; Wang, J.; Biradar, C.; et al. Tracking the dynamics of paddy rice planting area in 1986–2010 through time series Landsat images and phenology-based algorithms. Remote Sens. Environ. 2015, 160, 99–113. [Google Scholar] [CrossRef]
- Xiao, X.; Boles, S.; Frolking, S.; Li, C.; Babu, J.Y.; Salas, W.; Moore, B., III. Mapping paddy rice agriculture in South and Southeast Asia using multi-temporal MODIS images. Remote Sens. Environ. 2006, 100, 95–113. [Google Scholar] [CrossRef]
- Zhang, G.; Xiao, X.; Biradar, C.M.; Dong, J.; Qin, Y.; Menarguez, M.A.; Zhou, Y.; Zhang, Y.; Jin, C.; Wang, J.; et al. Spatiotemporal patterns of paddy rice croplands in China and India from 2000 to 2015. Sci. Total Environ. 2017, 579, 82–92. [Google Scholar] [CrossRef]
- Zhao, R.; Li, Y.; Chen, J.; Ma, M.; Fan, L.; Lu, W. Mapping a paddy rice area in a cloudy and rainy region using spatiotemporal data fusion and a phenology-based algorithm. Remote Sens. 2021, 13, 4400. [Google Scholar] [CrossRef]
- Zhou, Y.; Xiao, X.; Qin, Y.; Dong, J.; Zhang, G.; Kou, W.; Jin, C.; Wang, J.; Li, X. Mapping paddy rice planting area in rice-wetland coexistent areas through analysis of Landsat 8 OLI and MODIS images. Int. J. Appl. Earth Obs. Geoinf. 2016, 46, 1–12. [Google Scholar] [CrossRef] [PubMed]
- Qin, Y.; Xiao, X.; Dong, J.; Zhou, Y.; Zhu, Z.; Zhang, G.; Du, G.; Jin, C.; Kou, W.; Wang, J.; et al. Mapping paddy rice planting area in cold temperate climate region through analysis of time series Landsat 8 (OLI), Landsat 7 (ETM+) and MODIS imagery. ISPRS J. Photogramm. Remote Sens. 2015, 105, 220–233. [Google Scholar] [CrossRef] [PubMed]
- Xiao, X.; Boles, S.; Liu, J.; Zhuang, D.; Frolking, S.; Li, C.; Salas, W.; Moore, B., III. Mapping paddy rice agriculture in southern China using multi-temporal MODIS images. Remote Sens. Environ. 2005, 95, 480–492. [Google Scholar] [CrossRef]
- Biradar, C.M.; Xiao, X. Quantifying the area and spatial distribution of double- and triple-cropping croplands in India with multi-temporal MODIS imagery in 2005. Int. J. Remote Sens. 2011, 32, 367–386. [Google Scholar] [CrossRef]
- Zhu, L.; Liu, X.; Wu, L.; Liu, M.; Lin, Y.; Meng, Y.; Ye, L.; Zhang, Q.; Li, Y. Detection of paddy rice cropping systems in southern China with time series Landsat images and phenology-based algorithms. GIScience Remote Sens. 2021, 58, 733–755. [Google Scholar] [CrossRef]
- Liu, S.; Chen, Y.; Ma, Y.; Kong, X.; Zhang, X.; Zhang, D. Mapping ratoon rice planting area in central China using Sentinel-2 time stacks and the phenology-based algorithm. Remote Sens. 2020, 12, 3400. [Google Scholar] [CrossRef]
- Pan, B.; Zheng, Y.; Shen, R.; Ye, T.; Zhao, W.; Dong, J.; Ma, H.; Yuan, W. High resolution distribution dataset of double-season paddy rice in China. Remote Sens. 2021, 13, 4609. [Google Scholar] [CrossRef]
- Zhu, X.; Gao, F.; Liu, D.; Chen, J. A modified neighborhood similar pixel interpolator approach for removing thick clouds in landsat images. IEEE Geosci. Remote Sens. Lett. 2012, 9, 521–525. [Google Scholar] [CrossRef]
- Zhu, X.; Helmer, E.H.; Gao, F.; Liu, D.; Chen, J.; Lefsky, M.A. A flexible spatiotemporal method for fusing satellite images with different resolutions. Remote Sens. Environ. 2016, 172, 165–177. [Google Scholar] [CrossRef]
- Xu, F.; Xiong, H.; Zhang, L.; Zhu, Y.; Jiang, P.; Guo, X.; Liu, M. Progress in research of yield formation of ratooning rice and its high-yielding key regulation technologies. Sci. Agric. Sin. 2015, 48, 1702–1717. [Google Scholar] [CrossRef]
- Deng, S.; Yao, X. Production status and suggestion for development of mid-season and ratoon rice in Yongchuan District, Chongqing. South China Agric. 2020, 14, 46–48. [Google Scholar] [CrossRef]
- Mandal, D.; Kumar, V.; Bhattacharya, A.; Rao, Y.S.; Siqueira, P.; Bera, S. Sen4Rice: A Processing Chain for Differentiating Early and Late Transplanted Rice Using Time-Series Sentinel-1 SAR Data with Google Earth Engine. IEEE Geosci. Remote Sens. Lett. 2018, 15, 1947–1951. [Google Scholar] [CrossRef]
- Song, K.; Zhang, G.; Xu, H.; Ma, J. A review of research on influencing factors and sustainability of ratoon rice cultivation in China. Acta Pedol. Sin. 2020, 57, 1365–1377. [Google Scholar] [CrossRef]
- Karra, K.; Kontgis, C.; Statman-Weil, Z.; Mazzariello, J.C.; Mathis, M.; Brumby, S.P. Global land use/land cover with Sentinel 2 and deep learning. In Proceedings of the 2021 IEEE International Geoscience and Remote Sensing Symposium IGARSS, Brussels, Belgium, 11–16 July 2021; pp. 4704–4707. [Google Scholar]
- Wang, Q.; Wang, L.; Zhu, X.; Ge, Y.; Tong, X.; Atkinson, P.M. Remote sensing image gap filling based on spatial-spectral random forests. Sci. Remote Sens. 2022, 5, 100048. [Google Scholar] [CrossRef]
- Savitzky, A.; Golay, M.J.E. Smoothing and differentiation of data by simplified least squares procedures. Anal. Chem. 1964, 36, 1627–1639. [Google Scholar] [CrossRef]
- Zhao, R.; Li, Y.; Ma, M. Mapping Paddy Rice with Satellite Remote Sensing: A Review. Sustainability 2021, 13, 503. [Google Scholar] [CrossRef]
- Dong, J.; Xiao, X.; Menarguez, M.A.; Zhang, G.; Qin, Y.; Thau, D.; Biradar, C.; Moore, B., III. Mapping paddy rice planting area in northeastern Asia with Landsat 8 images, phenology-based algorithm and Google Earth Engine. Remote Sens. Environ. 2016, 185, 142–154. [Google Scholar] [CrossRef]
- Belgiu, M.; Csillik, O. Sentinel-2 cropland mapping using pixel-based and object-based time-weighted dynamic time warping analysis. Remote Sens. Environ. 2018, 204, 509–523. [Google Scholar] [CrossRef]
- Zhang, L.; Xu, H.; Li, L.; Chen, Y.; Zhang, H.; Tang, Q.; Tang, J. Comparative study on CH4 emission from ratoon rice and double-cropping. Sci. Agric. Sin. 2019, 52, 2101–2113. [Google Scholar] [CrossRef]
- Ayanlade, A.; Radeny, M.; Morton, J.F. Comparing smallholder farmers’ perception of climate change with meteorological data: A case study from southwestern Nigeria. Weather Clim. Extrem. 2017, 15, 24–33. [Google Scholar] [CrossRef]
- Wood, S.A.; Jina, A.S.; Jain, M.; Kristjanson, P.; DeFries, R.S. Smallholder farmer cropping decisions related to climate variability across multiple regions. Glob. Environ. Change 2014, 25, 163–172. [Google Scholar] [CrossRef]
- Zhang, G.; Xiao, X.; Dong, J.; Kou, W.; Jin, C.; Qin, Y.; Zhou, Y.; Wang, J.; Menarguez, M.A.; Biradar, C. Mapping paddy rice planting areas through time series analysis of MODIS land surface temperature and vegetation index data. ISPRS J. Photogramm. Remote Sens. 2015, 106, 157–171. [Google Scholar] [CrossRef] [PubMed]


Disclaimer/Publisher’s Note: The statements, opinions and data contained in all publications are solely those of the individual author(s) and contributor(s) and not of MDPI and/or the editor(s). MDPI and/or the editor(s) disclaim responsibility for any injury to people or property resulting from any ideas, methods, instructions or products referred to in the content. |
© 2023 by the authors. Licensee MDPI, Basel, Switzerland. This article is an open access article distributed under the terms and conditions of the Creative Commons Attribution (CC BY) license (https://creativecommons.org/licenses/by/4.0/).